Abstract
Heat wave episodes are becoming more frequent and severe worldwide, especially in areas such as the Mediterranean region. This study is aimed at assessing the impact of heat waves in an urban environment and the ways areas of urban green infrastructure (UGI) can play key roles in moderating the impacts of these high-temperature events. We analyzed land surface temperature (LST) and normalized difference vegetation index (NDVI) data retrieved from Landsat 8/9 satellite images. These data were recorded during heat wave episodes from 2017 to 2022 in a representative Mediterranean medium-sized compact city. We carried out a correlation analysis between LST and NDVI per area type and as individual units to assess how UGI elements can contribute to the cooling of the urban matrix during heat wave episodes. Those small green spaces distributed throughout the city, defined as “Other” areas, showed stronger negative correlation. These spaces are particularly relevant for Mediterranean cities, where highly limited space in city centers hinders the possibility of having larger-surface UGI elements. The study highlights the need for further research into the composition of those small public green spaces to understand how their components enhance the city’s cooling capacity given the climate conditions and water scarcity in the Mediterranean region.
1. Introduction
Climate change has increased the frequency and intensity of extreme environmental events in urban and rural areas around the globe [1,2]. These extreme episodes have included heat waves, floods, droughts, and cold spells, among other phenomena, at a wider spatial scale [3]. In particular, heat waves in urban areas worldwide have experienced a significant increase in rate of occurrence and magnitude over the last 20 years of the 20th century and during the first decade of the 21st [4,5].
The impacts of heat waves in cities have been widely evidenced by their negative effects in several ways, including health impairment, air quality reduction, higher energy demands, and social implications [6]. A heat wave is commonly described as an extended period of unusually hot weather that lasts for multiple consecutive days and nights and “indices based on local climatological conditions are used to objectively characterize and declare a heat wave” [7]. These extreme events have direct effects on inhabitants’ health by causing respiratory problems, exacerbating chronic diseases, or increasing heat-related illnesses, mortality, and morbidity [8]. Hot spells are also associated with a reduction in urban air quality, triggering higher pollutant concentrations and consequently leading to health issues [9,10,11]. In addition, events of extreme high temperatures have structural and economic implications in cities since such episodes can lead to power supply problems, higher energy demands in buildings, as well as increases in cooling costs, while the pedestrian thermal comfort can be harmed at the same time by these consumption requirements [12]. The social impacts derived from heat waves are also a significant matter of concern since these episodes make it difficult for people to spend time outdoors, something which directly affects social interactions and citizen welfare [13,14,15].
The latest 2022 data presented by the Copernicus Climate Change Service highlights the critical impact of these extreme high-temperature episodes throughout the European region, which suffered the hottest summer on record in 2022, (air temperature 0.4 °C above the 2021 average for the months of June, July, and August), with the western Mediterranean (the Iberian Peninsula and parts of France and Italy) being the most affected [16]. In addition, the Intergovernmental Panel on Climate Change (IPCC), operating with high level of reliability, has warned about the urgent need for cities to adapt to these heat waves, which have been primarily increased by human-induced climate change and are projected to become more intense and longer-lasting over the short and mid-term throughout the entire continent [17].
Such scenarios of high-temperature episodes will impact European cities across the whole region in the near future, with more significant impacts felt in the distant future [18]. Central Europe is projected to see double the occurrence of warm spells for the period 2020–2049 [19]. The magnitude of heat waves is also expected to increase more for southern-central European cities, while the largest increase in the number of heat wave days is projected to occur in Mediterranean cities [20,21]. In fact, the forecast is critical for high-temperature climate events along the Mediterranean region in the short term, where the temperature is expected to increase by 2.2 °C by 2040 [22]. This forecast has been specifically made for the Iberian Peninsula, with the present-day conditions acting as the reference point. For the mid-term (2046–2065), the estimation foresees heat wave recurrences and durations to increase between 2 and 4 times, whilst for the long term (2081–2100) the increase is projected to range from 4 to 40 times more [23].
We carried out extensive heat wave monitoring in cities through the analysis of the land surface temperature (LST), which is a suitable indicator of temporal and spatial scales [24,25]. Apart from field measurements, satellite images were the main source of information used to perform this analysis, and Landsat was increasingly used for thermal urban environment assessments due to the precision it gives in terms of resolution [26]. Nevertheless, some pitfalls suggesting that “warm surfaces” result in “high air temperatures” are present in the literature, especially for urban heat island-related studies [27]. In this study, we considered that LST may act as a good proxy for air temperature at a city scale using the spatial resolution of TIR remote sensing. Although LST and air temperature can present different magnitudes, the relationship between these variables suggests statistical significance and aligned spatial distribution patterns, meaning that areas of high LST can be co-located with areas of high air temperature [28,29,30,31,32].
The LST value retrieval from satellite imagery can highlight that the major contribution to lessening and moderating the impact of heat waves is mainly associated with urban green infrastructure (UGI) assets, such as urban forests, parks, water bodies, leisure spaces with impervious surfaces, or smaller green spaces (i.e., green roofs or pocket parks) [33,34,35,36,37]. The assessment of those UGI areas in terms of greenness or any other type of land cover can be efficiently carried out with the normalized difference vegetation index (NDVI). This is largely used in vegetation mapping and is expected to be correlated with LST values [38,39,40,41]. A negative correlation between NDVI and LST is expected to vary from greener areas (high NDVI values), which potentially strengthen the cooling capacity of cities during heat waves, to those built-up areas with less capacity to buffer the impact of warm spells [26,42,43,44].
The thermal effects of green infrastructure and the correlation between LST and NDVI values at various spatial scales are generally assessed from an urban to a regional, national, or continental level. In a systematic review carried out by Bartesaghi et al. (2018), the researchers underline how relationships between LST and vegetation coverage are traditionally assessed in terms of large areas or whole cities and regions. This research highlights the type and composition of those specific UGI areas most effective for outdoor thermal comfort during high-temperature episodes at local levels [45]. Nevertheless, there are studies which give insights at a finer scale within urban environments into LST assessment, using as the extent unit local climate zones. These are defined as “regions of uniform surface cover, structure, material, and human activity that span hundreds of meters to several kilometers in horizontal scale” [46]. Local climate zones are considered as predefined static elements assessed as individual units during high-temperature episodes [47,48]. Thus, there would still be a challenge in managing specific UGI elements as single units in such a way that they can fulfill their purpose of being especially effective in mitigating heat stress at a microscale for sustainable and resilient urbanization [49,50].
In view of the above and given that the climate projections point to the Mediterranean region as being a hot spot for heat waves [51], it becomes more crucial to analyze the role of urban green spaces as buffers against such extreme episodes in the cities of this area [52]. This study, consequently, is aimed at analyzing and assessing how UGI areas, both per type and as individual units, performed during heat wave episodes which occurred in the last five years in a typical Mediterranean compact city via an analysis of LST and NDVI value variation with time and their correlation. Finally, those types of UGI areas with the best potential capacity to buffer the impact of warm spells within the urban matrix are identified.
2. Materials and Methods
2.1. Study Area
For this research, we used as a case study a representative medium-sized compact city (Granada) of the Mediterranean region which contains a defined UGI [53]. Granada is located in the southeast of the Iberian Peninsula (37.179937, −3.603489; 680 m above sea level), and it has a total area of 88.9 km2 with a population density of 2657.93 inhabitants/Km2 (Figure 1). It presents a Mediterranean–continental climate, with an average annual temperature of 14.0 °C for the period of 1981–2018 [54], and is one of the Spanish cities most impacted by heat waves since 1975, with the highest rate of recurrence of heat waves since 2011 [55,56,57].
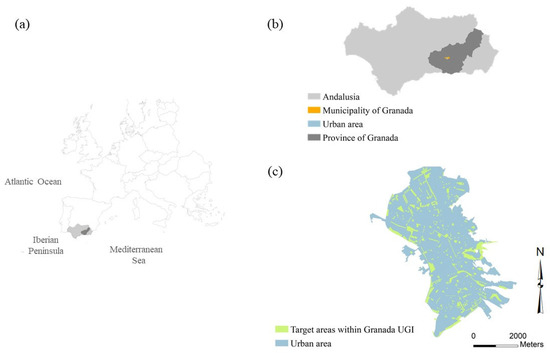
Figure 1.
Study area location (a) Iberian Peninsula; (b) Municipality of Granada within Andalusia region; (c) Granada urban area and target areas within the urban green infrastructure (UGI).
The target green areas are located in the urban matrix and belong to the proposed urban green infrastructure (UGI) model of Delgado-Capel and Cariñanos [53]. This UGI proposal defines four types of green areas based on their extension, location, and capacity to provide regulating ecosystem services. “Core” areas are defined as large-sized patches with a high capacity to provide regulating, provisioning, and cultural ecosystem services, such as natural parks or urban forests. “Node” areas are defined as medium-sized patches, such as small forests, dense shrubs or grasslands, parks, gardens, or squares, with medium and high capacities to provide ecosystem services. “Link” areas are those with linear spatial distributions which connect core and node areas with each other. “Other” areas correspond to those smaller public urban green spaces (scattered shrubs with or without grasslands, continuous grasslands, isolated groups of trees, or pocket parks combining vegetated with non-vegetated permeable surfaces), heterogeneously distributed, which possess both medium and high capacities to provide cultural and, particularly, regulating ecosystem services, such as local climate regulation, air quality improvement, and pollination, flood, and erosion prevention.
The pre-existing UGI database has been updated with the latest geospatial vector data provided by the national land cover system (Spanish Land Use and Land Cover Information System—LCIS) for 2016 at a 1:10,000 scale. This was released in 2021 [58] with the ArcGIS 10.6 software. In total, 396 urban green spaces have been identified as target areas (Figure 2). New data have been added using Overlay tool. The Map Algebra tool has been used to estimate LST and NDVI values, and the Zonal Statistics tool has been used to export LST and NDVI data to the appropriate format for further statistical analysis.
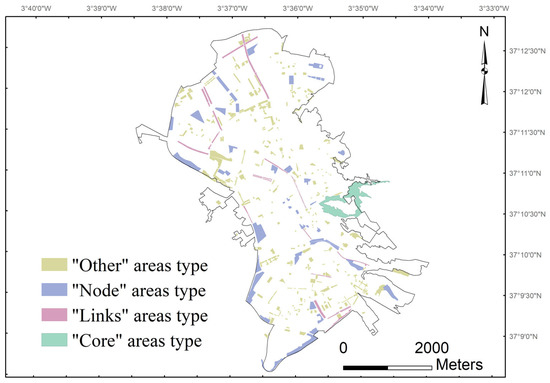
Figure 2.
Target areas per type in Granada’s urban green infrastructure (UGI): Percentage of the total UGI area: “Other” areas, 38.59%; “Node” areas, 36.84%; “Link” areas, 10.74%; “Core” areas, 13.83%.
2.2. Heat Waves Indentification
The definition of “heat wave” used in this study is the one given by the Spanish Agency of Meteorology (AEMET). This defines a heat wave as an episode, lasting 3 consecutive days or more, in which at least 10% of meteorological stations registered maximum temperatures above the 95th percentile of their series of maximum daily temperatures for the months of July and August from the period spanning 1971 to 2000 [59].
2.3. Estimation of Land Surface Temperature (LST) and Normalized Difference Vegetation Index (NDVI)
We carried out NDVI and LST retrieval from Landsat 8 and 9 OLI/TIRS satellite images derived from the U.S. Geological Survey [60]. The suitability of Landsat images for use in this study was mainly related to their temporal resolution (every 16 days), spatial resolution, and the probability of obtaining minimal cloud cover [60,61,62] (Table 1). It should be noted that data were only available for daylight hours.

Table 1.
Spectral bands used for NDVI and LST retrieval from Landsat 8 and 9 (OLI/TIRS) images.
NDVI was calculated from the Landsat 8–9 OLI sensor as a ratio between the red band (R) and near infrared band (NIR) [63] (Equation (1)).
LST was calculated from TIRS band data by using the following algorithm [64,65,66,67,68,69] (Equation (2)):
where
BT = Brightness Temperature,
λ = Wavelength of emitted radiance (Band 10), 10.8 µm.
ρ = h × c/σ = 1.4388 × 10⁻² mK (h = Planck’s constant = 6.626 × 10⁻³⁴ Js, c = velocity of light = 2.998 × 10⁸ m/s and σ = Boltzmann constant = 1.38 × 10⁻²³ J/K).
ελ = land surface emissivity.
In order to retrieve the LST values per the algorithm presented in Equation (2), the first step was to calculate the brightness temperature (BT), adjusted to degrees Celsius, by converting the top of the atmosphere spectral radiance [70] (Equation (3)):
where
K1, K2: Thermal constants from the Landsat 8–9 file metadata.
Lλ: Spectral radiance, calculated from the Band 10 image re-scaled by its specific multiplicative, additive, and correction factors (Watts/[m2 × srad × μm]).
Second, the land surface emissivity (ελ) was determined by previously calculating the proportion of vegetation (Pv) from NDVI values [66] (Equation (4)):
Finally, land surface emissivity (ελ) was retrieved by means of the NDVI threshold method [71], which has been proven to be the most accurate and to have the best performance across methods of LST retrieval from all Landsat missions [72] (Equation (5)).
The NDVI values range from −1.0 to +1.0. While bare soil surfaces, water bodies, or snow usually show values below 0.1; areas with sparse vegetation may present values between approximately 0.2 and 0.5; and values above 0.6 mainly correspond to dense vegetation [73]. In Equation (5), εsλ is the soil emissivity (0.966) and εvλ is the vegetation emissivity (0.973); NDVIs is set to 0.2 and NDVIv is set to 0.5 to cope with global conditions; and C includes natural surface roughness and internal reflections [65,67]. Land surface emissivity (ελ) takes the value of soil emissivity (εsλ, 0.966) when the NDVI pixel score is lower than 0.2 (NDVIs), whilst ελ takes the value of vegetation emissivity (εvλ, 0.973) when the NDVI pixel score is higher than 0.5 (NDVIv). When the NDVI pixel score is between 0.2 and 0.5, the ελ values depend on the proportion of vegetation (Pv) and C, which is defined by the expression εvλ Pv + εsλ(1 − Pv) + C.
In terms of validation, the accuracy of the estimations given by Landsat satellite images for calculating both NDVI and LST (using operational land imager (OLI) Bands 4 (red) and 5 (near-infrared) for NDVI and using thermal infrared sensor (TIRS) Band 10 for the LST input) showed no errors with representative magnitudes and were reasonable for the targeted areas [65,74]. In addition, calculations with wavelength ranges and different spectral responses for emissivity of vegetation, water, and soil confirmed that the proposed method was effective for the retrieval of LST from Landsat 8 and 9 [75,76].
2.4. Statistical Analysis
We analyzed LST and NDVI data with the MATLAB R2020b software. The mean average, maximum, and minimum values were calculated for each heat wave episode and for each type of UGI area. Since there was only one record for core area type within the urban boundary, it was excluded from the calculations. Therefore, from the total of 397 target areas under considerations, statistical analysis was carried out against 396 of them (Node, Link and Other types).
We assessed the sample distribution using the Kolmogorov–Smirnov test for both variables, LST and NDVI, in all episodes and per event as well (Appendix A, Table A1). For all cases, the test of normality pointed to a non-parametric distribution. Accordingly, we calculated the Spearman coefficient correlation (p < 0.05) between LST and NDVI retrieved values in all episodes, for separated events, and for each type of UGI area (excluding the Core type since there was only one record within the urban boundary).
3. Results
3.1. Retrieved Information for Heat Wave Episodes
Based on the heat wave definition adopted by the Spanish Agency of Meteorology (AEMET) and the historical records available [57], Table 2 shows the heat waves registered in Granada since 2017, when the proposed UGI by Delgado-Capel and Cariñanos was originally mapped [53]. The shortest episode was HW #3, which lasted for only 3 days, while the longest was HW #12, lasting almost 3 weeks (18 days). The remaining recorded episodes lasted between 5 and 9 days.
Table 2.
Heat Wave (HW) episodes in the city of Granada for the period 2017–2022.
On this basis, scenes were collected from Landsat 8–9. From the 12 episodes registered, 9 scenes were available without cloud cover above the urban matrix and with the same acquisition date (or near enough) as when each heat wave was registered by AEMET since 2017. All data were obtained during daylight hours, meaning that calculations from nighttime hours were not included in this study (Table 3).
Table 3.
Landsat 8 and 9 (OLI/TIRS) scenes collected since 2017 from USGS. Worldwide Reference System (WRS): path 200/201, row 034.
3.2. Land Surface Temperature (LST) Analysis
The results from the LST estimation (Equation (2)) showed values for the whole urban area between 48.86 °C as the maximum temperature and 24.80 °C as the minimum temperature. The warmest episode was the first to occur in June 2020 (HW #8), whilst the event with the lowest LST values was recorded one year before, in July 2019 (HW #7). The value range came from the LST estimation for the whole urban area, meaning that data retrieval covered not only the target areas but also the entire extension of the urban fabric, allowing for a visual pre-assessment of the whole city (Figure 3).
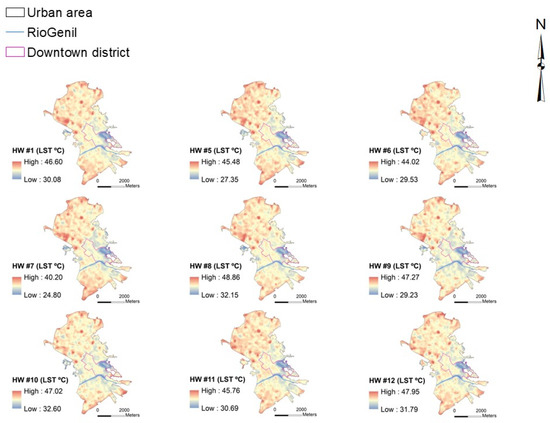
Figure 3.
Estimated Land Surface Temperature (LST) over the urban area of Granada. Data acquired on dates within heat wave episodes which occurred from 2017 to 2022.
Figure 4 shows LST values calculated over the targeted UGI areas in Granada. Averages of the mean, maximum, and minimum LST values were calculated for all the areas in each heat wave episode. LST estimation referred to HW #7 as the least extreme, with averages from 32.03 °C to 32.65 °C over the target UGI areas. The first warm spell event registered in 2020 (HW #8) was the most impactful one from the whole period under consideration, with temperature averages between 40.55 °C and 41.23 °C. The second half of the period under consideration (years 2020, 2021, and 2022) showed slightly higher LST values than the first episodes for years 2017, 2018, and 2019 (Figure 4).
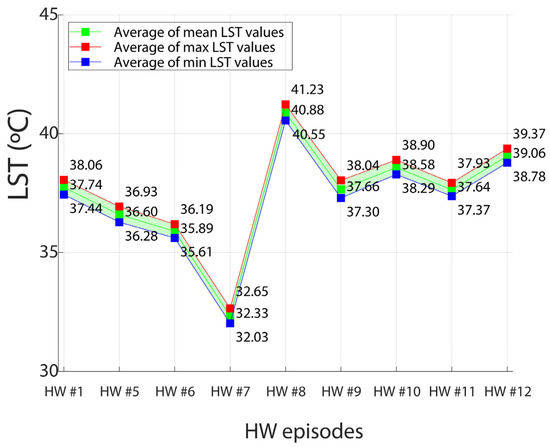
Figure 4.
Averages on mean, maximum and minimum Land Surface Temperature (LST) values over the target areas of Granada´s UGI. Data acquired on dates within heat wave episodes occurred from 2017 to 2022.
The results of LST estimation per UGI area type showed higher average values for Link-type areas. These were slightly above the values for Node-type areas. The lowest LST average values were registered for those UGI areas defined as Other. Variations in LST values over time responded to the same trend for all area types under consideration. From all the episodes, the event with less intensity occurred in July 2019 (HW #7) for all area types, and the most severe one took place in July 2020 (HW #8) (Figure 5a). By looking at the LST estimation per area type for all episodes, the minimum and mean averages presented the lowest values in Node areas (36.96 and 37.95, respectively). The highest records of mean and maximum temperature average (38.03 °C and 38.94 °C) were registered for Link-type areas. Other area types showed the highest average of minimum temperatures (37.46 °C), but also showed the lowest average on maximum temperatures (37.81 °C), grouping all the events (Figure 5b). Appendix B (Figure A1) shows same averages from NDVI values, which do not differ from one type of area to another, and it can be observed that they are not statistically dissimilar.
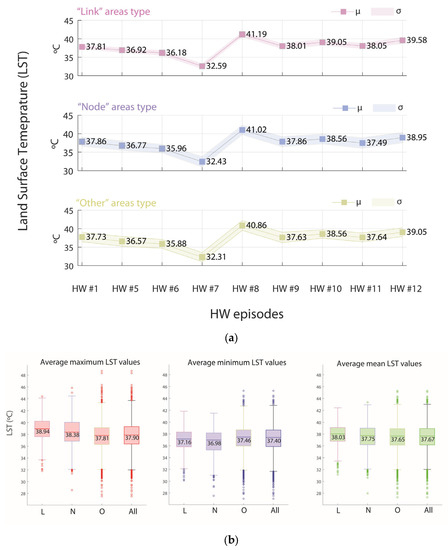
Figure 5.
(a). LST mean value per episode and area type. (b). LST mean value per are type in all periods. Whiskers determine the extent of the data inliers. Circles represent outliers.
3.3. Statistic Correlation of NDVI and LST Values
Figure 6 presents the results of the statistical analysis performed on the nine-episode dataset, one per heat wave event with available data. The Spearman correlation coefficient between NDVI and LST estimation is shown as statistically significant for all periods (p < 0.01). Negative correlation coefficients are presented for all periods, with HW #1 (ρ = −0.29), HW #5 (ρ = −0.29), HW #7 (ρ = −0.31) and HW #8 (ρ = −0.26) having the strongest correlations. Compared to those, a moderate negative correlation is observed for episodes HW #6 (ρ = −0.24), HW #9 (ρ = −0.20), HW #11 (ρ = −0.23), and HW #12 (ρ = −0.23), while the weakest correlation appears for event HW #10 (ρ = −0.15). The Spearman correlation analysis between NDVI and LST values per area type for all episodes shows the most negative correlation for the Other area type (ρ = −0.27). From the same assessment, a weaker correlation is observed for Link (ρ = −0.04) and Node (ρ = −0.06) area types (Figure 6).
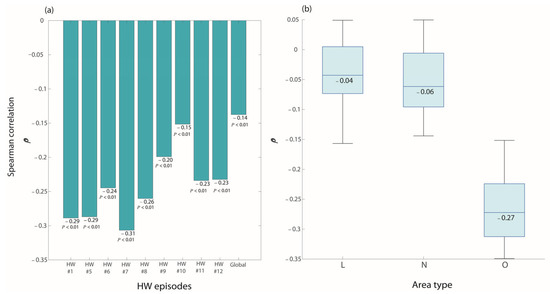
Figure 6.
Spearman correlation coefficient between NDVI and LST for all targeted areas per HW episode (a) and per area type for all episodes (b).
To perform a more granular assessment, we calculated correlations for each type of area per heat wave episode. For all events, the most negative correlation refers to the Other area type which was stronger during warm spells HW #1, HW #5, and HW #7, and slightly less negative for events HW #6, HW #8, HW #11, and HW #12. A weaker negative correlation, compared to the one associated with the Other area type, can be observed for Node areas during the first episodes under consideration (years 2017, 2018, and 2019). However, NDVI and LST are positively correlated for this UGI area type in the event HW #11. The Spearman coefficient does not show either negative correlation for Link areas for the last 4 episodes registered (Figure 7).
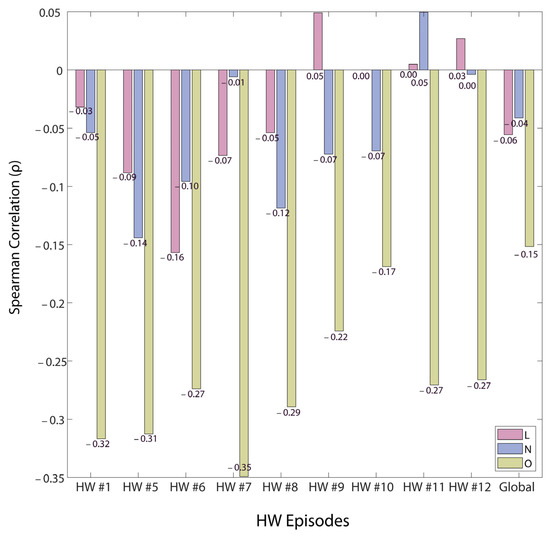
Figure 7.
Spearman correlation (ρ) between NDVI and LST per UGI are type for each heat wave (HW) episode.
4. Discussion
Heat wave episodes have significantly impacted the Mediterranean region over the last 3 years, and the higher recurrence of these extreme weather events could lead to an increase in pollutant concentration and heat-related mortality and morbidity, among other impacts [77,78,79]. In this study, we conducted an assessment of the LST values in the urban core of a typical Mediterranean medium-sized compact city during heat wave episodes between the years 2017 and 2022. Rather than covering the entire urban area as a whole as in similar research, the analysis we carried out focused on the UGI spaces as individual units and area types that, presumably, could provide a better picture of the buffering capacity against high temperatures during hot spell episodes.
The LST values in our study area for the considered period are consistent with similar research carried out in Granada over the 1985–2020 period in which mean, maximum, and minimum LST values registered a steady increase of 2.2 °C [80]. The surface temperature averages over the target areas match the generalized analysis for the entire urban area over time, with episode HW #7 being the least hot and episode HW #2 registering the highest LST values. The evolution of LST per area type reflects the same trend, with the Other area type registering the lowest mean records per period (Figure 5a) The lowest average of minimum LST values is registered for the Node area type, which would be expected given its capacity to provide regulating ecosystem services compared to the categories of Link and Other. The highest averages are registered for the Link area type, which would be expected given the variety of structural elements different from green areas along its characteristic linear distribution, such as asphalt, sidewalks, and other grey areas devoid of vegetation along an avenue or walkway. Unexpectedly, the Other area type, which corresponds to these smaller green spaces distributed across all urban matrices, shows the lowest average of the maximum LST values. However, the LST mean value per are type in all periods is not statistically dissimilar (Figure 5b). Whilst the NDVI average values do not significantly differ between areas type, we see an expectedly high dispersion for type Other, which is probably due to the diversity of non-vegetated elements composing these spaces (Appendix B, Figure A1).
The statistical analysis of all the target areas shows a negative correlation between NDVI and LST values in each of the heat wave events recorded from 2017 to 2022. The Spearman coefficient for all areas per episode is statistically significant (p < 0.01), presenting higher correlations for the first 5 episodes, until the warmest event in 2020, and getting weaker for the last 4 episodes (Figure 6a). This variation over time could be potentially related to an increase in the heterogeneity of the areas surface under investigation [81]. The results of the same correlation analysis between LST and NDVI for all episodes, combined by area type, show higher negative correlations for the Other area type than for the Node and Link areas (Figure 6b). An expectedly negative correlation is observed in the Node area type per episode, being moderate in all cases except for the last two episodes in 2022. No correlation exists for the Link area type in episodes HW #10 and HW #11 and NDVI and LST positively correlate for episodes HW #9 and HW #12 (Figure 7). This unexpected behavior is very prone to occur in all types of UGI areas in southern cities of the European region and this could be due to an increase in water stress or water soil scarcity during heat waves episodes, an occurrence which would reduce or even reverse the cooling effect of green spaces as a consequence of the evapotranspiration reduction [82].
The results for the Other area type [53] are consistent with the expected pattern of behavior, showing a negative correlation between LST and NDVI in all cases. In line with the observed global trend of recorded temperatures (Figure 4 and Figure 5a), the least hot episodes show a stronger correlation, and hence a better cooling performance (until HW #8), whilst the relationship between NDVI and LST weakens for the final events (from HW #9 onwards), which corresponds to the warmest spells (Figure 7). Whilst the stronger relationship between NDVI and LST is expected for those greener spaces, such as Node areas (based on their definition), the resulting correlation is negative for the Other areas type. These results point to this type of UGI area, which combines vegetated with non-vegetated permeable surfaces, as being capable of strengthening the city’s cooling capacity during heatwave episodes [83,84,85,86]. These areas correspond to small public green spaces distributed heterogeneously throughout the urban matrix and mainly comprise scattered shrubs, grasslands, a mix of medium- and low-height vegetation with scattered or isolated trees, and small parks with irrigation and diverse surface composition. The results suggest the potential suitability of these spaces for mitigating the effects of heat waves, not only due to their green components, but also due to the crossed interaction with other human-introduced permeable materials (such as pervious surfaces, sand, silt, or clay materials) [87,88], which could potentially enhance even more the cooling capacity in busy and space-limited urban areas [89,90]. It is worth highlighting the added value that the Other area type can provide Mediterranean medium-sized compact cities since, being distributed throughout the entire city, they act as rest areas and shelter locations in touristic and historic locations during heat wave episodes [91,92].
It should also be noted that the heterogeneity in LST values across the whole urban area highlights the need to address the current challenge of alleviating the impacts of heat waves through the use of sustainable measures. In this context, green planning presents as a key mechanism with which to enhance microclimate conditions. For example, in [93,94,95], role of green spaces, like that of the Other area type, is seen to ameliorate the impact of heat waves as much as larger and greener areas [96,97,98].
5. Conclusions
This study presents relevant information on how the small green spaces distributed throughout the city, defined as “Other” areas, would potentially help to ameliorate the effects of heat waves heat wave episodes in medium-sized compact cities of the Mediterranean region. The analysis per type of green space revealed that this area type registers the lowest LST average values. “Other” areas showed a stronger negative correlation in all heat wave episodes, indicating the superior cooling capacity of these green spaces against extreme temperatures during heat wave episodes. A stronger negative correlation was also found between NDVI and LST data for the Other area type per episode, which was consistent with their potential to strengthen the buffer capacity against the impacts of warm spells.
The potential buffer capacity observed in the Other area type during heat wave episodes stresses the need to identify the composition of those small public green spaces distributed heterogeneously throughout the urban matrix, and to understand how their components contribute to the city´s cooling capacity enhancement. This finding would be particularly relevant for Mediterranean cities, where highly limited space in city centers hinders the expansion of UGI areas or the creation of new ones to increase the cooling capacity during heat wave episodes. In regard to the composition of these areas, it would be relevant in further research to demonstrate how heat wave impacts could be reduced by the use of human-introduced permeable materials that do not require irrigation to facilitate evapotranspiration and which are easy to maintain given the climate conditions and water scarcity in the Mediterranean region.
Finally, this study promotes the idea that Mediterranean cities would find valuable benefits in green planning measures through the management of the “Other” area type; a more enhanced role of this area type would benefit cities during extreme high-temperature events. This is not only due to the discussed environmental benefits, but also because of their potential effects at the micro-scale level on citizen health, thermal comfort, social interactions, energy demands, micro-economy, and quality of life.
Author Contributions
Conceptualization: M.J.D.-C.; methodology: M.J.D.-C. and P.C.; software: M.J.D.-C. and M.E.-V.; validation: M.J.D.-C. and P.C.; formal analysis: M.J.D.-C., P.C. and M.E.-V.; investigation: M.J.D.-C. and P.C.; resources: M.J.D.-C.; data curation: M.J.D.-C. and M.E.-V.; writing—original draft preparation: M.J.D.-C.; writing—review and editing: M.J.D.-C. and P.C.; visualization: M.J.D.-C.; supervision: M.J.D.-C. and P.C. All authors have read and agreed to the published version of the manuscript.
Funding
This research was funded by Pre-competitive Research Projects University of Granada Own Plan, through the project PP2022.PP.34, Pre-GREENMITIGATION3.
Data Availability Statement
Publicly available datasets were analyzed in this study. This data can be found here: [https://www.usgs.gov/ (accessed on 30 November 2022); https://www.juntadeandalucia.es/ (accessed on 30 October 2022).
Acknowledgments
The authors would like to thank the Spanish National Geographic Institute, the Andalusian Environmental Information Network, Junta de Andalucía, and the U.S. Geological Survey for the spatial data and cartographic base provided for case of study.
Conflicts of Interest
The authors declare no conflict of interest.
Appendix A
Table A1.
Test of Normality for LST and NDVI Retrieved data.
Table A1.
Test of Normality for LST and NDVI Retrieved data.
| Tests of Normality | ||||
|---|---|---|---|---|
| Variable | HW Episode | Kolmogorov–Smirnov a | ||
| Statistic | df | Sig. | ||
| LST | All Episodes | 0.077 | 3564 | <0.001 |
| NDVI | All Episodes | 0.073 | 3564 | <0.001 |
| LST | 2017/1 | 0.072 | 396 | <0.001 |
| LST | 2018/5 | 0.051 | 396 | 0.015 |
| LST | 2019/6 | 0.049 | 396 | 0.023 |
| LST | 2019/7 | 0.06 | 396 | 0.002 |
| LST | 2020/8 | 0.058 | 396 | 0.003 |
| LST | 2020/9 | 0.066 | 396 | <0.001 |
| LST | 2021/10 | 0.058 | 396 | 0.003 |
| LST | 2022/11 | 0.059 | 396 | 0.002 |
| LST | 2022/12 | 0.065 | 396 | <0.001 |
| NDVI | 2017/1 | 0.092 | 396 | <0.001 |
| NDVI | 2018/5 | 0.09 | 396 | <0.001 |
| NDVI | 2019/6 | 0.078 | 396 | <0.001 |
| NDVI | 2019/7 | 0.103 | 396 | <0.001 |
| NDVI | 2020/8 | 0.099 | 396 | <0.001 |
| NDVI | 2020/9 | 0.094 | 396 | <0.001 |
| NDVI | 2021/10 | 0.079 | 396 | <0.001 |
| NDVI | 2022/11 | 0.058 | 396 | 0.003 |
| NDVI | 2022/12 | 0.057 | 396 | 0.003 |
a Lilliefors Significance Correction.
Appendix B

Figure A1.
NDVI Mean Value per Are Type in All Periods. Whiskers Determine the Extent of the Data Inliers. Circles Represent Outliers.
Figure A1.
NDVI Mean Value per Are Type in All Periods. Whiskers Determine the Extent of the Data Inliers. Circles Represent Outliers.

References
- Hughes, T.P.; Kerry, J.T.; Connolly, S.R.; Baird, A.H.; Eakin, C.M.; Heron, S.F.; Hoey, A.S.; Hoogenboom, M.O.; Jacobson, M.; Liu, G.; et al. Ecological memory modifies the cumulative impact of recurrent climate extremes. Nat. Clim. Chang. 2018, 9, 40–43. [Google Scholar] [CrossRef]
- Clarke, B.; Otto, F.; Stuart-Smith, R.; Harrington, L. Extreme weather impacts of climate change: An attribution perspective. Environ. Res. Clim. 2022, 1, 012001. [Google Scholar] [CrossRef]
- World Meteorological Organization, W. WMO Provisional State of the Global Climate 2022; WMO: Geneva, Switzerland, 2022. [Google Scholar]
- Almazroui, M.; Saeed, F.; Saeed, S.; Ismail, M.; Azhar Ehsan, M.; Nazrul Islam, M.; Adnan Abid, M.; Kamil, S.; Ur Rashid, I.; Nadeem, I. Projected Changes in Climate Extremes Using CMIP6 Simulations Over SREX Regions. Earth Syst. Environ. 2021, 5, 481–497. [Google Scholar] [CrossRef]
- Dosio Alessandro; Mentaschi Lorenzo; Fischer Erich Markus. Wyser Klaus Extreme heat waves under 1.5 °C and 2 °C global warming. Environ. Res. Lett. 2018, 13, 54006. [Google Scholar] [CrossRef]
- Santamouris, M. Recent progress on urban overheating and heat island research. Integrated assessment of the energy, environmental, vulnerability and health impact. Synergies with the global climate change. Energy Build. 2020, 207, 109482. [Google Scholar] [CrossRef]
- World Meteorological Organization. Available online: https://public.wmo.int/en (accessed on 20 February 2023).
- WHO Health Topics: Heatwaves. Available online: https://www.who.int/health-topics/heatwaves#tab=tab_2 (accessed on 9 February 2023).
- Hou, P.; Wu, S. Long-term Changes in Extreme Air Pollution Meteorology and the Implications for Air Quality. Sci. Rep. 2016, 6, 23792. [Google Scholar] [CrossRef]
- Kalisa, E.; Fadlallah, S.; Amani, M.; Nahayo, L.; Habiyaremye, G. Temperature and air pollution relationship during heatwaves in Birmingham, UK. Sustain. Cities Soc. 2018, 43, 111–120. [Google Scholar] [CrossRef]
- Theoharatos, G.; Pantavou, K.; Mavrakis, A.; Spanou, A.; Katavoutas, G.; Efstathiou, P.; Mpekas, P.; Asimakopoulos, D. Heat waves observed in 2007 in Athens, Greece: Synoptic conditions, bioclimatological assessment, air quality levels and health effects. Environ. Res. 2010, 110, 152–161. [Google Scholar] [CrossRef]
- Falasca, S.; Ciancio, V.; Salata, F.; Golasi, I.; Rosso, F.; Curci, G. High albedo materials to counteract heat waves in cities: An assessment of meteorology, buildings energy needs and pedestrian thermal comfort. Build. Environ. 2019, 163, 106242. [Google Scholar] [CrossRef]
- Gasper, R.; Blohm, A.; Ruth, M.; Romero Lankao, P.; Dodman, D. Social and economic impacts of climate change on the urban environment This review comes from a themed issue on Human Settlements and Industrial Systems Edited by. Curr. Opin. Environ. Sustain. 2011, 3, 150–157. [Google Scholar] [CrossRef]
- Salimi, M.; Al-Ghamdi, S.G. Climate change impacts on critical urban infrastructure and urban resiliency strategies for the Middle East. Sustain. Cities Soc. 2020, 54, 101948. [Google Scholar] [CrossRef]
- McGregor, G.R.; Felling, M.; Wolf, T.; Gosling, S. The Social Impacts of Heat Waves; McGregor, G.R., Felling, M., Wolf, T., Gosling, S., Eds.; Environment Agency: Bristol, UK, 2007; ISBN 9781844.
- Global Climate Highlights 2022|Copernicus. Available online: https://climate.copernicus.eu/global-climate-highlights-2022 (accessed on 12 January 2023).
- IPCC. Climate Change 2022: Impacts, Adaptation, and Vulnerability. Contribution of Working Group II to the Sixth Assessment Report of the Intergovernmental Panel on Climate Change; Pörtner, H.-O., Roberts, D., Tignor, M., Poloczanska, E., Mintenbeck, K., Alegría, A., Craig, M., Langsdorf, S., Löschke, S., Möller, V., et al., Eds.; Cambridge University Press: Cambridge, UK; New York, NY, USA, 2022; 3056p. [Google Scholar]
- Smid, M.; Russo, S.; Costa, A.C.; Granell, C.; Pebesma, E. Ranking European capitals by exposure to heat waves and cold waves. Urban Clim. 2019, 27, 388–402. [Google Scholar] [CrossRef]
- Lhotka, O.; Kyselý, J.; Farda, A. Climate change scenarios of heat waves in Central Europe and their uncertainties. Theor. Appl. Climatol. 2018, 131, 1043–1054. [Google Scholar] [CrossRef]
- Mishra, V.; Ganguly, A.R.; Nijssen, B.; Lettenmaier, D.P. Changes in observed climate extremes in global urban areas. Environ. Res. Lett. 2015, 10, 024005. [Google Scholar] [CrossRef]
- Guerreiro, S.B.; Dawson, R.J.; Kilsby, C.; Lewis, E.; Ford, A. Future heat-waves, droughts and floods in 571 European cities. Environ. Res. Lett. 2018, 13, 034009. [Google Scholar] [CrossRef]
- MedECC: Risks Associated to Climate and Environmental Changes in the Mediterranean Region. Available online: https://www.medecc.org/medecc-booklet-isk-associated-to-climate-and-environmental-changes-in-the-mediterranean-region/ (accessed on 3 December 2019).
- Pereira, S.C.; Marta-Almeida, M.; Carvalho, A.C.; Rocha, A. Heat wave and cold spell changes in Iberia for a future climate scenario. Int. J. Climatol. 2017, 37, 5192–5205. [Google Scholar] [CrossRef]
- Cotlier, G.I.; Jimenez, J.C. The Extreme Heat Wave over Western North America in 2021: An Assessment by Means of Land Surface Temperature. Remote Sens. 2022, 14, 561. [Google Scholar] [CrossRef]
- Wei, C.; Chen, W.; Lu, Y.; Blaschke, T.; Peng, J.; Xue, D. Synergies between urban heat island and urban heat wave effects in 9 global mega–regions from 2003 to 2020. Remote Sens. 2022, 14, 70. [Google Scholar] [CrossRef]
- Lemus-Canovas, M.; Martin-Vide, J.; Moreno-Garcia, M.C.; Lopez-Bustins, J.A. Estimating Barcelona’s metropolitan daytime hot and cold poles using Landsat-8 Land Surface Temperature. Sci. Total Environ. 2020, 699, 134307. [Google Scholar] [CrossRef]
- Parlow, E.; Bonafoni, S. Regarding Some Pitfalls in Urban Heat Island Studies Using Remote Sensing Technology. Remote Sens. 2021, 13, 3598. [Google Scholar] [CrossRef]
- Coutts, A.M.; Harris, R.J.; Phan, T.; Livesley, S.J.; Williams, N.S.G.; Tapper, N.J. Thermal infrared remote sensing of urban heat: Hotspots, vegetation, and an assessment of techniques for use in urban planning. Remote Sens. Environ. 2016, 186, 637–651. [Google Scholar] [CrossRef]
- Do Nascimento, A.C.L.; Galvani, E.; Gobo, J.P.A.; Wollmann, C.A. Comparison between Air Temperature and Land Surface Temperature for the City of São Paulo, Brazil. Atmosphere 2022, 13, 491. [Google Scholar] [CrossRef]
- Mutiibwa, D.; Strachan, S.; Albright, T. Land Surface Temperature and Surface Air Temperature in Complex Terrain. IEEE J. Sel. Top. Appl. Earth Obs. Remote Sens. 2015, 8, 4762–4774. [Google Scholar] [CrossRef]
- Benali, A.; Carvalho, A.C.; Nunes, J.P.; Carvalhais, N.; Santos, A. Estimating air surface temperature in Portugal using MODIS LST data. Remote Sens. Environ. 2012, 124, 108–121. [Google Scholar] [CrossRef]
- Zhang, P.; Bounoua, L.; Imhoff, M.L.; Wolfe, R.E.; Thome, K. Comparison of MODIS Land Surface Temperature and Air Temperature over the Continental USA Meteorological Stations. Can. J. Remote Sens. 2014, 40, 110–122. [Google Scholar]
- Gemitzi, A.; Dalampakis, P.; Falalakis, G. Detecting geothermal anomalies using Landsat 8 thermal infrared remotely sensed data. Int. J. Appl. Earth Obs. Geoinf. 2021, 96, 102283. [Google Scholar] [CrossRef]
- Wang, C.; Wang, Z.H.; Wang, C.; Myint, S.W. Environmental cooling provided by urban trees under extreme heat and cold waves in U.S. cities. Remote Sens. Environ. 2019, 227, 28–43. [Google Scholar] [CrossRef]
- Asadi, A.; Arefi, H.; Fathipoor, H. Simulation of green roofs and their potential mitigating effects on the urban heat island using an artificial neural network: A case study in Austin, Texas. Adv. Space Res. 2020, 66, 1846–1862. [Google Scholar] [CrossRef]
- Mutani, G.; Todeschi, V. The Effects of Green Roofs on Outdoor Thermal Comfort, Urban Heat Island Mitigation and Energy Savings. Atmosphere 2020, 11, 123. [Google Scholar] [CrossRef]
- McConnell, K.; Braneon, C.V.; Glenn, E.; Stamler, N.; Mallen, E.; Johnson, D.P.; Pandya, R.; Abramowitz, J.; Fernandez, G.; Rosenzweig, C. A quasi-experimental approach for evaluating the heat mitigation effects of green roofs in Chicago, Illinois. Sustain. Cities Soc. 2022, 76, 103376. [Google Scholar] [CrossRef]
- Marando, F.; Salvatori, E.; Sebastiani, A.; Fusaro, L.; Manes, F. Regulating Ecosystem Services and Green Infrastructure: Assessment of Urban Heat Island effect mitigation in the municipality of Rome, Italy. Ecol. Modell. 2019, 392, 92–102. [Google Scholar] [CrossRef]
- Ge, X.; Mauree, D.; Castello, R.; Scartezzini, J.-L. Spatio-Temporal Relationship between Land Cover and Land Surface Temperature in Urban Areas: A Case Study in Geneva and Paris. ISPRS Int. J. Geo-Inf. 2020, 9, 593. [Google Scholar] [CrossRef]
- Spadoni, G.L.; Cavalli, A.; Congedo, L.; Munafò, M. Analysis of Normalized Difference Vegetation Index (NDVI) multi-temporal series for the production of forest cartography. Remote Sens. Appl. Soc. Environ. 2020, 20, 100419. [Google Scholar] [CrossRef]
- Qureshi, A.M.; Rachid, A. Heat Vulnerability Index Mapping: A Case Study of a Medium-Sized City (Amiens). Climate 2022, 10, 113. [Google Scholar] [CrossRef]
- Vulova, S.; Kleinschmit, B. Thermal behavior and its seasonal and diurnal variability of urban green infrastructure in a mid-latitude city—Berlin. In Proceedings of the 2019 Joint Urban Remote Sensing Event (JURSE), Vannes, France, 22–24 May 2019; pp. 1–4. [Google Scholar]
- Liu, L.; Zhang, Y. Urban Heat Island Analysis Using the Landsat TM Data and ASTER Data: A Case Study in Hong Kong. Remote Sens. 2011, 3, 1535–1552. [Google Scholar] [CrossRef]
- Keeratikasikorn, C.; Bonafoni, S. Urban Heat Island Analysis over the Land Use Zoning Plan of Bangkok by Means of Landsat 8 Imagery. Remote Sens. 2018, 10, 440. [Google Scholar] [CrossRef]
- Bartesaghi Koc, C.; Osmond, P.; Peters, A. Evaluating the cooling effects of green infrastructure: A systematic review of methods, indicators and data sources. Sol. Energy 2018, 166, 486–508. [Google Scholar] [CrossRef]
- Stewart, I.D.; Oke, T.R. Local Climate Zones for Urban Temperature Studies. Bull. Am. Meteorol. Soc. 2012, 93, 1879–1900. [Google Scholar] [CrossRef]
- Unal Cilek, M.; Cilek, A. Analyses of land surface temperature (LST) variability among local climate zones (LCZs) comparing Landsat-8 and ENVI-met model data. Sustain. Cities Soc. 2021, 69, 102877. [Google Scholar] [CrossRef]
- Ferreira, L.S.; Duarte, D.H.S. Exploring the relationship between urban form, land surface temperature and vegetation indices in a subtropical megacity. Urban Clim. 2019, 27, 105–123. [Google Scholar] [CrossRef]
- Pauleit, S.; Ambrose-Oji, B.; Andersson, E.; Anton, B.; Buijs, A.; Haase, D.; Elands, B.; Hansen, R.; Kowarik, I.; Kronenberg, J.; et al. Advancing urban green infrastructure in Europe: Outcomes and reflections from the GREEN SURGE project. Urban For. Urban Green. 2019, 40, 4–16. [Google Scholar] [CrossRef]
- Zölch, T.; Maderspacher, J.; Wamsler, C.; Pauleit, S. Using green infrastructure for urban climate-proofing: An evaluation of heat mitigation measures at the micro-scale. Urban For. Urban Green. 2016, 20, 305–316. [Google Scholar] [CrossRef]
- Ali, E.; Cramer, W.; Carnicer, J.; Georgopoulou, E.; Hilmi, N.J.M.; Le Cozannet, G.; Lionello, P.; Pörtner, H.-O.; Roberts, D.C.; Tignor, M.; et al. SPM 2233 CCP4 Mediterranean Region to the Sixth Assessment Report of the Intergovernmental Panel on Climate Change. Cambridge University Press: Cambridge: UK; New York, NY, USA; pp. 2233–2272.
- Maggiotto, G.; Miani, A.; Rizzo, E.; Castellone, M.D.; Piscitelli, P. Heat waves and adaptation strategies in a mediterranean urban context. Environ. Res. 2021, 197, 111066. [Google Scholar] [CrossRef] [PubMed]
- Delgado-Capel, M.; Cariñanos, P. Towards a Standard Framework to Identify Green Infrastructure Key Elements in Dense Mediterranean Cities. Forests 2020, 11, 1246. [Google Scholar] [CrossRef]
- Chazarra Bernabé, A.; Lorenzo Mariño, B.; Rodríguez Ballesteros, C.; Botey Fullat, R. A Temperature Analysis in Spain for the Period 1961–2018. Vol: 1. Rejillas Mensuales de Temperatura; Ministry for Ecological Transition and Demographic Challenge, Ed.; Spanish Agency of Meteorology: Madrid, Spain, 2020. [Google Scholar]
- Serrano-Notivoli, R.; Lemus-Canovas, M.; Barrao, S.; Sarricolea, P.; Meseguer-Ruiz, O.; Tejedor, E. Heat and cold waves in mainland Spain: Origins, characteristics, and trends. Weather Clim. Extrem. 2022, 37, 100471. [Google Scholar] [CrossRef]
- Tomczyk, A.; Półrolniczak, M.; Bednorz, E. Circulation Conditions’ Effect on the Occurrence of Heat Waves in Western and Southwestern Europe. Atmosphere 2017, 8, 31. [Google Scholar] [CrossRef]
- Spanish Agency of Meteorology. List of Cities Affected by Heat Waves Since 1975; Agencia Estatal de Meteorología—AEMET; Gobierno de España: Madrid, Spain, 2022. [Google Scholar]
- Spanish National Geographic Institute. LCIS Cartography Base for Andalucía, 2016; Minister of Transport, Mobility, and Urban Agenda, Gobierno de España: Madrid, Spain, 2021. [Google Scholar]
- Spanish Agency of Meteorology. Olas de calor en España desde 1975—Agencia Estatal de Meteorología—AEMET; Gobierno de España: Madrid, Spain, 2022. [Google Scholar]
- USGS.gov|Science for a Changing World. Available online: https://www.usgs.gov/ (accessed on 30 November 2022).
- Grigoraș, G.; Urițescu, B. Land Use/Land Cover changes dynamics and their effects on Surface Urban Heat Island in Bucharest, Romania. Int. J. Appl. Earth Obs. Geoinf. 2019, 80, 115–126. [Google Scholar] [CrossRef]
- Naserikia, M.; Shamsabadi, E.A.; Rafieian, M.; Filho, W.L. The Urban Heat Island in an Urban Context: A Case Study of Mashhad, Iran. Int. J. Environ. Res. Public Health 2019, 16, 313. [Google Scholar] [CrossRef]
- Landsat Normalized Difference Vegetation Index|U.S. Geological Survey. Available online: https://www.usgs.gov/landsat-missions/landsat-normalized-difference-vegetation-index (accessed on 1 December 2022).
- Avdan, U.; Jovanovska, G. Algorithm for Automated Mapping of Land Surface Temperature Using LANDSAT 8 Satellite Data. J. Sens. 2016, 2016, 1480307. [Google Scholar] [CrossRef]
- Jiménez-Muñoz, J.C.; Sobrino, J.A.; Skokovi´c, S.; Mattar, C.; Cristóbal, J. Land Surface Temperature Retrieval Methods from Landsat-8 Thermal Infrared Sensor Data. IEEE Geosci. Remote Sens. Lett. 2014, 11, 1840–1843. [Google Scholar] [CrossRef]
- Sobrino, J.A.; Jiménez-Muñoz, J.C.; Paolini, L. Land surface temperature retrieval from LANDSAT TM 5. Remote Sens. Environ. 2004, 90, 434–440. [Google Scholar] [CrossRef]
- Wang, F.; Qin, Z.; Song, C.; Tu, L.; Karnieli, A.; Zhao, S. An Improved Mono-Window Algorithm for Land Surface Temperature Retrieval from Landsat 8 Thermal Infrared Sensor Data. Remote Sens. 2015, 7, 4268–4289. [Google Scholar] [CrossRef]
- Sheik Mujabar, P. Spatial-temporal variation of land surface temperature of Jubail Industrial City, Saudi Arabia due to seasonal effect by using Thermal Infrared Remote Sensor (TIRS) satellite data. J. Afr. Earth Sci. 2019, 155, 54–63. [Google Scholar] [CrossRef]
- Stathopoulou, M.; Cartalis, C. Daytime urban heat islands from Landsat ETM+ and Corine land cover data: An application to major cities in Greece. Sol. Energy 2007, 81, 358–368. [Google Scholar] [CrossRef]
- U.S. Geological Survey. Landsat 8 Data Users Handbook; NASA: Washington, DC, USA, 2019; Volume 8, p. 114.
- Sobrino, J.A.; Jiménez-Muñoz, J.C.; Sòria, G.; Romaguera, M.; Guanter, L.; Moreno, J.; Plaza, A.; Martínez, P. Land surface emissivity retrieval from different VNIR and TIR sensors. IEEE Trans. Geosci. Remote Sens. 2008, 46, 316–327. [Google Scholar] [CrossRef]
- Sekertekin, A.; Bonafoni, S. Land Surface Temperature Retrieval from Landsat 5, 7, and 8 over Rural Areas: Assessment of Different Retrieval Algorithms and Emissivity Models and Toolbox Implementation. Remote Sens. 2020, 12, 294. [Google Scholar] [CrossRef]
- NDVI, the Foundation for Remote Sensing Phenology|U.S. Geological Survey. Available online: https://www.usgs.gov/special-topics/remote-sensing-phenology/science/ndvi-foundation-remote-sensing-phenology (accessed on 13 January 2023).
- Cook, M.; Schott, J.R.; Mandel, J.; Raqueno, N. Development of an Operational Calibration Methodology for the Landsat Thermal Data Archive and Initial Testing of the Atmospheric Compensation Component of a Land Surface Temperature (LST) Product from the Archive. Remote Sens. 2014, 6, 11244–11266. [Google Scholar] [CrossRef]
- Tan, K.; Liao, Z.; Du, P.; Wu, L. Land surface temperature retrieval from Landsat 8 data and validation with geosensor network. Front. Earth Sci. 2017, 11, 20–34. [Google Scholar] [CrossRef]
- Yu, X.; Guo, X.; Wu, Z. Land Surface Temperature Retrieval from Landsat 8 TIRS-Comparison between Radiative Transfer Equation-Based Method, Split Window Algorithm and Single Channel Method. Remote Sens. 2014, 6, 9829–9852. [Google Scholar] [CrossRef]
- Hidalgo García, D.; Arco Díaz, J.; Martín Martín, A.; Gómez Cobos, E. Spatiotemporal Analysis of Urban Thermal Effects Caused by Heat Waves through Remote Sensing. Sustainability 2022, 14, 12262. [Google Scholar] [CrossRef]
- Luterbacher, J.; Xoplaki, E.; Casty, C.; Wanner, H.; Pauling, A.; Küttel, M.; Rutishauser, T.; Brönnimann, S.; Fischer, E.; Fleitmann, D.; et al. Chapter 1 Mediterranean climate variability over the last centuries: A review. Dev. Earth Environ. Sci. 2006, 4, 27–148. [Google Scholar] [CrossRef]
- Rodríguez-Gómez, F.; Fernández-Cañero, R.; Pérez, G.; del Campo-Ávila, J.; López-Rodríguez, D.; Pérez-Urrestarazu, L. Detection of unfavourable urban areas with higher temperatures and lack of green spaces using satellite imagery in sixteen Spanish cities. Urban For. Urban Green. 2022, 78, 127783. [Google Scholar] [CrossRef]
- Hidalgo-García, D.; Arco-Díaz, J. Modeling the Surface Urban Heat Island (SUHI) to study of its relationship with variations in the thermal field and with the indices of land use in the metropolitan area of Granada (Spain). Sustain. Cities Soc. 2022, 87, 104166. [Google Scholar] [CrossRef]
- Guha, S.; Govil, H. An assessment on the relationship between land surface temperature and normalized difference vegetation index. Environ. Dev. Sustain. 2020, 23, 1944–1963. [Google Scholar] [CrossRef]
- Ward, K.; Lauf, S.; Kleinschmit, B.; Endlicher, W. Heat waves and urban heat islands in Europe: A review of relevant drivers. Sci. Total Environ. 2016, 569–570, 527–539. [Google Scholar] [CrossRef]
- Wu, C.; Li, J.; Wang, C.; Song, C.; Haase, D.; Breuste, J.; Finka, M. Estimating the Cooling Effect of Pocket Green Space in High Density Urban Areas in Shanghai, China. Front. Environ. Sci. 2021, 9, 657969. [Google Scholar] [CrossRef]
- Iungman, T.; Cirach, M.; Marando, F.; Pereira Barboza, E.; Khomenko, S.; Masselot, P.; Quijal-Zamorano, M.; Mueller, N.; Gasparrini, A.; Urquiza, J.; et al. Cooling cities through urban green infrastructure: A health impact assessment of European cities. Lancet 2023, 401, 577–589. [Google Scholar] [CrossRef]
- Parison, S.; Hendel, M.; Grados, A.; Royon, L. Analysis of the heat budget of standard, cool and watered pavements under lab heat-wave conditions. Energy Build. 2020, 228, 110455. [Google Scholar] [CrossRef]
- Haselbach, L.; Boyer, M.; Kevern, J.T.; Schaefer, V.R. Cyclic Heat Island Impacts on Traditional Versus Pervious Concrete Pavement Systems. Transp. Res. Rec. J. Transp. Res. Board 2011, 2240, 107–115. [Google Scholar] [CrossRef]
- Bartesaghi-Koc, C.; Osmond, P.; Peters, A. Quantifying the seasonal cooling capacity of ‘green infrastructure types’ (GITs): An approach to assess and mitigate surface urban heat island in Sydney, Australia. Landsc. Urban Plan. 2020, 203, 103893. [Google Scholar] [CrossRef]
- Bartesaghi-Koc, C.; Osmond, P.; Peters, A. Mapping and classifying green infrastructure typologies for climate-related studies based on remote sensing data. Urban For. Urban Green. 2019, 37, 154–167. [Google Scholar] [CrossRef]
- Vujovic, S.; Haddad, B.; Karaky, H.; Sebaibi, N.; Boutouil, M. Urban Heat Island: Causes, Consequences, and Mitigation Measures with Emphasis on Reflective and Permeable Pavements. Civileng 2021, 2, 459–484. [Google Scholar] [CrossRef]
- Hayes, A.T.; Jandaghian, Z.; Lacasse, M.A.; Gaur, A.; Lu, H.; Laouadi, A.; Ge, H.; Wang, L. Nature-Based Solutions (NBSs) to Mitigate Urban Heat Island (UHI) Effects in Canadian Cities. Buildings 2022, 12, 925. [Google Scholar] [CrossRef]
- Rosso, F.; Cappa, F.; Spitzmiller, R.; Ferrero, M. Pocket parks towards more sustainable cities. Architectural, environmental, managerial and legal considerations towards an integrated framework: A case study in the Mediterranean region. Environ. Chall. 2022, 7, 100402. [Google Scholar] [CrossRef]
- Terkenli, T.S.; Bell, S.; Tošković, O.; Dubljević-Tomićević, J.; Panagopoulos, T.; Straupe, I.; Kristianova, K.; Straigyte, L.; O’Brien, L.; Živojinović, I. Tourist perceptions and uses of urban green infrastructure: An exploratory cross-cultural investigation. Urban For. Urban Green. 2020, 49, 126624. [Google Scholar] [CrossRef]
- Dzyuban, Y.; Ching, G.N.Y.; Yik, S.K.; Tan, A.J.; Banerjee, S.; Crank, P.J.; Chow, W.T.L. Outdoor thermal comfort research in transient conditions: A narrative literature review. Landsc. Urban Plan. 2022, 226, 104496. [Google Scholar] [CrossRef]
- Hobbie, S.E.; Grimm, N.B. Nature-based approaches to managing climate change impacts in cities. Philos. Trans. R. Soc. B 2020, 375, 20190124. [Google Scholar] [CrossRef]
- Leal Filho, W.; Wolf, F.; Castro-Díaz, R.; Li, C.; Ojeh, V.N.; Gutiérrez, N.; Nagy, G.J.; Savić, S.; Natenzon, C.E.; Al-Amin, A.Q.; et al. Addressing the Urban Heat Islands Effect: A Cross-Country Assessment of the Role of Green Infrastructure. Sustainability 2021, 13, 753. [Google Scholar] [CrossRef]
- Segura, R.; Estruch, C.; Badia, A.; Ventura, S.; Krayenhoff, E.S.; Villalba, G. Evaluating the impact of urban parks on the thermal comfort during a heat wave episode in a Mediterranean city. In Proceedings of the EGU General Assembly 2023, Vienna, Austria, 24–28 April 2023. [Google Scholar] [CrossRef]
- Oliveira, S.; Andrade, H.; Vaz, T. The cooling effect of green spaces as a contribution to the mitigation of urban heat: A case study in Lisbon. Build. Environ. 2011, 46, 2186–2194. [Google Scholar] [CrossRef]
- Dousset, B.; Gourmelon, F.; Laaidi, K.; Zeghnoun, A.; Giraudet, E.; Bretin, P.; Mauri, E.; Vandentorren, S. Satellite monitoring of summer heat waves in the Paris metropolitan area. Int. J. Climatol. 2011, 31, 313–323. [Google Scholar] [CrossRef]


Disclaimer/Publisher’s Note: The statements, opinions and data contained in all publications are solely those of the individual author(s) and contributor(s) and not of MDPI and/or the editor(s). MDPI and/or the editor(s) disclaim responsibility for any injury to people or property resulting from any ideas, methods, instructions or products referred to in the content. |
© 2023 by the authors. Licensee MDPI, Basel, Switzerland. This article is an open access article distributed under the terms and conditions of the Creative Commons Attribution (CC BY) license (https://creativecommons.org/licenses/by/4.0/).