Evidences of Soil Consumption Dynamics over Space and Time by Data Analysis in a Southern Italy Urban Sprawling Area
Abstract
1. Introduction
2. Materials and Methods
2.1. Study Area
2.2. Data Source and Processing
2.3. Land Cover Classification
- Urban fabric,
- Industrial, commercial and transport units,
- Mine, dump and construction sites,
- Arable land,
- Permanent crops,
- Heterogeneous agricultural areas,
- Forests,
- Shrub and/or herbaceous vegetation associations,
- Inland waters.
2.4. Multi-Temporal Landscape Metrics
2.5. Soil Consumption Analysis
- Consumed soil on a reference surface
- Intensity of soil consumption
- Average annual rate of the increase in consumed soil
- Fertile soil consumption
- Soil consumption by altimetric bands
- Consumed soil by inhabitant
- Consumed soil in square metres by inhabitant supplementary between two dates
3. Results
4. Discussion
5. Conclusions
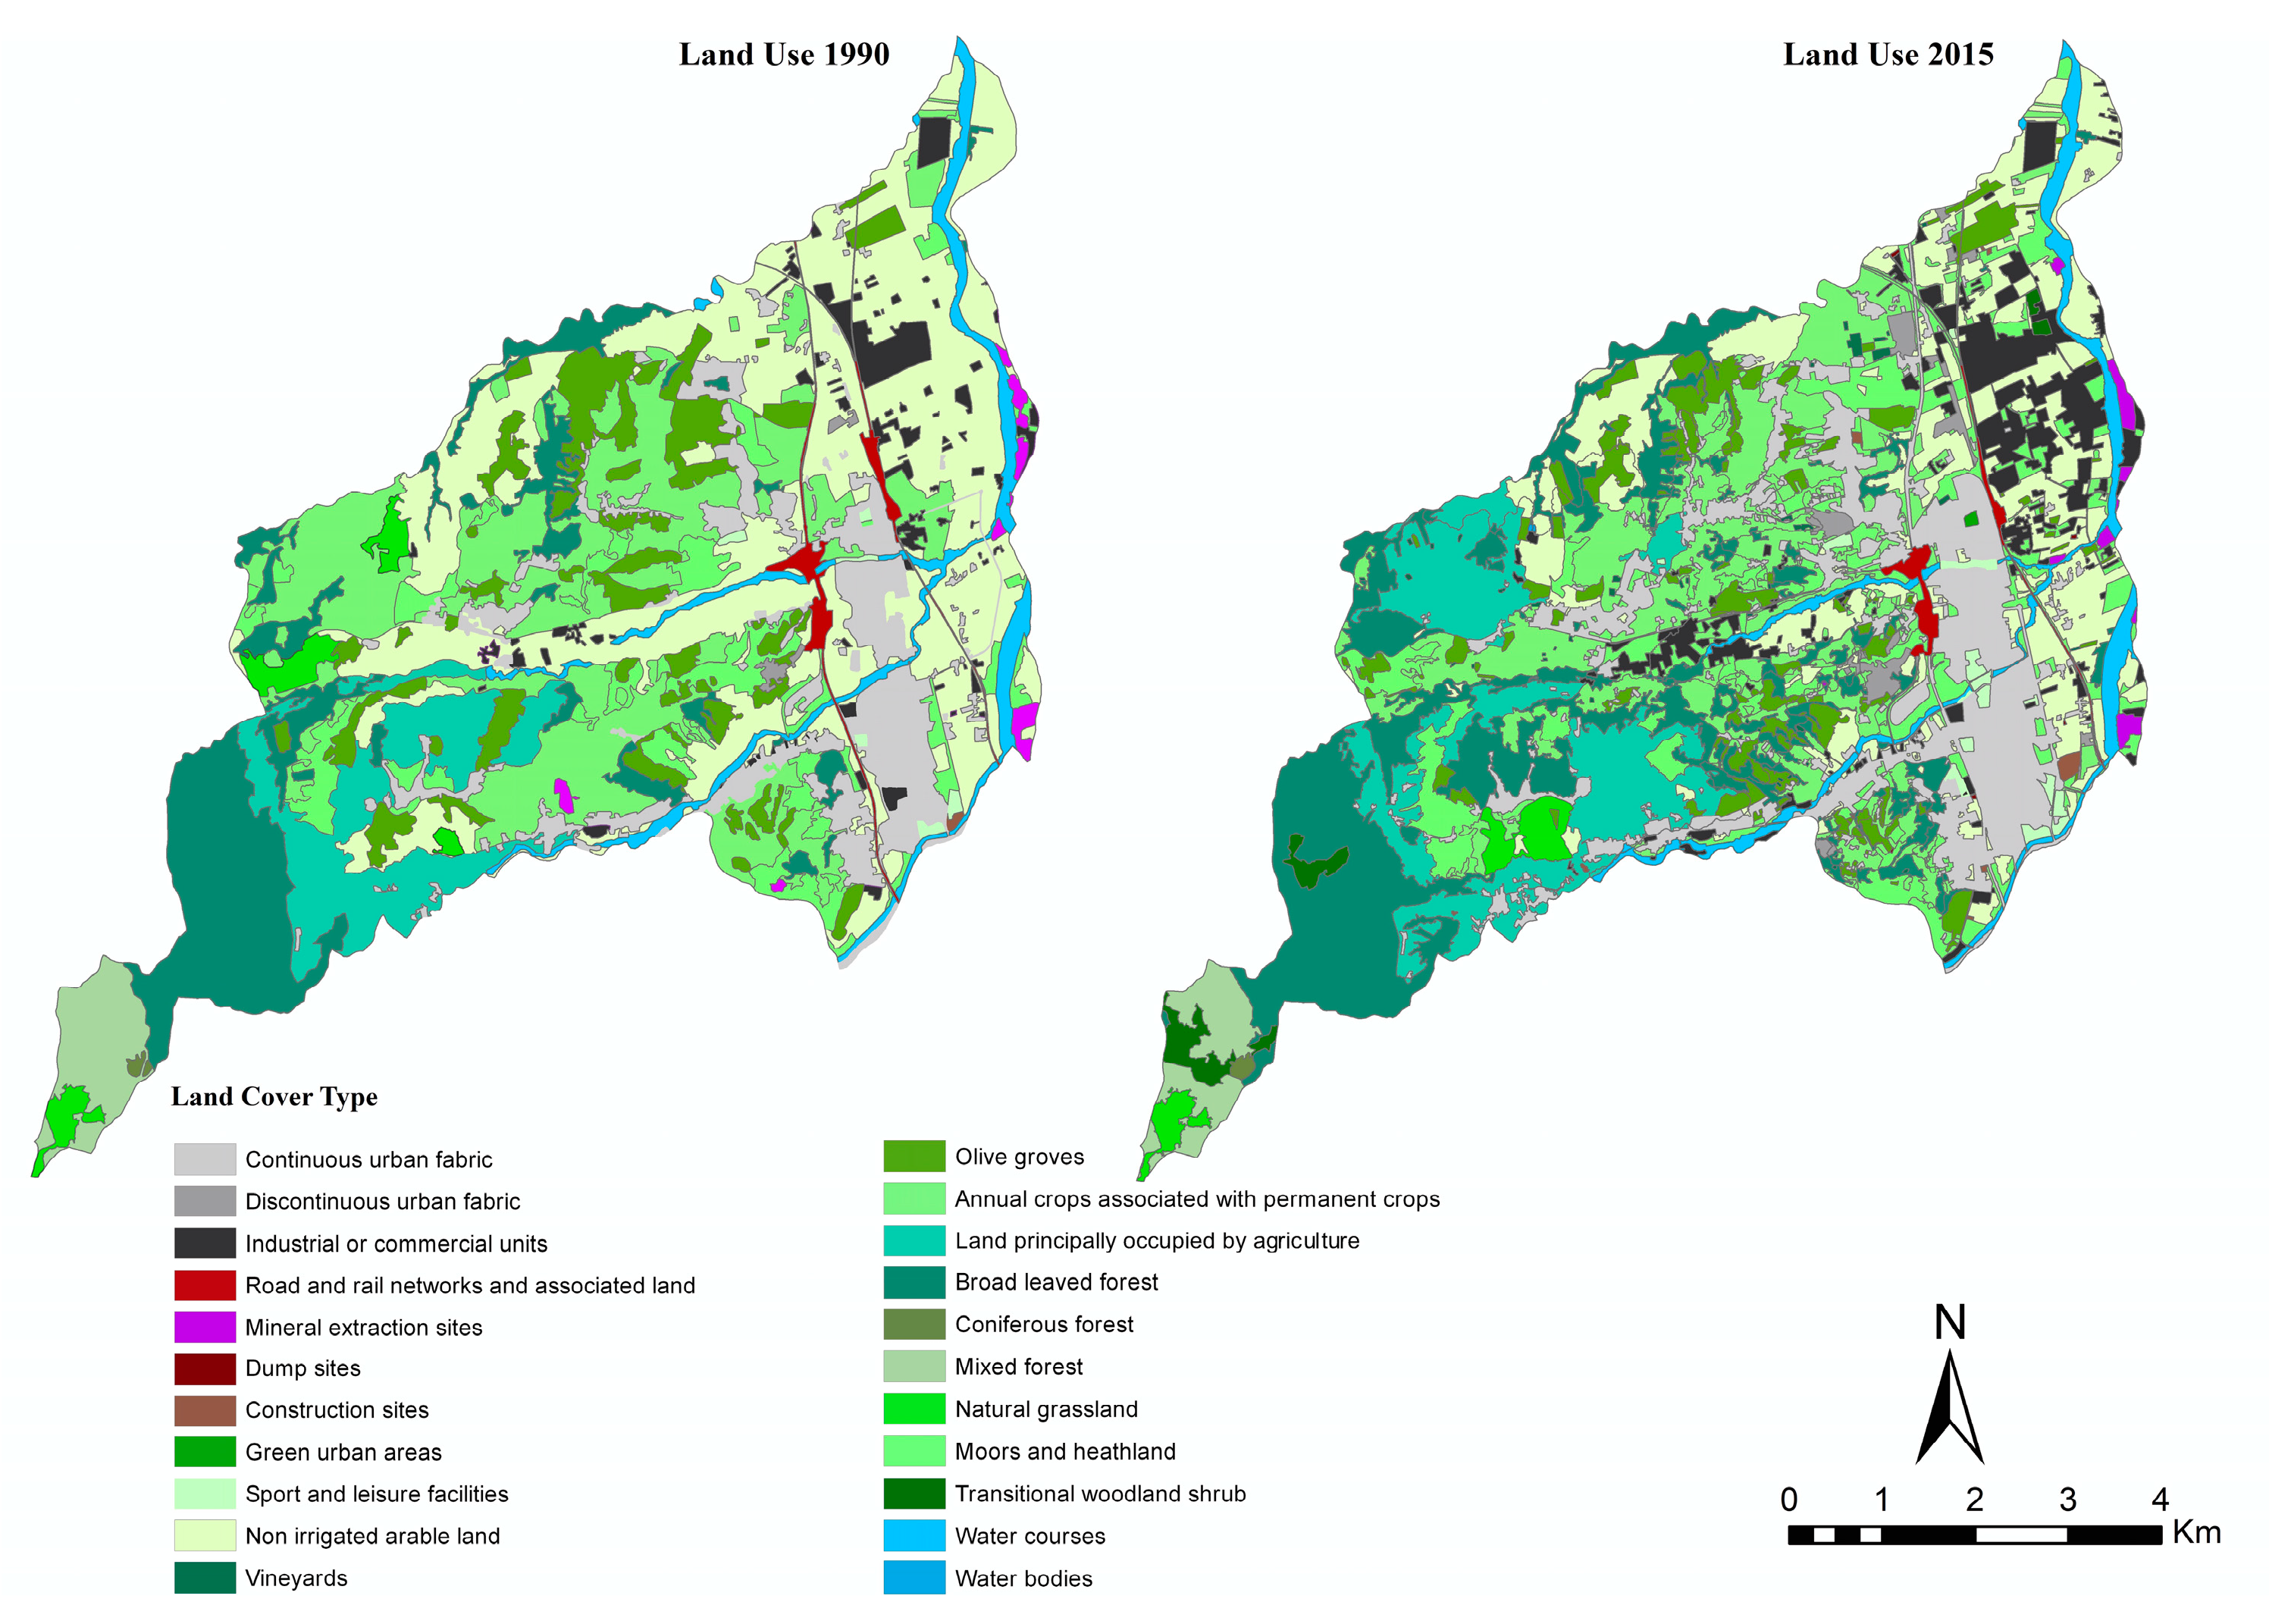
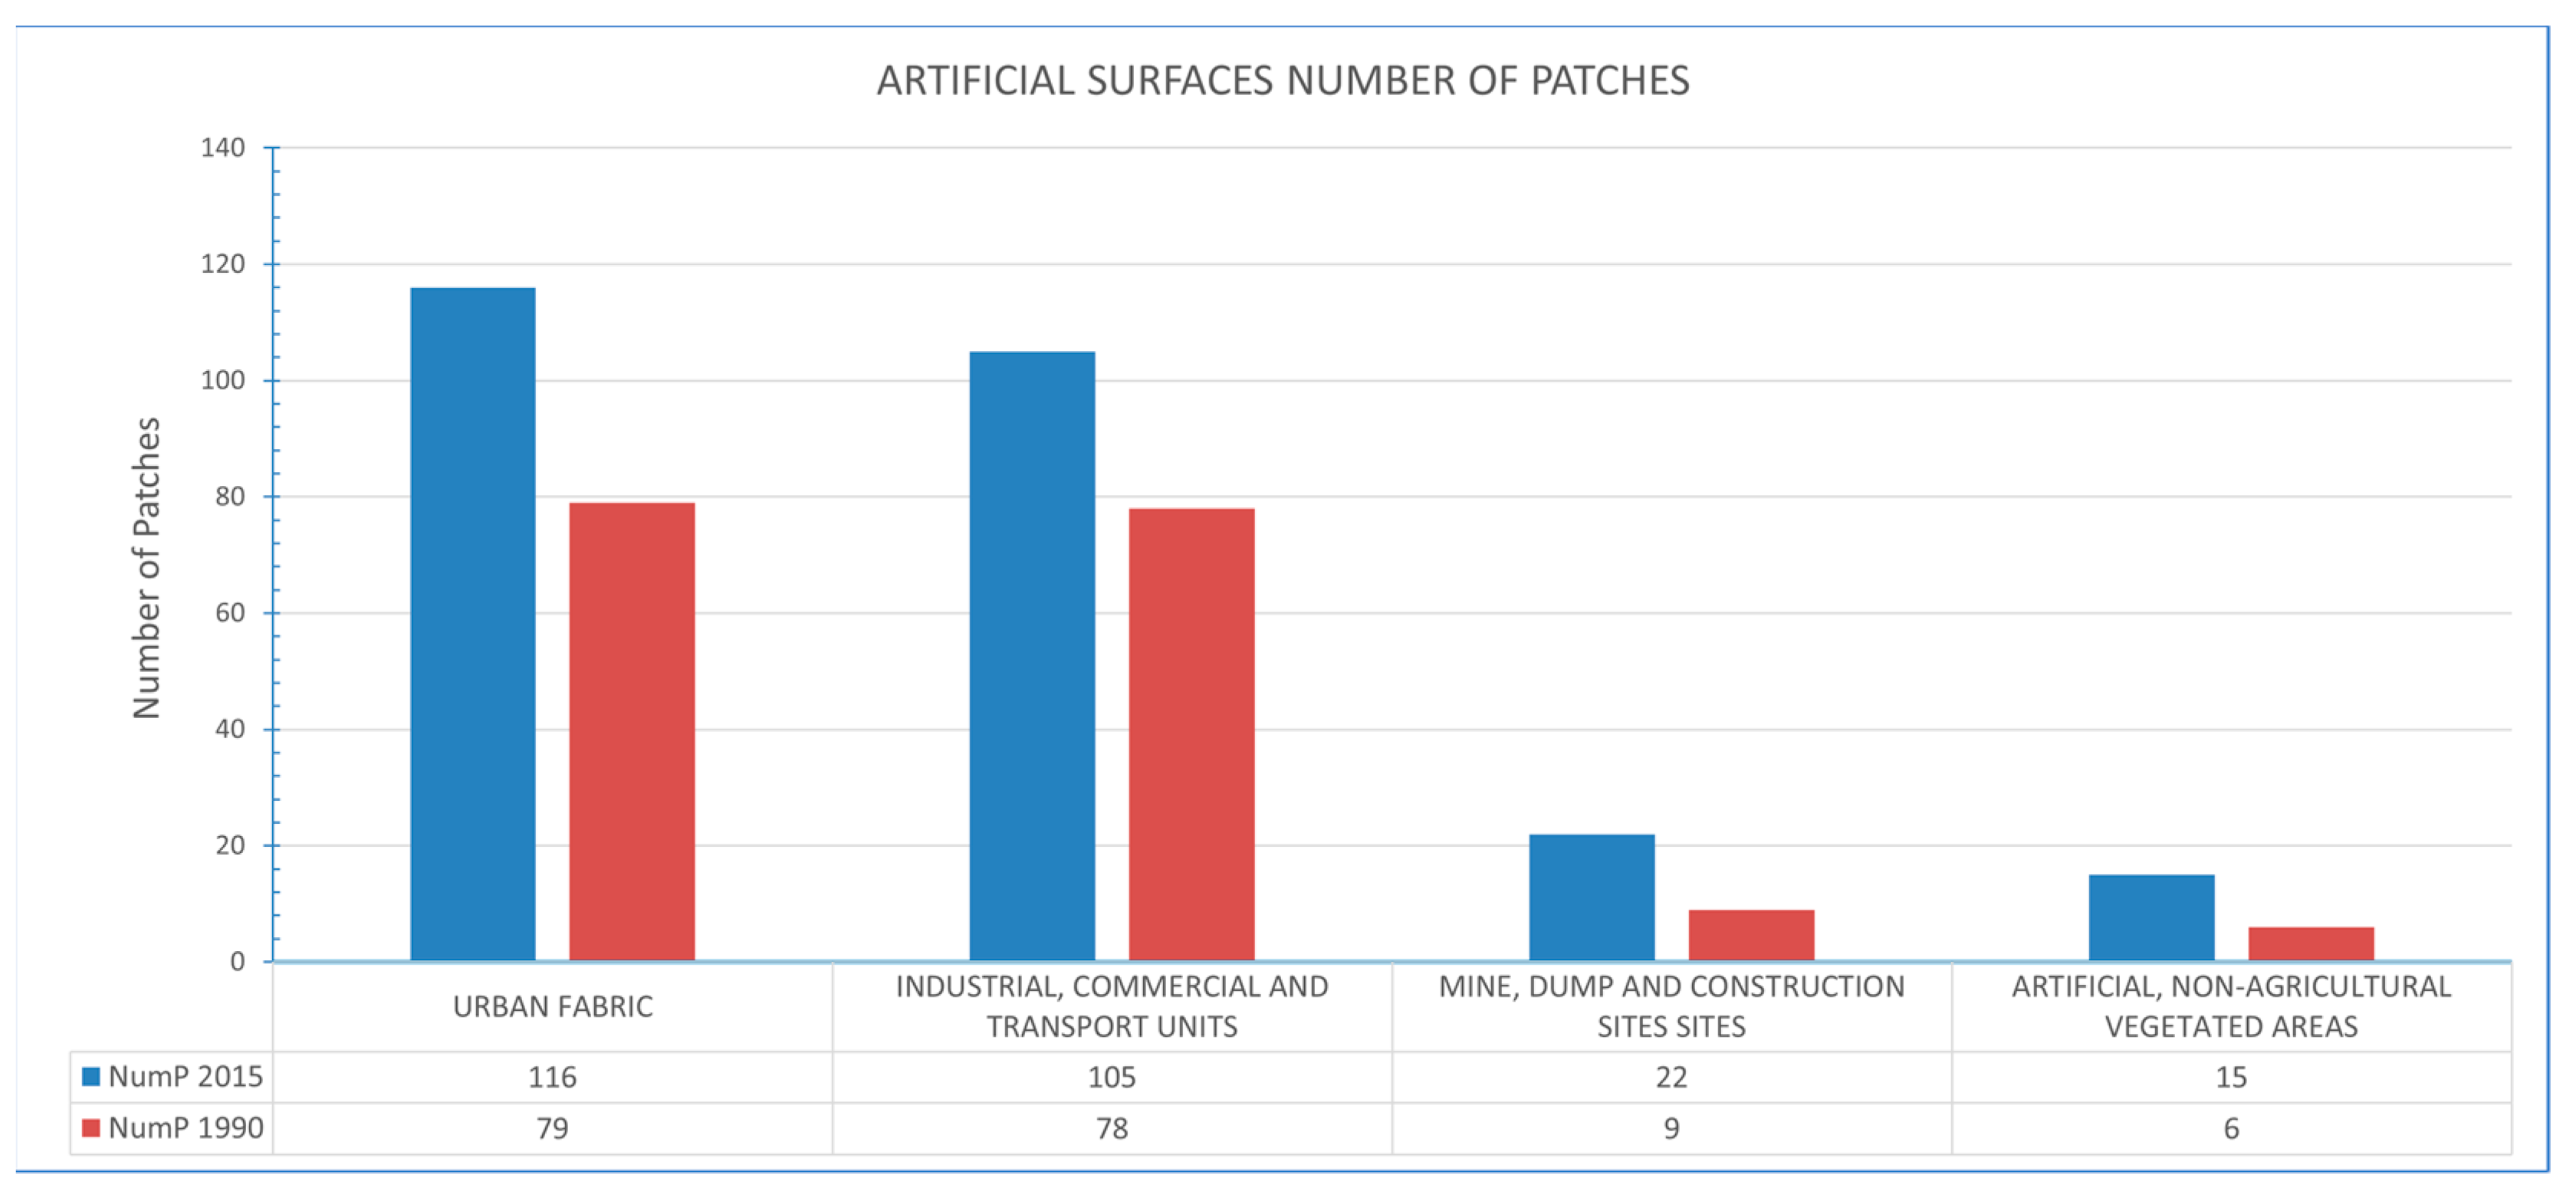
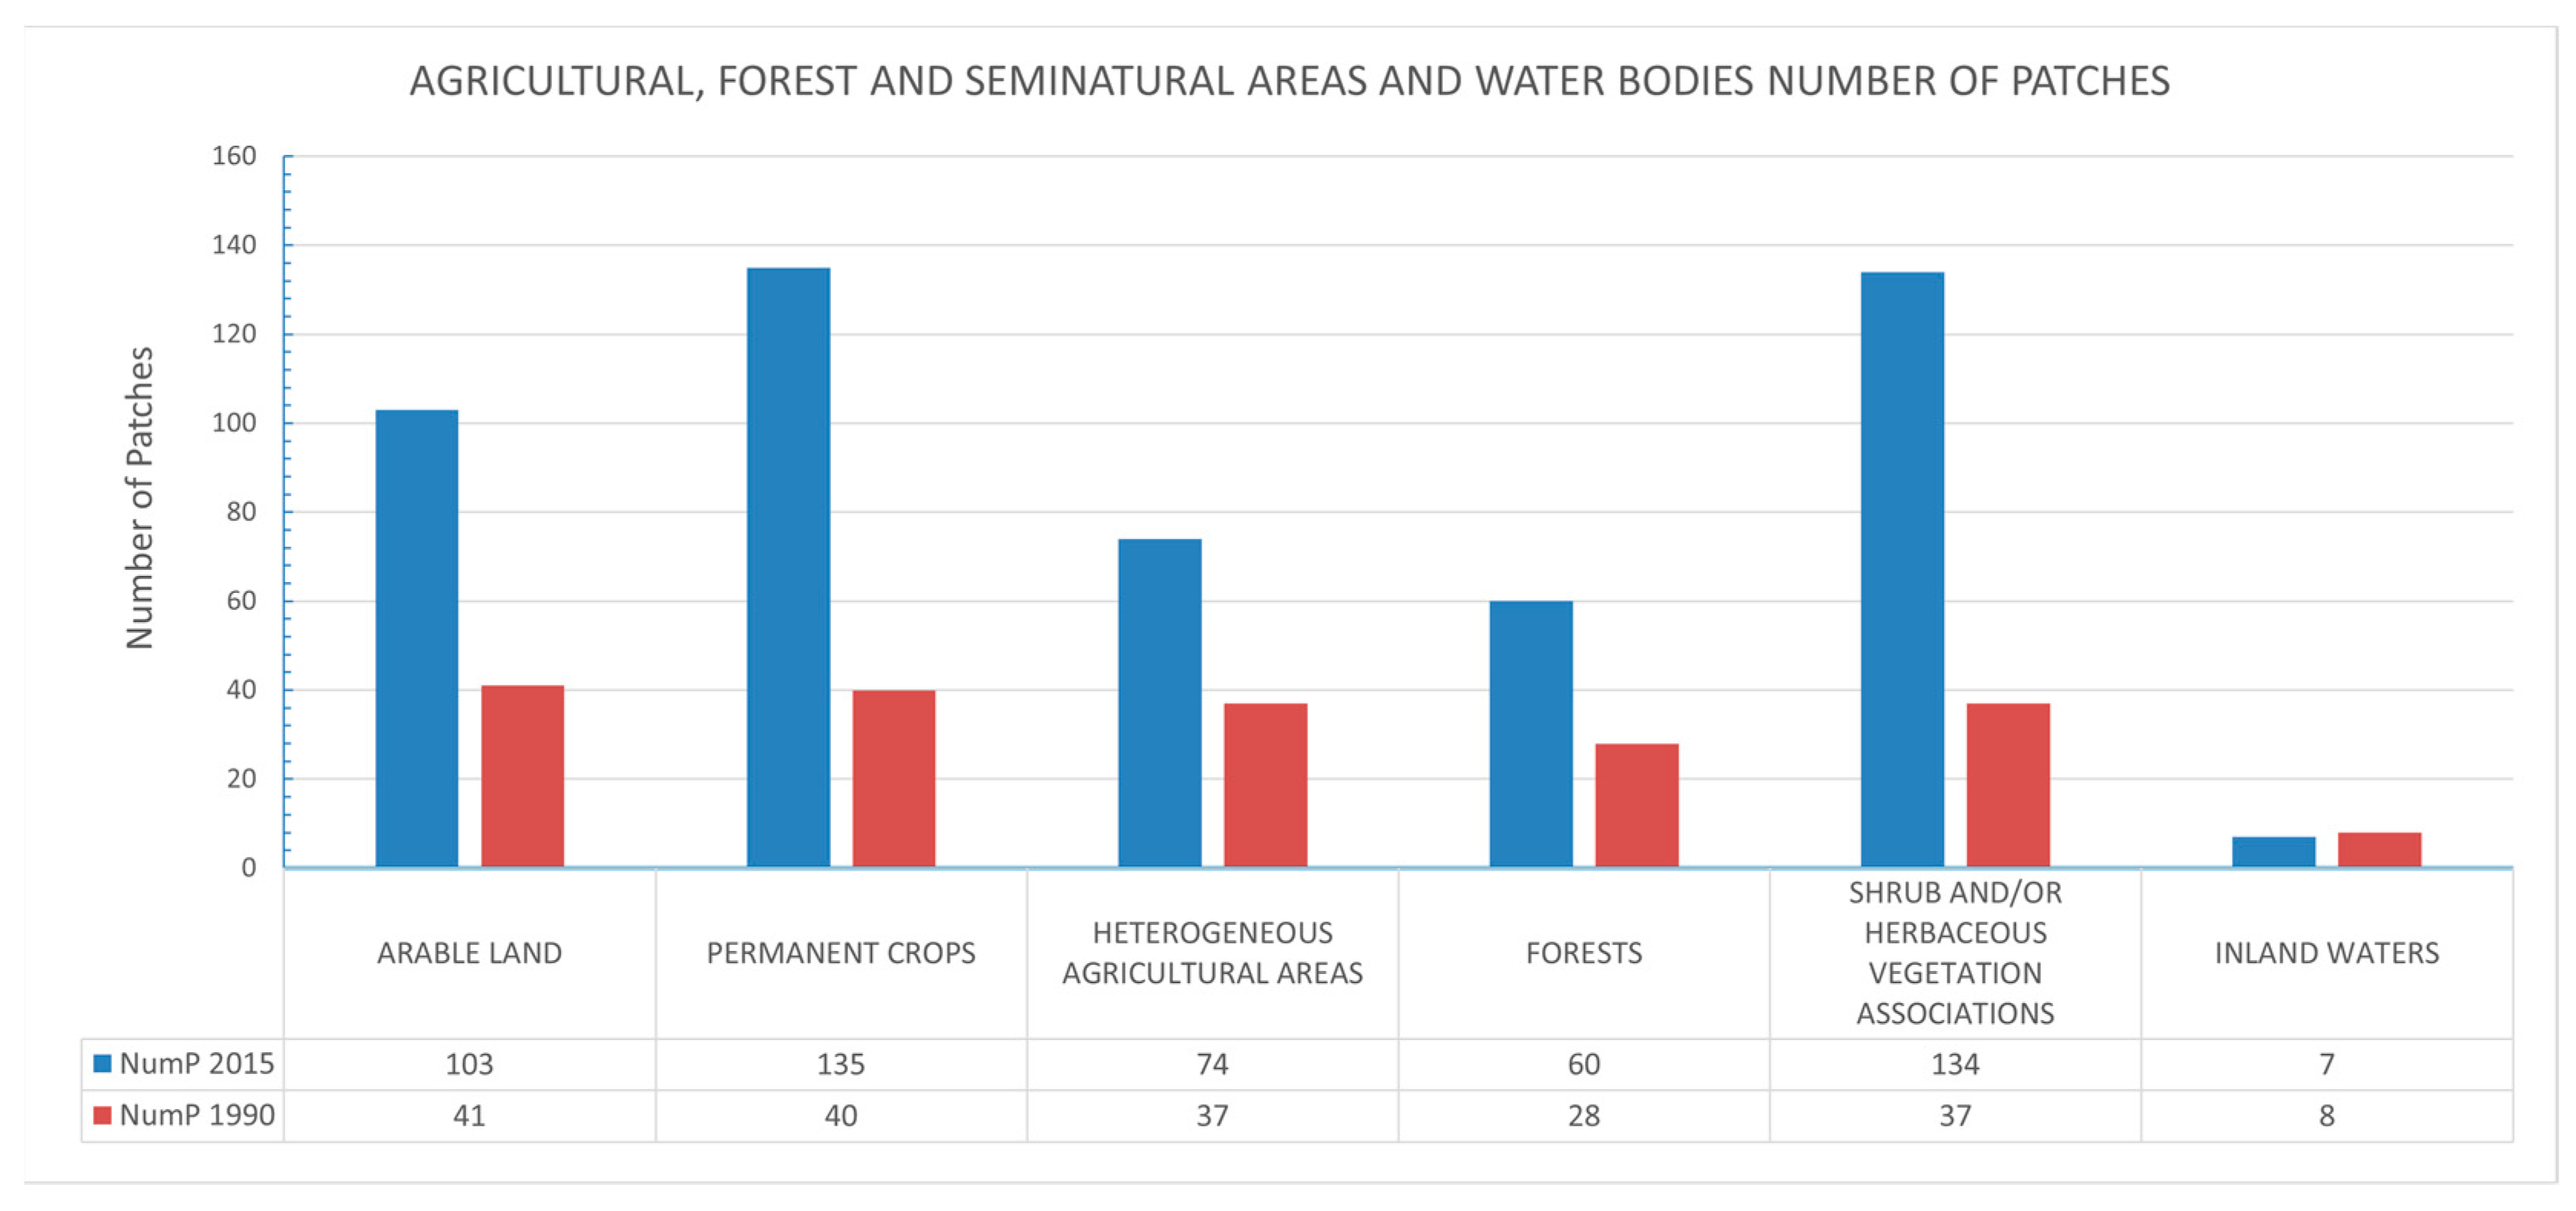
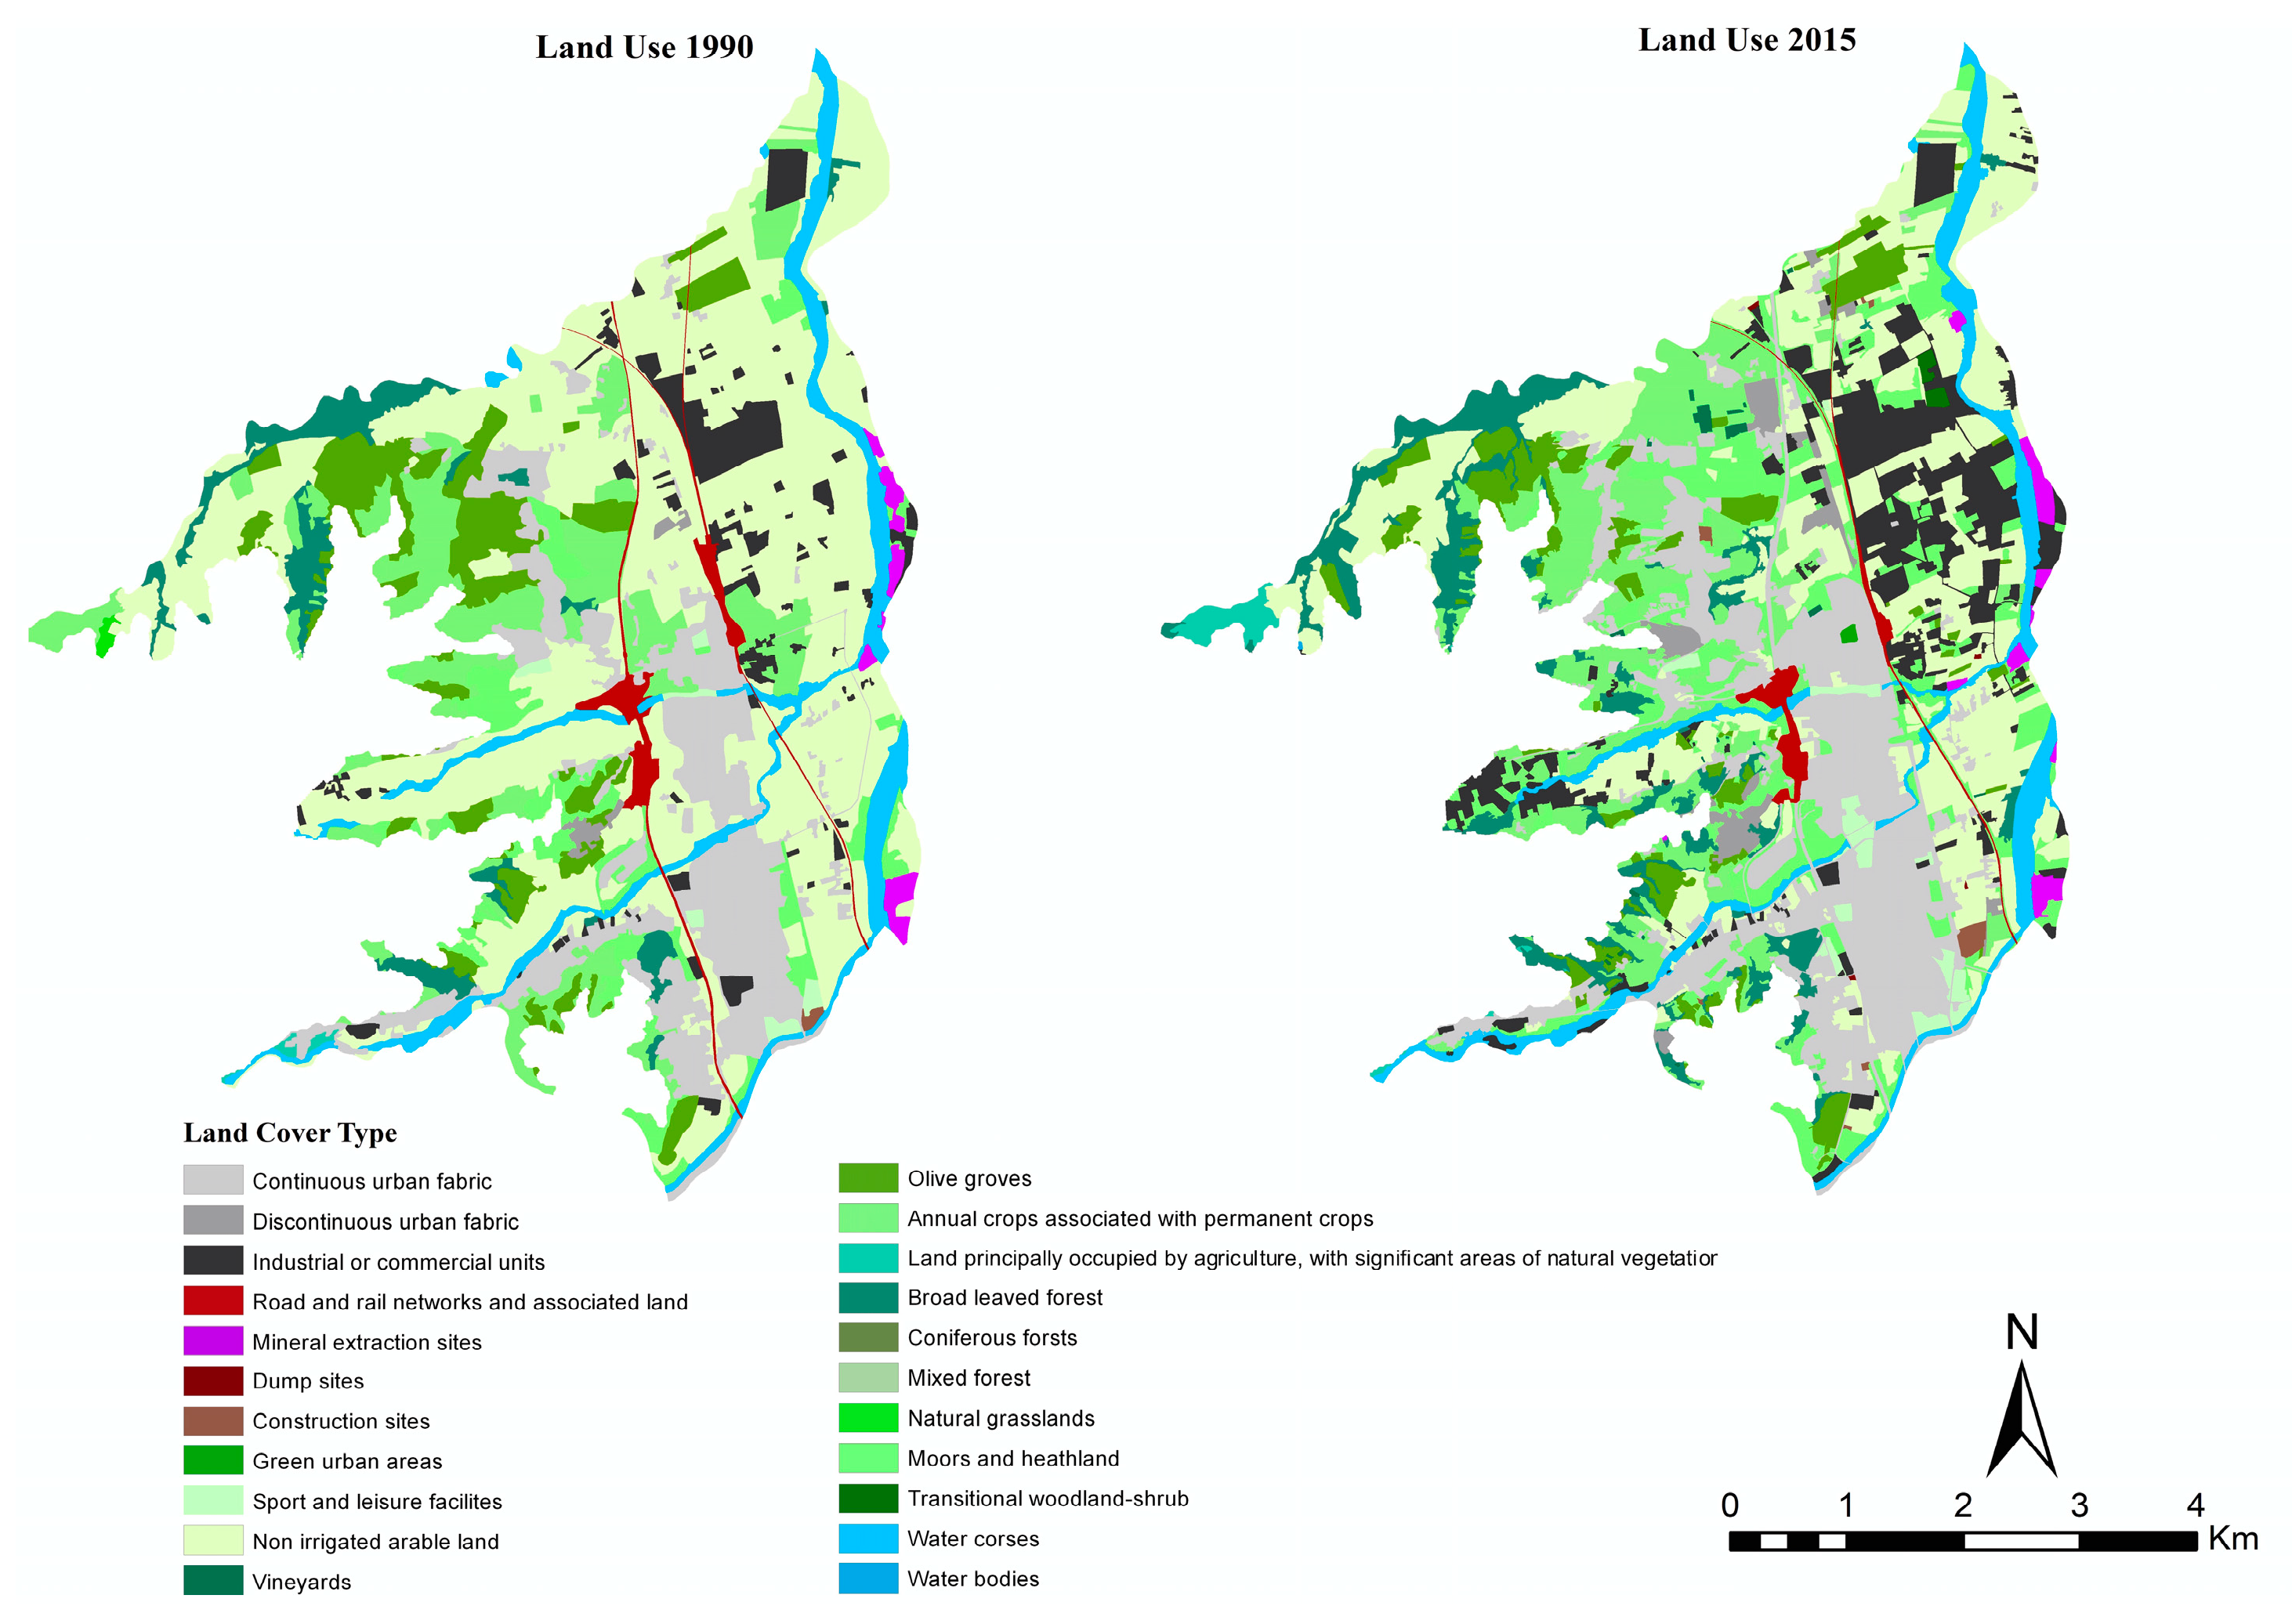
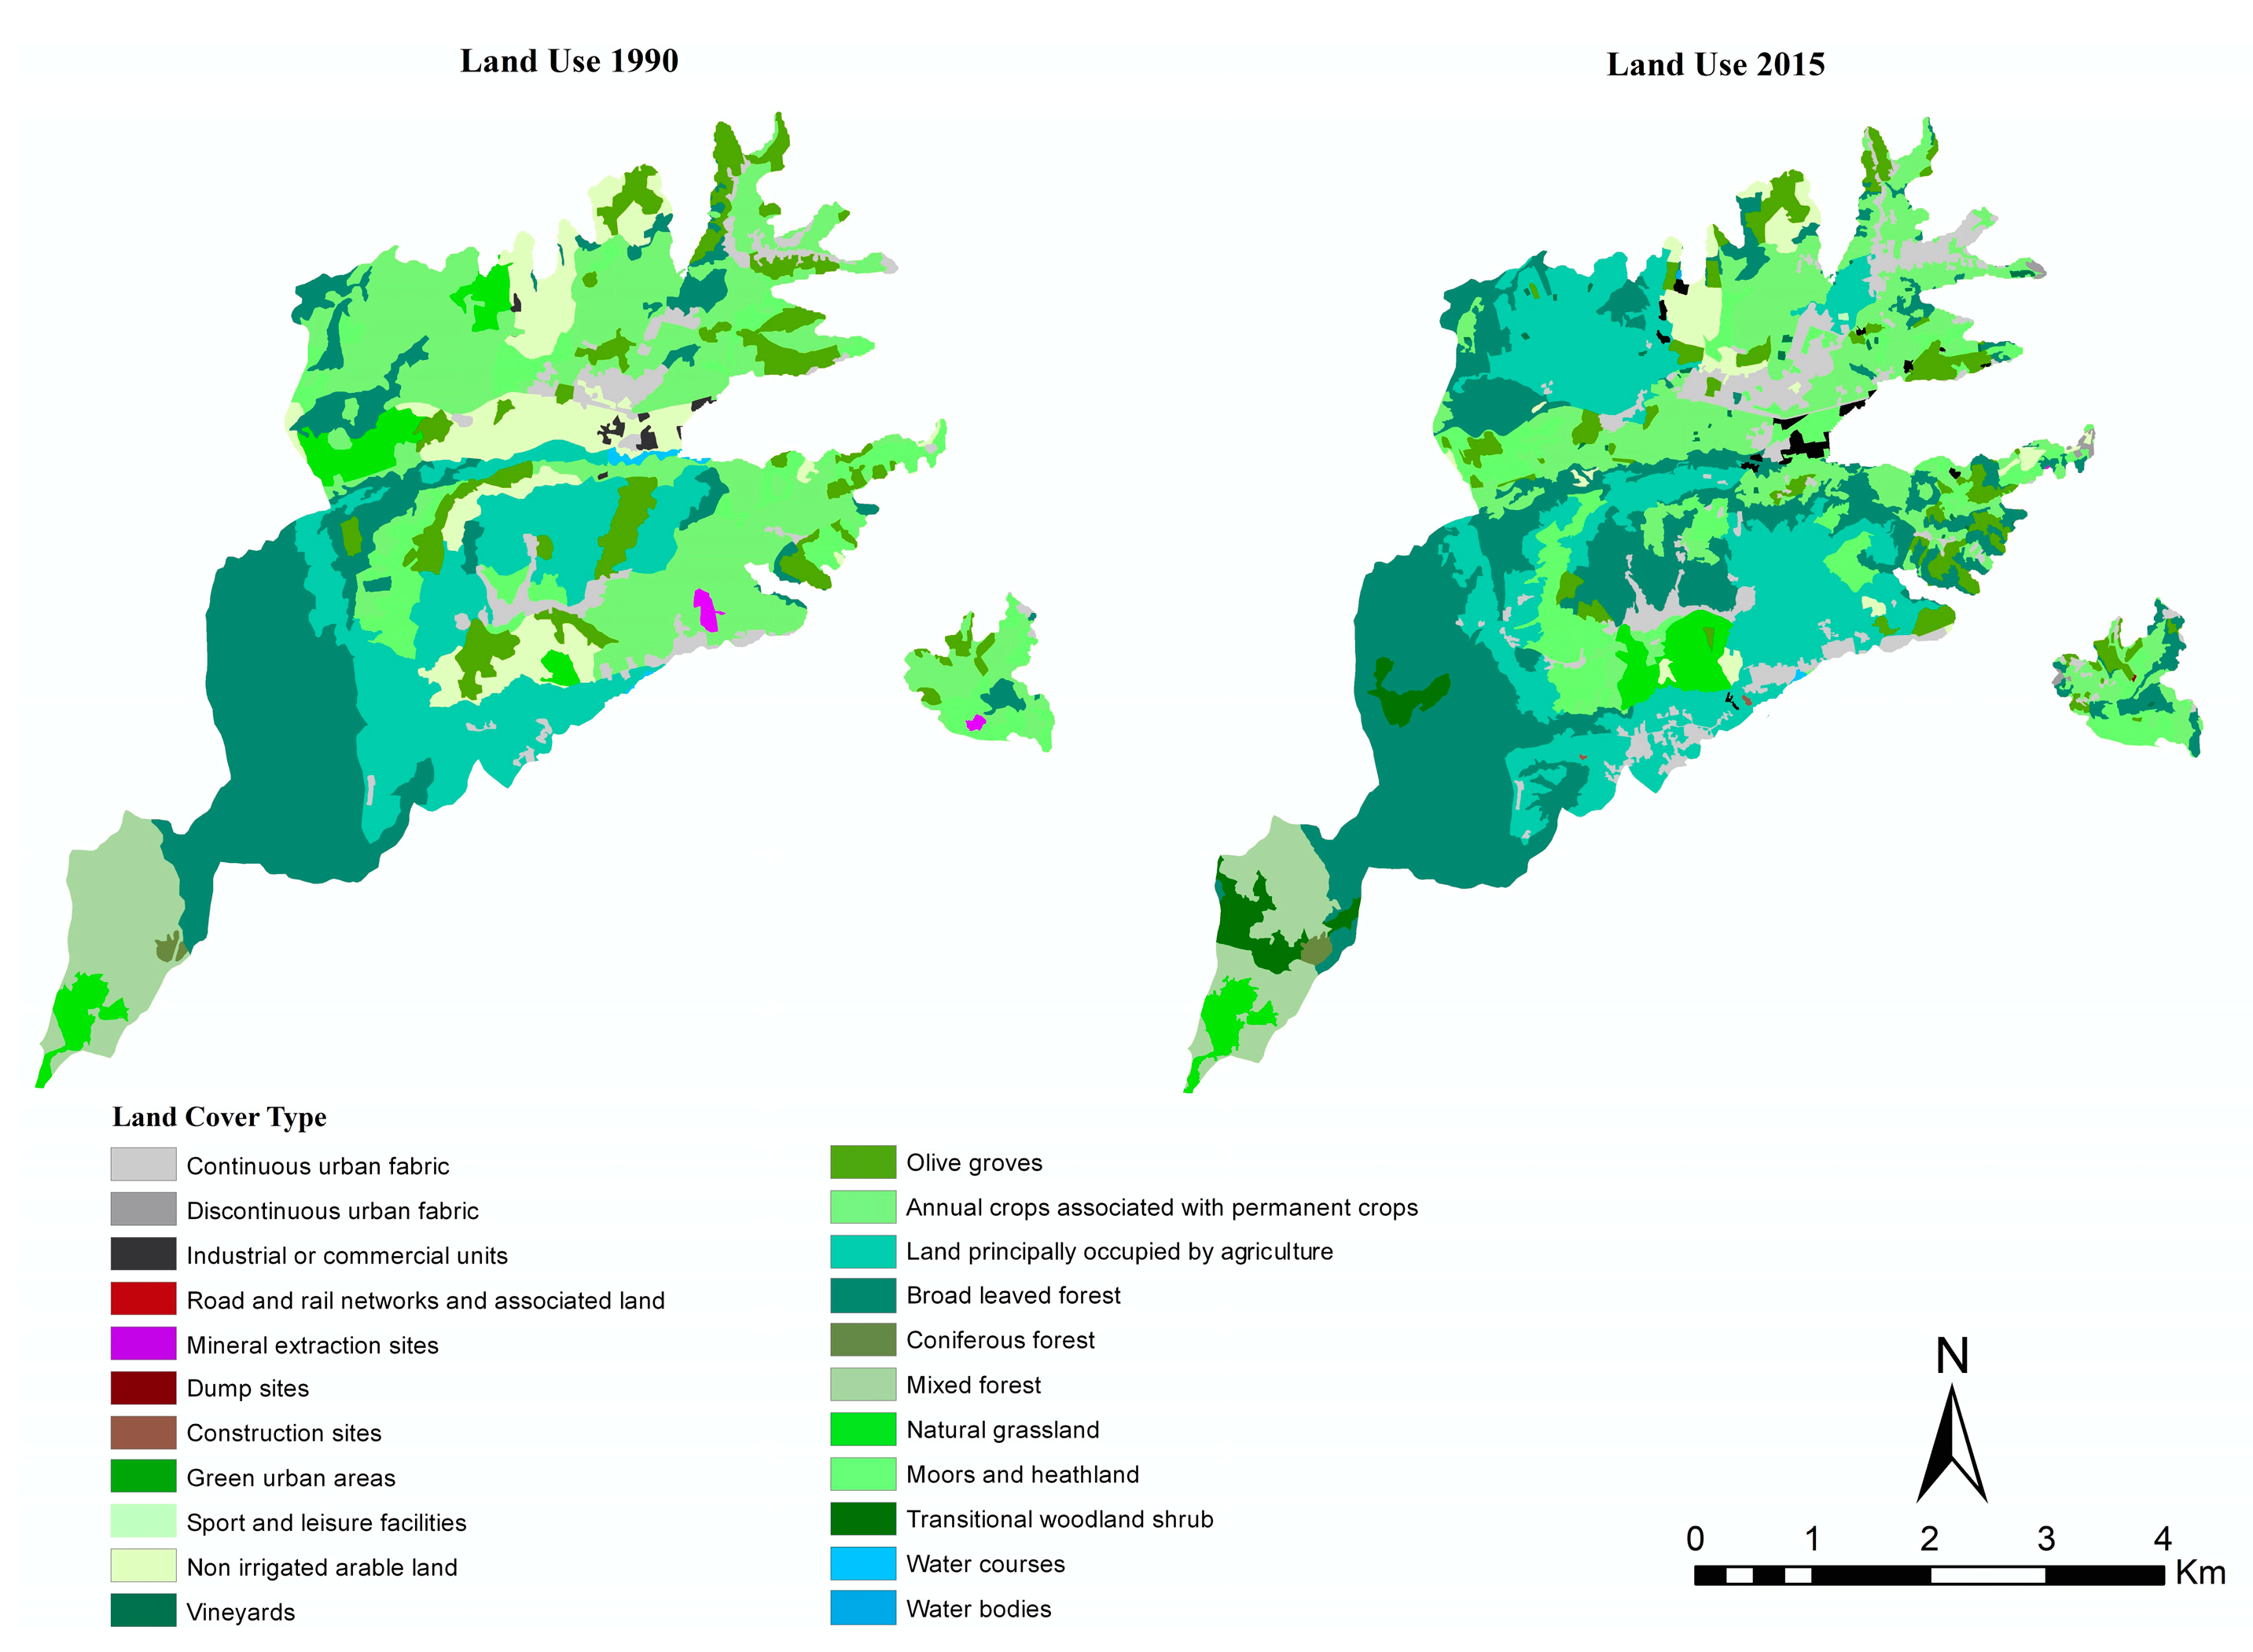
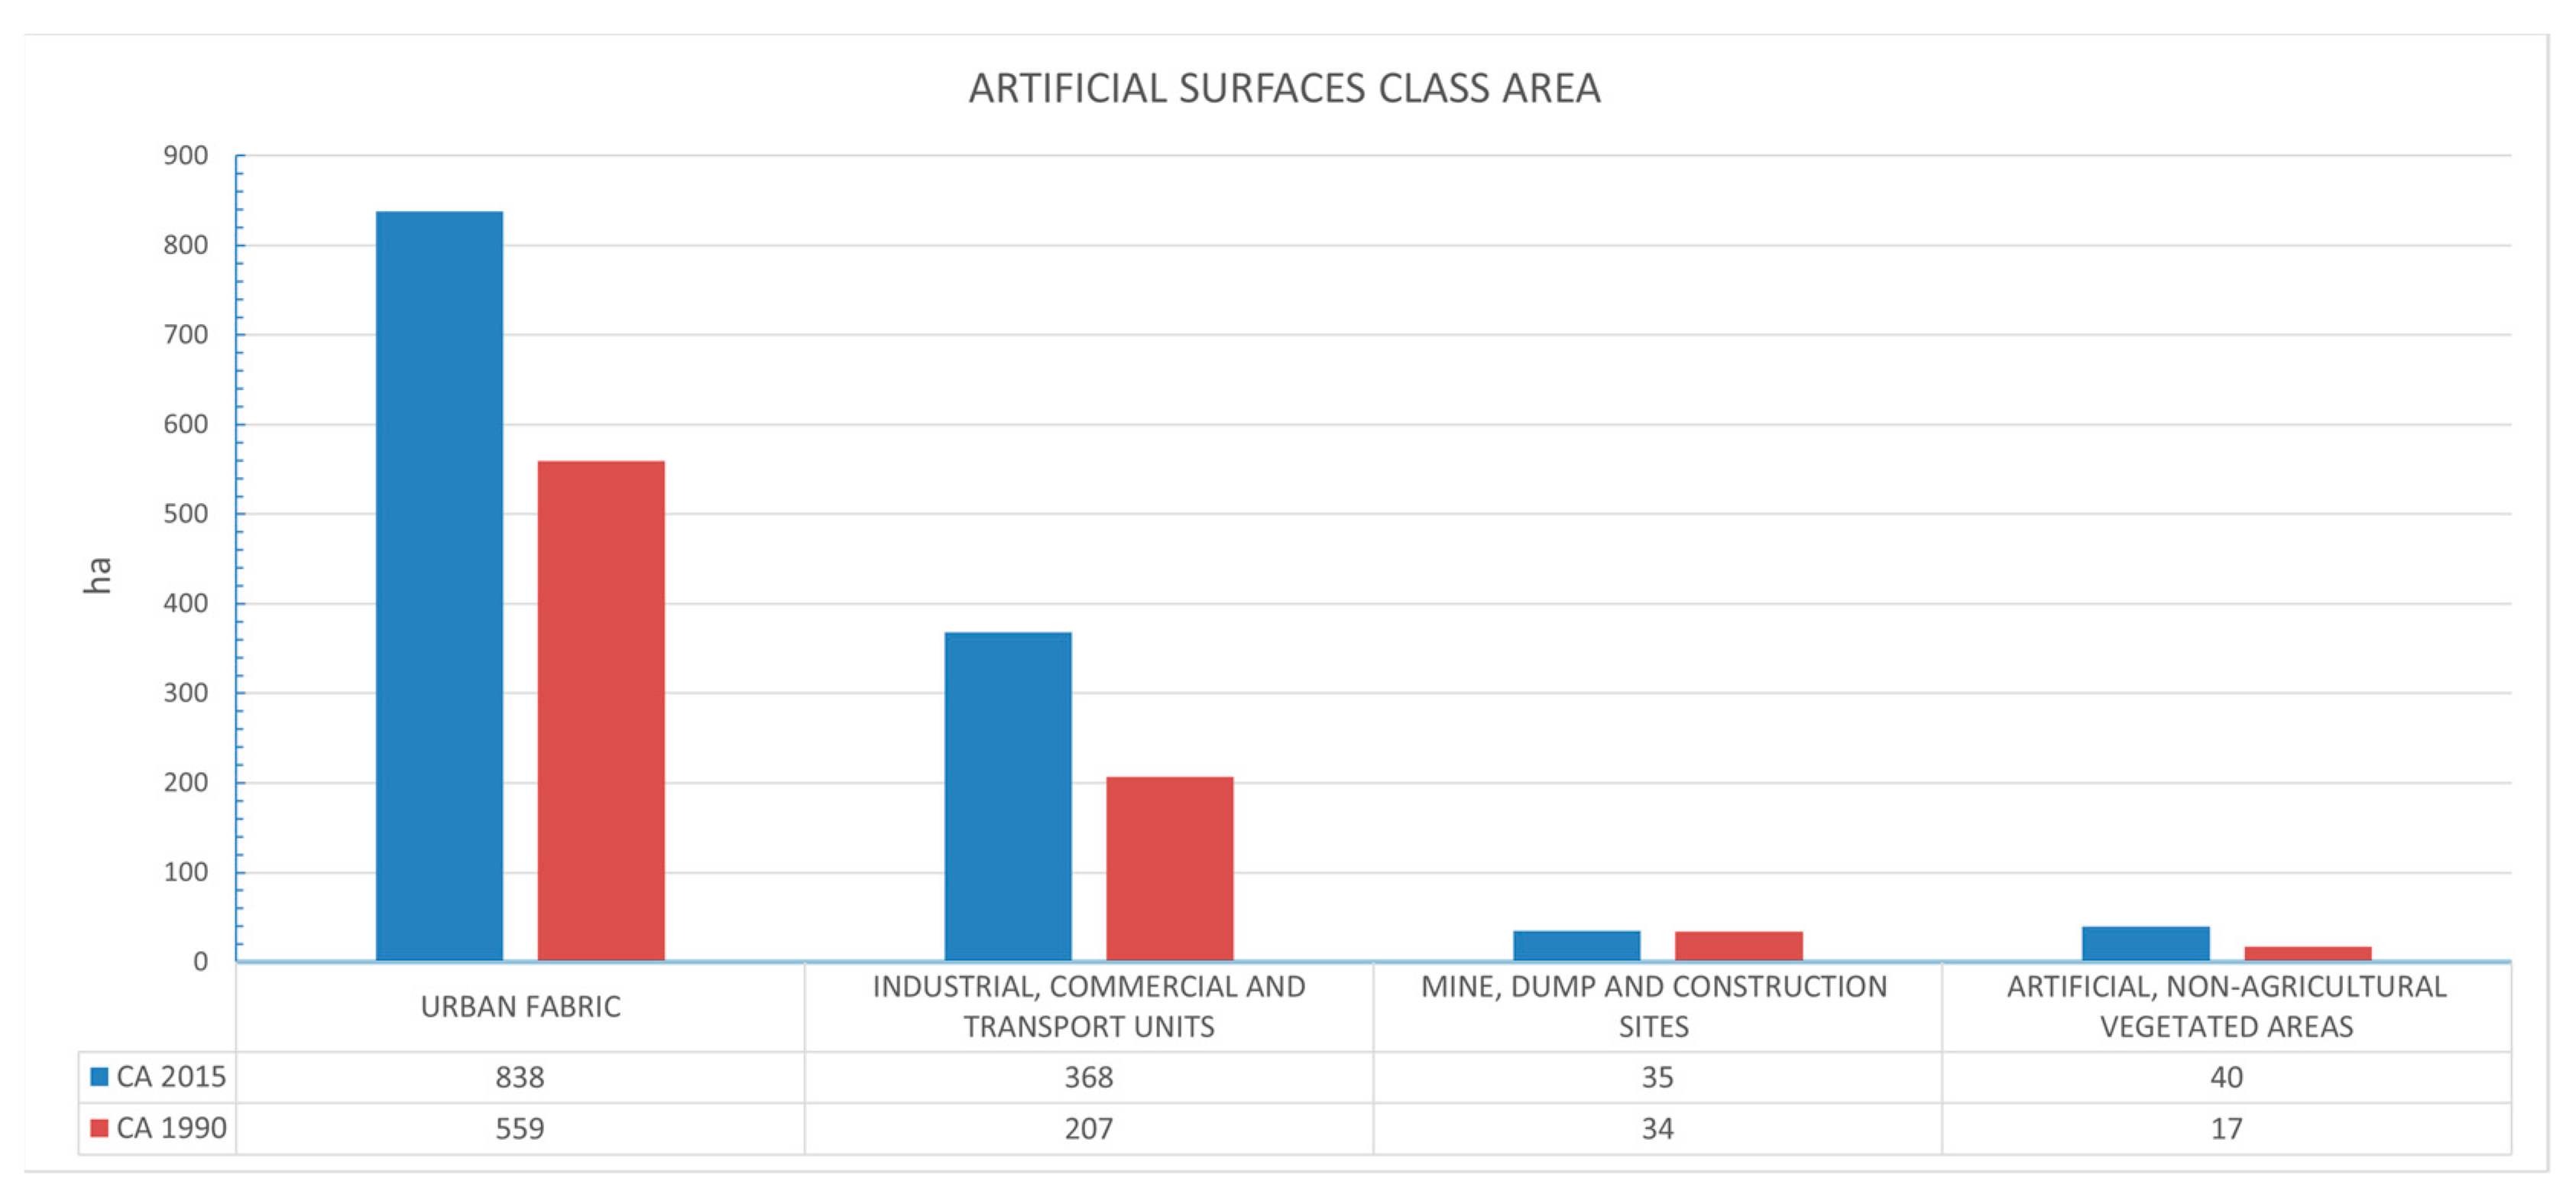
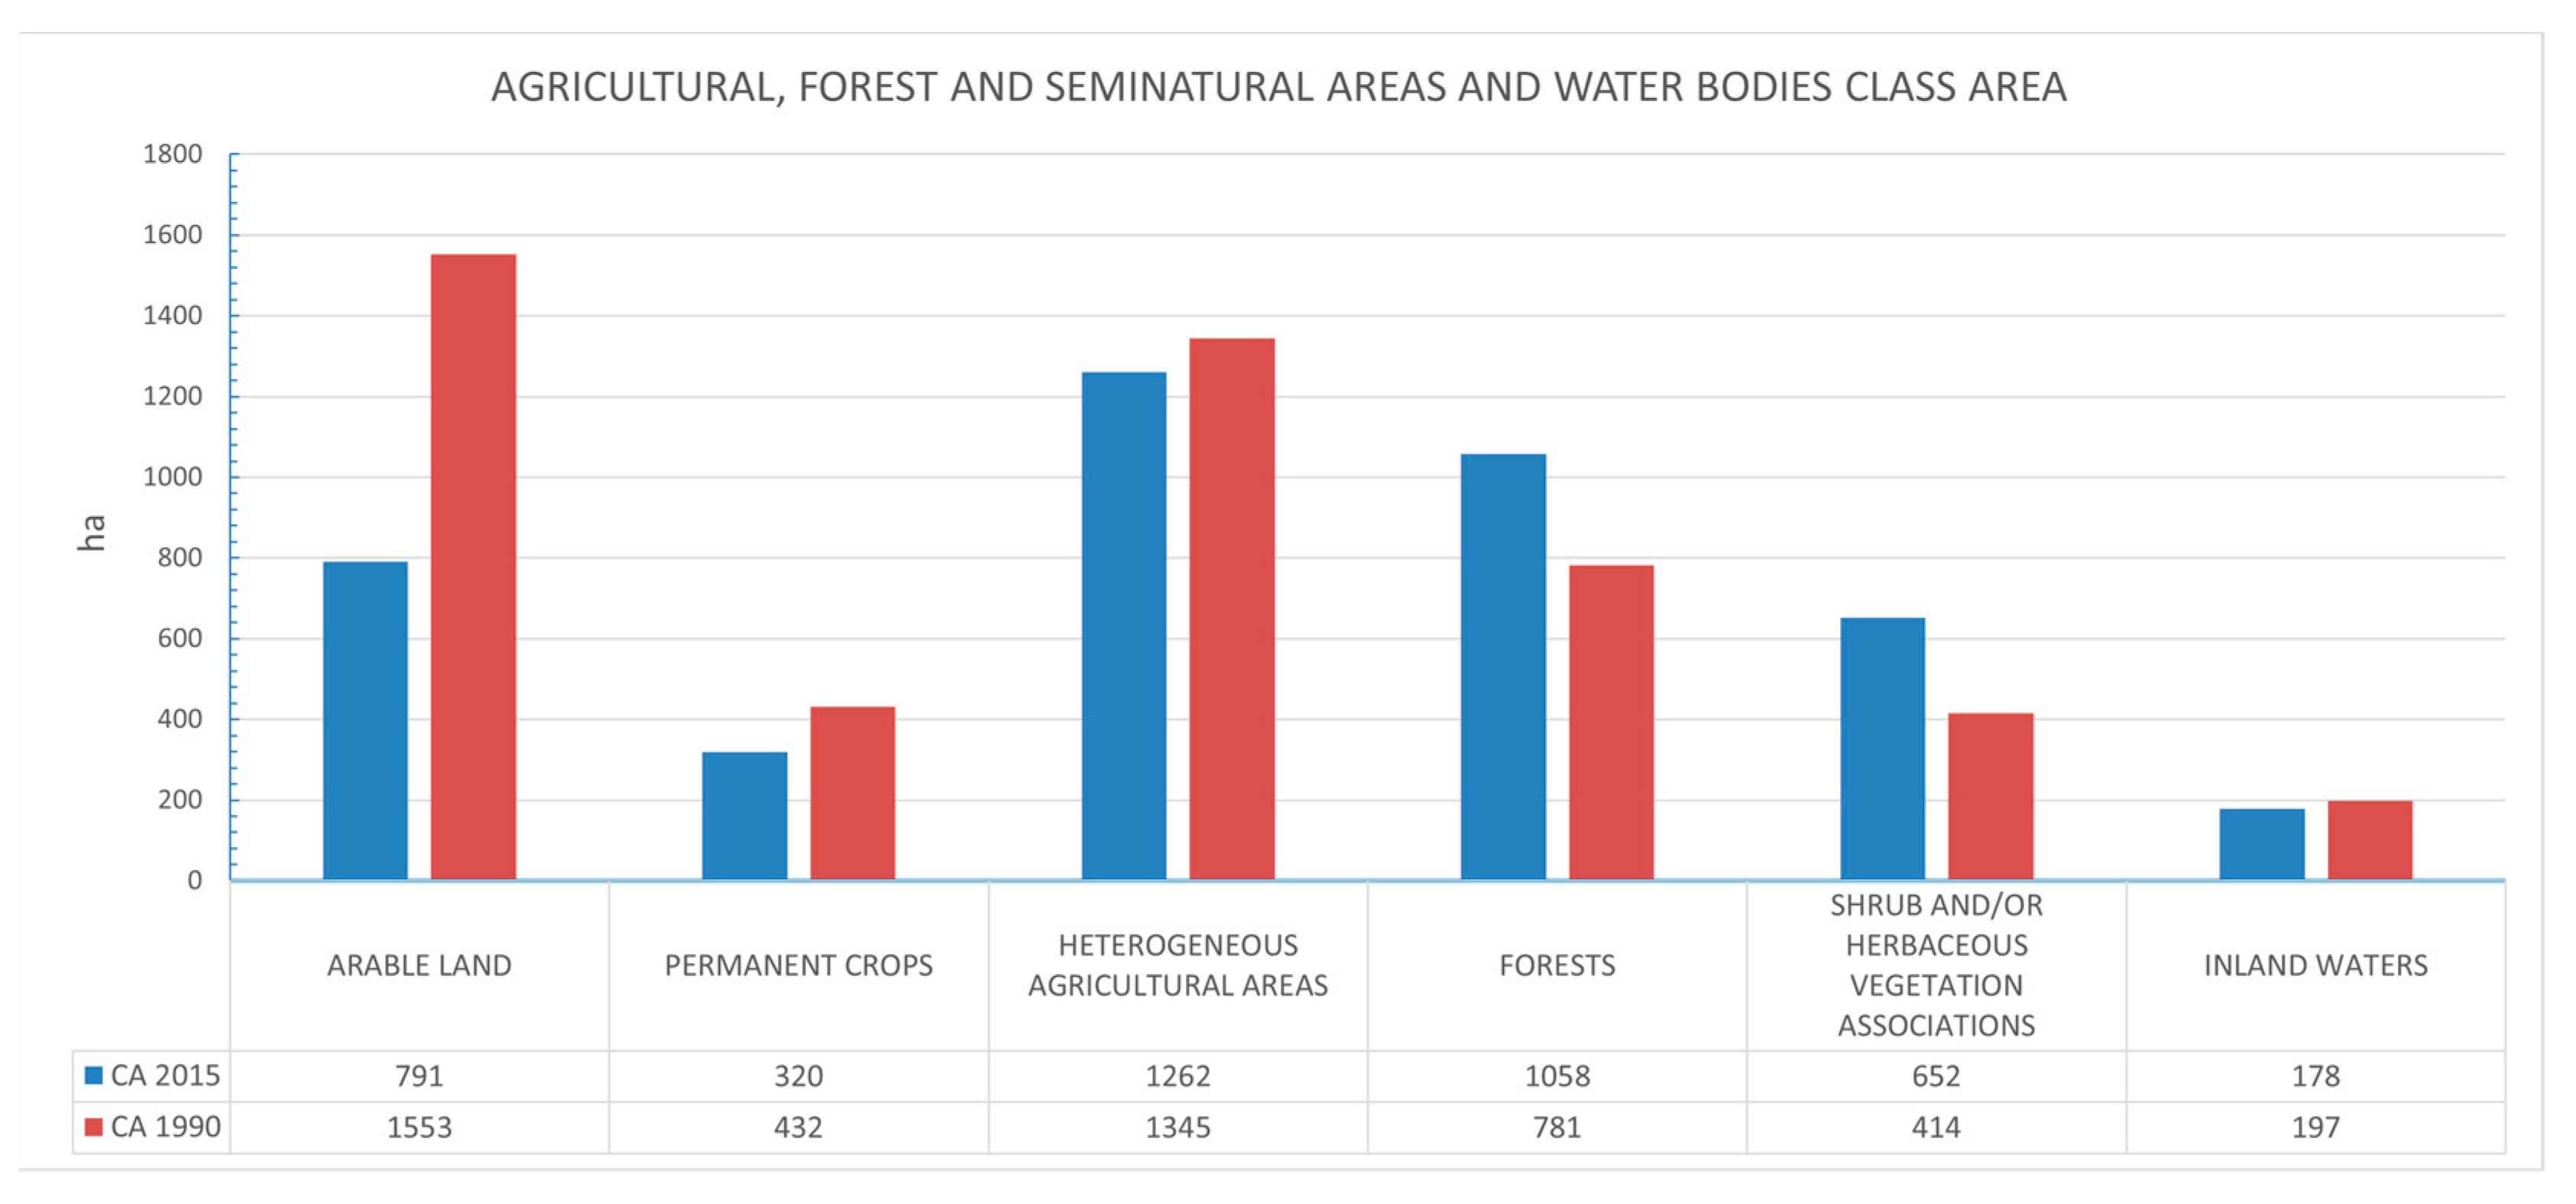
- the development of communities, expansion of urban fabric and enlargement of construction sites, which increased from 1990 to 2015, and diminished the land devoted to agriculture and forestry. The increase in the industrial areas from 1990 to 2015, with a percentage increase of 78.3%, occurred. As well as the artificial non-agricultural vegetated areas and the sport and leisure areas grew. Similarly, elements which play a key role in the landscape ecology, such as farmland for sowing, declined;
- matching the indicators detailed in the OSDDT Med Project, the intensity of soil consumption from 1990 to 2015 was 56.8%, while the average annual rate of increase in soil consumed was equal to 2.2%. As expected, the percentages of consumed soil were really more significant in the altimetric band < 270 m a.s.l., more devoted to urban expansion;
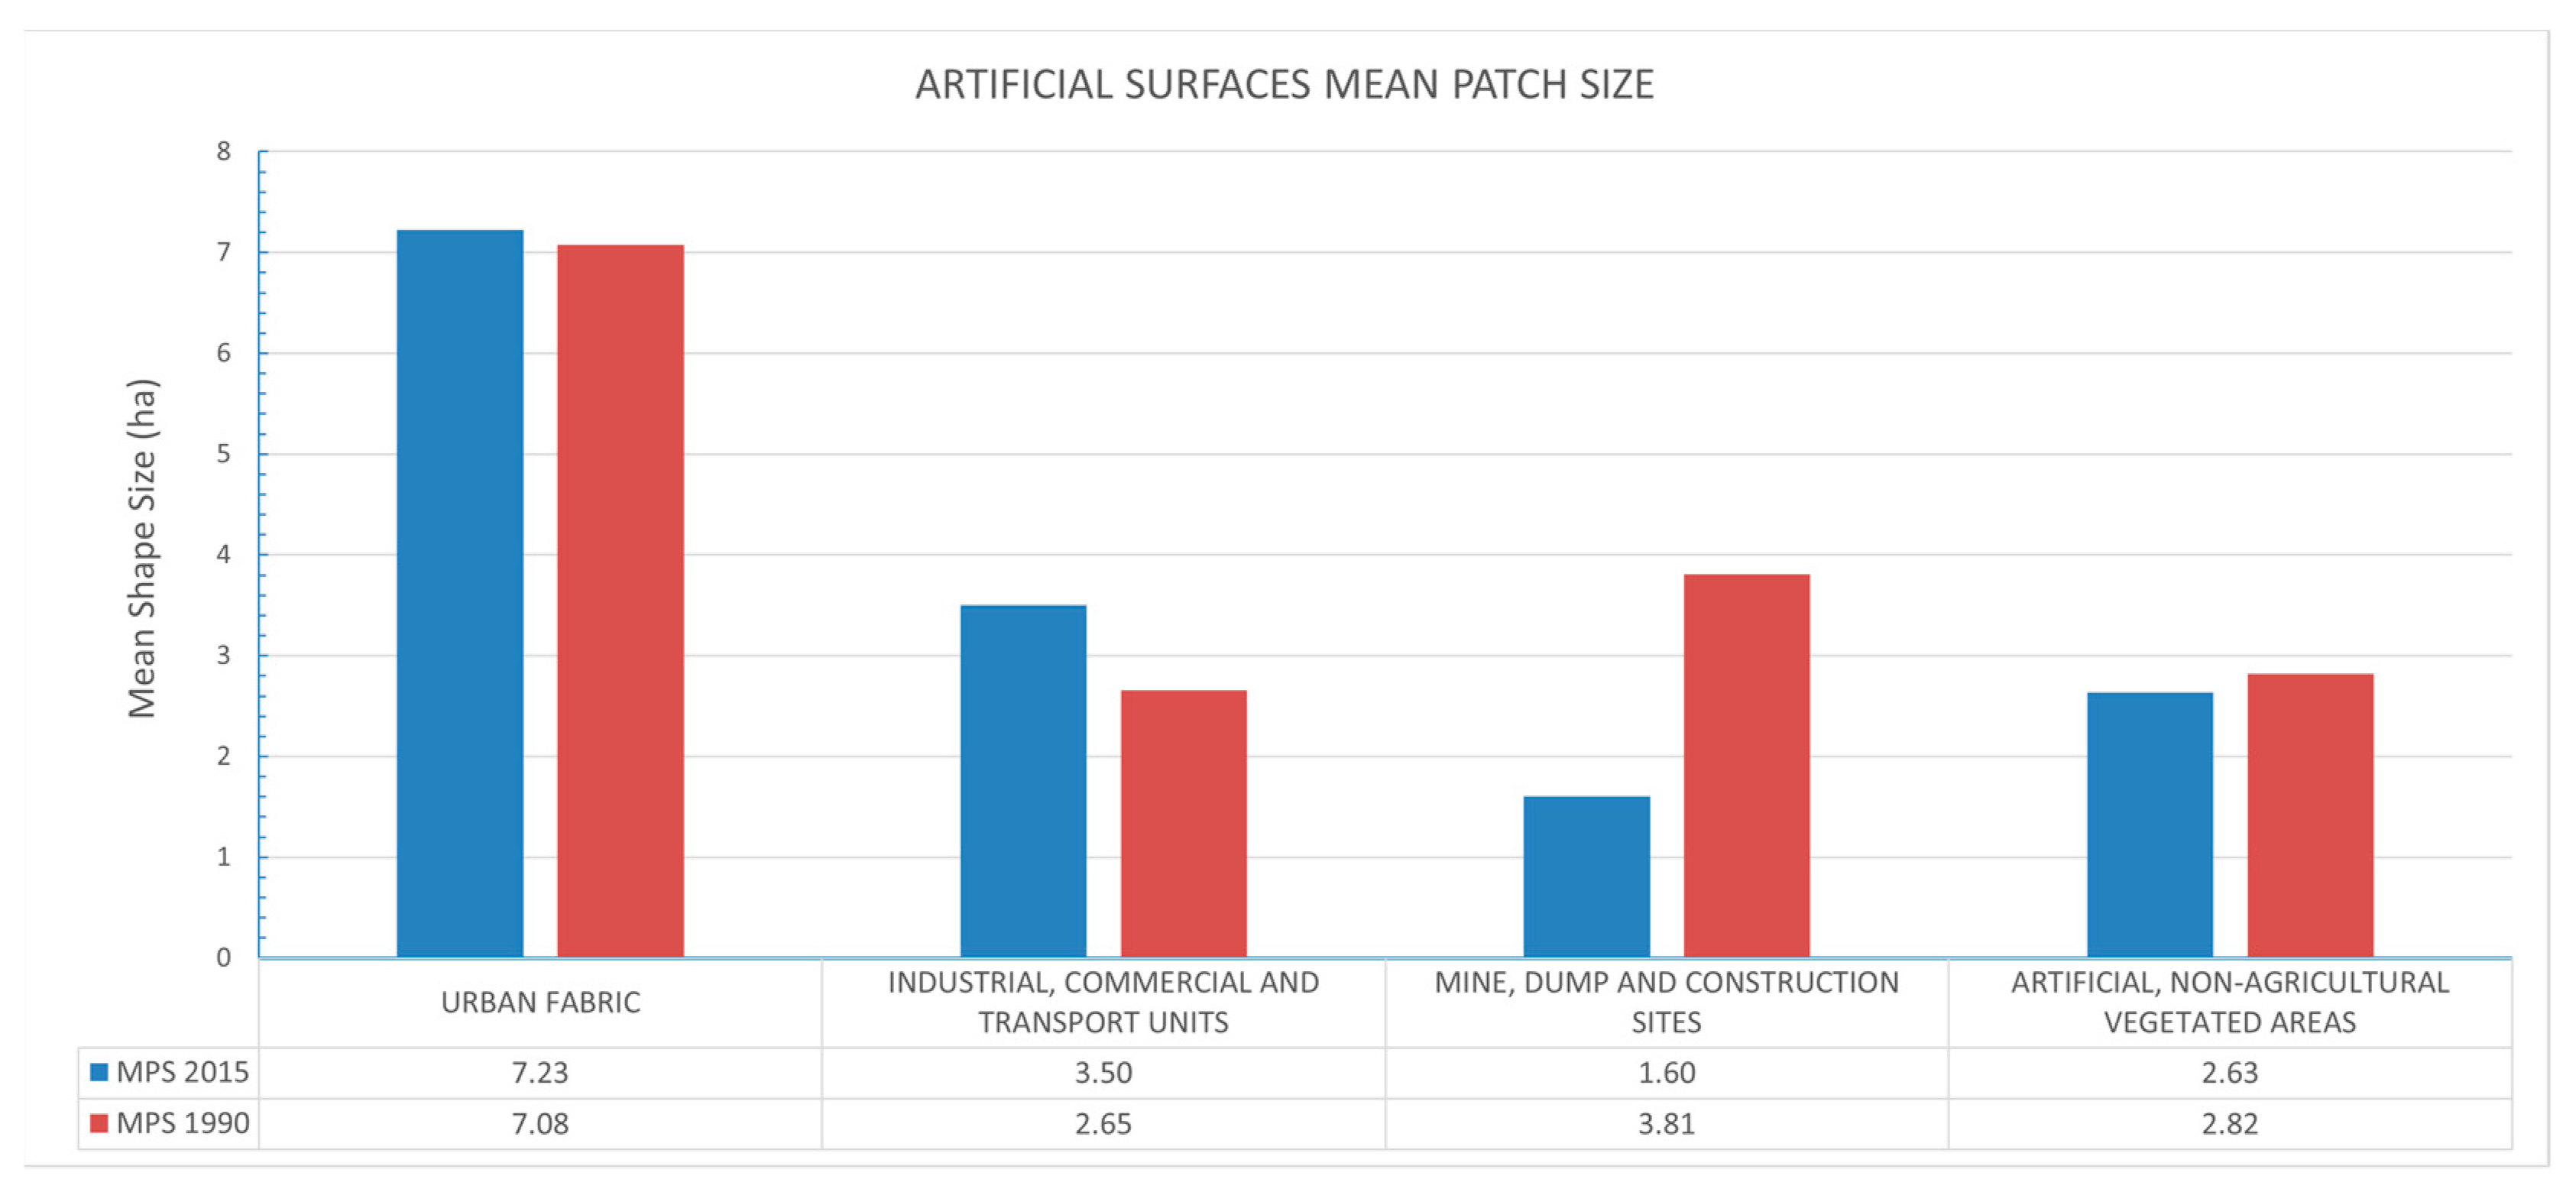
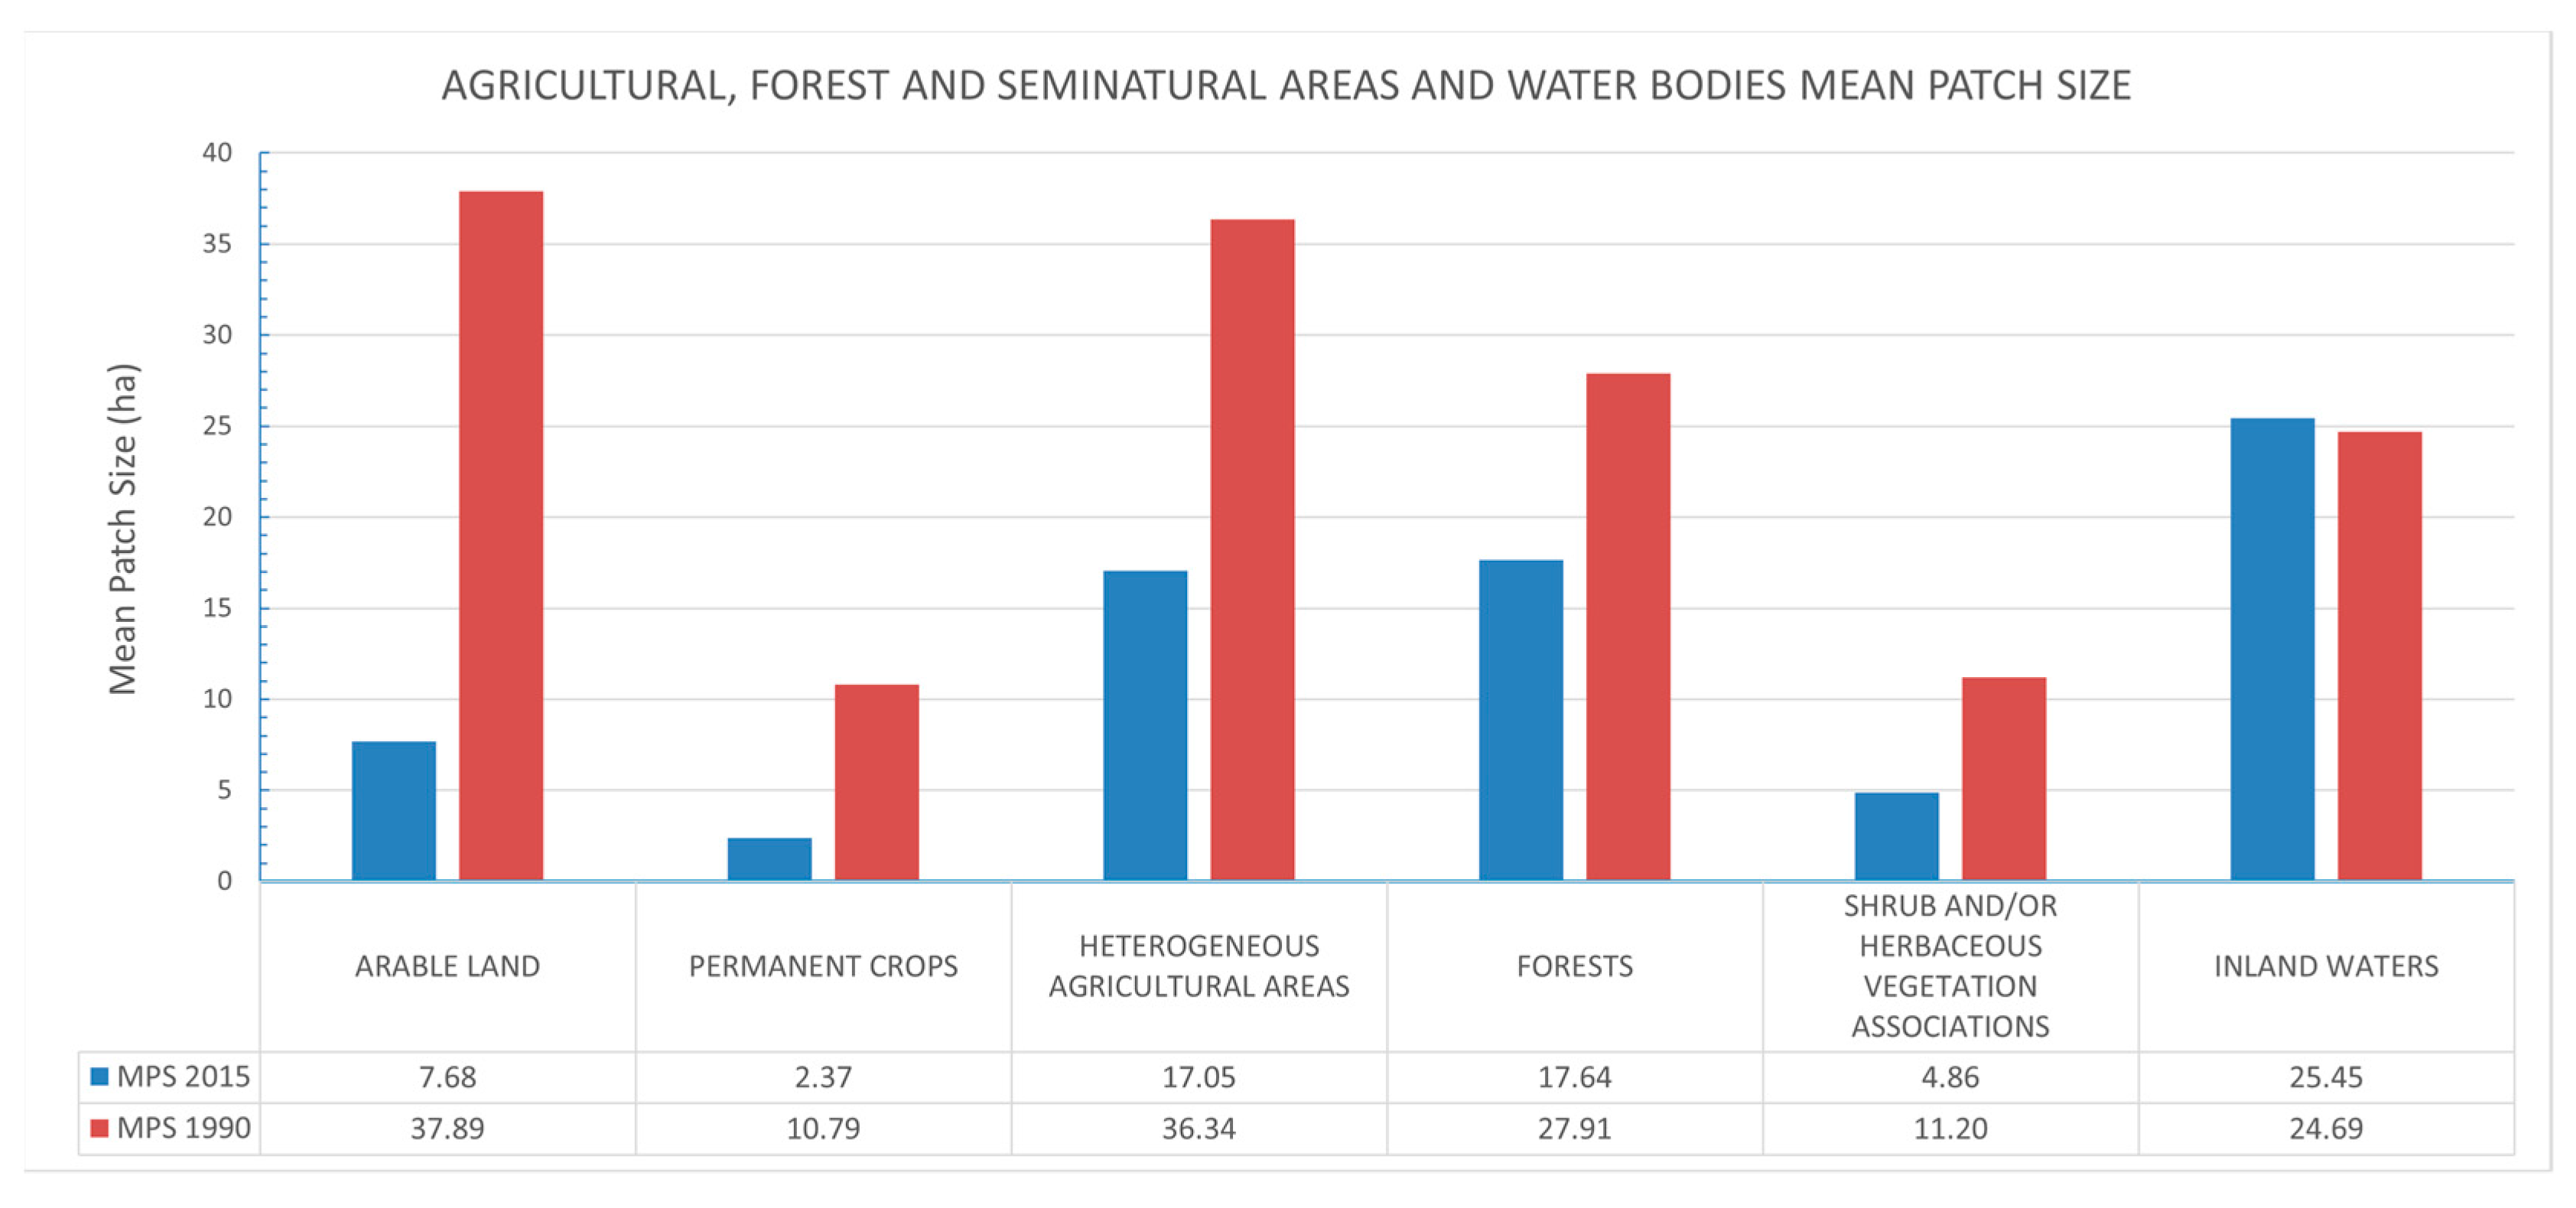
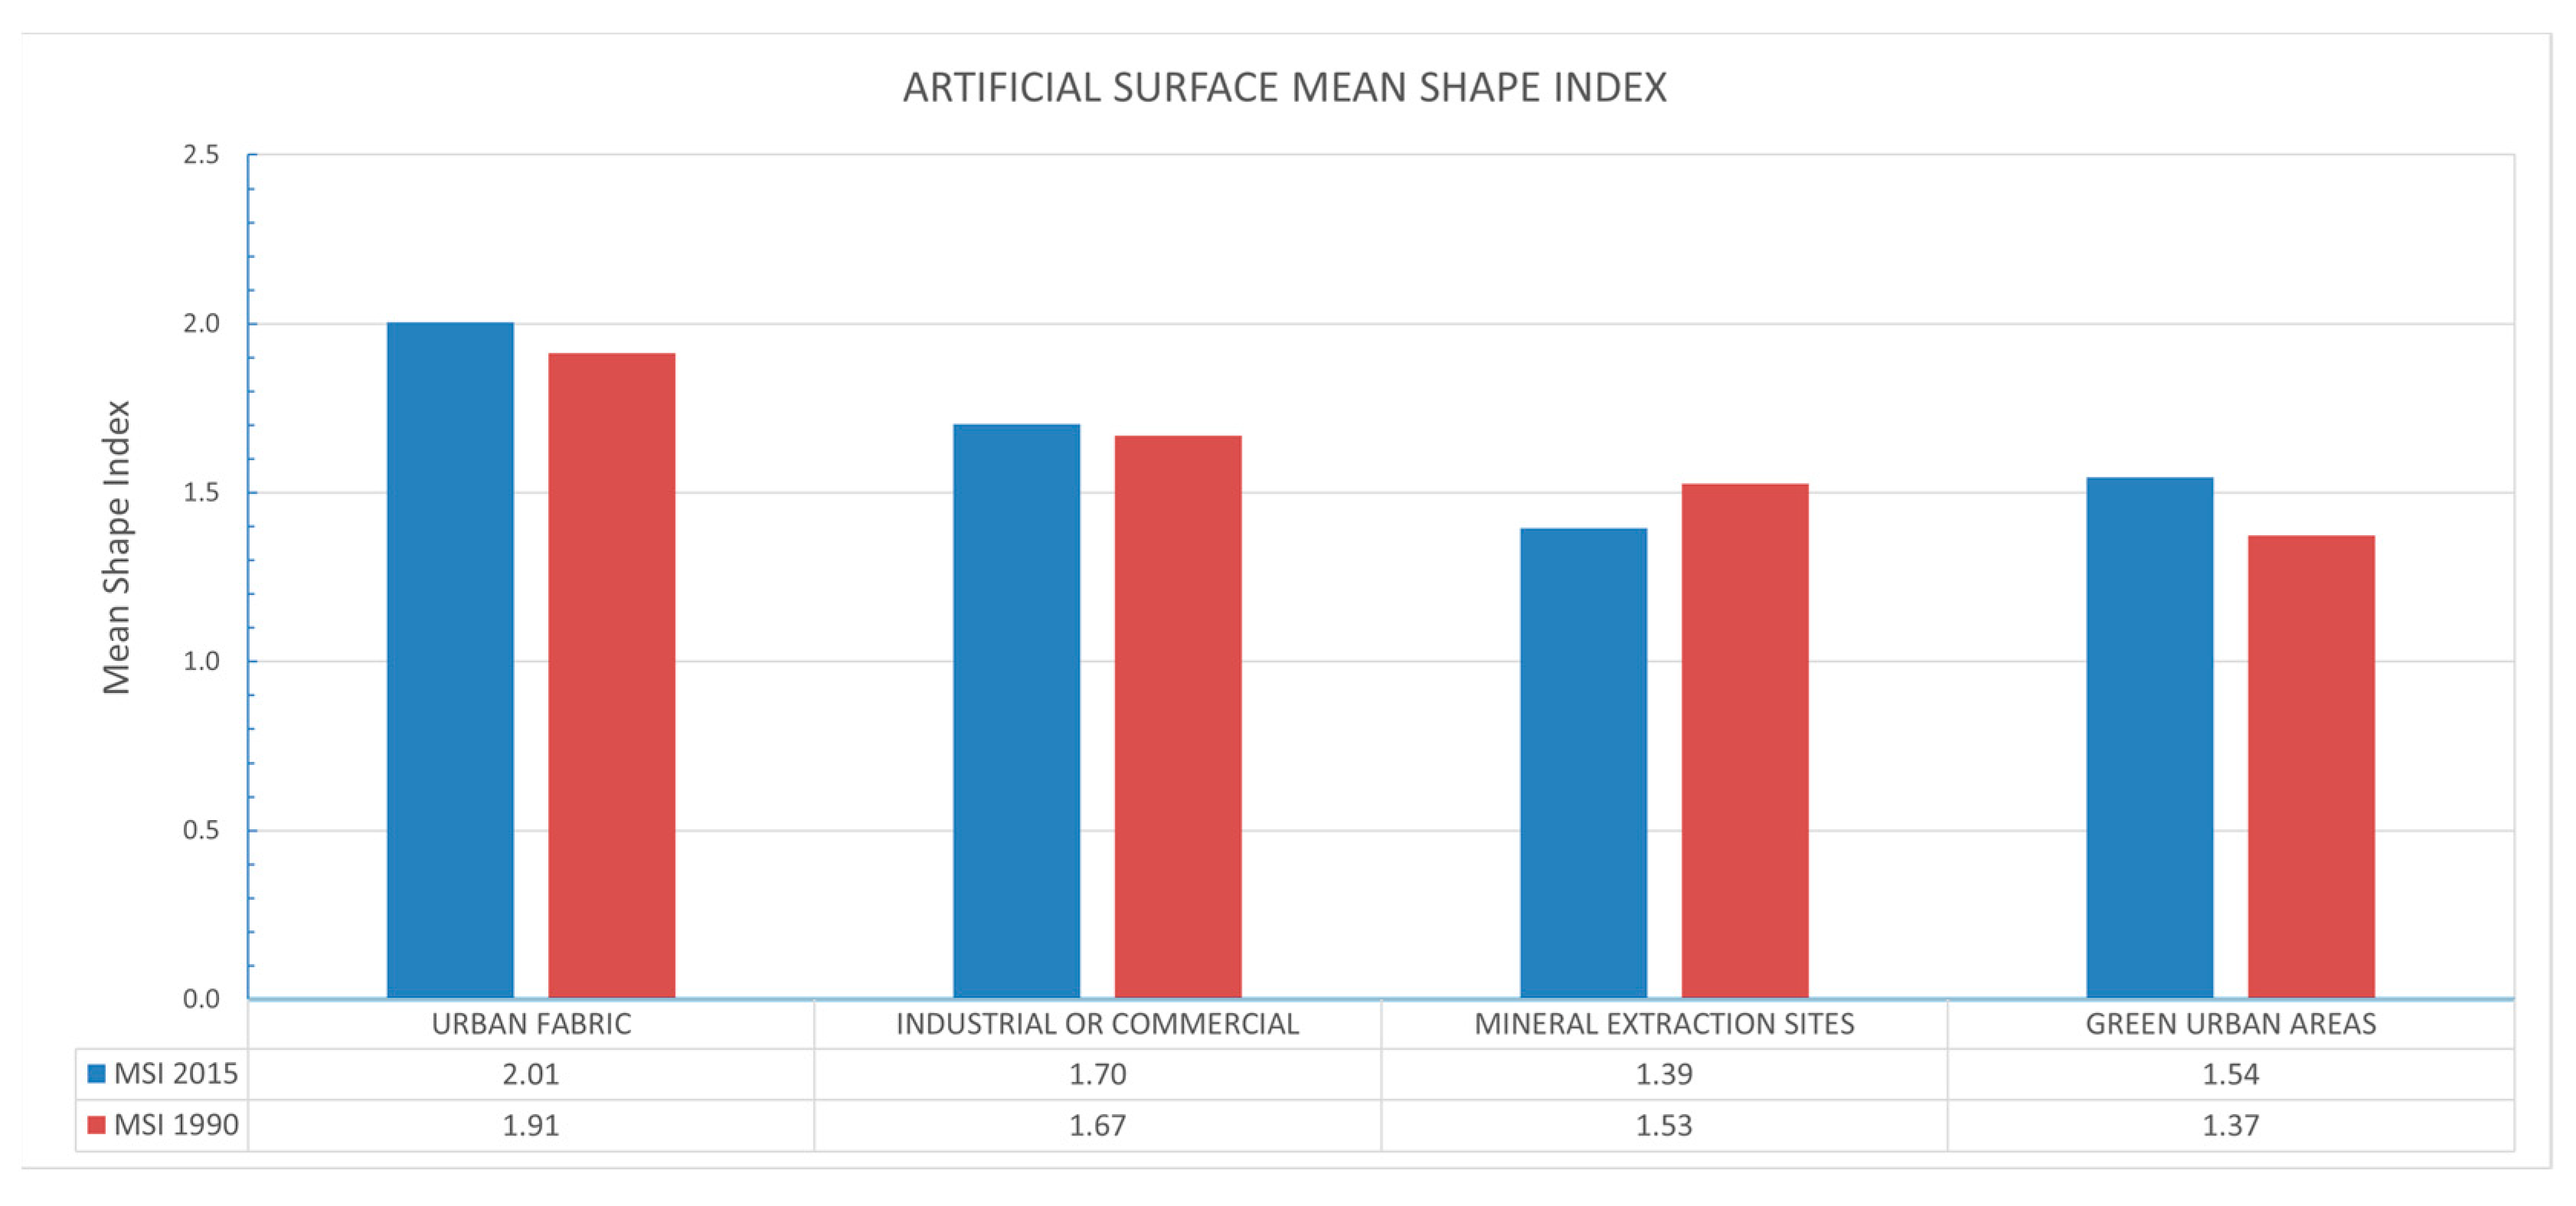
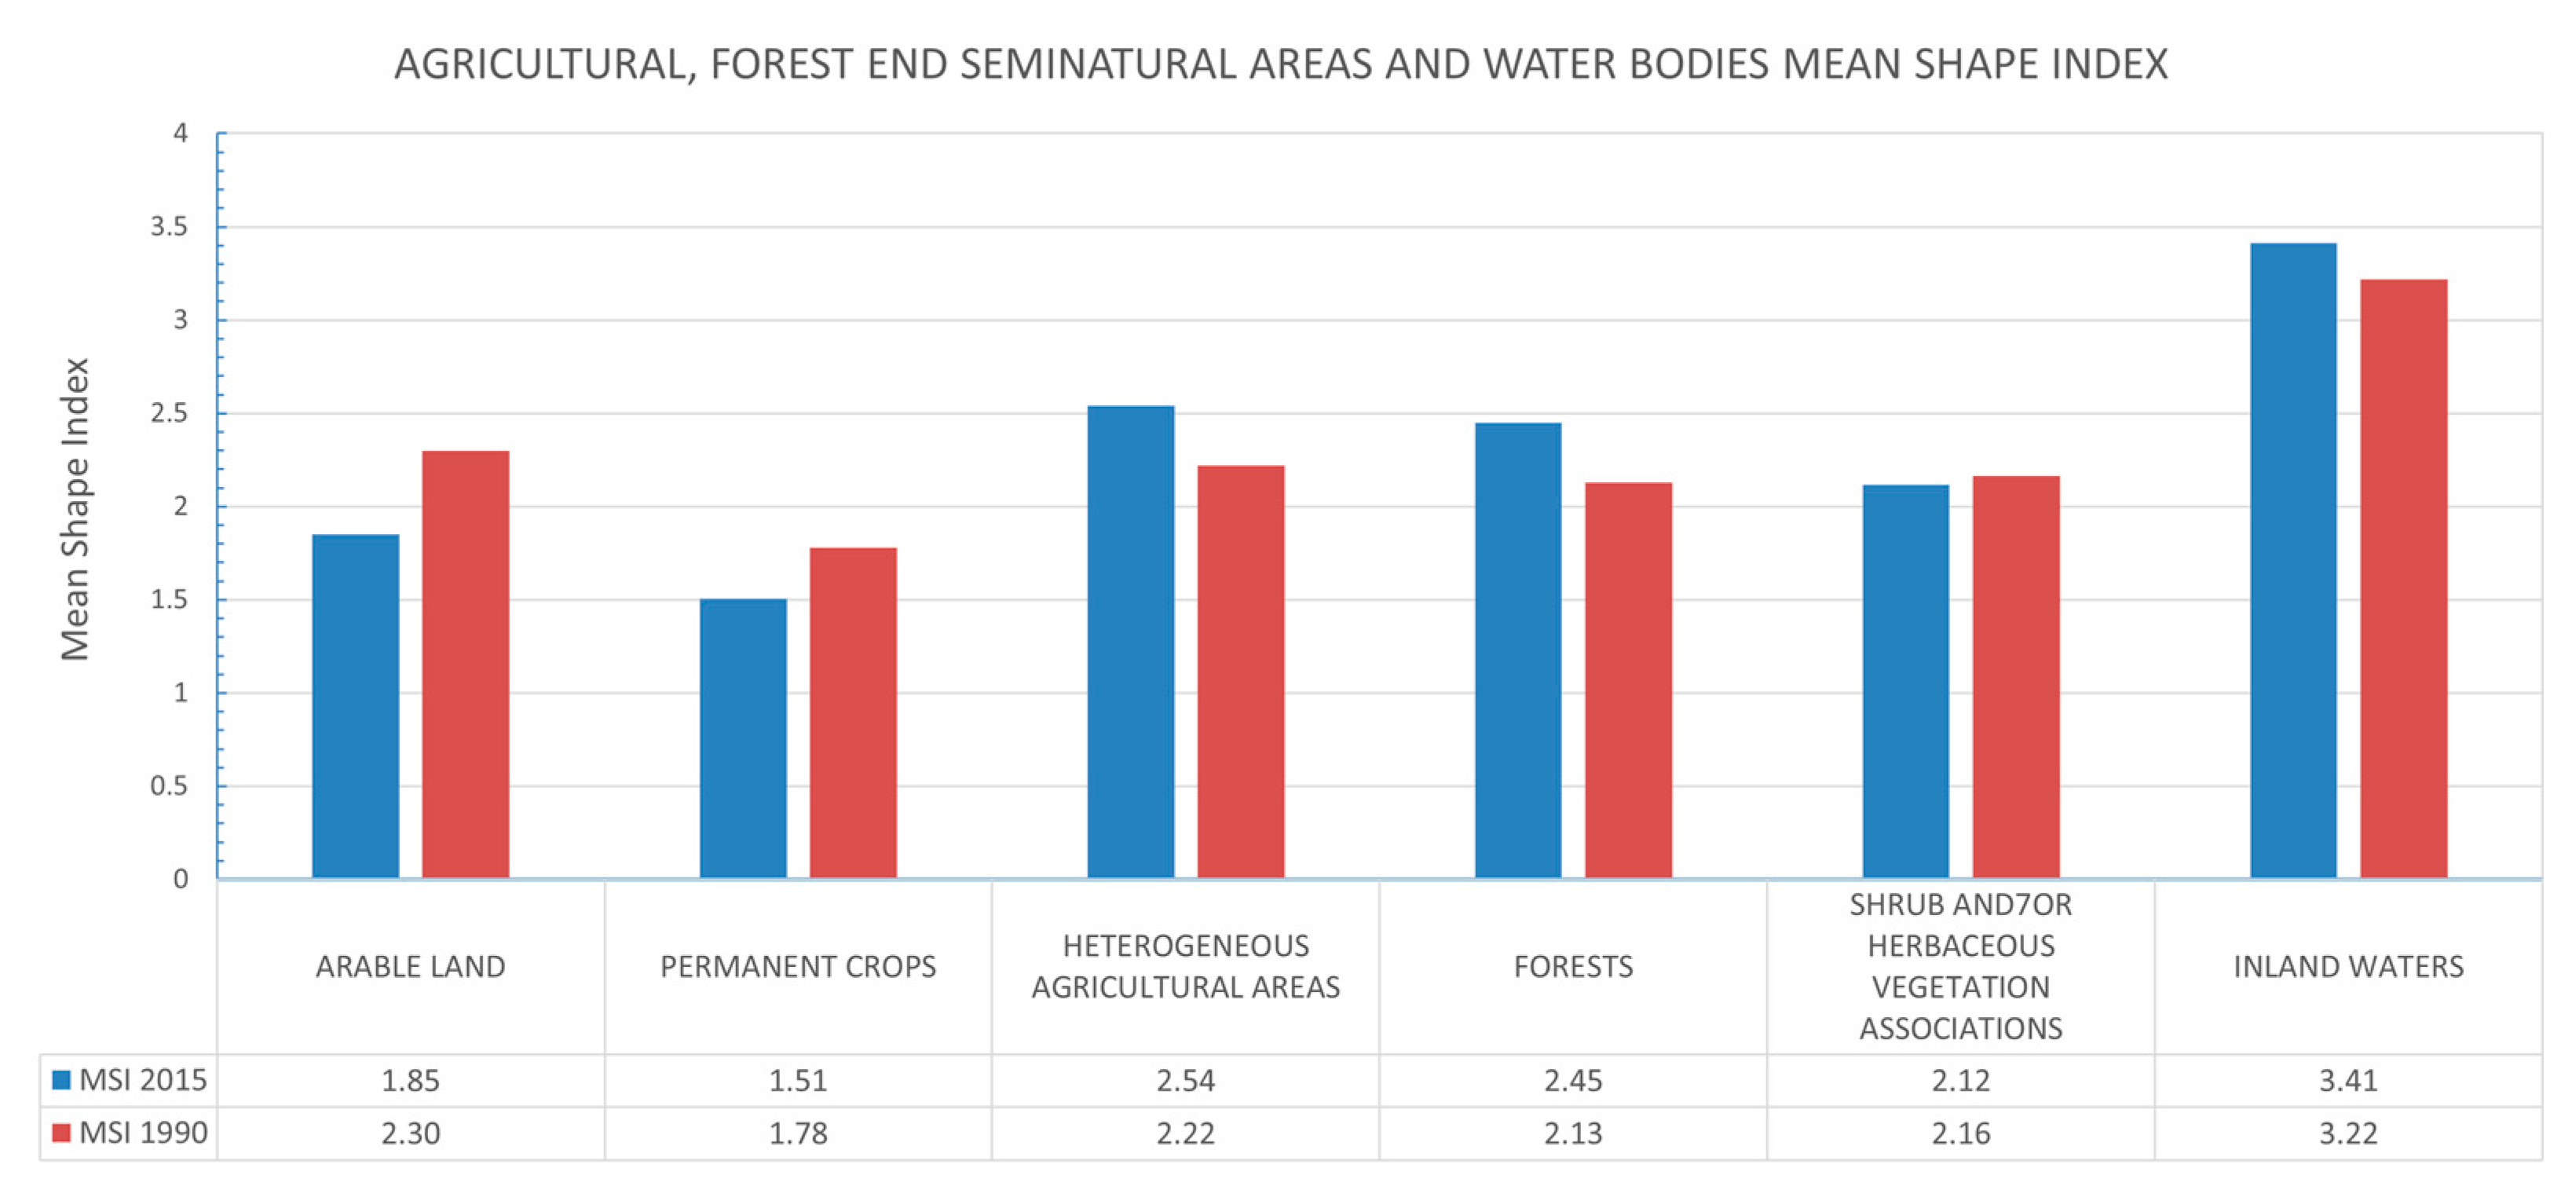
- Class Area index and Mean Patch Size confirmed this trend. The geometric complexity of patch shapes is subjected to a growth according to analysis of the MSI and the AWMSI. The analysis of the SHANNON indices revealed an increase in values over time.
Author Contributions
Funding
Data Availability Statement
Conflicts of Interest
References
- United Nations. The State of World Population 1999, 6 Billion: A Time for Choices; United Nations Population Fund: New York, NY, USA, 1999. [Google Scholar]
- Alberti, M. The effects of urban patterns on ecosystem function. Int. Reg. Sci. Rev. 2005, 28, 68–192. [Google Scholar] [CrossRef]
- Chakraborty, S.; Maity, I.; Dadashpoor, H.; Novotnẏ, J.; Banerji, S. Building in or out? Examining urban expansion patterns and land use efficiency across the global sample of 466 cities with million+ inhabitants. Habitat Int. 2022, 120, 102503. [Google Scholar] [CrossRef]
- Amponsah, O.; Blija, D.K.; Ayambire, R.A.; Takyi, S.A.; Mensah, H.; Braimah, I. Global urban sprawl containment strategies and their implications for rapidly urbanising cities in Ghana. Land Use Policy 2022, 114, 105979. [Google Scholar] [CrossRef]
- Eurostat. 2016. Available online: http://ec.europa.eu/eurostat/data/database (accessed on 15 June 2016).
- IEA—International Energy Agency. World Energy Outlook 2008; OECD/IEA: Paris, France, 2008. [Google Scholar]
- Arshad, S.; Ahmad, S.R.; Abbas, S.; Asharf, A.; Siddiqui, N.A.; Islam, Z.U. Quantifying the contribution of diminishing green spaces and urban sprawl to urban heat island effect in a rapidly urbanizing metropolitan city of Pakistan. Land Use Policy 2022, 113, 105874. [Google Scholar] [CrossRef]
- Li, S.; Liu, X.; Li, Z.; Wu, Z.; Yan, Z.; Chen, Y.; Gao, F. Spatial and Temporal Dynamics of Urban Expansion along the Guangzhou-Foshan Inter-City Rail Transit Corridor, China. Sustainability 2018, 10, 593. [Google Scholar] [CrossRef]
- Seto, K.C.; Reenberg, A.; Boone, C.G.; Fragkias, M.; Haase, D.; Langanke, T.; Marcotullio, P.; Munroe, D.K.; Olah, B.; Simon, D. Urban land teleconnections and sustainability. Proc. Natl. Acad. Sci. USA 2012, 109, 7687–7692. [Google Scholar] [CrossRef]
- Cicchella, D.; Zuzolo, D.; Albanese, S.; Fedele, L.; Di Tota, I.; Guagliardi, I.; Thiombane, M.; De Vivo, B.; Lima, A. Urban soil contamination in Salerno (Italy): Concentrations and patterns of major, minor, trace and ultra-trace elements in soils. J. Geochem. Explor. 2020, 213, 106519. [Google Scholar] [CrossRef]
- Cox, D.T.C.; Shanahan, D.F.; Hudson, H.L.; Fuller, R.A.; Gaston, K.J. The impact of urbanisation on nature dose and the implications for human health. Landsc. Urban Plan. 2018, 179, 72–80. [Google Scholar] [CrossRef]
- Cozza, V.; Guagliardi, I.; Rubino, M.; Cozza, R.; Martello, A.; Picelli, M.; Zhupa, E. ESOPO: sEnsors and SOcial POllution measurements. CEUR Workshop Proc. 2015, 1478, 52–57. [Google Scholar]
- Domingo, D.; Palka, G.; Hersperger, A.M. Effect of zoning plans on urban land-use change: A multi-scenario simulation for supporting sustainable urban growth. Sustain. Cities Soc. 2021, 69, 102833. [Google Scholar] [CrossRef]
- Nolè, G.; Lasaponara, R.; Lanorte, A.; Murgante, B. Quantifying Urban Sprawl with Spatial Autocorrelation Techniques using Multi-Temporal Satellite Data. Int. J. Agric. Environ. Inf. Syst. 2014, 5, 19–37. [Google Scholar] [CrossRef]
- Francis, R.A.; Millington, J.D.A.; Chadwick, M.A. Urban Landscape and Ecology; Routledge: Abingdon, UK; New York, NY, USA, 2016. [Google Scholar]
- Taghizadeh-Mehrjardi, R.; Schmidt, K.; Toomanian, N.; Heung, B.; Behrens, T.; Mosavi, A.; Band, S.S.; Amirian-Chakan, A.; Fathabadi, A.; Scholten, T. Improving the spatial prediction of soil salinity in arid regions using wavelet transformation and support vector regression models. Geoderma 2021, 383, 114793. [Google Scholar] [CrossRef]
- Emadi, M.; Taghizadeh-Mehrjardi, R.; Cherati, A.; Danesh, M.; Mosavi, A.; Scholten, T. Predicting and Mapping of Soil Organic Carbon Using Machine Learning Algorithms in Northern Iran. Remote Sens. 2020, 12, 2234. [Google Scholar] [CrossRef]
- Taghizadeh-Mehrjardi, R.; Emadi, M.; Cherati, A.; Heung, B.; Mosavi, A.; Scholten, T. Bio-Inspired Hybridization of Artificial Neural Networks: An Application for Mapping the Spatial Distribution of Soil Texture Fractions. Remote Sens. 2021, 13, 1025. [Google Scholar] [CrossRef]
- Uusi-Kämppäa, J.; Keskinen, R.; Heikkinen, J.; Guagliardi, I.; Nuutinen, V. A map-based comparison of chemical characteristics in the surface horizon of arable acid and non-acid sulfate soils in coastal areas of Finland. J. Geochem. Explor. 2019, 200, 193–200. [Google Scholar] [CrossRef]
- Haines-Young, R.; Potschin, M. Common International Classification of Ecosystem Services (CICES); Consultation on Version 4; Fabis Consulting, Ltd.: Nottingham, UK, 2013. [Google Scholar]
- Pindral, S.; Kot, R.; Hulisz, P.; Charzyński, P. Landscape metrics as a tool for analysis of urban pedodiversity. Land Degrad. Dev. 2020, 31, 2281–2294. [Google Scholar] [CrossRef]
- ISPRA—Istituto Superiore per la Protezione e la Ricerca Ambientale. Report 195/2014; ISPRA: Rome, Italy, 2014. [Google Scholar]
- EEA—European Environment Agency. Urban Sprawl in Europe—The Ignored Challenge; EEA Report No. 10; EEA: Copenhagen, Denmark, 2006. [Google Scholar]
- Mosavi, A.; Sajedi-Hosseini, F.; Choubin, B.; Taromideh, F.; Rahi, G.; Dineva, A.A. Susceptibility Mapping of Soil Water Erosion Using Machine Learning Models. Water 2020, 12, 1995. [Google Scholar] [CrossRef]
- Mosavi, A.; Samadianfar, S.; Darbandi, S.; Nabipour, N.; Qasem, S.N.; Salwana, E.; Band, S.S. Predicting soil electrical conductivity using multi-layer perceptron integrated with grey wolf optimizer. J. Geochem. Explor. 2021, 220, 106639. [Google Scholar] [CrossRef]
- Buttafuoco, G.; Guagliardi, I.; Tarvainen, T.; Jarva, J. A multivariate approach to study the geochemistry of urban topsoil in the city of Tampere, Finland. J. Geochem. Explor. 2017, 181, 191–204. [Google Scholar] [CrossRef]
- Guagliardi, I.; Cicchella, D.; De Rosa, R.; Ricca, N.; Buttafuoco, G. Geochemical sources of vanadium in soils: Evidences in a southern Italy area. J. Geochem. Explor. 2018, 184, 358–364. [Google Scholar] [CrossRef]
- Guagliardi, I.; Zuzolo, D.; Albanese, S.; Lima, A.; Cerino, P.; Pizzolante, A.; Thiombane, M.; De Vivo, B.; Cicchella, D. Uranium, thorium and potassium insights on Campania region (Italy) soils: Sources patterns based on compositional data analysis and fractal model. J. Geochem. Explor. 2020, 212, 106508. [Google Scholar] [CrossRef]
- Zuzolo, D.; Cicchella, D.; Lima, A.; Guagliardi, I.; Cerino, P.; Pizzolante, A.; Thiombane, M.; De Vivo, B.; Albanese, S. Potentially toxic elements in soils of Campania region (Southern Italy): Combining raw and compositional data. J. Geochem. Explor. 2020, 213, 106524. [Google Scholar] [CrossRef]
- UN-Habitat. Metadata on SDGs Indicator 11.3.1 Indicator Category: Tier II. Metadata on SDG Indicator 11.3.1. Available online: https://unhabitat.org/wp-content/uploads/2019/04/Metadata-on-SDG-Indicator-11.3.1.pdf (accessed on 10 May 2019).
- European Commission. Guidelines on Best Practice to Limit, Mitigate or Compensate Soil Sealing; SWD 101; European Environment Agency: Brussel, Belgium, 2012. [Google Scholar]
- ISPRA—Istituto Superiore per la Protezione e la Ricerca Ambientale. Consumo di Suolo, Dinamiche Territoriali e Servizi Ecosistemici; Rapporti 288/2018; ISPRA: Rome, Italy, 2018. [Google Scholar]
- Lambin, E.F.; Geist, H. Land-Use and Land Cover Change: Local Processes and Global Impacts; Springer: Berlin/Heidelberg, Germany, 2006. [Google Scholar]
- Strollo, A.; Smiraglia, D.; Bruno, R.; Assennato, F.; Congedo, L.; De Fioravante, P.; Giuliani, C.; Marinosci, I.; Riitano, N.; Munafò, M. Land consumption in Italy. J. Maps 2020, 16, 113–123. [Google Scholar] [CrossRef]
- European Commission. Data Specification on Land Use—Technical Guidelines. D2.8.III.4. 2013. Available online: https://inspire.ec.europa.eu/id/document/tg/lu (accessed on 1 January 2013).
- European Commission. Data Specification on Land Cover—Technical Guidelines. D2.8.II.2. Available online: https://inspire.ec.europa.eu/id/document/tg/lc (accessed on 1 January 2013).
- Godone, D.; Garbarino, M.; Sibona, E.; Garnero, G.; Godone, F. Progressive fragmentation of a traditional Mediterranean landscape by hazelnut plantations: The impact of CAP over time in the Langhe region (NW Italy). Land Use Policy 2014, 36, 259–266. [Google Scholar] [CrossRef]
- Lausch, A.; Herzog, F. Applicability of landscape metrics for the monitoring of landscape change: Issues of scale, resolution and interpretability. Ecol. Indic. 2002, 2, 3–15. [Google Scholar] [CrossRef]
- Malaviya, S.; Munsi, M.; Oinam, G.; Joshi, P.K. Landscape approach for quantifying land use land cover change (1972–2006) and habitat diversity in a mining area in Central India (Bokaro, Jharkhand). Environ. Monit. Assess. 2010, 170, 215–229. [Google Scholar] [CrossRef] [PubMed]
- Sun, C.; Wu, Z.F.; Lv, Z.Q.; Yao, N.; We, J.B. Quantifying different types of urban growth and the change dynamic in Guangzhou using multi-temporal remote sensing data. Int. J. Appl. Earth Obs. Geoinf. 2013, 21, 409–417. [Google Scholar] [CrossRef]
- Zhou, X.; Wang, Y.C. Spatial-temporal dynamics of urban green space in response to rapid urbanization and greening policies. Landsc. Urban Plan. 2011, 100, 268–277. [Google Scholar] [CrossRef]
- Antrop, M. Landscape change: Plan or chaos? Landsc. Urban Plan. 1998, 41, 155–161. [Google Scholar] [CrossRef]
- Bürgi, M.; Russell, E.W.B. Integrative methods to study landscape changes. Land Use Policy 2001, 18, 9–16. [Google Scholar] [CrossRef]
- Coppin, P.; Jonckheere, I.; Nackaerts, K.; Muys, B.; Lambin, E. Digital change detection methods in ecosystem monitoring: A review. Int. J. Remote Sens. 2004, 25, 1565–1596. [Google Scholar] [CrossRef]
- Ricca, N.; Guagliardi, I. Multi-temporal dynamics of land use patterns in a Site of Community Importance in southern Italy. Appl. Ecol. Environ. Res. 2015, 13, 677–691. [Google Scholar]
- Guagliardi, I.; Cicchella, D.; De Rosa, R. A geostatistical approach to assess concentration and spatial distribution of heavy metals in urban soils. Water Air Soil Pollut. 2012, 223, 5983–5998. [Google Scholar] [CrossRef]
- Pellicone, G.; Caloiero, T.; Guagliardi, I. The De Martonne aridity index in Calabria (Southern Italy). J. Maps 2019, 15, 788–796. [Google Scholar] [CrossRef]
- Ricca, N.; Guagliardi, I. Monitoring Urban Growth Evolution by Multi-temporal Dynamics Analysis in a Southern Italy Area. In New Metropolitan Perspectives. NMP 2020. Smart Innovation, Systems and Technologies; Bevilacqua, C., Calabrò, F., Della Spina, L., Eds.; Springer: Cham, Switzerland, 2020; Volume 178. [Google Scholar] [CrossRef]
- Tansi, C.; Folino Gallo, M.; Muto, F.; Perrotta, P.; Russo, L.; Critelli, S. Seismotectonics and landslides of the Crati Graben (Calabrian Arc, Southern Italy). J. Maps 2016, 12, 363–372. [Google Scholar] [CrossRef]
- Iovine, G.; Guagliardi, I.; Bruno, C.; Greco, R.; Tallarico, A.; Falcone, G.; Lucà, F.; Buttafuoco, G. Soil-gas radon anomalies in three study areas of Central-Northern Calabria (Southern Italy). Nat. Hazards 2018, 91, 193–219. [Google Scholar] [CrossRef]
- Gaglioti, S.; Infusino, E.; Caloiero, T.; Callegari, G.; Guagliardi, I. Geochemical Characterization of Spring Waters in the Crati River Basin, Calabria (Southern Italy). Geofluids 2019, 2019, 3850148. [Google Scholar] [CrossRef]
- Infusino, E.; Guagliardi, I.; Gaglioti, S.; Caloiero, T. Vulnerability to Nitrate Occurrence in the Spring Waters of the Sila Massif (Calabria, Southern Italy). Toxics 2022, 10, 137. [Google Scholar] [CrossRef]
- ARSSA (Agenzia Regionale per lo Sviluppo e per i Servizi in Agricoltura). I Suoli Della Calabria. Carta dei Suoli in Scala 1:250000 Della Regione Calabria; Monografia divulgativa: Programma Interregionale Agricoltura-Qualità e Misura 5; ARSSA, Servizio Agropedologia. Rubbettino: Catanzaro, Italy, 2003. [Google Scholar]
- IUSS Working Group WRB. World Reference Base for Soil Resources 2014, International Soil Classification System for Naming Soils and Creating Legends for Soil Maps; World Soil Resources Reports No. 106; FAO: Rome, Italy, 2014. [Google Scholar]
- Guagliardi, I.; Rovella, N.; Apollaro, C.; Bloise, A.; De Rosa, R.; Scarciglia, F.; Buttafuoco, G. Modelling seasonal variations of natural radioactivity in soils: A case study in southern Italy. J. Earth Syst. Sci. 2016, 8, 1569–1578. [Google Scholar] [CrossRef]
- Caloiero, T.; Callegari, G.; Cantasano, N.; Coletta, V.; Pellicone, G.; Veltri, A. Bioclimatic analysis in a region of southern Italy (Calabria). Plant Biosyst. 2016, 150, 1282–1295. [Google Scholar] [CrossRef]
- Coscarelli, R.; Gaudio, R.; Caloiero, T. Climatic trends: An investigation for a Calabrian basin (southern Italy). IAHS AISH Publication 2004, 286, 255–266. [Google Scholar]
- Sirangelo, B.; Caloiero, T.; Coscarelli, R.; Ferrari, E. A stochastic model for the analysis of the temporal change of dry spells. Stoch. Environ. Res. Risk Assess. 2015, 29, 143–155. [Google Scholar] [CrossRef]
- Buttafuoco, G.; Caloiero, T.; Guagliardi, I.; Ricca, N. Drought assessment using the reconnaissance drought index (RDI) in a southern Italy region. In Proceedings of the 6th IMEKO TC19 Symposium on Environmental Instrumentation and Measurements, Reggio Calabria, Italy, 24–25 June 2016; pp. 52–55. [Google Scholar]
- Buttafuoco, G.; Caloiero, T.; Ricca, N.; Guagliardi, I. Assessment of drought and its uncertainty in a southern Italy area (Calabria region). Measurement 2018, 113, 205–210. [Google Scholar] [CrossRef]
- Pellicone, G.; Caloiero, T.; Modica, G.; Guagliardi, I. Application of several spatial interpolation techniques to monthly rainfall data in the Calabria region (southern Italy). Int. J. Climatol. 2018, 38, 3651–3666. [Google Scholar] [CrossRef]
- Guagliardi, I.; Cicchella, D.; De Rosa, R.; Buttafuoco, G. Assessment of lead pollution in topsoils of a southern Italy area: Analysis of urban and peri-urban environment. J. Environ. Sci. 2015, 33, 179–187. [Google Scholar] [CrossRef]
- Guagliardi, I.; Rovella, N.; Apollaro, C.; Bloise, A.; De Rosa, R.; Scarciglia, F.; Buttafuoco, G. Effects of source rocks, soil features and climate on natural gamma radioactivity in the Crati valley (Calabria, Southern Italy). Chemosphere 2016, 150, 97–108. [Google Scholar] [CrossRef]
- Esri. World Topographic Map. 19 February 2012. Available online: http://www.arcgis.com/home/item.html?id=30e5fe3149c34df1ba922e6f5bbf808f (accessed on 14 June 2013).
- ESRI. ArcGIS; version 9.2; ESRI: Redlands, CA, USA, 2006. [Google Scholar]
- Tewabe, D.; Fentahun, T. Assessing land use and land cover change detection using remote sensing in the Lake Tana Basin, Northwest Ethiopia. Cogent Environ. Sci. 2020, 6, 177899. [Google Scholar] [CrossRef]
- Singh, A. Digital change detection techniques using remotely-sensed data. Int. J. Remote Sens. 1989, 10, 989–1003. [Google Scholar] [CrossRef]
- Getu, K.; Bhat, H.G. Analysis of spatio-temporal dynamics of urban sprawl and growth pattern using geospatial technologies and landscape metrics in Bahir Dar, Northwest Ethiopia. Land Use Policy 2021, 109, 105676. [Google Scholar] [CrossRef]
- Liu, H.; Zhou, Q. Accuracy analysis of remote sensing change detection by rule-based rationality evaluation with post-classification comparison. Int. J. Remote Sens. 2004, 25, 1037–1050. [Google Scholar] [CrossRef]
- Aspinall, R.J.; Hill, M.J. Land cover change: A method for assessing the reliability of land cover changes measured from remotely-sensed data. In Proceedings of the International Symposium on Geoscience and Remote Sensing, Singapore, 3–8 August 1997; pp. 269–271. [Google Scholar]
- Campbell, J.B.; Wynne, R.H. Introduction to Remote Sensing, 5th ed.; Guilford Press: New York, NY, USA, 2011. [Google Scholar]
- Feranec, J.; Soukup, T.; Hazeu, G.; Jaffrain, G. (Eds.) European Landscape Dynamics. Corine Land Cover Data; CRC-Press: Boca Raton, CA, USA, 2016. [Google Scholar]
- Aune-Lundberg, L.; Strand, G.-H. The content and accuracy of the CORINE Land Cover dataset for Norway. Int. J. Appl. Earth Obs. Geoinf. 2021, 96, 102266. [Google Scholar] [CrossRef]
- Jaeger, J.A.G. Landscape division, splitting index, and effective mesh size: New measures of landscape fragmentation. Landsc. Ecol. 2000, 15, 115–130. [Google Scholar] [CrossRef]
- Forman, R.T.T.; Godron, M. Landscape Ecology; John Wiley and Sons: New York, NY, USA, 1986. [Google Scholar]
- Gustafson, E.J.; Parker, G.R. Relationships between landcover proportion and indices of landscape spatial pattern. Lands. Ecol. 1992, 7, 101–110. [Google Scholar] [CrossRef]
- Li, H.; Reynolds, J.F. A new contagion index to quantify spatial patterns of landscapes. Landsc. Ecol. 1993, 8, 155–162. [Google Scholar] [CrossRef]
- McGarigal, K.; Marks, B. FRAGSTATS: Spatial Analysis Program for Quantifying Landscape Structure; Gen. Tech. Rep. PNW-GTR-351; USDA Forest Service: Portland, OR, USA, 1995. [Google Scholar]
- Milne, B.T. Lessons from Applying Fractal Models to Landscape Patterns. In Quantitative Methods in Landscape Ecology; Turner, M.G., Gardner, R.H., Eds.; Springer: New York, NY, USA, 1991; pp. 199–235. [Google Scholar]
- Musick, H.B.; Grover, H.D. Image textural measures as indices of landscape pattern. In Quantitative Methods in Landscape Ecology; Turner, M.G., Gardner, R.H., Eds.; Springer: New York, NY, USA, 1991; pp. 289–307. [Google Scholar]
- O’Neill, R.V.; Krummel, J.R.; Gardner, R.H.; Sugihara, G.; Jackson, B.; DeAngelis, D.L.; Milne, B.T.; Turner, M.G.; Zygmunt, B.; Christensen, S.W.; et al. Indices of landscape pattern. Landsc. Ecol. 1988, 1, 153–162. [Google Scholar] [CrossRef]
- Turner, M.G. Spatial and temporal analysis of landscape patterns. Lands. Ecol. 1990, 4, 21–30. [Google Scholar] [CrossRef]
- Nong, D.H.; Lepczyk, C.A.; Miura, T.; Fox, J.M. Quantifying urban growth patterns in Hanoi using landscape expansion modes and time series spatial metrics. PLoS ONE 2018, 13, 0196940. [Google Scholar] [CrossRef]
- Reis, J.P.; Silva, E.A.; Pinho, P. Spatial metrics to study urban patterns in growing and shrinking cities. Urban Geogr. 2016, 37, 246–271. [Google Scholar] [CrossRef]
- OSDDT. Med Project—Land Use and Sustainable Development of Territories of Mediterranean Areas. 2014. Available online: https://www.programmemed.eu/index.php?id=5175&L=1 (accessed on 31 May 2013).
- Turner, M.G.; Gardner, R.H. Quantitative Methods in Landscape Ecology; Springer: New York, NY, USA, 1991. [Google Scholar]
- Kupfer, J.A. Theory in Landscape Ecology and Its Relevance to Bio-Geography. In The SAGE Handbook of Biogeography; Sage: Thousand Oaks, CA, USA, 2011. [Google Scholar]
- Turner, M.G. Landscape ecology: What is the state of the science? Annu. Rev. Ecol. Evol. Syst. 2005, 36, 319–344. [Google Scholar] [CrossRef]
- Wu, J.; Hobbs, R. Key issues and research priorities in landscape ecology: An idiosyncratic synthesis. Landsc. Ecol. 2002, 17, 355–365. [Google Scholar] [CrossRef]
- Li, H.; Wu, J. Use and misuse of landscape indices. Landsc. Ecol. 2004, 19, 389–399. [Google Scholar] [CrossRef]
- Li, W.; Chen, T.; Wentz, E.A.; Fan, C. NMMI: A mass compactness measure for spatial pattern analysis of areal features. Ann. Am. Assoc. Geogr. 2014, 104, 1116–1133. [Google Scholar] [CrossRef]
- Dadashpoor, H.; Azizi, P.; Moghadasi, M. Land use change, urbanization, and change in landscape pattern in a metropolitan area. Sci. Total Environ. 2019, 655, 707–719. [Google Scholar] [CrossRef] [PubMed]
- Li, H.; Peng, J.; Liu, Y.; Hu, Y. Urbanization impact on landscape patterns in Beijing City, China: A spatial heterogeneity perspective. Ecol. Indic. 2017, 82, 50–60. [Google Scholar] [CrossRef]
- Fenta, A.A.; Yasuda, H.; Haregeweyn, N.; Belay, A.S.; Hadush, Z.; Gebremedhin, M.A.; Mekonnen, G. The dynamics of urban expansion and land use/land cover changes using remote sensing and spatial metrics: The case of Mekelle City of northern Ethiopia. Int. J. Remote Sens. 2017, 38, 4107–4129. [Google Scholar] [CrossRef]
- Salem, M.; Tsurusaki, N.; Divigalpitiya, P. Land use/land cover change detection and urban sprawl in the peri-urban area of greater Cairo since the Egyptian revolution of 2011. J. Land Use Sci. 2019, 15, 592–606. [Google Scholar] [CrossRef]
- Mariwah, S.; Osei, K.N.; Amenyo-Xa, M.S. Urban land use/land cover changes in the Tema metropolitan area (1990–2010). GeoJournal 2015, 82, 247–258. [Google Scholar] [CrossRef]

| Artificial Surfaces | Agricultural Areas | Forest and Seminatural Areas | Water Bodies |
|---|---|---|---|
Urban fabric
| Arable land
| Forests
| Inland waters
|
Industrial, commercial and transport units
| Permanent crops
| Shrub and/or herbaceous vegetation associations
| |
Mine, dump and construction sites
| Heterogeneous agricultural areas
| ||
Artificial, non-agricultural vegetated areas
|
| Index Class | Index | Description |
|---|---|---|
| Patch Density and Metrics | Number of Patches (NumP) Mean Patch Size (MPS) Median Patch Size (MedPS) Patch Size Standard Deviation (PSSD) Patch Size Coefficient of Variance (PSCoV) | Number of patches at the class level Average patch size for a class 50th percentile of patch size Standard Deviation of patch areas Coefficient of variation of patches |
| Shape Metrics | Mean Shape Index (MSI) Area Weighted Mean Shape Index (AWMSI) Mean Perimeter–Area Ratio (MPAR) | Deviation of each patch from circular: a circle has a shape index value of 1.0, whereas fragments with irregular shapes will have higher values Average patch characteristic for a cell selected at random Sum of each patches perimeter/area ratio divided by number of patches |
| Edge Metrics | Total Edge (TE) Edge Density (ED) Mean Patch Edge (MPE) | Total length (m) of edge of a particular patch type (class level) Density (m/ha) of edge of a particular patch type (class level) Average amount of edge per patch |
| Diversity Metrics | Shannon’s Diversity Index (SHDI) Shannon’s Evenness Index (SHEI) | Measure of relative patch diversity. The index will be equal to zero when there is only one patch in the landscape and increases when the number of patch types or proportional distribution of patch types increases Measure of patch distribution and abundance. It is equal to zero when the observed patch distribution is low and approaches one when the distribution of patch types becomes more even |
| Total Landscape Area (TLA) | Sum of areas of all patches in the landscape | |
| Class Area (CA) | Area (ha) of each patch type (class) |
| Reference Data | |||||||||||||||||||||||||
|---|---|---|---|---|---|---|---|---|---|---|---|---|---|---|---|---|---|---|---|---|---|---|---|---|---|
| A | B | C | D | E | F | G | H | I | J | K | L | M | N | O | P | Q | R | S | T | U | V | UA | PA | ||
| Map class | A | 9 | 1 | 0 | 0 | 0 | 0 | 0 | 0 | 0 | 0 | 0 | 0 | 0 | 0 | 0 | 0 | 0 | 0 | 0 | 0 | 0 | 0 | 90 | 90 |
| B | 0 | 0 | 0 | 0 | 0 | 0 | 0 | 0 | 0 | 0 | 0 | 0 | 0 | 0 | 0 | 0 | 0 | 0 | 0 | 0 | 0 | 0 | |||
| C | 1 | 0 | 2 | 0 | 0 | 0 | 0 | 0 | 0 | 0 | 0 | 0 | 0 | 0 | 0 | 0 | 0 | 0 | 0 | 0 | 0 | 0 | 67 | 100 | |
| D | 0 | 0 | 0 | 2 | 0 | 0 | 0 | 0 | 0 | 0 | 0 | 0 | 0 | 0 | 0 | 0 | 0 | 0 | 0 | 0 | 0 | 0 | 100 | 100 | |
| E | 0 | 0 | 0 | 0 | 0 | 0 | 0 | 0 | 0 | 0 | 0 | 0 | 0 | 0 | 0 | 0 | 0 | 0 | 0 | 0 | 0 | 0 | |||
| F | 0 | 0 | 0 | 0 | 0 | 0 | 0 | 0 | 0 | 0 | 0 | 0 | 0 | 0 | 0 | 0 | 0 | 0 | 0 | 0 | 0 | 0 | |||
| G | 0 | 0 | 0 | 0 | 0 | 0 | 0 | 0 | 0 | 0 | 0 | 0 | 0 | 0 | 0 | 0 | 0 | 0 | 0 | 0 | 0 | 0 | |||
| H | 0 | 0 | 0 | 0 | 0 | 0 | 0 | 0 | 0 | 0 | 0 | 0 | 0 | 0 | 0 | 0 | 0 | 0 | 0 | 0 | 0 | 0 | |||
| I | 0 | 1 | 0 | 0 | 0 | 0 | 0 | 0 | 2 | 0 | 0 | 0 | 0 | 0 | 0 | 0 | 0 | 0 | 0 | 0 | 0 | 0 | 100 | 100 | |
| J | 0 | 0 | 0 | 0 | 0 | 0 | 0 | 0 | 0 | 19 | 0 | 1 | 3 | 0 | 0 | 0 | 0 | 0 | 0 | 0 | 0 | 0 | 83 | 86 | |
| K | 0 | 0 | 0 | 0 | 0 | 0 | 0 | 0 | 0 | 0 | 0 | 0 | 0 | 0 | 0 | 0 | 0 | 0 | 0 | 0 | 0 | 0 | |||
| L | 0 | 0 | 0 | 0 | 0 | 0 | 0 | 0 | 0 | 1 | 0 | 5 | 2 | 0 | 0 | 0 | 0 | 0 | 0 | 0 | 0 | 0 | 83 | 100 | |
| M | 0 | 0 | 0 | 0 | 0 | 0 | 0 | 0 | 0 | 2 | 0 | 0 | 16 | 0 | 0 | 0 | 0 | 0 | 0 | 0 | 0 | 0 | 89 | 94 | |
| N | 0 | 0 | 0 | 0 | 0 | 0 | 0 | 0 | 0 | 0 | 0 | 0 | 1 | 3 | 0 | 0 | 0 | 0 | 0 | 0 | 0 | 0 | 100 | 50 | |
| O | 0 | 0 | 0 | 0 | 0 | 0 | 0 | 0 | 0 | 0 | 0 | 0 | 0 | 0 | 6 | 0 | 1 | 0 | 0 | 0 | 0 | 0 | 86 | 100 | |
| P | 0 | 0 | 0 | 0 | 0 | 0 | 0 | 0 | 0 | 0 | 0 | 0 | 0 | 0 | 0 | 1 | 0 | 0 | 0 | 0 | 0 | 0 | 100 | 100 | |
| Q | 0 | 0 | 0 | 0 | 0 | 0 | 0 | 0 | 0 | 0 | 0 | 0 | 0 | 0 | 0 | 0 | 2 | 0 | 0 | 0 | 0 | 0 | 100 | 67 | |
| R | 0 | 0 | 0 | 0 | 0 | 0 | 0 | 0 | 0 | 0 | 0 | 0 | 0 | 0 | 0 | 0 | 0 | 2 | 0 | 0 | 0 | 0 | 100 | 50 | |
| S | 0 | 0 | 0 | 0 | 0 | 0 | 0 | 0 | 0 | 0 | 0 | 0 | 0 | 0 | 0 | 0 | 0 | 2 | 6 | 0 | 0 | 0 | 75 | 100 | |
| T | 0 | 0 | 0 | 0 | 0 | 0 | 0 | 0 | 0 | 0 | 0 | 0 | 0 | 0 | 0 | 0 | 0 | 0 | 0 | 0 | 0 | 0 | |||
| U | 0 | 0 | 0 | 0 | 0 | 0 | 0 | 0 | 0 | 0 | 0 | 0 | 0 | 0 | 0 | 0 | 0 | 0 | 0 | 0 | 3 | 0 | 100 | 100 | |
| V | 0 | 0 | 0 | 0 | 0 | 0 | 0 | 0 | 0 | 0 | 0 | 0 | 0 | 0 | 0 | 0 | 0 | 0 | 0 | 0 | 0 | 0 | |||
| Reference Data | |||||||||||||||||||||||||
|---|---|---|---|---|---|---|---|---|---|---|---|---|---|---|---|---|---|---|---|---|---|---|---|---|---|
| A | B | C | D | E | F | G | H | I | J | K | L | M | N | O | P | Q | R | S | T | U | V | UA | PA | ||
| Map class | A | 10 | 1 | 0 | 0 | 0 | 0 | 0 | 0 | 0 | 0 | 0 | 0 | 0 | 0 | 0 | 0 | 0 | 0 | 0 | 0 | 0 | 0 | 91 | 91 |
| B | 0 | 0 | 0 | 0 | 0 | 0 | 0 | 0 | 0 | 0 | 0 | 0 | 0 | 0 | 0 | 0 | 0 | 0 | 0 | 0 | 0 | 0 | |||
| C | 1 | 0 | 6 | 0 | 0 | 0 | 0 | 0 | 0 | 0 | 0 | 0 | 0 | 0 | 0 | 0 | 0 | 0 | 0 | 0 | 0 | 0 | 86 | 100 | |
| D | 0 | 0 | 0 | 1 | 0 | 0 | 0 | 0 | 0 | 0 | 0 | 0 | 0 | 0 | 0 | 0 | 0 | 0 | 0 | 0 | 0 | 0 | 100 | 100 | |
| E | 0 | 0 | 0 | 0 | 0 | 0 | 0 | 0 | 0 | 0 | 0 | 0 | 0 | 0 | 0 | 0 | 0 | 0 | 0 | 0 | 0 | 0 | |||
| F | 0 | 0 | 0 | 0 | 0 | 0 | 0 | 0 | 0 | 0 | 0 | 0 | 0 | 0 | 0 | 0 | 0 | 0 | 0 | 0 | 0 | 0 | |||
| G | 0 | 0 | 0 | 0 | 0 | 0 | 0 | 0 | 0 | 0 | 0 | 0 | 0 | 0 | 0 | 0 | 0 | 0 | 0 | 0 | 0 | 0 | |||
| H | 0 | 0 | 0 | 0 | 0 | 0 | 0 | 0 | 0 | 0 | 0 | 0 | 0 | 0 | 0 | 0 | 0 | 0 | 0 | 0 | 0 | 0 | |||
| I | 0 | 1 | 0 | 0 | 0 | 0 | 0 | 0 | 2 | 0 | 0 | 0 | 0 | 0 | 0 | 0 | 0 | 0 | 0 | 0 | 0 | 0 | 67 | 100 | |
| J | 0 | 0 | 0 | 0 | 0 | 0 | 0 | 0 | 0 | 9 | 0 | 2 | 0 | 0 | 0 | 0 | 0 | 0 | 0 | 0 | 0 | 0 | 82 | 100 | |
| K | 0 | 0 | 0 | 0 | 0 | 0 | 0 | 0 | 0 | 0 | 0 | 0 | 0 | 0 | 0 | 0 | 0 | 0 | 0 | 0 | 0 | 0 | |||
| L | 0 | 0 | 0 | 0 | 0 | 0 | 0 | 0 | 0 | 0 | 0 | 7 | 2 | 0 | 0 | 0 | 0 | 0 | 0 | 0 | 0 | 0 | 78 | 78 | |
| M | 0 | 0 | 0 | 0 | 0 | 0 | 0 | 0 | 0 | 0 | 0 | 0 | 11 | 0 | 0 | 0 | 0 | 0 | 0 | 0 | 0 | 0 | 92 | 79 | |
| N | 0 | 0 | 0 | 0 | 0 | 0 | 0 | 0 | 0 | 0 | 0 | 0 | 1 | 4 | 0 | 0 | 0 | 0 | 0 | 0 | 0 | 0 | 80 | 80 | |
| O | 0 | 0 | 0 | 0 | 0 | 0 | 0 | 0 | 0 | 0 | 0 | 0 | 0 | 0 | 9 | 0 | 2 | 0 | 0 | 0 | 0 | 0 | 82 | 90 | |
| P | 0 | 0 | 0 | 0 | 0 | 0 | 0 | 0 | 0 | 0 | 0 | 0 | 0 | 0 | 0 | 1 | 0 | 0 | 0 | 0 | 0 | 0 | 100 | 100 | |
| Q | 0 | 0 | 0 | 0 | 0 | 0 | 0 | 0 | 0 | 0 | 0 | 0 | 0 | 0 | 0 | 0 | 1 | 0 | 0 | 0 | 0 | 0 | 100 | 50 | |
| R | 0 | 0 | 0 | 0 | 0 | 0 | 0 | 0 | 0 | 0 | 0 | 0 | 0 | 0 | 0 | 0 | 0 | 2 | 0 | 0 | 0 | 0 | 100 | 50 | |
| S | 0 | 0 | 0 | 0 | 0 | 0 | 0 | 0 | 0 | 0 | 0 | 0 | 0 | 0 | 0 | 0 | 0 | 1 | 11 | 0 | 0 | 0 | 92 | 100 | |
| T | 0 | 0 | 0 | 0 | 0 | 0 | 0 | 0 | 0 | 0 | 0 | 0 | 0 | 0 | 0 | 0 | 0 | 1 | 0 | 1 | 0 | 0 | 50 | 100 | |
| U | 0 | 0 | 0 | 0 | 0 | 0 | 0 | 0 | 0 | 0 | 0 | 0 | 0 | 0 | 0 | 0 | 0 | 0 | 0 | 0 | 2 | 0 | 100 | 100 | |
| V | 0 | 0 | 0 | 0 | 0 | 0 | 0 | 0 | 0 | 0 | 0 | 0 | 0 | 0 | 0 | 0 | 0 | 0 | 0 | 0 | 0 | 0 | |||
| Land Cover Type | Number of Patches | Class Area (ha) | Increase or Decrease of Class Area from 1990 to 2015 (%) | ||
|---|---|---|---|---|---|
| Land Use 1990 | Land Use 2015 | Land Use 1990 | Land Use 2015 | ||
| Urban fabric | 79 | 116 | 559 | 838 | +49.9 |
| Industrial, commercial and transport units | 78 | 105 | 207 | 368 | +78.3 |
| Mine, dump and construction sites | 9 | 22 | 34 | 35 | +2.9 |
| Artificial, non-agricultural vegetated areas | 6 | 15 | 17 | 40 | +135.3 |
| Arable land | 103 | 41 | 1553 | 791 | −49.1 |
| Permanent crops | 135 | 40 | 432 | 320 | −25.9 |
| Heterogeneous agricultural areas | 74 | 37 | 1345 | 1262 | −6.2 |
| Forests | 28 | 60 | 781 | 1058 | +35.5 |
| Shrub and/or herbaceous vegetation associations | 37 | 134 | 414 | 652 | +57.5 |
| Inland waters | 8 | 7 | 197 | 178 | −9.6 |
| Indicators | Total Surface (%) | ||
|---|---|---|---|
| 1990 | 2015 | From 1990 to 2015 | |
| Consumed soil on a reference surface | 14.74 | 23.11 | |
| Fertile soil consumption | 17.29 | 30.06 | |
| Consumed soil by inhabitant | 2.64 | 3.57 | |
| Intensity of soil consumption | 56.79 | ||
| Average annual rate of the increase in consumed soil | 2.27 | ||
| Consumed soil in square metres by inhabitant supplementary between two dates | 0.10 | ||
| Indicators (%) | Altimetric Band < 270 m | Altimetric Band > 270 m | ||||
|---|---|---|---|---|---|---|
| 1990 | 2015 | From 1990 to 2015 | 1990 | 2015 | From 1990 to 2015 | |
| Consumed soil on a reference surface | 22.69 | 35.19 | 4.56 | 7.65 | ||
| Fertile soil consumption | 29.35 | 54.31 | 4.78 | 8.28 | ||
| Intensity of soil consumption | 55.09 | 67.56 | ||||
| Average annual rate of the increase in consumed soil | 2.2 | 2.7 | ||||
| Land Cover Type | Land Use 1990 | |||||||||
|---|---|---|---|---|---|---|---|---|---|---|
| AWMSI | MSI | MPAR | TE | ED | MPE | MPS | MedPS | PSCoV | PSSD | |
| Urban fabric | 3.01 | 1.91 | 573.58 | 122,551.32 | 22.12 | 1551.28 | 7.08 | 1.12 | 298.93 | 21.16 |
| Industrial, commercial and transport units | 3.72 | 1.67 | 861.99 | 78,342.48 | 14.14 | 1004.39 | 2.65 | 0.62 | 274.59 | 7.29 |
| Mine, dump and construction sites | 1.55 | 1.53 | 368.79 | 8850.83 | 1.60 | 983.43 | 3.81 | 2.36 | 76.20 | 2.90 |
| Artificial, non-agricultural vegetated areas | 1.37 | 1.37 | 301.70 | 4836.92 | 0.87 | 806.15 | 2.82 | 2.59 | 32.84 | 0.93 |
| Arable land | 5.30 | 2.30 | 331.39 | 212,494.20 | 38.35 | 5182.79 | 37.89 | 4.30 | 271.93 | 103.03 |
| Permanent crops | 2.37 | 1.78 | 268.41 | 81,535.15 | 14.72 | 2038.38 | 10.79 | 5.59 | 140.74 | 15.19 |
| Heterogeneous agricultural areas | 3.60 | 2.22 | 257.30 | 175,829.29 | 31.73 | 4752.14 | 36.34 | 8.99 | 170.87 | 62.10 |
| Forests | 2.48 | 2.13 | 315.97 | 89,445.28 | 16.14 | 3194.47 | 27.91 | 6.02 | 253.64 | 70.79 |
| Shrub and/or herbaceous vegetation associations | 2.51 | 2.16 | 302.08 | 92,288.04 | 16.66 | 2494.27 | 11.20 | 6.63 | 95.29 | 10.67 |
| Inland waters | 5.89 | 3.22 | 357.04 | 51,249.04 | 9.25 | 6406.13 | 24.69 | 6.31 | 152.74 | 37.71 |
| Land use 2015 | ||||||||||
| Urban fabric | 7.38 | 2.01 | 737.63 | 221,333.58 | 39.94 | 1908.05 | 7.23 | 0.65 | 570.21 | 41.21 |
| Industrial, commercial and transport units | 4.81 | 1.70 | 683.04 | 114,704.30 | 20.70 | 1092.42 | 3.50 | 0.69 | 501.13 | 17.56 |
| Mine, dump and construction sites | 1.43 | 1.39 | 727.14 | 11,039.37 | 1.99 | 501.79 | 1.60 | 0.43 | 152.95 | 2.45 |
| Artificial, non-agricultural vegetated areas | 1.66 | 1.54 | 419.12 | 12,942.15 | 2.34 | 862.81 | 2.63 | 2.46 | 64.31 | 1.69 |
| Arable land | 3.78 | 1.85 | 597.69 | 176,782.13 | 31.90 | 1716.33 | 7.68 | 1.25 | 270.30 | 20.77 |
| Permanent crops | 2.27 | 1.51 | 730.02 | 99,568.66 | 17.97 | 737.55 | 2.37 | 0.62 | 217.96 | 5.16 |
| Heterogeneous agricultural areas | 4.64 | 2.54 | 473.92 | 272,249.42 | 49.13 | 3679.05 | 17.05 | 3.80 | 227.15 | 38.72 |
| Forests | 4.03 | 2.45 | 485.32 | 196,670.21 | 35.49 | 3277.84 | 17.64 | 3.35 | 294.11 | 51.87 |
| Shrub and/or herbaceous vegetation associations | 3.24 | 2.12 | 587.03 | 216,020.03 | 38.98 | 1612.09 | 4.86 | 1.73 | 193.08 | 9.39 |
| Inland waters | 6.92 | 3.41 | 421.49 | 51,434.85 | 9.28 | 7347.84 | 25.45 | 2.80 | 150.52 | 38.30 |
| 1990 | 2015 | |
|---|---|---|
| Shannon’s Diversity Index (SHDI) | 1.89 | 1.99 |
| Shannon’s Evenness Index (SHEI) | 0.82 | 0.86 |
Disclaimer/Publisher’s Note: The statements, opinions and data contained in all publications are solely those of the individual author(s) and contributor(s) and not of MDPI and/or the editor(s). MDPI and/or the editor(s) disclaim responsibility for any injury to people or property resulting from any ideas, methods, instructions or products referred to in the content. |
© 2023 by the authors. Licensee MDPI, Basel, Switzerland. This article is an open access article distributed under the terms and conditions of the Creative Commons Attribution (CC BY) license (https://creativecommons.org/licenses/by/4.0/).
Share and Cite
Ricca, N.; Guagliardi, I. Evidences of Soil Consumption Dynamics over Space and Time by Data Analysis in a Southern Italy Urban Sprawling Area. Land 2023, 12, 1056. https://doi.org/10.3390/land12051056
Ricca N, Guagliardi I. Evidences of Soil Consumption Dynamics over Space and Time by Data Analysis in a Southern Italy Urban Sprawling Area. Land. 2023; 12(5):1056. https://doi.org/10.3390/land12051056
Chicago/Turabian StyleRicca, Nicola, and Ilaria Guagliardi. 2023. "Evidences of Soil Consumption Dynamics over Space and Time by Data Analysis in a Southern Italy Urban Sprawling Area" Land 12, no. 5: 1056. https://doi.org/10.3390/land12051056
APA StyleRicca, N., & Guagliardi, I. (2023). Evidences of Soil Consumption Dynamics over Space and Time by Data Analysis in a Southern Italy Urban Sprawling Area. Land, 12(5), 1056. https://doi.org/10.3390/land12051056


