

Land Cover Change and Food Security in Central Sumba: Challenges and Opportunities in the Decentralization Era in Indonesia

 ,
,  ,
,  ,
,  add
Show full author list
add
Show full author list
Abstract
1. Introduction
2. Materials and Methods
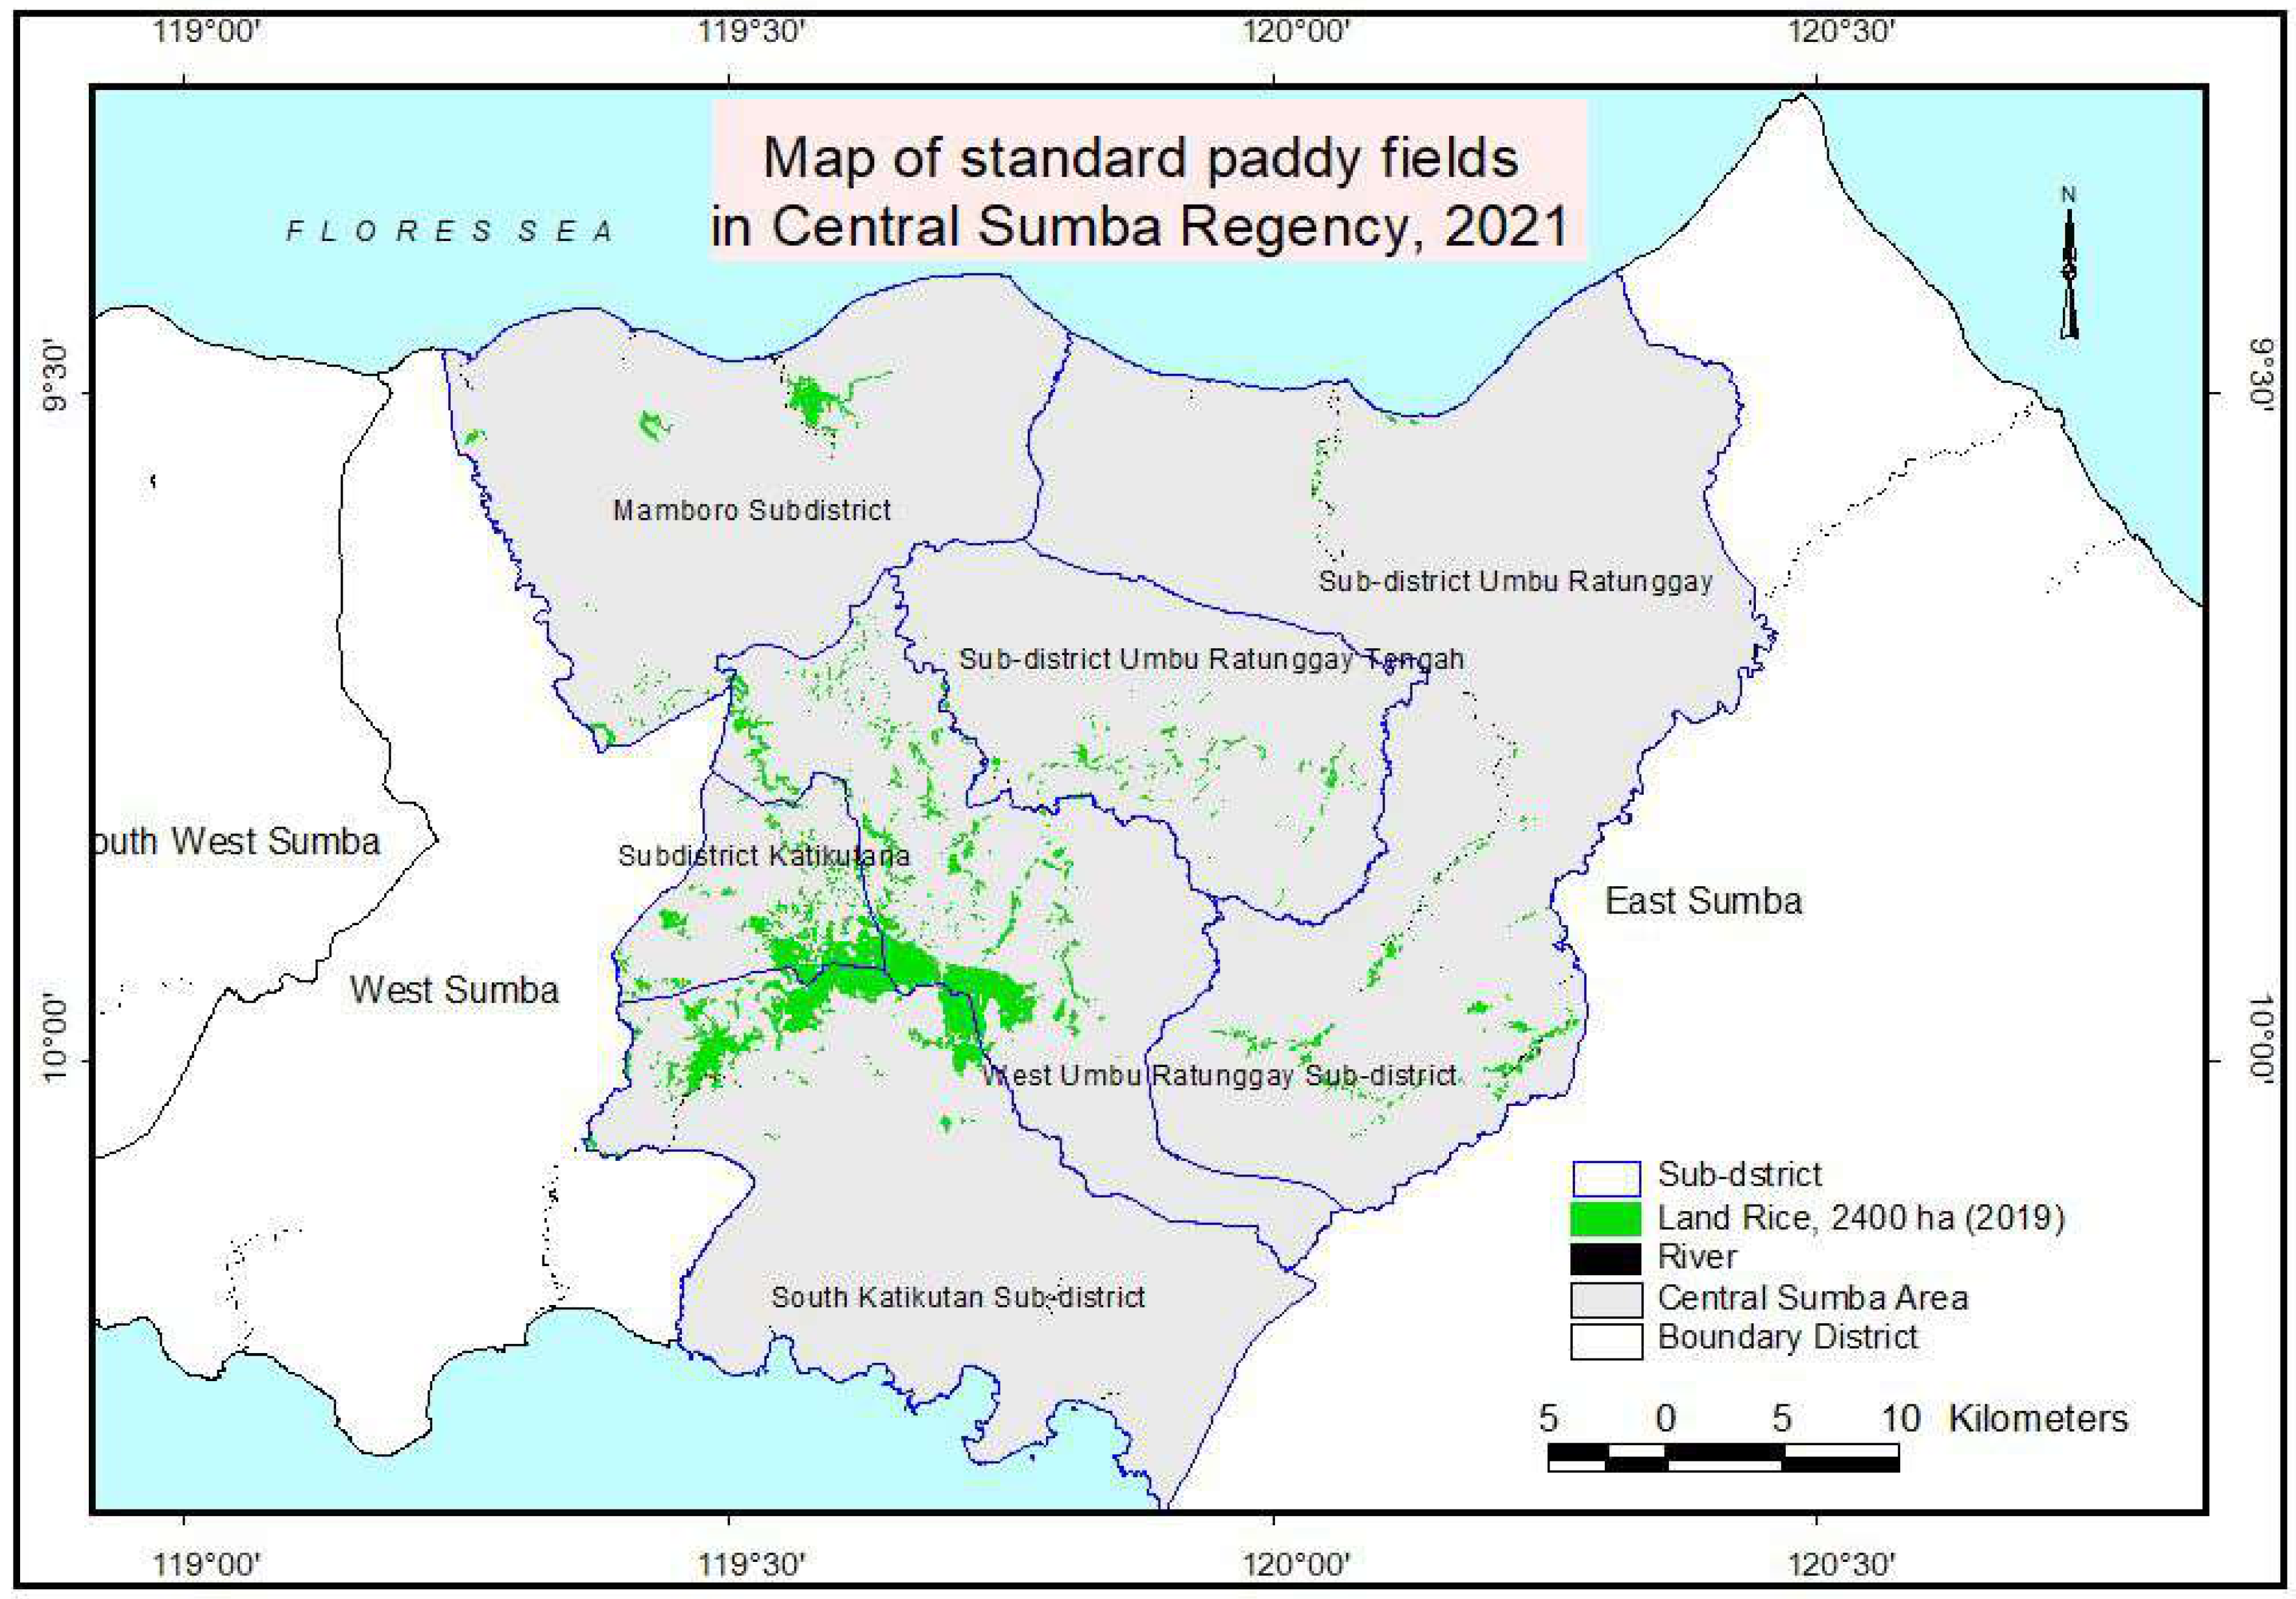
2.1. Description of Study Area
2.2. The Study and Respondents
2.3. Materials and Research Methods
2.4. Data Analysis
3. Overview of Decentralization/Regional Autonomy (RA) and Pressure on Agricultural Land
4. Results
4.1. The Socio-Economic Characteristics of Central Sumba District and Respondents Description
4.2. Land Use and Land Cover Change: Current and Future Potential
4.2.1. Current Land Cover Condition
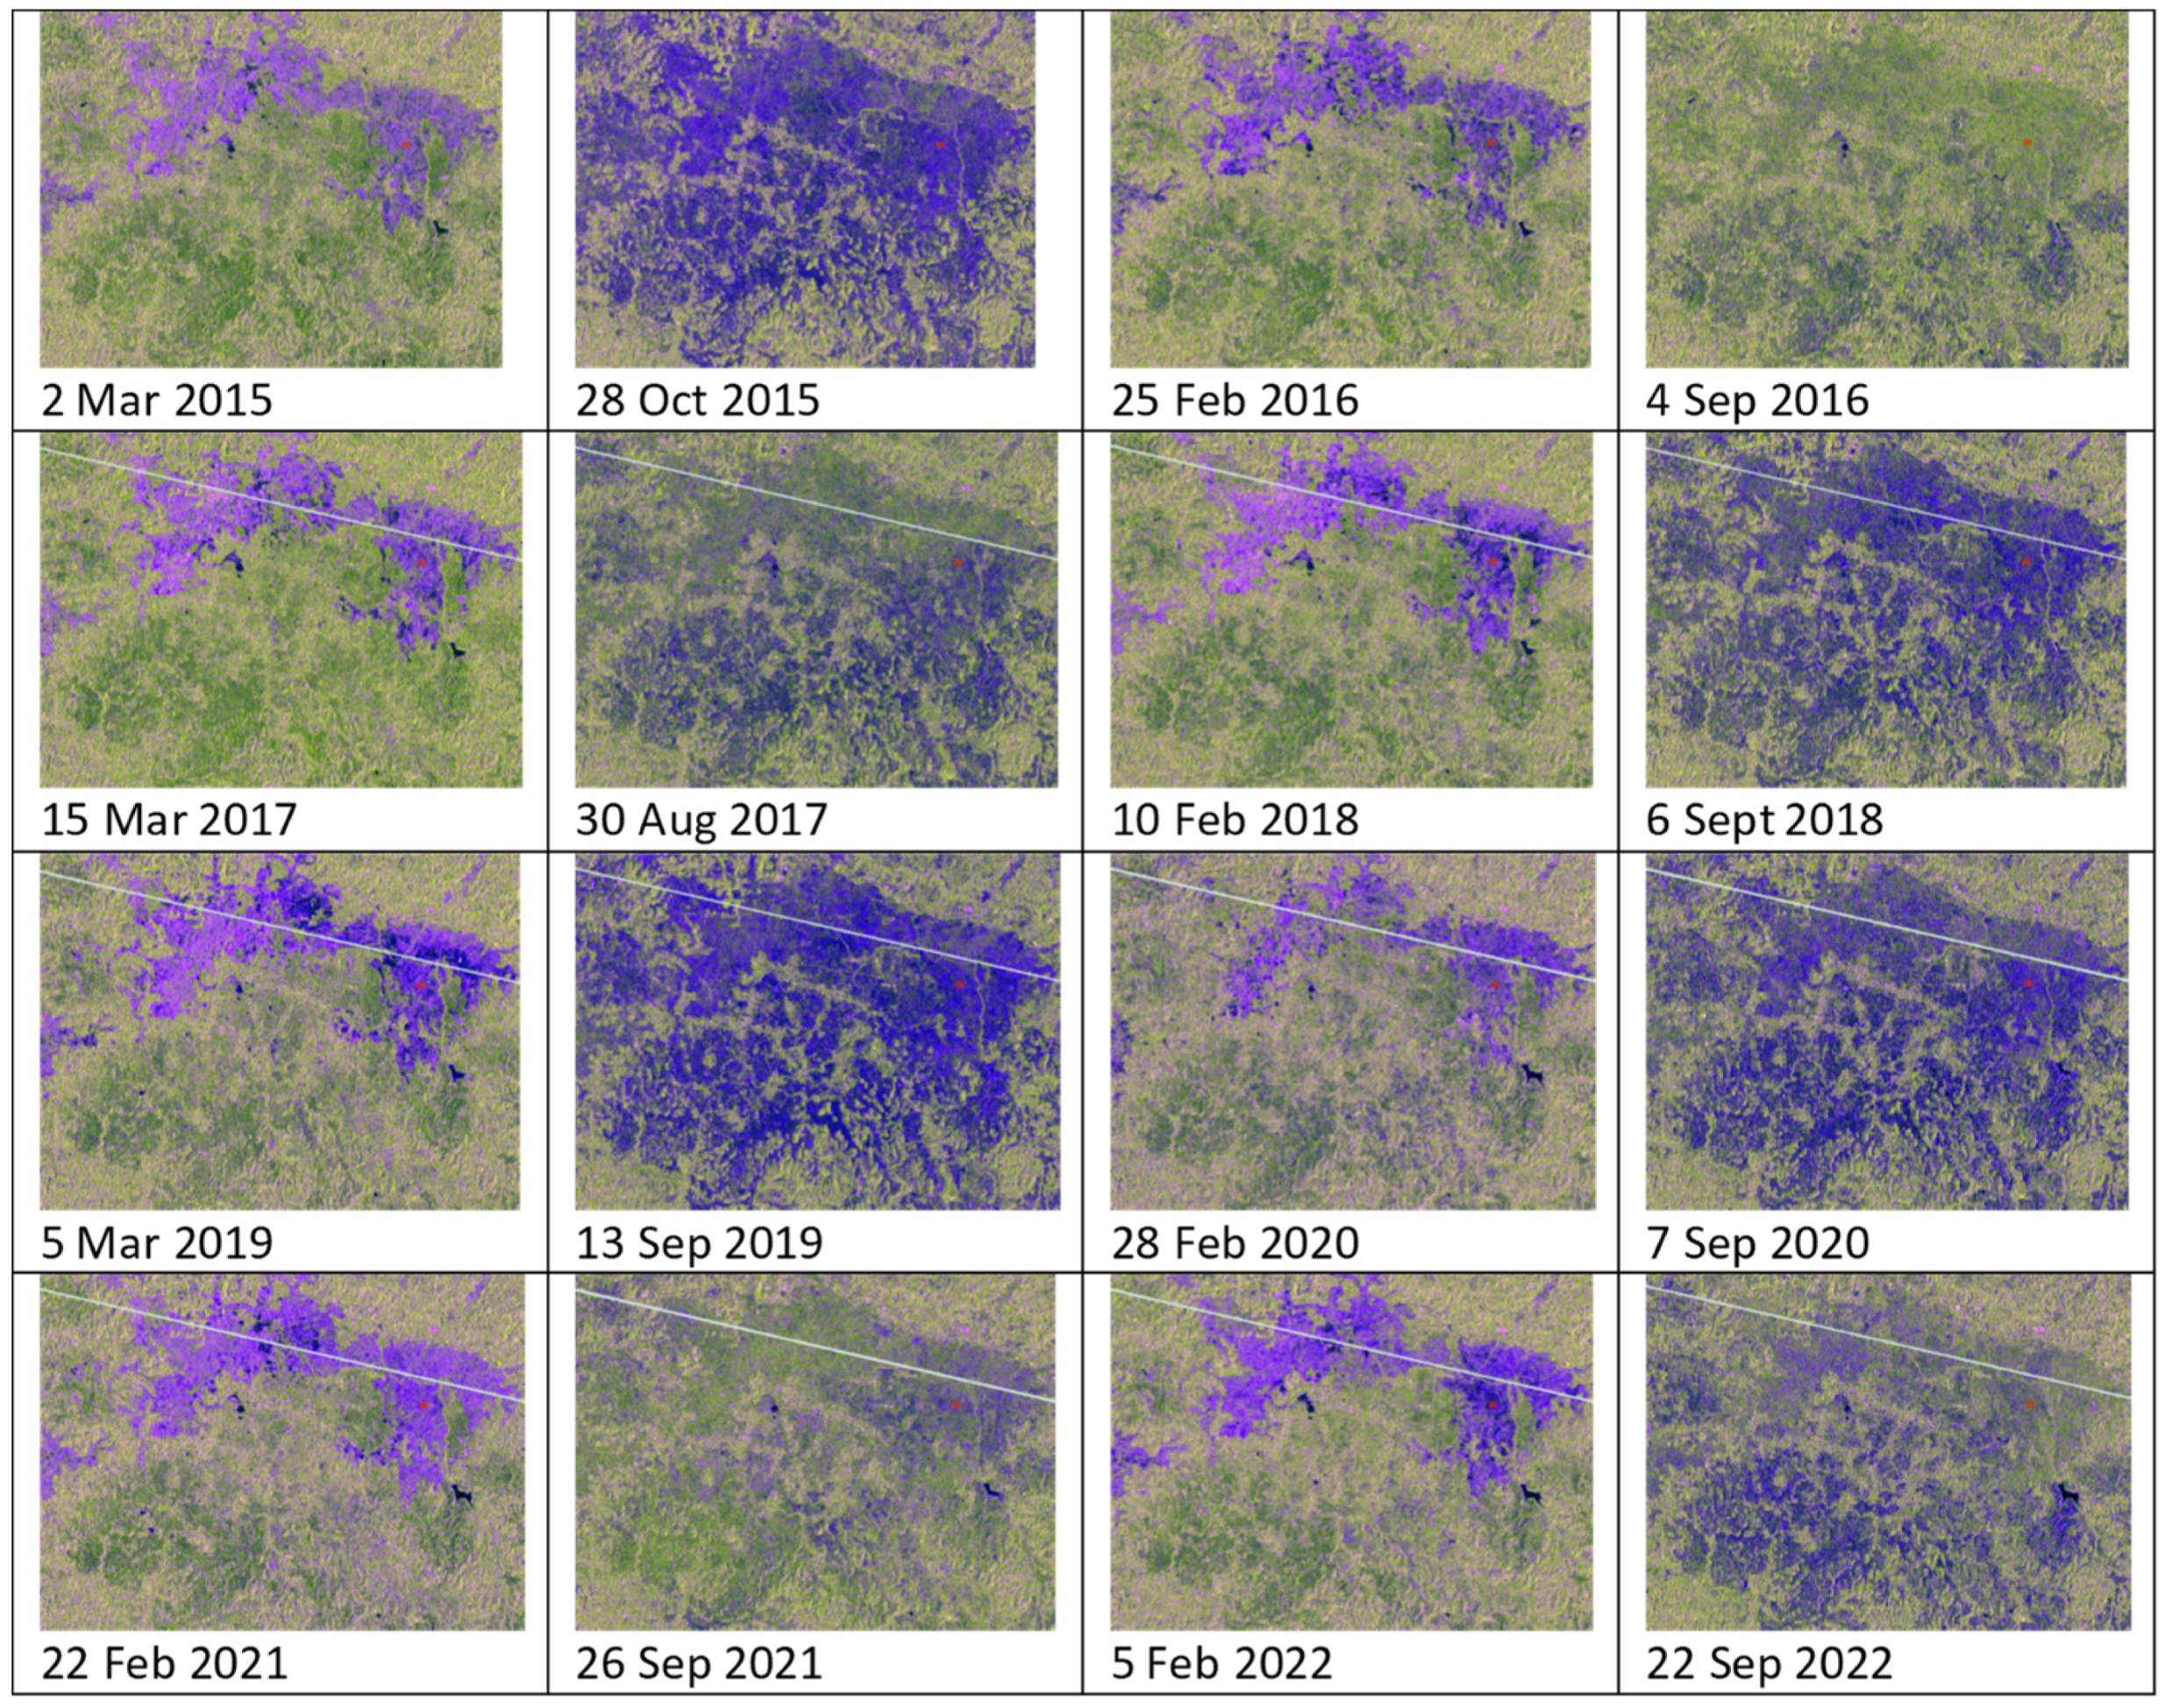
4.2.2. Land Cover Changes Timeline
4.2.3. Physical Changes of Each Type of Landcover
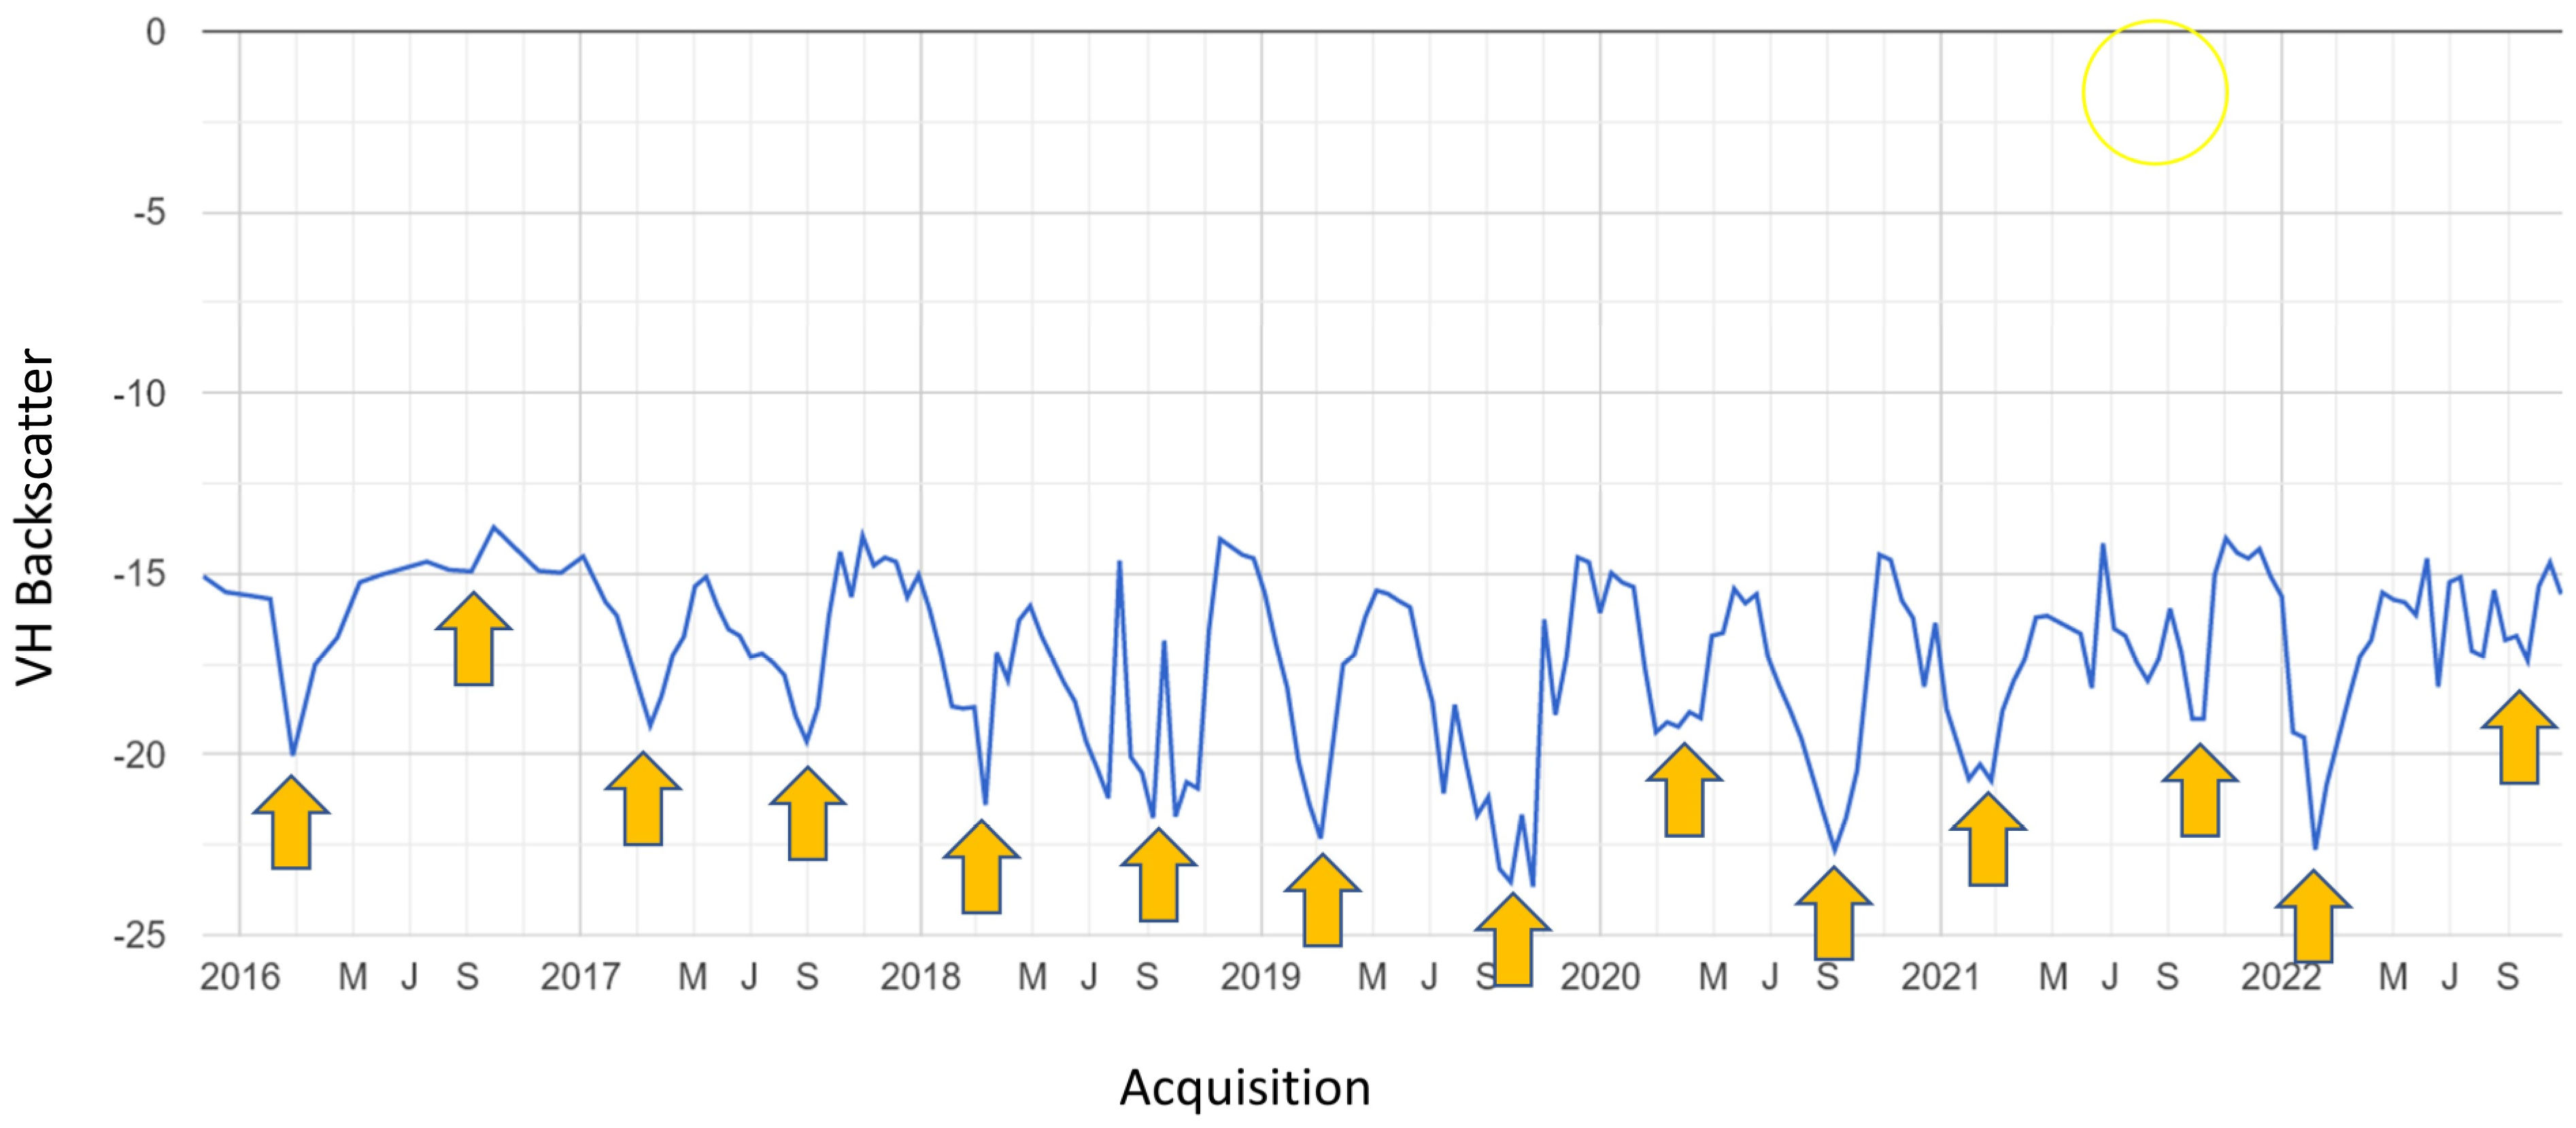
- -
- In 2016, planting was conducted once a year in all paddy fields;
- -
- In 2017, planting was conducted once a year in small areas, and some areas planting happened two times a year;
- -
- In 2018, 2019, and 2020, planting occurred two times a year simultaneously;
- -
- In 2021 and 2022, planting occurred one to two times a year, and the second growing season was not simultaneous.
4.3. Food Security: Challenges and Opportunities
4.4. Environmental Services
5. Discussion: The Link of Devolution Era, Food Security, and Environment
6. Limitations and Implications for Future Studies
7. Conclusions
Author Contributions
Funding
Data Availability Statement
Acknowledgments
Conflicts of Interest
References
- Nurhadi. Inilah Daftar Provinsi Baru yang Terbentuk Pasca-Reformasi. Tempo. Nasional. July 2022. Available online: https://nasional.tempo.co/read/1608931/inilah-daftar-provinsi-baru-yang-terbentuk-pasca-reformasi (accessed on 10 July 2022).
- Fajri, D.L. Mengenal Provinsi dan Jumlah Kabupaten di Indonesia. Katadata. Berita. February 2022. Available online: https://katadata.co.id/intan/berita/6206141e9ca33/mengenal-provinsi-dan-jumlah-kabupaten-di-indonesia (accessed on 13 February 2022).
- Pratomo, R.A.; Samsura, D.A.A.; van der Krabben, E. Transformation of Local People’ s Property Rights Induced by New Town Development. Land 2020, 9, 236. [Google Scholar] [CrossRef]
- Kelly-Fair, M.; Gopal, S.; Koch, M.; Kusumaningrum, H.P.; Helmi, M.; Khairunnisa, D.; Kaufman, L. Analysis of Land Use and Land Cover Changes through the Lens of SDGs in Semarang, Indonesia. Sustainability 2022, 14, 7592. [Google Scholar] [CrossRef]
- Mardiansjah, F.H.; Rahayu, P.; Rukmana, D. New Patterns of Urbanization in Indonesia: Emergence of Non-statutory Towns and New Extended Urban Regions. Environ. Urban. ASIA 2021, 12, 11–26. [Google Scholar] [CrossRef]
- Antriyandarti, E. Constraints of farm size enlargement in the rice sector of central java: A case study. Bulg. J. Agric. Sci. 2018, 24, 949–958. [Google Scholar]
- Sui, F.; Yang, Y.; Zhao, S. Labor Structure, Land Fragmentation, and Land-Use Efficiency from the Perspective of Mediation Effect: Based on a Survey of Garlic Growers in Lanling, China. Land 2022, 11, 952. [Google Scholar] [CrossRef]
- Tran, T.Q.; Vu, H. Van Theimpactof land fragmentation on food security in the North Central Coast, Vietnam. Asia Pac. Policy Stud. 2021, 8, 327–345. [Google Scholar] [CrossRef]
- Oktavilia, S.; Fafurida; Pujiati, A.; Aulia, Y. Firmansyah Industrialization and Land Conversion in Indonesia. Environ. Ecol. Res. 2022, 10, 627–634. [Google Scholar] [CrossRef]
- Handayani, S.W.; Fauzan, M.; Nasihuddin, A.A. Conversion of Agricultural Land Policy in Indonesia. In Proceedings of the 5th International Conference on Community Development (AMCA 2018), Atlantis Press, Quezon City, Philippines, 19–20 July 2018. [Google Scholar] [CrossRef]
- Laksana, S. Some Difficulties to Protect Agricultural Land from Conversion: The Case of Sustainable Agricultural Land Policy in Tasikmalaya Regency, West Java, Indonesia. Bappenas Work. Pap. 2020, 2, 157–167. [Google Scholar] [CrossRef]
- Agus, F. Irawan Agricultural Land Conversion as a Threat to Food Security and Environmental Quality. J. Penelit. Pengemb. Pertan. 2006, 25, 90–98. [Google Scholar]
- Firman, T. Rural to urban land conversion in Indonesia during boom and bust periods. Land Use Policy 2000, 17, 13–20. [Google Scholar] [CrossRef]
- Mulyani, A.; Kuntjoro, D.; Nursyamsi, D.; Agus, F. Konversi Lahan Sawah Indonesia sebagai Ancaman terhadap Ketahanan Pangan. Indones. Soil Clim. J. 2016, 40, 121–133. [Google Scholar] [CrossRef]
- Nurliani; Rosada, I. Rice-field Conversion and its Impact on Food Availability. Agric. Agric. Sci. Procedia 2016, 9, 40–46. [Google Scholar] [CrossRef][Green Version]
- Sidipurwanty, E. Tenure and Ownership of Agricultural Land in Probolinggo Regency of East Java Province. Pertanahan 2016. [Google Scholar]
- Putri, R.F.; Rokhim, A.A.; Prakosa, M.G.; Hastari, N.R.F.; Adhesti, Y.M.P.; Junaedi, R.N.; Ramdani, H.P.; Omar, R.C. Analysis of land resources balance in Nusa Tenggara Timur Province. IOP Conf. Ser. Earth Environ. Sci. 2021, 686, 012006. [Google Scholar] [CrossRef]
- Hutapea, R.T.P.; Ramadhan, R.P.; Tulalo, M.A.; Ngongo, Y. Competitiveness of Indonesian Rice Prices in the International Market. E3S Web Conf. 2022, 361, 01016. [Google Scholar] [CrossRef]
- Yodfiatfinda. Effort to Improve the Interests of Young Generations in the Agricultural Sector to Attain Food Security in Indonesia. In Proceedings of the 5th International Conference on Food, Agriculture and Natural Resources (FANRes 2019), Ternate, Indonesia, 17–19 September 2019; Volume 194, pp. 291–296. [Google Scholar] [CrossRef]
- Utami, A.; Harianto, H. Farmers’ Subsistence in Indonesian Rice Farming. J. Agribisnis Indones. 2021, 9, 79–87. [Google Scholar] [CrossRef]
- Rosyada, A.; Putra, R.E.; Gunawan, W. Dynamics of Competitiveness and Efficiency of Rice Farming in Java Island, Indonesia. 3BIO: J. Biol. Sci. Technol. Manag. 2022, 4, 105–119. [Google Scholar] [CrossRef]
- Vel, J. Law, Social Justice & Global Development Reports. Law Soc. Justice Glob. Dev. 2010, 2010, 1–27. [Google Scholar]
- Vel, J.; Makambombu, S. Strategic Framing of Adat in Land-Acquisition Politics in East Sumba. Asia Pac. J. Anthropol. 2019, 20, 435–452. [Google Scholar] [CrossRef]
- Fowler, C.T. Customary Rights and Freshwater Ecology in Pluralistic Societies on the Monsoonal Island of Sumba (Eastern Indonesia). Front. Environ. Sci. 2022, 10, 842647. [Google Scholar] [CrossRef]
- District Statistical Bureau. Kabupaten Sumba Tengah Dalam Angka 2022 (Central Sumba District in Figures 2022); Statistical Bureau: Waibakul, Indonesia, 2022; Available online: https://sumbatengahkab.bps.go.id/publication/2022/02/25/bb3c0995f735658efcc23423/kabupaten-sumba-tengah-dalam-angka-2022.html (accessed on 5 January 2023).
- Geospatial, I. Available online: https://www.indonesia-geospasial.com/2020/09/download-shp-tutupan-lahan-tahun-2019.html (accessed on 5 January 2022).
- Indra, S.; Prasetyo, L.B.; Soekmadi, R. Penyusunan Zonasi Taman Nasional Manupeu Tanadaru, Sumba Berdasarkan Kerentanan Kawasan Dan Aktifitas Masyarakat (Zoning System Development of Manupeu Tanadaru National Park on Sumba based on Area Sensitivity and Community Activities). Media Konserv. 2006, XI, 1–16. [Google Scholar]
- RimbaKita. Taman Nasional Manupeu Tanah Daru—Sumba, NTT. RimbaKita. 2022. Available online: https://rimbakita.com/taman-nasional-manupeu-tanah-daru/ (accessed on 10 January 2023).
- Balai Taman Nasional Matalawa. Revisi Zona Pengelolaan Taman Nasional Manupeu Tanah Daru dan Laiwanggi Wanggameti (TN MATALAWA) Kabupaten Sumba Barat, Sumba Tengah dan Sumba Timur; Balai Taman Nasional Matalawa: Jakarta, Indonesia, 2019. [Google Scholar]
- Olson, D. Sumba Deciduous Forests [Internet]. Oenerath—WWF-Hong Kong. 2022. Available online: https://www.oneearth.org/ecoregions/sumba-deciduous-forests/ (accessed on 12 January 2023).
- Nurofiq, H.F.; Margono, B.A.; Saputro, T.; Nugroho, S.; Purwanto, J.; Ramdhany, D.; Pramono, J.; Usman, A.B.; Rovani, R.; Suharyono; et al. The State of Indonesia’s Forests 2022: Towards FOLU Net Sink 2030; Nurbaya, S., Efransyah, Eds.; Ministry of Environmental and Forestry Republic of Indonesia: Jakarta, Indonesia, 2022; 157p, Available online: https://www.menlhk.go.id/uploads/site/post/1664894502.pdf (accessed on 12 January 2023).
- DeRosari, B.; Matitaputy, P.R.; Ngongo, Y.; da Silva, H.; Rohi, I.; Bombo, Y.; Achadri, Y.; Kotta, N.R. Laporan Kerjasama Bapelitbangda Sumba Tengah dan BPTP NTT; Nusa Tenggara Timur, 2021.
- DeRosari, B.; Basuki, T.; Ngongo, Y. Dampak Sosial Budaya dan Ekonomi Program Food Estate Bagi Kesejahteraan Masyarakat Suma Tengah (Impact of Socio-Cultural and Economic of Food Estate Program for People Welfare of Central Sumba Distrcit); Waibakul, Indonesia, 2022.
- Basuki, T.; DeRosari, B.; Pari, N.U.K.; Landukara, Y.; Banunaek, S.K.I.; Bitang, B.K.; Taklal, Z.Y.; Rouna, A.R.; Winu, F.K.; Bora, Y.U.; et al. Kajian Lahan Pertanian Pangan Mendukung Perda LP2B Kabupaten Sumba Tengah (The Study to Provides Document of “Sustainable Food Crops Lands” in Central Sumba District); Waibakul, Indonesia, 2022.
- Alavipanah, S.K.; Karimi Firozjaei, M.; Sedighi, A.; Fathololoumi, S.; Zare Naghadehi, S.; Saleh, S.; Naghdizadegan, M.; Gomeh, Z.; Arsanjani, J.J.; Makki, M.; et al. The Shadow Effect on Surface Biophysical Variables Derived from Remote Sensing: A Review. Land 2022, 11, 2025. [Google Scholar] [CrossRef]
- Noi Phan, T.; Kuch, V.; Lehnert, L.W. Land cover classification using google earth engine and random forest classifier-the role of image composition. Remote Sens. 2020, 12, 2411. [Google Scholar] [CrossRef]
- Dong, C.; Zhao, G.; Meng, Y.; Li, B.; Peng, B. remote sensing The Effect of Topographic Correction on Forest Tree Species Classification Accuracy. Remote Sens. 2020, 12, 787. [Google Scholar] [CrossRef]
- Hudjimartsu, S.; Prasetyo, L.; Setiawan, Y.; Suyamto, D.; Ikbal, W. Automated Landsat 8 data preprocessing for national forest monitoring system. In Proceedings of the Sixth International Conference on Remote Sensing and Geoinformation of the Environment (RSCy2018), SPIE, Paphos, Cyprus, 26–29 March 2018; pp. 249–259. [Google Scholar]
- Candra, D.S.; Phinn, S.; Scarth, P. Automated cloud and cloud-shadow masking for Landsat 8 using multitemporal images in a variety of environments. Remote Sens. 2019, 11, 2060. [Google Scholar] [CrossRef]
- Ismaya, H.; Rahayu, M.I.; Adiningsih, E.S. New Automated Cloud and Cloud-Shadow Detection Using Landsat Imagery. Int. J. Remote Sens. Earth Sci. 2014, 9, 2. [Google Scholar] [CrossRef][Green Version]
- López-Puigdollers, D.; Mateo-García, G.; Gómez-Chova, L. Benchmarking deep learning models for cloud detection in landsat-8 and sentinel-2 images. Remote Sens. 2021, 13, 992. [Google Scholar] [CrossRef]
- Phiri, D.; Simwanda, M.; Salekin, S.; Nyirenda, V.R.; Murayama, Y.; Ranagalage, M. Sentinel-2 data for land cover/use mapping: A review. Remote Sens. 2020, 12, 2291. [Google Scholar] [CrossRef]
- Supriatna; Rokhmatuloh; Wibowo, A.; Shidiq, I.P.A.; Pratama, G.P.; Gandharum, L. Spatio-temporal analysis of rice field phenology using Sentinel-1 image in Karawang Regency West Java, Indonesia. Int. J. GEOMATE 2019, 17, 101–106. [Google Scholar] [CrossRef]
- Andualem, T.G.; Belay, G.; Guadie, A. Land Use Change Detection Using Remote Sensing Technology. J. Earth Sci. Clim. Chang. 2018, 9, 276. [Google Scholar] [CrossRef]
- Roy, P.S.; Roy, A. Land use and land cover change in India: A remote sensing & GIS prespective. J. Indian Inst. Sci. 2010, 90, 489–502. [Google Scholar]
- Kumar, M.S.; Kolluru, V.; Gowthami, S.B.; Anjita, N.A.; Nayana, N.; Regi, L.; Dwarakish, G.S. Monitoring land use and land cover changes in coastal karnataka. Trends Civ. Eng. Chall. Sustain. Sel. Proc. CTCS 2021, 99, 785–795. [Google Scholar] [CrossRef]
- Kumar, A.; Chaudhary, S.; Negi, M.S. A Study of Spatio-Temporal Landuse/Land Cover Change Dynamics in Rudraprayag District,(Garhwal Himalaya) Using Remote Sensing and Gis. J. Glob. Resour. 2019, 5, 61–69. [Google Scholar]
- Naboureha, A.; Biana, J.; Leia, G.; Lia, A. A review of land use/land cover change mapping in the China-Central Asia-West Asia economic corridor countries. Big Earth Data 2021, 5, 237–257. [Google Scholar] [CrossRef]
- Parveen, S.; Basheer, J.; Praveen, B. A Literature Review on Land Use Land Cover Changes. Int. J. Adv. Res. 2018, 6, 1–6. [Google Scholar] [CrossRef] [PubMed]
- Venter, Z.S.; Barton, D.N.; Chakraborty, T.; Simensen, T.; Singh, G. Global 10 m Land Use Land Cover Datasets: A Comparison of Dynamic World, World Cover and Esri Land Cover. Remote Sens. 2022, 14, 4101. [Google Scholar] [CrossRef]
- Filipponi, F. Sentinel-1 GRD Preprocessing Workflow. Proceedings 2019, 18, 111. [Google Scholar] [CrossRef]
- Olofsson, P.; Foody, G.M.; Herold, M.; Stehman, S.V.; Woodcock, C.E.; Wulder, M.A. Good practices for estimating area and assessing accuracy of land change. Remote Sens. Environ. 2014, 148, 42–57. [Google Scholar] [CrossRef]
- Ustaoglu, E.; Williams, B. Institutional Settings and Effects on Agricultural Land Conversion: A Global and Spatial Analysis of European Regions. Land 2023, 12, 47. [Google Scholar] [CrossRef]
- Hollander, M.; Wolfe, D.A.; Chicken, E. Nonparametric Statistical Methods; John Wiley & Sons.: New York, NY, USA, 2014. [Google Scholar]
- Negara, M.S. Undang-Undang Republik Indonesia Nomor 22 Tahun 1999 Tentang Pemerintah Daerah; Indonesia, 1999.
- Ministry of Finance Repuclic of Indonesia. Law of the Republic of Indonesia Number 28 Year 2009 Concerning Local Taxation and Charges. Jakarta, 2010. Available online: https://djpk.kemenkeu.go.id/attach/post-law-of-the-republic-indonesia-number-2008-year-2009-concerning-local-taxes-and-charges/UU-559-753-uu282009verE_Edited.pdf (accessed on 12 January 2023).
- Usman, S. Regional Autonomy in Indonesia: Field Experiences and Emerging Challenges. In Proceedings of the 7th PRSCO Summer Institute/The 4th IRSA International Conference: “Decentralization, Natural Resources, and Regional Development in the Pacific Rim”, Bali, Indonesia, 20–21 June 2002; pp. 20–21. [Google Scholar]
- Sukri; Ariana; Armunanto, A.; Nadir, S.; Ekawaty, D. Environmental dilemma under implementation of Indonesian regional autonomy. IOP Conf. Ser. Earth Environ. Sci. 2019, 343, 012088. [Google Scholar] [CrossRef]
- Wiesner, B.J.; Dargusch, P. The Social License to Restore—Perspectives on Community Involvement in Indonesian Peatland Restoration. Land 2022, 11, 1038. [Google Scholar] [CrossRef]
- Yakin, A.; Othman, J. Forest Resources and Policy in the Age of Regional Autonomy in Indonesia. In Proceedings of the International Seminar on “Sustainable Economic, Business, and Social Development in an Era of Globalization”, Selangor, Malaysia, 13–14 October 2003. [Google Scholar]
- Setiawan, B.; Hadi, S.P. Regional autonomy and local resource management in Indonesia. Asia Pac. Viewp. 2007, 48, 72–84. [Google Scholar] [CrossRef]
- Republic of Indonesia. The National Medium Term Development Plan 2020–2024; Indonesia National Development Planning Board: Jakarta, Indonesia, 2020; p. 18. Available online: https://www.bappenas.go.id/files/rpjmn/Narasi-RPJMN-2020-2024-versi-Bahasa-Inggris.pdf (accessed on 12 January 2023).
- Sutiyo; Maharjan, K.L. Decentralization and Rural Development in Indonesia; Springer: Berlin/Heidelberg, Germany, 2017. [Google Scholar] [CrossRef]
- Nurrochmat, D.R.; Pribadi, R.; Siregar, H.; Justianto, A.; Park, M.S. Transformation of agro-forest management policy under the dynamic circumstances of a two-decade regional autonomy in Indonesia. Forests 2021, 12, 419. [Google Scholar] [CrossRef]
- Rada, N.E.; Buccola, S.T.; Fuglie, K.O. Government policy and agricultural productivity in Indonesia. Am. J. Agric. Econ. 2011, 93, 863–880. [Google Scholar] [CrossRef]
- Nugroho, Y. Sujarwoto Institutions, Outputs and Outcomes: Two Decades of Decentralization and State Capacity in Indonesia. J. Southeast Asian Econ. 2021, 38, 296–319. [Google Scholar] [CrossRef]
- Johnson, C. Local democracy, democratic decentralisation and rural development: Theories, challenges and options for policy. Dev. Policy Rev. 2001, 19, 521–532. [Google Scholar] [CrossRef]
- Nasution, A. The government decentralization program in indonesia. In Central and Local Government Relations in Asia; Edward Elgar Publishing: Cheltenham, UK, 2017; pp. 276–305. [Google Scholar] [CrossRef]
- Shoesmith, D.; Franklin, N.; Hidayat, R. Decentralization and the decision making process are more democratic, but it also enhances fragmentations and conflicts among different parties, including in natural resources management, especially in agricultural land. J. Curr. Southeast Asian Aff. 2020, 39, 359–380. [Google Scholar] [CrossRef]
- IFAD. Youth Entrepreneurship and Employment Support Services Programme. Available online: https://www-ifad-org.translate.goog/en/web/operations/-/project/2000001202?_x_tr_sl=en&_x_tr_tl=id&_x_tr_hl=id&_x_tr_pto=tc (accessed on 12 January 2023).
- Ardiansyah, F.; Marthen, A.A.; Amalia, N. Forest and Land-Use Governance in a Decentralized Indonesia: A Legal and Policy Review; CIFOR: Bogor, Indonesia, 2015. [Google Scholar]
- Garrett, L.; Lévite, H.; Besacier, C.; Alekseeva, N.; Duchelle, A. The Key Role of Forest and Landscape Restoration in Climate Action; FAO: Rome, Italy, 2022; ISBN 9789251370445. [Google Scholar]
- Zhang, S. Land Use/Land Cover Change in Orange County. Ph.D. Dissertation, The University of North Carolina at Chapel Hill, Chapel Hill, NC, USA, 2010. [Google Scholar] [CrossRef]
- Vadrevu, K.P.; Ohara, T. Focus on land use cover changes and environmental impacts in South/Southeast Asia. Environ. Res. Lett. 2020, 15, 100201. [Google Scholar] [CrossRef]
- Lin, H.I.; Yu, Y.Y.; Wen, F.I.; Liu, P.T. Status of Food Security in East and Southeast Asia and Challenges of Climate Change. Climate 2022, 10, 40. [Google Scholar] [CrossRef]
- Margulis, S. Causes of Deforestation in the Brazilian Amazon. [Electronic Resource]; 22; Washington, DC, 2003. Available online: http://search-dev.trln.org/shopping-cart/search?id=UNCb5124852 (accessed on 12 January 2023).
- Cerri, C.E.P.; Cerri, C.C.; Maia, S.M.F.; Cherubin, M.R.; Feigl, B.J.; Lal, R. Reducing Amazon deforestation through agricultural intensification in the Cerrado for advancing food security and mitigating climate change. Sustainability 2018, 10, 989. [Google Scholar] [CrossRef]
- Appelt, J.L.; Garcia Rojas, D.C.; Verburg, P.H.; van Vliet, J. Socioeconomic outcomes of agricultural land use change in Southeast Asia. Ambio 2022, 51, 1094–1109. [Google Scholar] [CrossRef] [PubMed]
- Zhao, S.; Peng, C. Land use change in Asia and the ecological consequences. Ecol. Res. 2006, 21, 890–896. [Google Scholar] [CrossRef]
- Vadrevu, K.; Heinimann, A.; Gutman, G.; Chris, J. Remote sensing of land use/cover changes in South and Southeast Asian Countries. Int. J. Digit. Earth 2019, 12, 1099–1102. [Google Scholar] [CrossRef]
- Central Sumba District Statistical Bureau. Sumba Tengah Dalam Angka 2021 (Central Sumba District in Figures 2021); Central Sumba District Statistical Bureau: Waibakul, Indonesia, 2021. [Google Scholar]
- Central Sumba District Statistical Bureau. Sumba Tengah Dalam Angka 2015 (Central Sumba District in Figures 2015); Central Sumba District Statistical Bureau: Waibakul, Indonesia, 2015. [Google Scholar]
- Central Sumba District Statistical Bureau. Sumba Tengah Dalam Angka 2016 (Central Sumba District in Figures 2016); Central Sumba District Statistical Bureau: Waibakul, Indonesia, 2016. [Google Scholar]
- Central Sumba District Statistical Bureau. Sumba Tengah Dalam Angka 2017 (Central Sumba District in Figures 2017); Central Sumba District Statistical Bureau: Waibakul, Indonesia, 2017. [Google Scholar]
- Azwartika, I. Menteri Basuki Dampingi Presiden Joko Widodo Tinjau Infrastruktur Irigasi Food Estate Kabupaten Sumba Tengah, NTT. Jakarta, 2021. Available online: https://pu.go.id/berita/menteri-basuki-dampingi-presiden-joko-widodo-tinjau-infrastruktur-irigasi-food-estate-kabupaten-sumba-tengah-ntt (accessed on 12 January 2023).
- Ngongo, Y.; Ngongo, M. Marapu and Farming: How Tourism Shape Rural Development and Ancient Tradition of Sumba Indigenous Community–Indonesia. E3S Web Conf. 2021, 316, 04004. [Google Scholar] [CrossRef]
- DeRosari, B.; Basuki, T.; Ngongo, Y. Kajian Pola Penguasaan Lahan Sawah di Kabupaten Sumba Tengah (Study of Rice Land Tenure in Central Sumba District); Nusa Tenggara Timur, 2022.
- Kurnia, G.; Setiawan, I.; Tridakusumah, A.C.; Jaelani, G.; Heryanto, M.A.; Nugraha, A. Local Wisdom for Ensuring Agriculture Sustainability: A Case from Indonesia. Sustainability 2022, 14, 8823. [Google Scholar] [CrossRef]
- FAO. Youth and Agriculture; The Food and Agriculture Organization of the United Nations (FAO) in Collaboration with the Technical Centre for Agricultural and Rural Cooperation (CTA) and the International Fund for Agricultural Development (IFAD): Rome, Italy, 2014; pp. 1–6. [Google Scholar]
- Njurumana, G.N. Village Community and Flora Biodiversity Management in Home Garden System at Central of Sumba Regency. J. Penelit. Kehutan. Wallacea 2016, 5, 25–36. [Google Scholar] [CrossRef][Green Version]
- Njurumana, G.N.; Sadono, R.; Marsono, D. Irham Ecosystem Services of Indigenous Kaliwu Agroforestry System in Sumba, Indonesia. E3S Web Conf. 2021, 305, 04002. [Google Scholar] [CrossRef]
- Margono, B.A.; Potapov, P.; Turubanova, S.; Stolle, F.; Hansen, M.C. Primary forest cover loss in Indonesia over 2000–2012. Nat. Clim. Change 2014, 4, 730–735. [Google Scholar] [CrossRef]
- Tacconi, L.; Rodriguesa, R.J.; Maryudi, A. Law enforcement and deforestation: Lessons for Indonesia from Brazil. For. Policy Econ. 2019, 108, 101943. [Google Scholar] [CrossRef]
- Ekawati, S. Evaluation of the Implementation of Decentralization Policy on Production Forest Management. J. Anal. Kebijak. Kehutan. 2013, 10, 187–202. [Google Scholar]
- Cisneros, E.; Kis-Katos, K.; Nuryartono, N. Palm oil and the politics of deforestation in Indonesia. J. Environ. Econ. Manag. 2021, 108, 102453. [Google Scholar] [CrossRef]
- Chakrabarti, A. Deforestation and infant mortality: Evidence from Indonesia. Econ. Hum. Biol. 2021, 40, 100943. [Google Scholar] [CrossRef] [PubMed]
- Wolff, N.H.; Zeppetello, L.R.V.; Parsons, L.A.; Aggraeni, I.; Battisti, D.S.; Ebi, K.L.; Game, E.T.; Kroeger, T.; Masuda, Y.J.; Spector, J.T. The effect of deforestation and climate change on all-cause mortality and unsafe work conditions due to heat exposure in Berau, Indonesia: A modelling study. Lancet Planet. Health 2021, 5, e882–e892. [Google Scholar] [CrossRef] [PubMed]
- Kim, Y.; Knowles, S.; Manley, J.; Radoias, V. Long-run health consequences of air pollution: Evidence from Indonesia’s forest fires of 1997. Econ. Hum. Biol. 2017, 26, 186–198. [Google Scholar] [CrossRef]
- Leijten, F.; Sim, S.; King, H.; Verburg, P.H. Local deforestation spillovers induced by forest moratoria: Evidence from Indonesia. Land Use Policy 2021, 109, 105690. [Google Scholar] [CrossRef]
- Darmawan, A.; Hospes, O.; Termeer, C.J.A.M. Between zero-deforestation and zero-tolerance from the state: Navigating strategies of palm oil companies of Indonesia. For. Policy Econ. 2022, 136, 102690. [Google Scholar] [CrossRef]
- Wollenberg, E.; Moeliono, M.; Limberg, G.; Iwan, R.; Rhee, S.; Sudana, M. Between state and society: Local governance of forests in Malinau, Indonesia. For. Policy Econ. 2006, 8, 421–433. [Google Scholar] [CrossRef]
- Siscawati, M.; Banjade, M.R.; Liswanti, N.; Herawati, T.; Mwangi, E.; Wulandari, C.; Tjoa, M.; Silaya, T. Overview of Forest Tenure Reforms in Indonesia. Working Paper 223. Bogor, 2017. Report No.: 223. Available online: https://www.cifor.org/publications/pdf_files/WPapers/WP223Siscawati.pdf (accessed on 16 January 2023).
- Njurumana, G.N.; Ginoga, K.L.; Octavia, D. Sustaining farmers livelihoods through community forestry in Sikka, East Nusa Tenggara, Indonesia. Biodiversitas J. Biol. Divers. 2020, 21, 8. [Google Scholar] [CrossRef]
- ENT Statistical Burau. Nusa Tenggara Timur Dalam Angka 2021 (ENT in Figures 2021). Kupang, 2022. Available online: https://ntt.bps.go.id/publication/2021/02/26/28a3d01a29a82489c3f95190/provinsi-nusa-tenggara-timur-dalam-angka-2021.html (accessed on 16 January 2023).
- Meteri Kehutanan dan Perkebunan. SK Menteri Kehutanan dan Perkebunan Nomor: 423/Kpts-II/1999; Ministry of Forestry and Estates Crops: Jakarta, Indonesia, 1999. [Google Scholar]
- Menteri LHK. In SK Menteri LHK Nomor: 6615/Kpts-II/2021; Ministry of Environment and Forestry: Jakarta, Indonesia, 2021.


| Rice | Open | Vegetation | Settlement | Permanent Water | Numbers of Samples | Producer Accuracy | |
|---|---|---|---|---|---|---|---|
| Rice | 0.2653 | 0.0131 | 0.0037 | 0.0004 | 0.0002 | 0.2827 | 93.85 |
| Open | 0.0359 | 0.2636 | 0.0006 | 0.0006 | 0.0004 | 0.3010 | 87.59 |
| Vegetation | 0.0056 | 0.0056 | 0.2616 | 0.0015 | 0.0002 | 0.2745 | 95.30 |
| Settlement | 0.0037 | 0.0093 | 0.0019 | 0.1108 | 0.0002 | 0.1259 | 87.98 |
| Permanent Water | 0.0000 | 0.0007 | 0.0013 | 0.0000 | 0.0138 | 0.0159 | 87.06 |
| numbers of samples | 0.3105 | 0.2924 | 0.2691 | 0.1132 | 0.0148 | 1.0000 | |
| User Accuracy | 85.44 | 90.16 | 97.22 | 97.85 | 93.67 |
| No. | Class. of LULC | Area in 2013 (ha) | Area in 2021 (ha) | Changes (ha) | Changes (%) |
|---|---|---|---|---|---|
| 1. | Rice Field | 7283 | 5906 | −1377 | −0.74% |
| 2. | Open Land | 66,815 | 58,011 | −8804 | −4.71% |
| 3. | Other vegetation | 91,034 | 87,990 | −3044 | −1.63% |
| 4. | Settlements | 21,459 | 34,638 | 13,179 | 7.06% |
| 5. | Permanent Water | 138 | 184 | 46 | 0.02% |
| Total | 186,729 | 186,729 |
| District | Year 2015 | Year 2016 | Year 2017 | Year 2018 (1) | Year 2019 (2) |
|---|---|---|---|---|---|
| Central Sumba (ha) | 7576 | 7601 | 7601 | 4893 | 6400 |
| Landcover Types | Physical Changes | Impacts |
|---|---|---|
| Rice field |
| The positive impact is that there is an increase in the area of land in the available landscape, both through government programs and local communities. |
| Dryland agriculture |
| This phenomenon behaves similarly to the changes in the type of rice field cover. This is due to the consequences of population growth and the expansion of new areas at the village level. |
| Forest |
| Ecosystem imbalance, biodiversity degradation, soil erosion, and land degradation. |
| Settlements |
| There has been a shrinking of potential agricultural lands that have not been cleared, as well as agricultural lands that are being cultivated. |
| Aspect | Before | Current Practice/s |
|---|---|---|
| Land acquisition | All inherited | Dominantly inherited |
| Selling Riceland | Strictly prohibited | Allowed |
| Pawn | None | 10–30% household farmers do |
| Planting calendar | Decided by Marapu elders | Decided by individual farmers/household |
| Ceremonies | Yes | No |
| Labor | Household and working together | Household and paid labor |
| External inputs use | None or low | High |
| Land preparations | Using water buffalo | Mostly by tractors/machine |
| Weeding | No | Yes, manual or applied herbicides |
| Harvesting | Manual | Manual, machines |
| Product orientation | Food security | Food security, partly semi-commercial |
| Aspects | Irrigated Land | Rain-Fed Lowland |
|---|---|---|
| Ownership Status: | ||
| Own | 74.4 | 85.3 |
| Pawn | 16.3 | 9.8 |
| Others | 9.3 | 4.9 |
| Land size: | ||
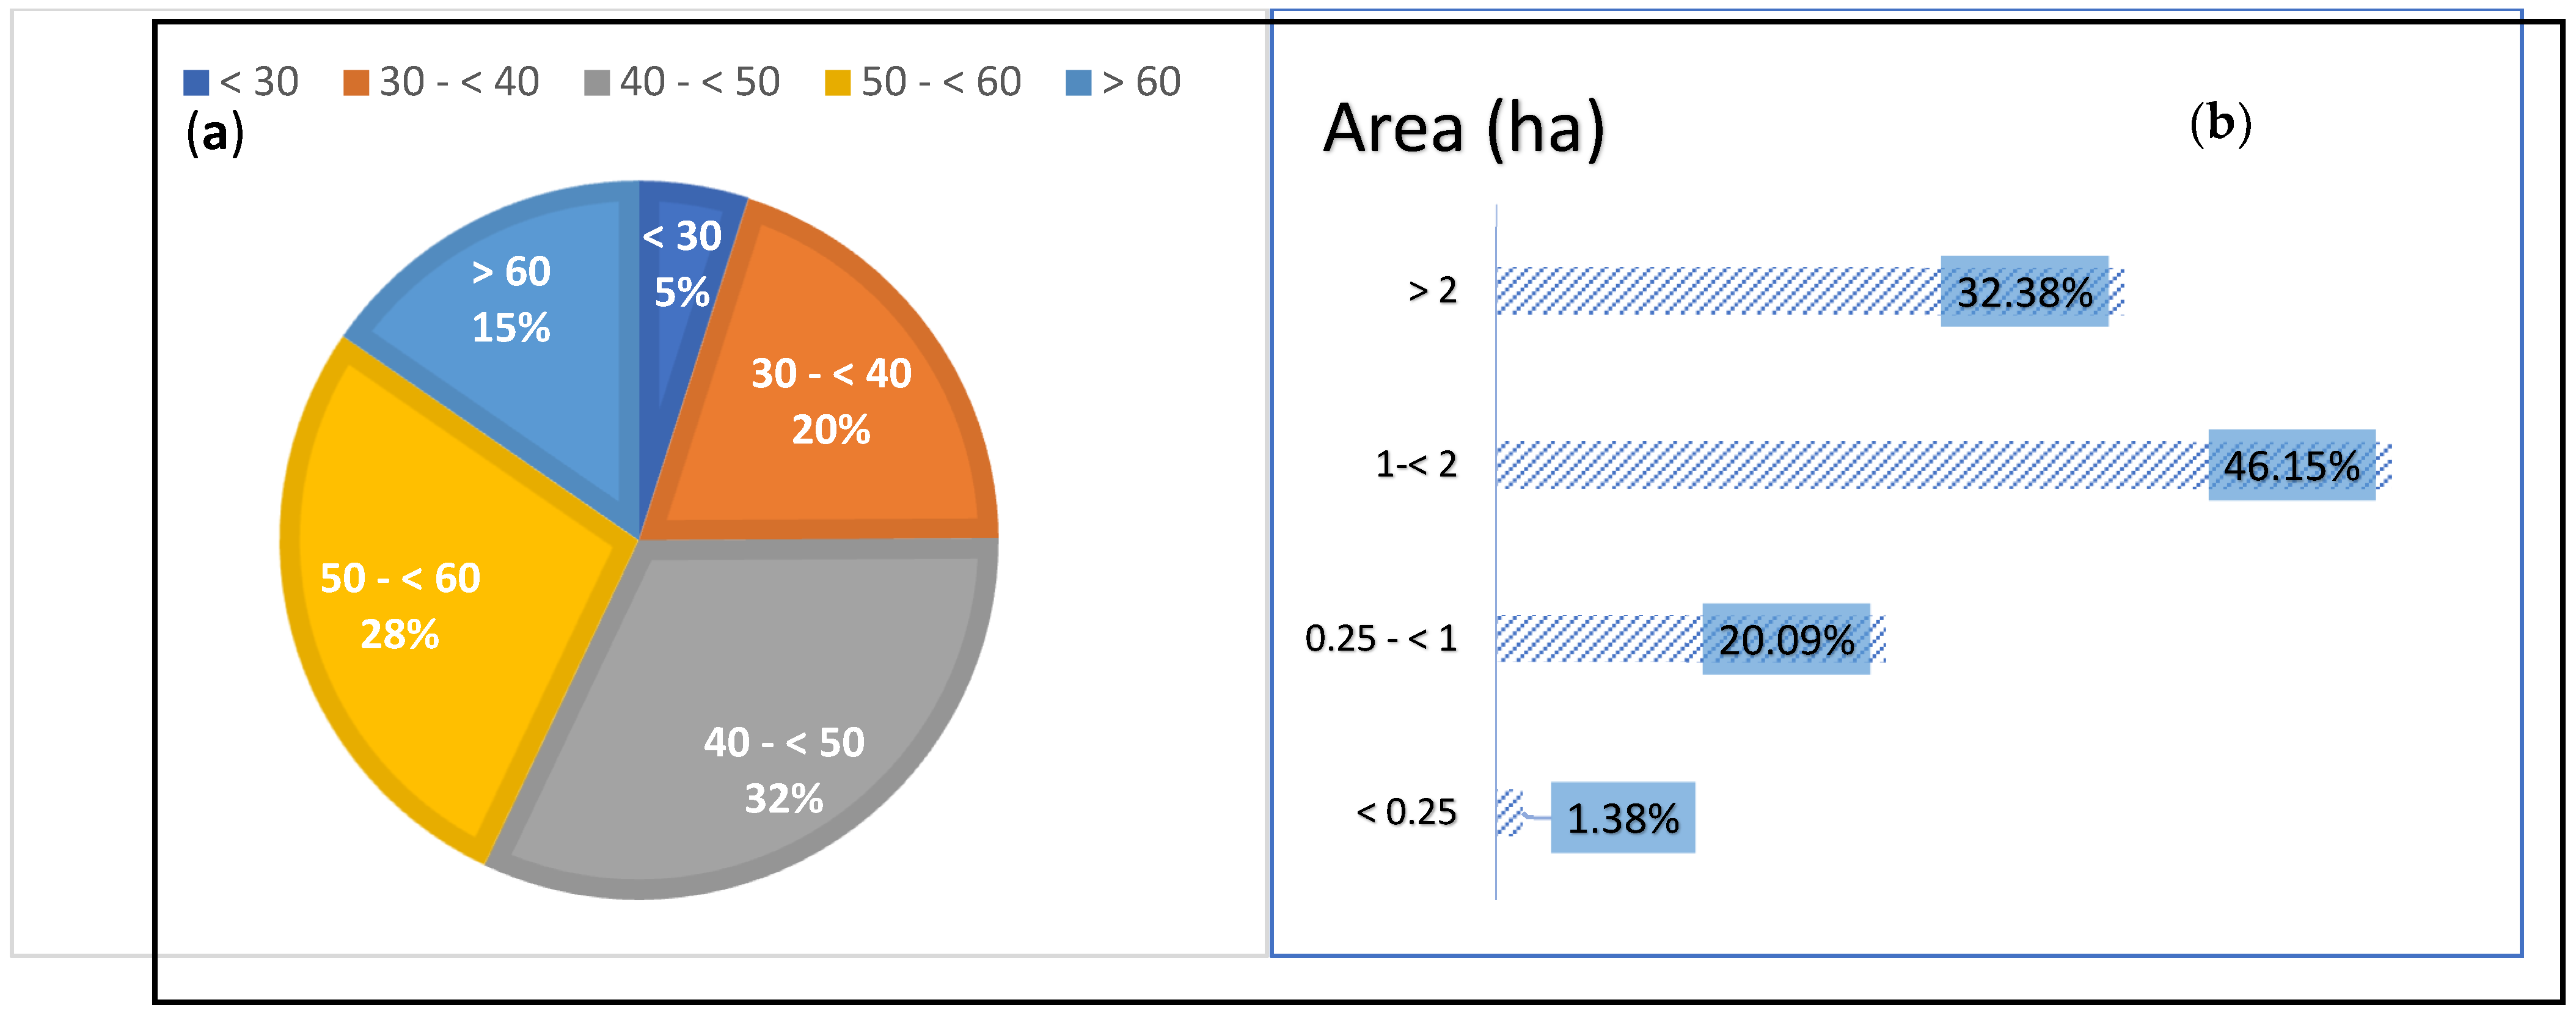
| 0.2–< 1 ha | 39.3 | 69.02 |
| 1–2 ha | 52.2 | 26.27 |
| >2 ha | 8.2 | 4.71 |
| Descriptive Statistics | min: 0.20 ha, max: 2 ha mean: 0.91 ha | min: 0.20 ha, max: 5 ha mean: 1.21 ha |
| Number of parcels: | ||
| 1 parcel | 67.8 | 73.6 |
| 2 parcels | 26.4 | 17 |
| >2 parcels | 5.7 | 9.4 |
| Descriptive Statistics | min: 1 parcel, max: 5 parcels mean: 1.36 parcels | min: 1 parcel, max: 3 parcels mean: 1.38 parcels |
| Budget for rice farming: | ||
| Own budget | 77.45 | 27.56 |
| Bank Credit/Co-operatives | 2.94 | 1.05 |
| Local moneylender | 1.96 | 0.70 |
| Pawn | 17.65 | 6.28 |
| Variable | Measurement | % |
|---|---|---|
| Changes in land size | Remains unchanged | 85.36 |
| Increase | 8.99 | |
| Decrease | 5.47 | |
| Do not know | 0.18 | |
| Changes in main function | Remains unchanged | 94.18 |
| Change to non-agriculture purposes | 2.65 | |
| Do not know | 3.17 | |
| Attitude to keep its main function | Keep as rice field | 89.10 |
| Allow to change | 5.60 | |
| Do not know | 5.30 | |
| Attitude to transfer the ownership | Not for sale | 97.0 |
| Not know | 3.00 | |
| Protecting the land through legislation | Agree | 85.00 |
| Disagree | 15.00 |
Disclaimer/Publisher’s Note: The statements, opinions and data contained in all publications are solely those of the individual author(s) and contributor(s) and not of MDPI and/or the editor(s). MDPI and/or the editor(s) disclaim responsibility for any injury to people or property resulting from any ideas, methods, instructions or products referred to in the content. |
© 2023 by the authors. Licensee MDPI, Basel, Switzerland. This article is an open access article distributed under the terms and conditions of the Creative Commons Attribution (CC BY) license (https://creativecommons.org/licenses/by/4.0/).
Share and Cite
Ngongo, Y.; deRosari, B.; Basuki, T.; Njurumana, G.N.; Nugraha, Y.; Harianja, A.H.; Ardha, M.; Kustiyo, K.; Shofiyati, R.; Heryanto, R.B.; et al. Land Cover Change and Food Security in Central Sumba: Challenges and Opportunities in the Decentralization Era in Indonesia. Land 2023, 12, 1043. https://doi.org/10.3390/land12051043
Ngongo Y, deRosari B, Basuki T, Njurumana GN, Nugraha Y, Harianja AH, Ardha M, Kustiyo K, Shofiyati R, Heryanto RB, et al. Land Cover Change and Food Security in Central Sumba: Challenges and Opportunities in the Decentralization Era in Indonesia. Land. 2023; 12(5):1043. https://doi.org/10.3390/land12051043
Chicago/Turabian StyleNgongo, Yohanis, Bernard deRosari, Tony Basuki, Gerson Ndawa Njurumana, Yudistira Nugraha, Alfonsus Hasudungan Harianja, Mohammad Ardha, Kustiyo Kustiyo, Rizatus Shofiyati, Raden Bambang Heryanto, and et al. 2023. "Land Cover Change and Food Security in Central Sumba: Challenges and Opportunities in the Decentralization Era in Indonesia" Land 12, no. 5: 1043. https://doi.org/10.3390/land12051043
APA StyleNgongo, Y., deRosari, B., Basuki, T., Njurumana, G. N., Nugraha, Y., Harianja, A. H., Ardha, M., Kustiyo, K., Shofiyati, R., Heryanto, R. B., Rawung, J. B. M., Sondakh, J. O. M., Senewe, R. E., daSilva, H., Hutapea, R. T. P., Mattitaputty, P. R., Kenduballa, Y. P., Kotta, N. R. E., Seran, Y. L., ... Nugroho, H. Y. S. H. (2023). Land Cover Change and Food Security in Central Sumba: Challenges and Opportunities in the Decentralization Era in Indonesia. Land, 12(5), 1043. https://doi.org/10.3390/land12051043