Abstract
The formation of the Jakarta Bandung Mega-Urban Region (JBMUR) has created a rapidly urbanized corridor, the JBMUR south conurbation corridor. Due to its geographical location, the expansion process in the JBMUR south conurbation corridor has caused significant social, economic, and environmental problems. This study explores and quantifies the impact of the urban expansion of the JBMUR on its south corridor, mainly on the spatial pattern and the form dynamics based on the land-use changes process, using landscape metrics and its implications on planning policy. The metrics used in this study describes a few patterns and form characteristics: density, clustering, connectivity, and shape. Those metrics are then quantitatively measured using the FRAGSTATS Urban Expansion Intensity to measure the expansion rate in four of the JBMUR South Conurbation Corridor urban areas. The result shows that the urban areas grow significantly from the core area and expand outside with the following pattern: increased urban density, less compact, and the two urban areas becoming closer/more connected. This growth intensity and pattern are happening due to the misalignment of the planning policies in the municipalities of the south corridor. It is needed for any future planning policies to mitigate these problems and create a robust plan to maintain the sustainability of the JBMUR South Conurbation Corridor as a whole.
1. Introduction
The pattern of Monsoon Asia’s urban growth tends to have an expanding pattern over the core metropolises, creating an Extended Metropolitan Regions (EMR), which will also further expand into the Mega-Urban Region (MUR) [1]. The Mega-Urban Region has a spatial and structural impact on an urban expansion and increases the regional interaction, leading towards global competitiveness [2,3]. The MUR is also created as a result of an interaction between a core metropolis with other smaller urban areas with their various roles in a system [4,5], which indicates the complexity and size of the MUR that consist of two metropolises and its surrounding areas. One of the major causes was suburbanization that occurred on a greater scale in that region, leading to the formation of a conurbation corridor. The growth and formation into mega-urban corridor are characterized by a shifting economic activity, an increasing connectivity between urban zones, a significant growth in population, and a densification of the urban zones [6,7].
The Mega-Urban Region is often a polycentric metropolitan region with multiple urban zones creating a system of regions/municipalities. Urbanization comes as a rather disruptive force in this system, as it creates an enormous and a continuous urban area. It might also lead to several problems regarding the infrastructure management, land-use conflicts due to the chaotic land-use configuration, planning and zoning failures, and environmental degradation [1,8]. It will also put food security at threat where there will be a significant agricultural land conversion in rural areas following the changes in land rent and shifting economics [9]. Urbanization, especially in terms of a rapid one, is usually the result of a lack of evaluation and control in the spatial planning implementation. A robust approach in planning and management will be needed, since the current planning policy often underestimates the rate of growth in these regions, resulting in a gap between the existing conditions and the planning policies [10,11]. Due to the top-down approaches of a spatial planning policy in developing countries, the result of planning is often unable to meet the region and its people needs and characteristics.
An unsuitable planning approach could lead to various problems, including inefficiency in infrastructure development, sprawling tendency in urban growth, fragmentation in agricultural land-use, which will reduce productivity, and disparity within urban and rural region [9,12,13]. A “saturated” metropolitan in a mega-urban system will direct their expansion towards the hinterland. The hinterland, in this case, has always become the extension of various problems of its core metropolis due to their interdependency as Schuh and Sedlacek [14] mentioned as an agglomeration effect. As the population and density increases in the hinterland these will be the catalysts for an increased commuting activity, energy use, pollution, as well as on the resources and infrastructures needed to accommodate them. Moreover, a hinterland is often burdened with both an economic (often industry) development and an environmental buffer area. All of those functions and dynamics crammed into a hinterland further elaborate the need for a comprehensive and multidimensional approach in hinterland planning.
The Jakarta-Bandung Mega-Urban Region (JBMUR) is the biggest Mega-Urban Region in Indonesia followed by the monsoon Asia-urban development, where urban expansion is headed towards its surrounding urban zones, the hinterland, and the rural areas. The JBMUR is formed from the agglomeration process of Jakarta with its surrounding areas (Bogor, Depok, Tangerang, Bekasi) and Bandung with its surrounding areas [15]. Along the agglomeration process, both the metropolitan (Jakarta and Bandung Metropolitan) developed into a polycentric region, and with their increased interaction also expanded into a bigger formation of the agglomeration corridor that will form the JBMUR [16]. This growth and expansion have caused their hinterland to turn into a peri-urban or urban fringes with mixed characteristics of both urban and rural often mentioned as desakota [17]. The expansion in both the metropolitan areas has caused a decline in the environmental carrying capacity, Rustiadi et al. [2,5] also stated that the JMA already exceeded the carrying capacity, coupled with the state of the Puncak-Cianjur region, which also exacerbates it [10,11]. In addition, the environmental carrying capacity in the BMA also experiencing the same trend [18,19] due to the various land-use change and conversions.
The JBMUR has two main conurbation corridors, with both of them experiencing rapid urbanization and urban expansion with a significantly higher intensity than the surrounding areas. The expansion in the north corridor (Bekasi-Karawang corridor) came in the form of a massive paddy field conversion to an industrial area and creating a significant shift in the economic activity since the Bekasi and Karawang regency are one of the largest rice producers in Indonesia [20,21]. The southern corridor (Bogor-Cianjur-West Bandung corridor) expansion came in the form of paddy field conversion, conserved/protected area conversion, and the formation of a new urban zone, a mountainous Puncak-Cipanas urban zone [10,11]. The JBMUR southern conurbation corridor is functioning as a hinterland and an environmental buffer for both metropolitan, meaning that the JBMUR southern conurbation corridor has an important role in maintaining the environmental sustainability in the JBMUR as well as serving as one of its urban corridors. Most of the hinterland in the south conurbation corridor, is referred to in the spatial planning and is often planned as a rural area, focusing on agriculture-centered activities and serving as an environmental balance to the heavily urbanized core of the JMA and BMA [22,23,24].
The rapid growth of the JBMUR south conurbation corridor has led to a concentrated development orientation in its several urban zones. This concentrated development can lead to inequality and to an increasing disparity in the urban and rural areas. In the long term, this uneven spatial development might cause an impact on the economy, infrastructure, population, and even the socio-economic balance between the rural and urban areas [4,13,25]. This research aims to analyze and quantify the impact of the expansion occurring in the JBMUR south conurbation corridor on its land-use change, spatial pattern, and form of land-uses, and also how the planning policy in the municipalities of the JBMUR south conurbation corridor is affected and/or affecting this phenomenon and the regional sustainability. Using remotely-sensed data, spatial metric, and the urban expansion index, the urban expansion on the JBMUR south conurbation corridor was investigated based on its spatial pattern and form in the study area in 2000, 2010, and 2020.
2. Materials and Methods
2.1. Study Area
This research is conducted on the JBMUR south conurbation corridor, located between Jakarta and the Bandung Metropolitan Area in West Java Province (Figure 1). The agricultural sector still dominates the economic activities in the JBMUR south conurbation corridor from 2000–2020 and is the most contributing sector in Bogor, Cianjur, and West Bandung Regency with an average of over 50% in 2000 but now decreasing to just around 34% of the overall GDP contribution in 2020 [26]. The JBMUR south conurbation corridor is classified as a city-region, where the region itself is not fully urban but also not fully rural. The JBMUR south conurbation corridor roughly has four urban cores: Bogor urban area, Cianjur urban area, Puncak-Cipanas urban area, and West Bandung urban area. The JBMUR south conurbation corridor also has one of the busiest road networks in West Java province: Puncak (Bogor-Bandung) artery road that connects both metropolitan areas [15]. This research focuses on the spatial observations and the analyses regarding the urban expansion, land-use patterns, and form changes of the urban areas.
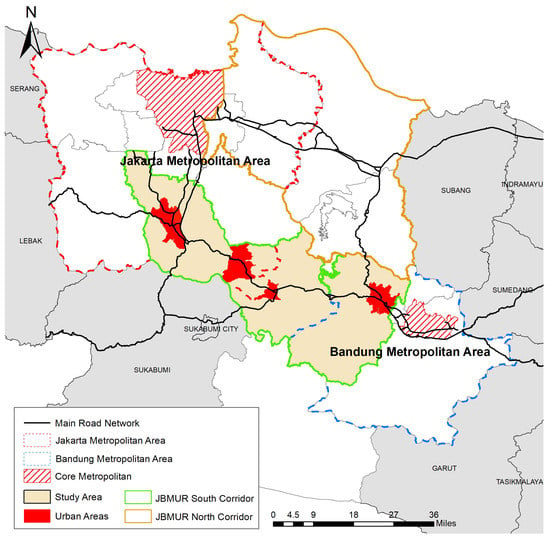
Figure 1.
Study area map.
2.2. Data
This research mostly used processed LANDSAT imagery from 2000–2020 to extract the land-use data using a supervised classification method and a maximum likelihood algorithm. The training samples will be provided from the field observations conducted in 2020, numbering at around 4482 training pixels based on the field survey. The supervised classification result gives a 94% accuracy on the land-use maps from the field observation results. The land-use derived from the LANDSAT are then classified into six classes: built-up (settlement, industrial area, facilities and services, commercial area), water (river and lake), dryland, mix garden, paddy field, and forest. Additional statistical data from each of the administrative regions are also used, as well as the spatial data derived from West Java, Jabodetabekpunjur, and Bandung Metropolitan’s spatial planning.
2.3. Methods
2.3.1. Concentric Ring Analysis
The concentric ring analysis is employed to divide both the urban areas into a series of concentric rings from the city center to the urban extent [27,28]. This analysis is used to determine the unit of analysis in the spatial metrics, where each ring has an interval of 1 km in diameter. This analysis is of significance as to where the urban core is defined, or the urban core as the birthplace of an urban area that will determine the rate and direction of its growth [29]. In this research, the urban core is defined by a field observation with indicators as follows: the agglomeration of a public facility, the center of government activity (in the district or sub-district level), the density of the population, and the proportion of built-up and agricultural land-uses. The series of 1 km equidistant buffer rings are shown in Figure 2.
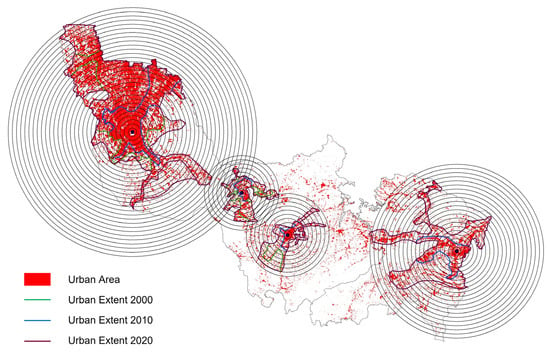
Figure 2.
Series of urban concentric rings covering the entire urban extent in JBMUR South Conurbation Corridor.
2.3.2. Spatial Metric
Both the spatial metric or landscape metric are used to quantify the spatial pattern and form indices based on several metric measurements, using raster-based data on a defined landscape [30,31,32]. The scale of measurement in this research will be on a “class” scale, where a patch will represent a group of adjacent cells with the same values, class is the group of patches with the same value that represents the land-use category, and landscape is the entirety of the observed area [33,34,35]. The landscape in the context of this research refers to the extent of the concentric rings series of the four urban areas in the JBMUR south conurbation corridor, class refers to each land-use classification, patch is each unit of contiguous land-use cell (or a single land-use polygon feature in a vector dataset), and cell is the same as pixel of the raster data with a specific value. Eight metrics representing form and pattern indication is used to explain the land-use change and the urban expansion in the JBMUR south conurbation corridor, with detailed explanation in Table 1. Those eight metrics are then divided into five urban form indicators as follows:

Table 1.
Detailed explanation of eight spatial metrics.
- Density (PD);
- Landscape Dominance (PLAND and LPI);
- Shape/Form (SHAPE);
- Continuity (COHESION and CONTIG);
- Fragmentation (MESH and SPLIT).
The calculation for these metrics is performed using the FRAGSTATS [30] with class-level analysis. The unit of analysis on this research is on each land-uses class (Figure 3).
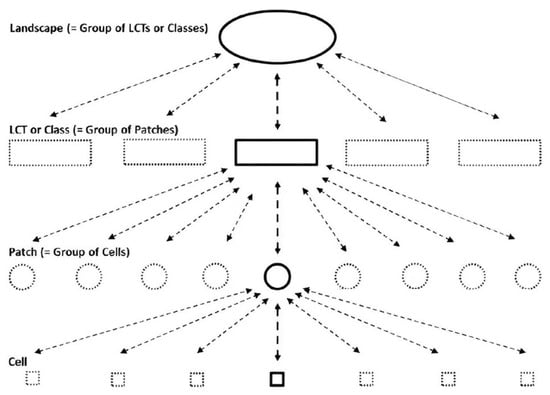
Figure 3.
Analysis unit of spatial metric.
2.3.3. Urban Expansion and Landscape Fragmentation Intensity
This research used two indices in addition to the spatial metrics to explain the pattern of expansion and fragmentation in the observed area as the dynamic goes on. The Urban Expansion Intensity (UEI) and the Fragmentation Change Intensity (FCI) Index are both used to explain the process of land conversion and exchange that happens in a rapidly urbanizing landscape [27]. The UEI index measures the expansion rate of the urban land-use (built-up class) in the urban areas of the JBMUR south conurbation corridor and are further detailed in each layer of a concentric ring of its urban area. In contrast, the FCI index is used to measure the converted non-urban land use, which has a significant environmental impact on the urban expansion (forest, mixgarden and paddy class). The UEI index is calculated using the formula in Equation (1):
where A is the total landscape area, Ut+n and Ut are the built-up areas at time point t + n and t, respectively. The higher value of the UEI represents the higher intensity and rate of urban expansion. Coupled with the concentric ring analysis, it can be used to determine the speed of expansion and the direction of expansion.
Since the FCI index is based on the fragmentation value in relation to its total landscape area, this index is calculated using the MESH metric value. MESH combines the ecological process, landscape composition, and spatial pattern, and it is more comprehensive and objective in characterizing landscape fragmentation [36]. The FCI index is calculated using the formula in Equation (2):
where Mt+n and Mt are the MESH values of non-urban/converted land-use classes (forest and paddy) in time point t + n and t, and A and n are the same as the UEI. Since higher values of MESH represent less fragmented landscape, the lower value of the FCI indicates an increasing fragmentation of non-urban land-uses. The FCI value of all non-urban land-use classes are aggregated to give a better view on how land-use changes happen and convert those non-urban into urban land use. Those intensity indexes are calculated for the time period of 2000–2020 for the JBMUR south conurbation corridor’s urban areas.
3. Results
3.1. Land-Use Dynamic of the JBMUR South Conurbation Corridor
Over the course of 20 years (2000–2020), the JBMUR south conurbation corridor has been experiencing rapid changes in its land-use, and in turns its spatial pattern, primarily the urban area along the urban cores of Jakarta-Bogor corridor, Puncak-Cipanas, Cianjur, and West Bandung urban area itself. In 2000, the Puncak-Cipanas urban areas have not yet massively developed (both physically and its planning policy) leaving the Bogor-urban core to start to expand and forming a corridor, following the expansion of the Jakarta Metropolitan Area. From the remotely sensed data, it can be derived that the urban land-use is only measured at around 10.26% of the entire JBMUR south conurbation corridor area in 2000. In 2020, the Bogor-urban core had expanded to more than twice its size from its expansion from the Jakarta Metropolitan Area. The Puncak-Cipanas, Cianjur, and West Bandung urban areas also expanded and formed a conurbation corridor, following the major road networks. The urban land uses in 2020 have also increased to 22.27% and with the increasing trends of urban expansion, the urban land use will be predicted to grow at around 1% annually as shown in Table 2 and Figure 4 and Figure 5.

Table 2.
Area and Percentage of the JBMUR south conurbation corridor land-use in 2000–2020.
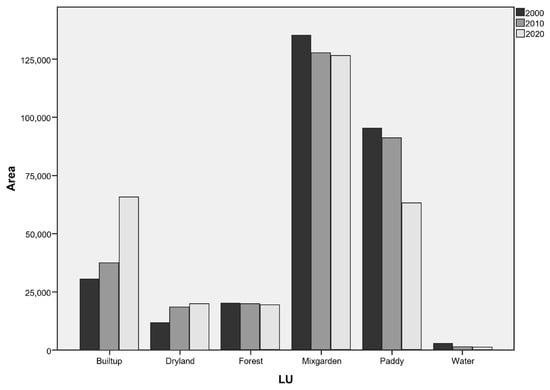
Figure 4.
Overview of land-use area dynamics of JBMUR south conurbation corridor in 2000, 2010, and 2020 period.
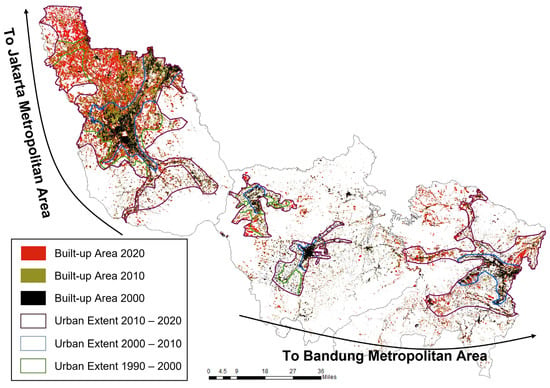
Figure 5.
Urban growth of JBMUR South Conurbation Corridor.
The pattern of land-use changes in the JBMUR south conurbation corridor consist of changes in non-urban land uses (mixgarden, forest, and paddy) turning into urban uses (Figure 6). This pattern proves the early hypothesis of the changes happening in the JBMUR south conurbation corridor [1,10,15] and its change is further enhanced by the national planning policy in 2017, which places the JBMUR south conurbation corridor as the dedicated environmental buffer area (especially in the Puncak-West Bandung corridor) and a peri-urban area of the Jakarta and Bandung Metropolitan Area (JMA and BMA) (Figure 1).
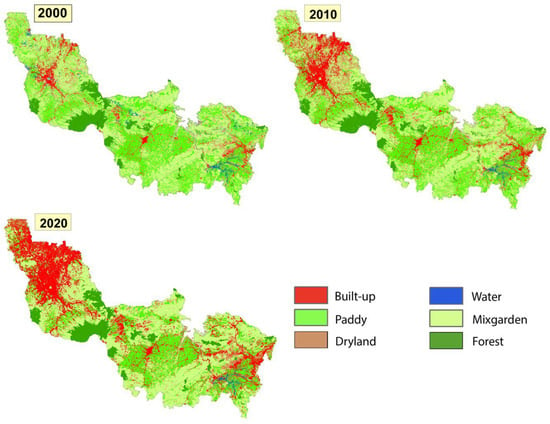
Figure 6.
Land-use map of JBMUR south conurbation corridor 2000–2020.
This type and pattern of land-use change not only occurs in the JBMUR south conurbation corridor, but also in the entire peri-urban area surrounding both the JMA and BMA [6,22,37,38,39,40]. This pattern also follows the McGee and Greenberg [1] theory of Monsoon Asia’s extended metropolitan expansion process, and it also will further define the formation of the JBMUR [15,37].
3.2. Form and Pattern Changes in the Urban Zones of JBMUR South Conurbation Corridor
Urban form and spatial pattern carry a significant correlation with the regional sustainability aspect [41], such as urban health and quality of life [42,43]. Therefore, an understanding of urban typology based on its form and pattern is needed to explore the key aspect of the sustainability of a built environment and its dynamic. Based on the synthesis between the spatial planning in each municipality (Bogor, Cianjur, and West Bandung) and from the field observation, the JBMUR south conurbation corridor can be characterized into four different urban zones, with the characteristics as follows [44,45]:
- High concentration and intensity of built-up area;
- High diversity of urban land-use and activities;
- High availability of services and infrastructures;
- High social diversity;
- Low distance from nearest urban core (municipality level).
Those urban zones, as well as the extent of the urban zones are: (i) Bogor Urban Area; (ii) Puncak-Cipanas Urban Area; (iii) Cianjur Urban Area; and (iv) West Bandung Urban Area (Figure 3).
The form and pattern changes in all of the urban zones in the JBMUR south conurbation corridor has a similarity where landscape dominance and continuity tend to diminish in the outer ring, while fragmentation, shape complexity, and patch density often increase in the outer ring due to the sprawling types of urban development (Figure 7). The trend of those spatial patterns from 2000–2020 also show a sign of increase in landscape dominance, density, landscape continuity, and shape complexity; while fragmentation shows a sign of decrease over the 2000–2020 trend. An increase in density means that the number of patches per square km is higher in 2020 than 2000 (while the number of patches almost always indicates new urban areas). Landscape Dominance value is almost always positively correlated with density due to the nature of both indicators reflecting how the patches dominate its landscape [33,46]. Landscape dominance in urban areas is experiencing quite a massive increase as the urban expansion phenomena happens in the region. The continuity in the JBMUR south conurbation corridor is experiencing an increase in the Cohesion index over the years. While the contiguity index might have been decreasing, it can still be concluded that the overall continuity is increasing, albeit the continuity of the patches is only presented minimally (hence the decreasing CONTIG value). The continuity aspect in this region is rather complex because the nature of growth is prone to the formation of urban sprawl [25,35,47].
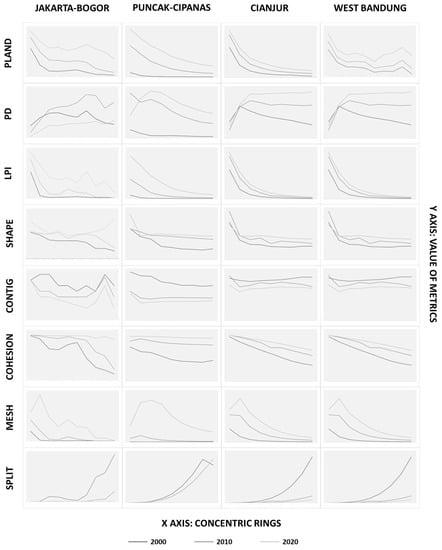
Figure 7.
Comparison of urban land-use spatial pattern between Jakarta-Bogor, Puncak-Cipanas, Cianjur, and West Bandung urban area.
In addition to the increase in those indicators, there is also a decrease in the Fragmentation indicators. The Fragmentation indicators are represented by both the MESH and SPLIT index, where a high MESH indicates low fragmentation and a high SPLIT indicates high fragmentation [37,48]. Both urban areas have a high MESH index and a low SPLIT index, which complements each other in indicating the decrease in fragmentation of urban land use. Lastly, the Shape/form indicator experiences a slight increase at around 1–1.5 value. It could be interpreted that the urban land uses in both the urban areas have become less compact due to all the expansion processes happening in the JBMUR south conurbation corridor.
When compared directly (Figure 7), all four urban areas share relatively the same change pattern while the difference is located on the pattern changes’ intensity or degree. Generally, the Jakarta-Bogor urban corridor always comes with higher intensity of changes in its indicators and metrics. The Jakarta-Bogor urban corridor also has a fluctuating metrics value in its series of concentric rings. This pattern happens mainly because the effect of urban expansion coming from the Jakarta Metropolitan Area has been directly experienced by the Jakarta-Bogor urban corridor as it is bordering directly with the Jakarta metropolitan core. Another cause of the massive growth in the Jakarta-Bogor urban corridor is due to the development of Depok City that facilitates Jakarta’s growth and passed it towards the Jakarta-Bogor corridor.
While the pattern of urban land-use in the urban areas has a similar pattern, the same thing cannot be said for non-urban uses. The non-urban land-use change pattern is the complete opposite of the urban land use. There are decreasing density, continuity, and dominance, as non-urban land-use is always converted into urban land continuously. The opposite also happens in fragmentation, where non-urban land uses have an ever-increasing fragmentation metric. This leaves non-urban land uses to be more vulnerable to further conversion because of the smaller and insignificant patches spreading across the urban area.
3.3. Urban Growth and Expansion Intensity
The Urban Expansion Intensity (UEI) index quantifies urban growth and its intensity over a certain period of time. This research UEI index analyzed the comparison of four urban areas in the JBMUR south conurbation corridor, explaining its growth rate and its direction. As shown in Figure 8, the UEI index of the Urban Areas in the JBMUR south conurbation corridor is seen to have varied characteristics. The intensity of the urban expansion in the Jakarta-Bogor urban corridor shows the highest intensity, with varying rates that increases from the first ring, maxed out at the 19th–21st ring and went down at the end of the urban extent. The fact that Jakarta-Bogor’s urban expansion index fluctuates in the 4th–26th ring with an increasing trend shows that the formation of these urban corridors is getting stronger and denser in contrast to the urban core where the urban areas have already been established in the 2000s with further development following the outlying and edge-expansion pattern of urban expansion (Figure 9). The urban expansion pattern in the Puncak-Cipanas and Cianjur urban area also shows an edge-expansion pattern with compaction inside the main urban core. It can also be seen that the direction of expansion in the Puncak-Cipanas and Cianjur urban area is heading towards the eastern and western part of the region, showing heavy influences coming from the two metropolises (the JMA and BMA). Meanwhile, the urban expansion index of the West Bandung urban area is slightly different with a mainly outlying and sprawled pattern towards the Cianjur urban area. These patterns are due to the enactment of the planning policy, which gave way to the industrialization along the Cianjur and West Bandung main transportation networks.
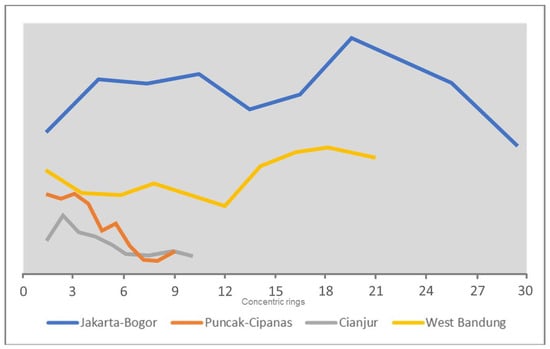
Figure 8.
Urban Expansion Intensity (UEI) index of JBMUR south conurbation corridor in 2000–2020.

Figure 9.
Patterns of urban expansion.
An overall ribbon development is shown to be characterized in all of the urban areas, with different degree and intensity among them. The Jakarta-Bogor urban corridor is the one which has the largest urban expansion, as well as intensity since it was the direct force of expansion from the JMA. The force of expansion coming from the BMA seems to be lower, but with a more sprawled and dispersed pattern, which needs to be properly monitored and controlled in the planning policy. Additionally, as predicted by Dorodjatoen [15] and Firman [37], the JBMUR south conurbation corridor will likely stay and be established as one of the main growth poles in the JBMUR, starting from the Jakarta-Bogor urban corridor then following the main transportation network to the Puncak-Cipanas, Cianjur, and Bandung Barat urban areas leading to the BMA. The pattern and direction of the urban expansion will also merge the existing urban areas into one continuous urban area in ribbon forms.
While the urban land uses are experiencing growth and expansion with high intensity, non-urban land-uses are experiencing fragmentation and shrinking in size, as explained by the Fragmentation Change Intensity (FCI) index. As shown in Figure 10, the Jakarta-Bogor urban corridor also has the highest FCI value in addition to its expansion index. The Fragmentation intensity in the Jakarta-Bogor urban corridor keeps on increasing to the outer ring, showing that the changes in the non-urban to urban land-use happens mostly towards the outer ring and that the conversion also lead to the fragmentation of non-urban land-use. Other urban areas show similar patterns in the innermost and outermost ring, with varying degree and dynamics. It is shown that the overall land-use change happens when urban land-uses emerge in the inner core urban area by converting existing non-urban land-use.
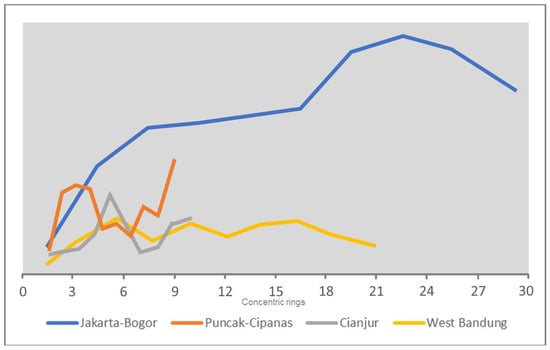
Figure 10.
FCI index on non-urban (paddy, mixgarden, and forest) land use.
4. Conclusions
The urban expansion in the JBMUR south conurbation corridor has shown how it influences the transformation of its urban areas over the years. The Puncak-Cipanas urban area and the Jakarta-Bogor urban corridor are the visible result of an urban zone formation due to the intensity of its urban expansion. There are two urban areas that have unique characteristics, which are the newly emerged Puncak-Cipanas urban area with a shifting and mixed characteristic between the urban and agricultural area as a result of the expansion from both the JMA and BMA, and then there is the Jakarta-Bogor urban corridor that has been overly expanded from Bogor city, which is adjacent to the JMA and has been in the direction of JMA urban expansion over the years. Meanwhile, the Cianjur and West Bandung urban areas are the only planned urban areas (as referenced in the spatial planning policy) in the JBMUR south conurbation corridor, where those two are the capital or the center of its respective municipality.
The LUCC on the JBMUR south conurbation corridor has a similar pattern where the urban/built-up land-uses grow exponentially, converting non-urban land-use (paddy, mixgarden, and forest) with over 100% urban land-use growth. The trend of the spatial pattern and form dynamics in the JBMUR south conurbation corridor shows that the urban zones have a more compact and denser pattern, with a ribbon expansion following the transportation network. Meanwhile, in the outer circle, the urban form shows a sprawl and dispersed characteristics forming corridors along the transportation network. All four of the urban areas shares a similarity in the characteristics with differences in the intensity, where the Jakarta-Bogor urban corridor having the most dynamic urban form due to the intense urban expansion coming from the adjacent JMA. The Urban Expansion Intensity is also the highest at the Jakarta-Bogor urban corridor, with the same pattern as the other urban areas where the middle-outer ring’s UEI is more intense with an increasing trend, showing an urban corridor formation along all the urban areas. The fragmentation of the non-urban land-use is happening at a higher intensity outside of the urban area, where it happens largely due to the outward movement of higher-intensity urban expansion and that it mostly converts into non-urban land-use into an urban one.
The absence of a planning policy at the scale of Mega-Urban Region, leaves the JBMUR south conurbation corridor to mostly grow organically due to the fact that spatial planning policies in each of the municipalities are unable to truly capture the dynamics and interactions from both metropolises and its hinterlands. The limited hierarchy of spatial planning severely affects the level of management of this Mega-Urban corridor planning, and often a misalignment, from each hierarchy, happens as a result of an uncontrollable urban growth and land conversion, with a sprawling development pattern to add.
The spatial planning policy highly influenced urban growth and expansion in the JBMUR south conurbation corridor, both the policy in each of the municipalities themselves and the policies in the two metropolises surrounding the corridor. By that condition, the spatial planning policy in Indonesia (especially in the region surrounding a metropolitan area) needs to be integrated well with those metropolises and merged into a new Mega-Urban spatial planning hierarchy to act as the limitation for the never-ending growth of the Mega-Urban Region. The spatial planning policy must also consider the region’s characteristics, potential, and threat, to be able to maximize the dynamics going on surrounding the Mega-Urban corridor.
This research mainly explores the spatial pattern of land-uses, which in turn explains the expansion process and form patterns. This study shares a similar approach with Jiao et al. [27] and Rustiadi et al. [2], with some differences in that this research tries to build an argument on how urban areas, in a sense interact with each other and influence their urban forms. Jiao et al. [27] approaches are more towards the uses of big data and the common form that can be extracted from several cities, while Rustiadi et al. [2] puts a bigger emphasis on the rice fields and rice production systems. How urban areas are explained in this fashion depends on the intensity and distribution of urban land-uses, which often concentrate in the urban center/core. Urban expansion also brings various other impacts, aside from the spatial pattern that has yet to be further explained in this research; while it might act as a limitation in this research, it could also lead to the possibilities of future research, where the result of this research could act as the base towards a more socio-economic oriented impact of urban expansion.
Author Contributions
Conceptualization, A.J. and E.R.; methodology, A.J., E.R., B.J. and D.O.P.; software, A.J., E.R. and D.O.P.; validation, A.J., E.R., B.J. and D.O.P., formal analysis, A.J.; investigation, A.J., E.R., B.J. and D.O.P.; resource, A.J., E.R., B.J. and D.O.P.; data curation, A.J. and E.R.; writing—original draft preparation, A.J.; writing—review and editing, A.J., E.R., B.J. and D.O.P.; visualization, A.J.; supervision, A.J., E.R., B.J. and D.O.P.; project administration, A.J. and E.R.; funding acquisition, A.J. and E.R. All authors have read and agreed to the published version of the manuscript.
Funding
This research was funded by PMDSU Scholarship from Ministry of Research and Technology/National Research and Innovation Agency of Republic Indonesia.
Data Availability Statement
Not applicable.
Acknowledgments
The authors would like to thank the West Java Government, West Java Spatial Planning Department, West Java Planning and Development Bureau, Ministry of Research and Technology/National Research and Innovation Agency of Indonesia for granting the scholarship. The author would also like to thank the reviewers and the editor for their helpful and constructive comments that greatly contributed towards improving this paper.
Conflicts of Interest
The authors declare no conflict of interest.
References
- McGee, T.G.; Greenberg, C. The Emergence of Extended Metropolitan Regions in ASEAN. ASEAN Econ. Bull. 1992, 9, 10–34. [Google Scholar] [CrossRef] [PubMed]
- Rustiadi, E.; Pravitasari, A.E.; Setiawan, Y.; Mulya, S.P.; Pribadi, D.O.; Tsutsumida, N. Impact of continuous Jakarta megacity urban expansion on the formation of the Jakarta-Bandung conurbation over the rice farm regions. Cities 2021, 111, 103000. [Google Scholar] [CrossRef]
- D’Amour, B.C.; Reitsma, M.; Baiocchi, G.; Barthel, S.; Guneralp, B.; Erb, K.H.; Haberl, H.; Kreutzig, F.; Seto, K.D. Future urban land expansion and implications for global croplands. Proc. Natl. Acad. Sci. USA 2017, 114, 8939–8944. [Google Scholar] [CrossRef]
- Douglass, M. Mega-Urban Regions and World City Formation: Globalisation, the Economic Crisis and Urban Policy Issues in Pacific Asia. Urban Stud. 2000, 37, 231–245. [Google Scholar] [CrossRef]
- Rustiadi, E.; Pribadi, D.O.; Pravitasari, A.E.; Indraprahasta, G.S.; Iman, L.O. Jabodetabek Megacity: From City Development towards Urban Complex Management System. In Urban Development Challenges, Risks and Resilience in Asia Mega Cities, Advances in Geographical and Environmental Sciences; Singh, R.B., Ed.; Springer: Tokyo, Japan, 2015; pp. 421–445. [Google Scholar]
- Rustiadi, E.; Mizuno, K.; Kobayashi, S. Measuring Spatial Pattern of the Suburbanization Process. J. Rural. Plan. Assoc. 1999, 18, 31–42. [Google Scholar] [CrossRef]
- Cournane, F.C.; Cain, T.; Greenhalgh, S. Attitudes of a Farming Community Towards Urban Growth and Rural Fragmentation—An Auckland Case Study. Land Use Policy 2016, 58, 241–250. [Google Scholar] [CrossRef]
- Sorensen, A.; Okata, J. Megacities: Urban Form, Governance, and Sustainability; Springer: Tokyo, Japan, 2011; pp. 301–302. [Google Scholar]
- Ramachandra, T.; Bharath, H.; Vinay, S.; Joshi, N.; Kumar, N.; Venugopal, R. Modelling Urban Revolution in Greater Bangalore, India. In Proceedings of the 30th Annual In-House Symposium on Space Science and Technology, Bangalore, India, 7–8 November 2013. [Google Scholar]
- Jatayu, A.; Rustiadi, E.; Pribadi, D.O. A Quantitative Approach on Characterizing the Changes and Managing Urban Form for Sustaining the Suburb of Mega Urban Region: The Case of North Cianjur. Sustainability 2020, 12, 8085. [Google Scholar] [CrossRef]
- Jatayu, A.; Saizen, I.; Rustiadi, E.; Pribadi, D.O.; Juanda, B. Urban Form Dynamics and Modelling towards Sustainable Hinterland Development in North Cianjur, Jakarta–Bandung Mega-Urban Region. Sustainability 2022, 14, 907. [Google Scholar] [CrossRef]
- Batty, M.; Xie, Y.; Sun, Z. Modelling Urban Dynamics through GIS-Based Cellular Automata. Comput. Environ. Urban Syst. 1999, 23, 205–233. [Google Scholar] [CrossRef]
- Marinescu, I.E.; Ayram, S. Evaluation of Urban Fragmentation in Craiova City, Romania. Landsc. Environ. Eur. Identity 2012, 14, 207–215. [Google Scholar] [CrossRef]
- Schuh, B.; Sedlacek, S. City, Hinterlands—Sustainable Relations. In Proceedings of the 40th Congress of the European Regional Association (ERSA), Barcelona, Spain, 29 August–1 September 2000. [Google Scholar]
- Dorodjatoen, A.M. The Emergence of Jakarta-Bandung Mega-Urban Region and Its Future Challenges. J. Perenc. Wil. Dan Kota 2009, 20, 15–33. [Google Scholar]
- Kurnianti, D.N.; Rustiadi, E.; Baskoro, D.P.T. Land Use Projection for Spatial Plan Consistency in Jabodetabek. Indones. J. Geogr. 2015, 47, 124–131. [Google Scholar] [CrossRef]
- McGee, T.G. The Emergence of Desakota Regions in Asia: Expanding a Hypothesis. Ext. Metrop. Settl. Transit. Asia 1991, 12, 3–25. [Google Scholar]
- Samodra, P.; Rahmatunnisa, M.; Endyana, C. Kajian Daya Dukung Lingkungan dalam Pemanfaatan Ruang di Kawasan Bandung Utara. J. Wil. Dan Lingkung. 2020, 8, 214–229. [Google Scholar] [CrossRef]
- Wajdi, R. Daya Dukung dan Daya Tampung Lingkungan Hidup Berbasis Jasa Ekosistem di Kawasan Cekungan Bandung. In Prosiding FTSP Series 2; Penerbit Itenas: Bandung, Indonesia, 2021. [Google Scholar]
- Murtadho, A.; Usra, R.H.; Wulandari, S.; Rustiadi, E. Flood-vulnerability Area Analysis in Karawang Regency as an Impact of Jakarta-Bandung Mega-Urban Region Formation Using Weighted Overlay Approach. In Proceedings of the Sixth International Symposium on LAPAN-IPB Satellite, Bogor, Indonesia, 24 December 2019. [Google Scholar]
- Murtadho, A.; Pravitasari, A.E.; Munibah, K.; Rustiadi, E. Spatial Distribution Pattern of Village Development Index in Karawang Regency Using Spatial Autocorrelation Approach. J. Pembang. Wil. Dan Kota 2020, 16, 102–111. [Google Scholar] [CrossRef]
- Fitriani, R. The Extent of Sparwl in the Fringe of Jakarta Metropolitan Area from the Perspective of Externalities. In Proceedings of the 55th Annlual Australian Agricultural and Resource Economics Society Conference, Melbourne, Australia, 8–11 February 2011. [Google Scholar]
- Hudalah, D.; Firman, T. Beyond Property: Industrial Estates and Post-Suburban Transformation in Jakarta Metropolitan Region. Cities 2012, 29, 40–48. [Google Scholar] [CrossRef]
- Pribadi, D.O.; Pauleit, S. Peri-Urban Agriculture in Jabodetabek Metropolitan Area and Its Relationship with the Urban Socioeconomic System. Land Use Policy 2016, 55, 265–274. [Google Scholar] [CrossRef]
- Bharath, H.; Chandan, M.; Vinay, S.; Ramachandra, T. Modelling Urban Dynamics in Rapidly Urbanising Indian Cities. Egypt. J. Remote Sens. Space Sci. 2018, 21, 201–210. [Google Scholar] [CrossRef]
- West Java Statistical Bureau. West Java in Figures 2021; West Java Government: Bandung, Indonesia, 2021. [Google Scholar]
- Jiao, L.; Xu, G.; Xiao, F.; Liu, Y.; Zhang, B. Analyzing the Impacts of Urban Expansion on Green Fragmentation Using Constraint Gradient Analysis. Prof. Geogr. 2017, 69, 22–32. [Google Scholar] [CrossRef]
- Rodrigue, J.P. The Geography of Transport Systems; Routledge: New York, NY, USA, 2017. [Google Scholar]
- Xu, G.; Dong, T.; Cobbinah, P.B.; Jiao, L.; Sumari, N.S.; Chai, B.; Liu, Y. Urban Expansion and Form Changes Across African Cities with a Global Outlook Spatiotemporal Analysis of Urban Land Densities. J. Clean. Prod. 2019, 224, 802–810. [Google Scholar] [CrossRef]
- McGarigal, K.; Marks, B.J. FRAGSTATS: Spatial Pattern Analysis Program for Quantifying Landscape Structure; United States Department of Agriculture: Corvallis, OR, USA, 1995. [Google Scholar]
- Gustafson, E.J. Quantifying Landscape Spatial Pattern: What Is the State of the Art. Ecosystems 1998, 4, 143–156. [Google Scholar] [CrossRef]
- Hargis, C.D.; Bissonette, J.A.; David, J.L. The behavior of Landscape Metrics Commonly Used in the Study of Habitat Fragmentation. Landsc. Ecol. 1998, 13, 15–23. [Google Scholar] [CrossRef]
- Debbage, N.A. Quantifying Urban Form Via Spatial Metrics and Its Climatic Implication; The University of Georgia: Athens, GA, USA, 2012. [Google Scholar]
- Brody, S.D.; Kim, H.; Gunn, J. The Effect of Urban Form on Flood Damage along the Gulf of Mexico Coast. J. Am. Plan. Assoc. 2013, 5, 289–306. [Google Scholar]
- Magidi, J.; Ahmed, F. Assessing Urban Sprawl Using Remote Sensing and Landscape Metrics: A Case Study of City of Tshwane, South Africa. Egypt. J. Remote Sens. Space Sci. 2018, 21, 241–253. [Google Scholar]
- Jaeger, J.A.G. Landscape division, splitting index, and effective mesh size: New measures of landscape fragmentation. Landsc. Ecol. 2000, 15, 115–130. [Google Scholar] [CrossRef]
- Firman, T. The continuity and change in mega-urbanization in Indonesia: A Survey of Jakarta—Bandung Region (JBR) development. Habitat Int. 2009, 33, 327–339. [Google Scholar] [CrossRef]
- Vioya, A. Tahapan Perkembangan Kawasan Metropolitan Jakarta. J. Perenc. Wil. Dan Kota 2010, 21, 215–226. [Google Scholar]
- Fahmi, F.Z.; Hudalah, D.; Rahayu, P.; Woltjer, J. Extended Urbanization in Small and Medium-Sized Cities: The Case of Cirebon, Indonesia. Habitat Int. 2014, 42, 1–10. [Google Scholar] [CrossRef]
- Arifsihati, Y.; Kaswanto. Analysis of Land Use and Cover Changes in Ciliwung and Cisadane Watershed in Three Decades. Procedia Environ. Sci. 2016, 33, 465–469. [Google Scholar] [CrossRef]
- Mahtta, R.; Mahendra, A.; Seto, K.C. Building Up or Spreading Out? Typologies of Urban Growth Across 478 Cities of 1 Million+. Environ. Res. Lett. 2019, 14, 124077. [Google Scholar] [CrossRef]
- Frank, L.D.; Engelke, P.O. The built environment and human activity patterns: Exploring the impacts of urban form on public health. J. Plan. Lit. 2001, 16, 202–218. [Google Scholar] [CrossRef]
- Bloom, D.E.; Canning, D.; Fink, G. Urbanization and the wealth of nations. Science 2008, 319, 772–775. [Google Scholar] [CrossRef] [PubMed]
- Budiyantini, Y.; Pratiwi, V. Peri-urban Typology of Bandung Metropolitan Area. Procedia Soc. Behav. Sci. 2016, 227, 833–837. [Google Scholar] [CrossRef]
- Pisman, A.; Vanacker, S. Diagnosis of the State of the Territory in Flanders. Reporting about New Maps and Indicators Differentiating between Urban and Rural Areas within Flanders. In Green Energy and Technology; Springer: Berlin, Germany, 2021. [Google Scholar]
- Dempsey, N.; Brown, C.; Raman, S.; Porta, S.; Jenks, M.; Jones, C.; Bramley, G. Elements of Urban Forms. In Dimensions of the Sustainable Cities; Jenks, M., Jones, C., Eds.; Springer: London, UK, 2010; pp. 21–51. [Google Scholar]
- Angotti, T. New Anti-Urban Theories of the Metropolitan Region: “Planet of Slums" and Apocalyptic Regionalism; Collegiate School of Planner Press: Kansas, MI, USA, 2005. [Google Scholar]
- Moser, B.; Jaeger, J.A.; Tappeiner, U.; Tasser, E.; Eisselt, B. Modification of the effective mesh size for measuring landscape fragmentation to solve the boundary problem. Landsc. Ecol. 2007, 22, 447–459. [Google Scholar] [CrossRef]
Disclaimer/Publisher’s Note: The statements, opinions and data contained in all publications are solely those of the individual author(s) and contributor(s) and not of MDPI and/or the editor(s). MDPI and/or the editor(s) disclaim responsibility for any injury to people or property resulting from any ideas, methods, instructions or products referred to in the content. |
© 2023 by the authors. Licensee MDPI, Basel, Switzerland. This article is an open access article distributed under the terms and conditions of the Creative Commons Attribution (CC BY) license (https://creativecommons.org/licenses/by/4.0/).