

Assessment of the Connectivity and Comfort of Urban Rivers, a Case Study of the Czech Republic


Abstract
1. Introduction
- To bring a methodology that corresponds to the territory of the Czech Republic/Central Europe for the specific assessment of the connectivity and comfort of urban rivers.
- To evaluate the quality of connectivity and comfort of urban rivers in the Czech Republic (according to URSI) and try to determine if the size of the cities according to the number of inhabitants is related to the evaluated aspects.
- To define a share of areas with an optimal and acceptable value in the selected zones in the Czech Republic.
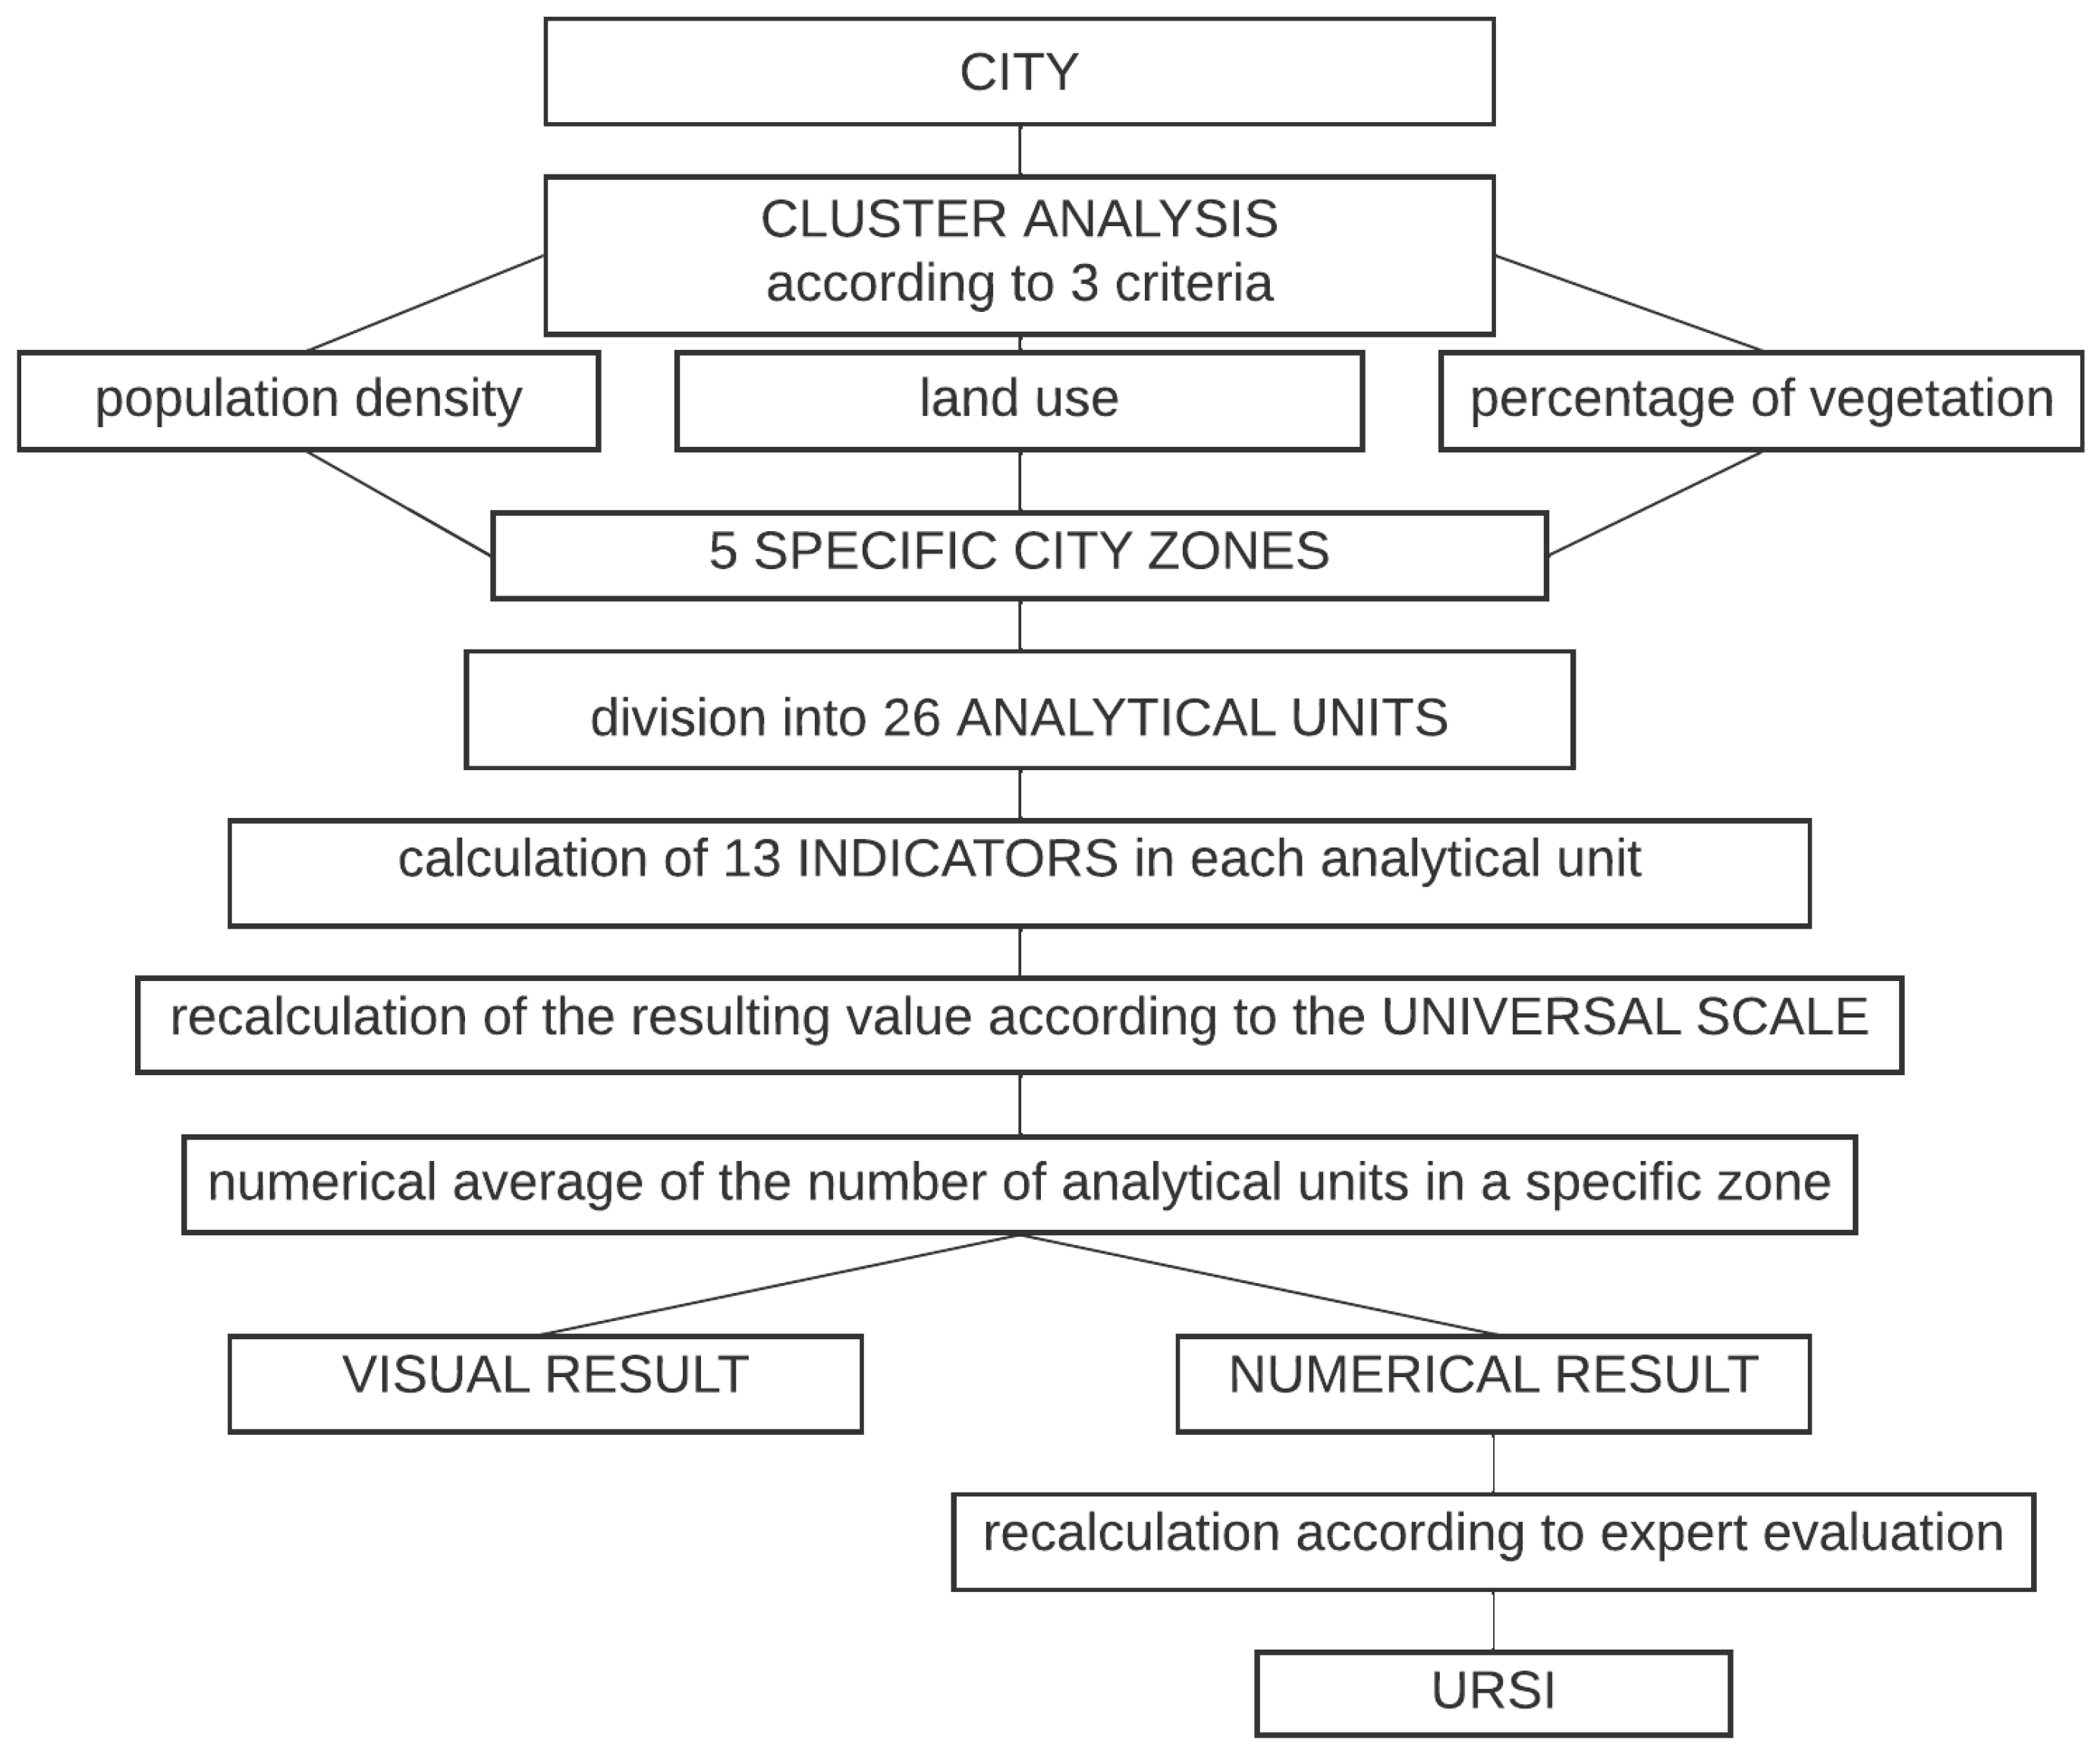
2. Methodology
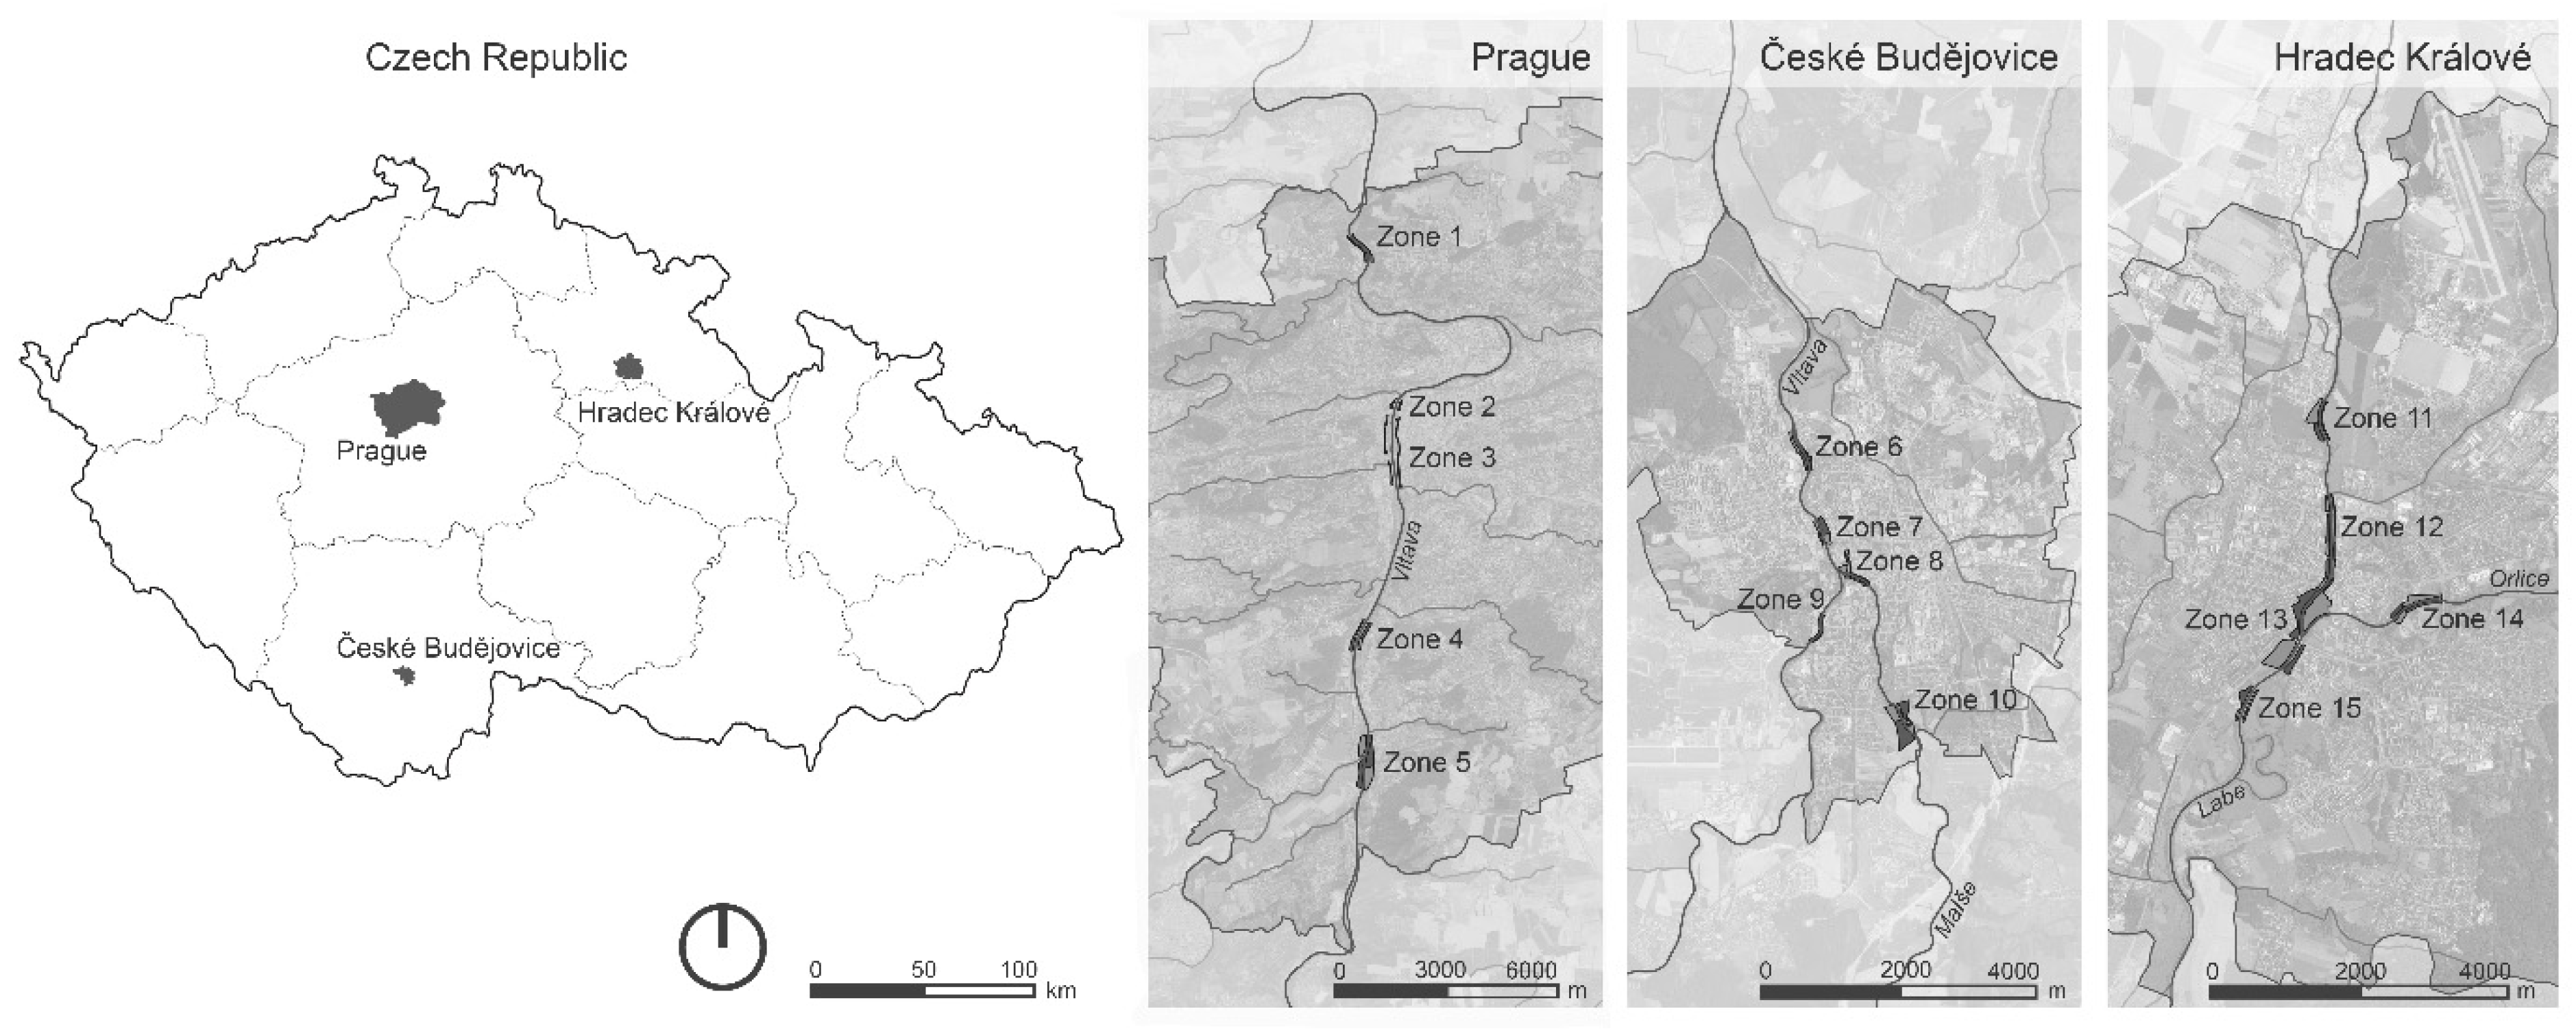
Study Area
3. Results
4. Discussion
5. Conclusions
Author Contributions
Funding
Institutional Review Board Statement
Informed Consent Statement
Data Availability Statement
Conflicts of Interest
Appendix A


| Data File | Used in a Parameter | Source | Spatial Coverage | Link |
|---|---|---|---|---|
| Census hub | statistical cluster analysis—population density, Indicator 11 | Eurostat | Europe | [43] |
| Population and housing censuses | statistical cluster analysis—population density, Indicator 11 | Eurostat | European Union | [41] |
| Population and housing censuses | statistical cluster analysis—population density, Indicator 11 | Czech statistical office | Czech Republic | [63] |
| Population density map | statistical cluster analysis—population density | Czech National Geoportal | Czech Republic | [64] |
| Corine land cover | statistical cluster analysis—land use | Copernicus | Europe | [45] |
| Degree of urbanisation (DEGURBA) | statistical cluster analysis—land use | Eurostat | European Union | [46] |
| High resolutions layers | statistical cluster analysis—percentage of vegetation, Indicator 5 | Copernicus | Europe | [47] |
| Natura 2000 Network viewer | statistical cluster analysis—percentage of vegetation | European Environment Agency | European Union | [48] |
| Google maps | Indicators 1, 2, 6, 10, 12, 13 | Whole world | [53] | |
| Seznam maps | Indicators 1, 2, 12 | Seznam | Whole world | [52] |
| Geoportal Praha | Indicator 1, 2 | Geoportal Praha | Prague | [54] |
| Eurogeographics Maps for Europe | Indicators 1, 2 | Eurogeographics | Europe | [55] |
| TENtec Interactive Map Viewer | Indicator 1 | European Comission | European Union | [56] |
| Open Cadastral Map | Indicators 2, 3 | Eurogeographics | Czech Republic, Denmark, Netherlands, Poland, Slovenia, Spain | [58] |
| Google Earth | Indicators 3, 10, 12, 13 | Whole world | [57] | |
| Geoportal ČÚZK | Indicators 4, 5, 7 | ČÚZK | Czech Republic | [59] |
| Imperviousness | Indicator 4 | Copernicus | Europe | [63] |
| Datasets—Ortophoto | Indicator 7 | European Comission | European Union | [66] |
| Building Height | Indicator 12 | Copernicus | Europe | [68] |
References
- Leopold, L.B. A View of the River; Harvard University Press: Cambridge, MA, USA, 2006; ISBN 0-674-93732-5. [Google Scholar]
- Bridge, J.S. Rivers and Floodplains: Forms, Processes, and Sedimentary Record; Blackwell Pub.: Oxford, UK, 2003; p. 491. ISBN 978-0-632-06489-2. [Google Scholar]
- Kubeš, J. Biocentres and corridors in a cultural landscape: A critical assessment of the territorial system of ecological stability. Landsc. Urban Plan. 1996, 35, 231–240. [Google Scholar] [CrossRef]
- Ward, J.V.; Tockner, K.; Schiemer, F. Biodiversity of floodplain river ecosystems: Ecotones and connectivity. Regul. Rivers Res. Manag. 1999, 15, 125–139. [Google Scholar] [CrossRef]
- Yassin, A.B.; Bond, S.; McDonagh, J. Developing guidelines for riverfront developments for Malaysia. Pac. Rim Prop. Res. J. 2011, 17, 511–530. [Google Scholar] [CrossRef]
- Šálek, M. Meateaters on the edge of the city: Remarkable flexibility of carnivores in urban environment. Fórum Ochr. Přírody 2016, 4, 23–26. (In Czech) [Google Scholar]
- United Nations, Department of Economic and Social Affairs, Population Division. World Urbanization Prospects: The 2018 Revision. Available online: https://esa.un.org/unpd/wup/Publications (accessed on 2 April 2019).
- Chen, Q.; Cai, Y.L.; Luo, K. Ecosystem services valuation of Sanchahe wetland in Bengbu City. Wetl. Sci. 2007, 5, 334–340. (In Chinese) [Google Scholar]
- Zhang, H.; Wu, J.; Sun, C.Z.; Han, Z.L. Evaluation on wetland ecosystem service in Liaoning Province. Resour. Sci. 2008, 30, 192–198. [Google Scholar]
- Wang, Z. Rejuvenation of the open space of urban waterfront and enlightenment of our country. Archit. J. 2007, 7, 15–17. (In Chinese) [Google Scholar]
- Zhang, H.Q. Development of downtown’s recreational function. Eng. J. Wuhan Univ. 2002, 35, 58–62. (In Chinese) [Google Scholar]
- Benages-Albert, M.; Di Masso, A.; Porcel, S.; Pol, E.; Vall-Casas, P. Revisiting the appropriation of space in metropolitan river corridors. J. Environ. Psychol. 2015, 42, 1–15. [Google Scholar] [CrossRef]
- Piperno, A.; Sierra, P. Estrategias de intervención en áreas urbanas inundables: El caso Bella Unión, Uruguay. EURE Santiago 2013, 39, 221–241. [Google Scholar] [CrossRef]
- Allan, J.D. The influence of catchment land use on stream integrity across multiple spatial scales. Freshw. Biol. 1997, 37, 149–161. [Google Scholar] [CrossRef]
- Townsend, C.R. The influence of scale and geography on relationships between stream community composition and landscape variables: Description and prediction. Freshw. Biol. 2003, 48, 768–785. [Google Scholar] [CrossRef]
- Olaj, A.; Gabrijelčič, P.; Fikfak, A. Urban waterfront area—The river as a generator of development. Geod. J. 2012, 56, 151–168. (In Slovenian) [Google Scholar]
- Jennings, V.; Bamkole, O. The Relationship between Social Cohesion and Urban Green Space: An Avenue for Health Promotion. Environ. Res. Public Health 2019, 16, 452. [Google Scholar] [CrossRef]
- Qiao, J.; Wang, M.; Zhang, D.; Ding, C.; Wang, J.; Xu, D. Synergetic development assessment of urban river system landscapes. Sustainability 2017, 9, 2145. [Google Scholar] [CrossRef]
- Gehl, J. Life between Buildings: Using Public Space, 6th ed.; Island Press: Washington, DC, USA, 2011; ISBN 9781597268271. [Google Scholar]
- Pringle, C. The need for a more predictive understanding of hydrologic connectivity. Aquat. Conserv. Mar. Freshw. Ecosyst. 2003, 13, 467–471. [Google Scholar] [CrossRef]
- Ludwig, J.A.; Wilcox, B.P.; Breshears, D.D.; Tongway, D.J.; Imeson, A.C. Vegetation patches and runoff—Erosion as interacting ecohydrological processes in semiarid landscapes. Ecology 2005, 86, 288–297. [Google Scholar] [CrossRef]
- Sandercock, P.J.; Hooke, J.M. Vegetation effects on sediment connectivity and processes in an ephemeral channel in SE Spain. J. Arid Environ. 2011, 75, 239–254. [Google Scholar] [CrossRef]
- Bracken, L.J.; Croke, J. The Concept of hydrological connectivity and its contribution to understanding runoff-dominated geomorphic systems. Hydrol. Process. 2007, 21, 1749–1763. [Google Scholar] [CrossRef]
- Sugawara, H.; Shimizu, S.; Takahashi, H.; Hagiwara, S.; Narita, K.-I.; Mikami, T.; Hirano, T. Thermal Influence of a Large Green Space on a Hot Urban Environment. J. Environ. Qual. 2015, 45, 125–133. [Google Scholar] [CrossRef]
- Du, H. Research on the cooling island effects of water body: A case study of Shanghai, China. Ecol. Indic. 2016, 67, 31–38. [Google Scholar] [CrossRef]
- Yue, W.; Xu, L. Thermal environment effect of urban water landscape. Acta Ecol. Sin. 2013, 33, 1852–1859. (In Chinese) [Google Scholar] [CrossRef]
- Freeman, J.L. Definition of the zebrafish genome using flow cytometry and cytogenetic mapping. BMC Genom. 2007, 8, 195. [Google Scholar] [CrossRef] [PubMed]
- Lexartza-Artza, I.; Wainwright, J. Hydrological connectivity: Linking concepts with practical implications. Catena 2009, 79, 146–152. [Google Scholar] [CrossRef]
- Anderson, S.T.; West, S.E. Open space, residential property values and spatial context. Reg. Sci. Urban Econ. 2006, 36, 773–789. [Google Scholar] [CrossRef]
- Brander, L.M.; Koetse, M.J. The Value of Open Space: Meta-Analyses of Contingent Valuation and Hedonic Pricing Results. J. Environ. Manag. 2011, 92, 2763–2773. [Google Scholar] [CrossRef]
- Bracken, L.J.; Wainwright, J.; Ali, G.A.; Tetzlaff, D.; Smith, M.W.; Reaney, S.M.; Roy, A.G. Concepts of hydrological connectivity: Research approaches, pathways and future agendas. Earth-Sci. Rev. 2013, 119, 17–34. [Google Scholar] [CrossRef]
- May, R. “Connectivity” in urban rivers: Conflict and convergence between ecology and design. Technol. Soc. 2006, 28, 477–488. [Google Scholar] [CrossRef]
- Hermida, M.A.; Cabrera-Jara, N.; Osorio, P.; Cabrera, N. Methodology for the assessment of connectivity and comfort of urban rivers. Cities 2019, 95, 102376. [Google Scholar] [CrossRef]
- Černá Silovská, H.; Kolaříková, J. Observation and assessment of local economic development with regard to the application of the local multiplier. Eur. Plan. Stud. 2016, 24, 1978–1994. [Google Scholar] [CrossRef]
- Pipíšková, P.; Muchova, Z.; Dežerický, D. Map based information support system on land use: Case of Horná Nitra, Slovakia. J. Ecol. Eng. 2022, 23, 162–173. [Google Scholar] [CrossRef]
- Bažík, P.; Muchová, Z.; Petrovič, F. Assessment of ecological situation in a landscape based on calculation of ecological stability coefficient. In Public Recreation and Landscape Protection-with Man Hand in Hand; Department of Landscape Management FFWT Mendel University in Brno: Brno, Czech Republic, 2014; ISBN 978-80-7375-952-0. [Google Scholar]
- Dale, V.H.; Beyeler, S.C. Challenges in the development and use of ecological indicators. Ecol. Indic. 2001, 1, 3–10. [Google Scholar] [CrossRef]
- Czech Statistical Office. Population of Municipalities—1 January 2021. Available online: https://www.czso.cz/csu/czso/population-of-municipalities-1-january-2021 (accessed on 30 April 2021).
- Št’astný, K.; Červený, J.; Řezáč, M.; Kurka, A.; Veselý, P.; Kadlec, T.; Konvička, M.; Juřičková, L.; Harabiš, F.; Marhoul, P. Vertebrates and Invertebrates of European Cities: Selected Non-Avian Fauna; Springer: New York, NY, USA, 2015; pp. 379–451. ISBN 978-1-4939-1697-9. [Google Scholar]
- Frajer, J.; Pavelková, R.; Létal, A.; Kopp, J. Relics and transformation of former ponds in the urban environment of the historical region of Bohemia (Czech Republic). J. Maps 2021, 17, 151–161. [Google Scholar] [CrossRef]
- Population and Housing Censuses. European Statistical System. Available online: https://ec.europa.eu/eurostat/web/population-demography/population-housing-censuses/database (accessed on 1 January 2021).
- Czech Statistical Office. Available online: https://www.czso.cz/csu/czso/home (accessed on 25 June 2022).
- Population and Housing Censuses. Census Hub. Available online: https://ec.europa.eu/CensusHub2 (accessed on 1 January 2021).
- Czech National Geoportal. Available online: https://geoportal.gov.cz/web/guest/map (accessed on 7 August 2022).
- Copernicus. Corine Land Cover. Available online: https://land.copernicus.eu/pan-european/corine-land-cover (accessed on 2 March 2023).
- Degree of Urbanisation (DEGURBA). Available online: https://ec.europa.eu/eurostat/web/gisco/geodata/reference-data/population-distribution-demography/degurba#degurba01 (accessed on 1 January 2021).
- Copernicus. Pan-European High Resolution Layers. Available online: https://land.copernicus.eu/pan-european/high-resolution-layers (accessed on 2 March 2023).
- Natura 2000. Network Viewer. European Environment Agency. Available online: https://natura2000.eea.europa.eu/ (accessed on 1 January 2021).
- Fedor, P.; Zvaríková, M. Biodiversity indices. In Encycl. Ecol; Fath, B., Ed.; Elsevier: Amsterdam, The Netherlands, 2018; Volume 2, pp. 337–346. ISBN 978-0-444-63768-0. [Google Scholar]
- Omayio, D.; Mzungu, E. Modification of Shannon-Wiener Diversity Index towards Quantitative Estimation of Environmental Wellness and Biodiversity Levels under a Non-comparative Scenario. J. Environ. Earth Sci. 2019, 9, 46–57. [Google Scholar] [CrossRef]
- Karou, S.; Hull, A. Accessibility measures and instruments. In Accessibility Instruments for Planning Practice; Hull, A., Silva, C., Bertolini, L., Eds.; COST Office: Edinburgh, UK, 2012; pp. 1–21. ISBN 978-989-20-3187-3. [Google Scholar]
- Seznam Mapy.cz. Available online: www.mapy.cz (accessed on 7 August 2022).
- Google Maps. Available online: maps.google.com (accessed on 7 August 2022).
- Geoportal Praha. Prague Geographic Data in One Place. Available online: https://www.geoportalpraha.cz/en##moreApplications (accessed on 7 August 2022).
- Eurogeographics. Maps for Europe. Available online: https://eurogeographics.org/maps-for-europe/ (accessed on 1 January 2023).
- TENtec Interactive Map Viewer. Mobility and Transport. Available online: https://ec.europa.eu/transport/infrastructure/tentec/tentec-portal/map (accessed on 1 January 2022).
- Rode, P.; Floater, G.; Thomopoulos, N.; Docherty, J.; Schwinger, P.; Mahendra, A.; Fang, W. Accessibility in cities: Transport and urban form. In Disrupting Mobility; Meyer, G., Shaheen, S., Eds.; Springer: Berlin/Heidelberg, Germany, 2017; pp. 239–273. [Google Scholar] [CrossRef]
- Eurographics. Open Cadastral Map. Available online: https://www.mapsforeurope.org/datasets/cadastral-all (accessed on 1 January 2021).
- Che, Y.; Yang, K.; Chen, T.; Xu, Q. Assessing a riverfront rehabilitation project using the comprehensive index of public accessibility. Ecol. Eng. 2012, 40, 80–87. [Google Scholar] [CrossRef]
- Google Earth. Available online: earth.google.com (accessed on 7 August 2022).
- Fini, A.; Frangi, P.; Mori, J.; Donzelli, D.; Ferrini, F. Nature based solutions to mitigate soil sealing in urban areas: Results from a 4-year study comparing permeable, porous, and impermeable pavements. Environ. Res. 2017, 156, 443–454. [Google Scholar] [CrossRef] [PubMed]
- Geoportál ČÚZK. WMS—Ortophoto. Available online: https://geoportal.cuzk.cz/(S(t0ylyfk45lpcqtj3p3eg1051))/Default.aspx?menu=3121&mode=TextMeta&side=wwm.verejne&metadataID=CZ-CUZK-WMS-ORTOFOTO-P&metadataXSL=metadata.sluzba (accessed on 7 August 2022).
- Copernicus, Imperviousness. Available online: https://land.copernicus.eu/pan-european/high-resolution-layers/imperviousness (accessed on 2 March 2023).
- Lakicevic, M.; Reynolds, K.M.; Orlovic, S.; Kolarov, R. Measuring dendrofloristic diversity in urban parks in Novi Sad (Serbia). Trees For. People 2022, 8, 100239. [Google Scholar] [CrossRef]
- Alexander, C. Influence of the proportion, height and proximity of vegetation and buildings on urban land surface temperature. Int. J. Appl. Earth Obs. Geoinf. 2021, 95, 102265. [Google Scholar] [CrossRef]
- European Commission. Datasets. Available online: https://data.europa.eu/data/datasets?locale=en (accessed on 1 January 2022).
- Orellana, D.; Osorio, P. Segregacion socio-espacial urbana en Cuenca, Ecuador. Anal. Rev. Anal. Estad. 2014, 8, 27–38. [Google Scholar]
- Copernicus. Building Height 2012. Available online: https://land.copernicus.eu/local/urban-atlas/building-height-2012/view (accessed on 13 March 2023).
- Joshi, A.; Kale, S.; Chandel, S.; Pal, D.K. Likert scale: Explored and explained. Br. J. Appl. Sci. Technol. 2015, 7, 396–403. [Google Scholar] [CrossRef]
- Ujang, N.; Zakariya, K. The notion of place, place meaning and identity in urban regeneration. Procedia-Soc. Behav. Sci. 2015, 170, 709–717. [Google Scholar] [CrossRef]
- Stedman, C.R. Is It Really Just a Social Construction? The contribution of the physical environment to sense of place”. Soc. Nat. Resour. 2003, 16, 671–685. [Google Scholar] [CrossRef]
- Kučera, P. Pražské Náplavky Website. 2016. Available online: https://prazskenaplavky.cz/historie (accessed on 18 August 2016).
- Rogers, J.S. How Boats Change: Explaining Morphological Variation in European Watercraft, Based on an Investigation of Logboats from Bohemia and Moravia, Czech Republic; University of Exeter: Exeter, UK, 2009; Available online: https://ore.exeter.ac.uk/repository/handle/10036/85097 (accessed on 3 August 2009).
- Krogstrup, S.; Oman, W. Macroeconomic and Financial Policies for Climate Change Mitigation: A Review of the Literature; International Monetary Fund: Washington, DC, USA, 2019; ISBN 9781513512921. [Google Scholar]
- Pasolini, G.; Toppan, P.; Zabini, F.; De Castro, C.; Andrisano, O. Design, deployment and evolution of heterogeneous smart public lighting systems. Appl. Sci. 2019, 9, 3281. [Google Scholar] [CrossRef]
- Pigliautile, I.; Cureau, R.J.; Pisello, A.L. Human Adaptation to Higher Ambient Temperature. In Urban Overheating: Heat Mitigation and the Impact on Health; Aghamohammadi, N., Santamouris, M., Eds.; Springer: Singapore, 2022; pp. 109–128. [Google Scholar] [CrossRef]
- Jiang, Y.; Huang, J.; Shi, T.; Wang, H. Interaction of Urban Rivers and Green Space Morphology to Mitigate the Urban Heat Island Effect: Case-Based Comparative Analysis. Int. J. Environ. Res. Public Health 2021, 18, 11404. [Google Scholar] [CrossRef]
- Zhao, S.-M.; Ma, Y.-F.; Wang, J.-L.; You, X.-Y. Landscape pattern analysis and ecological network planning of Tianjin City. Urban For. Urban Green. 2019, 46, 126479. [Google Scholar] [CrossRef]
- Cirera, K.A. Spatial Equity in River Access. Measuring the Public Space Potential of Urban Riverbanks in Valdivia, Chile. Planning 2022, 17, 1–12. [Google Scholar] [CrossRef]


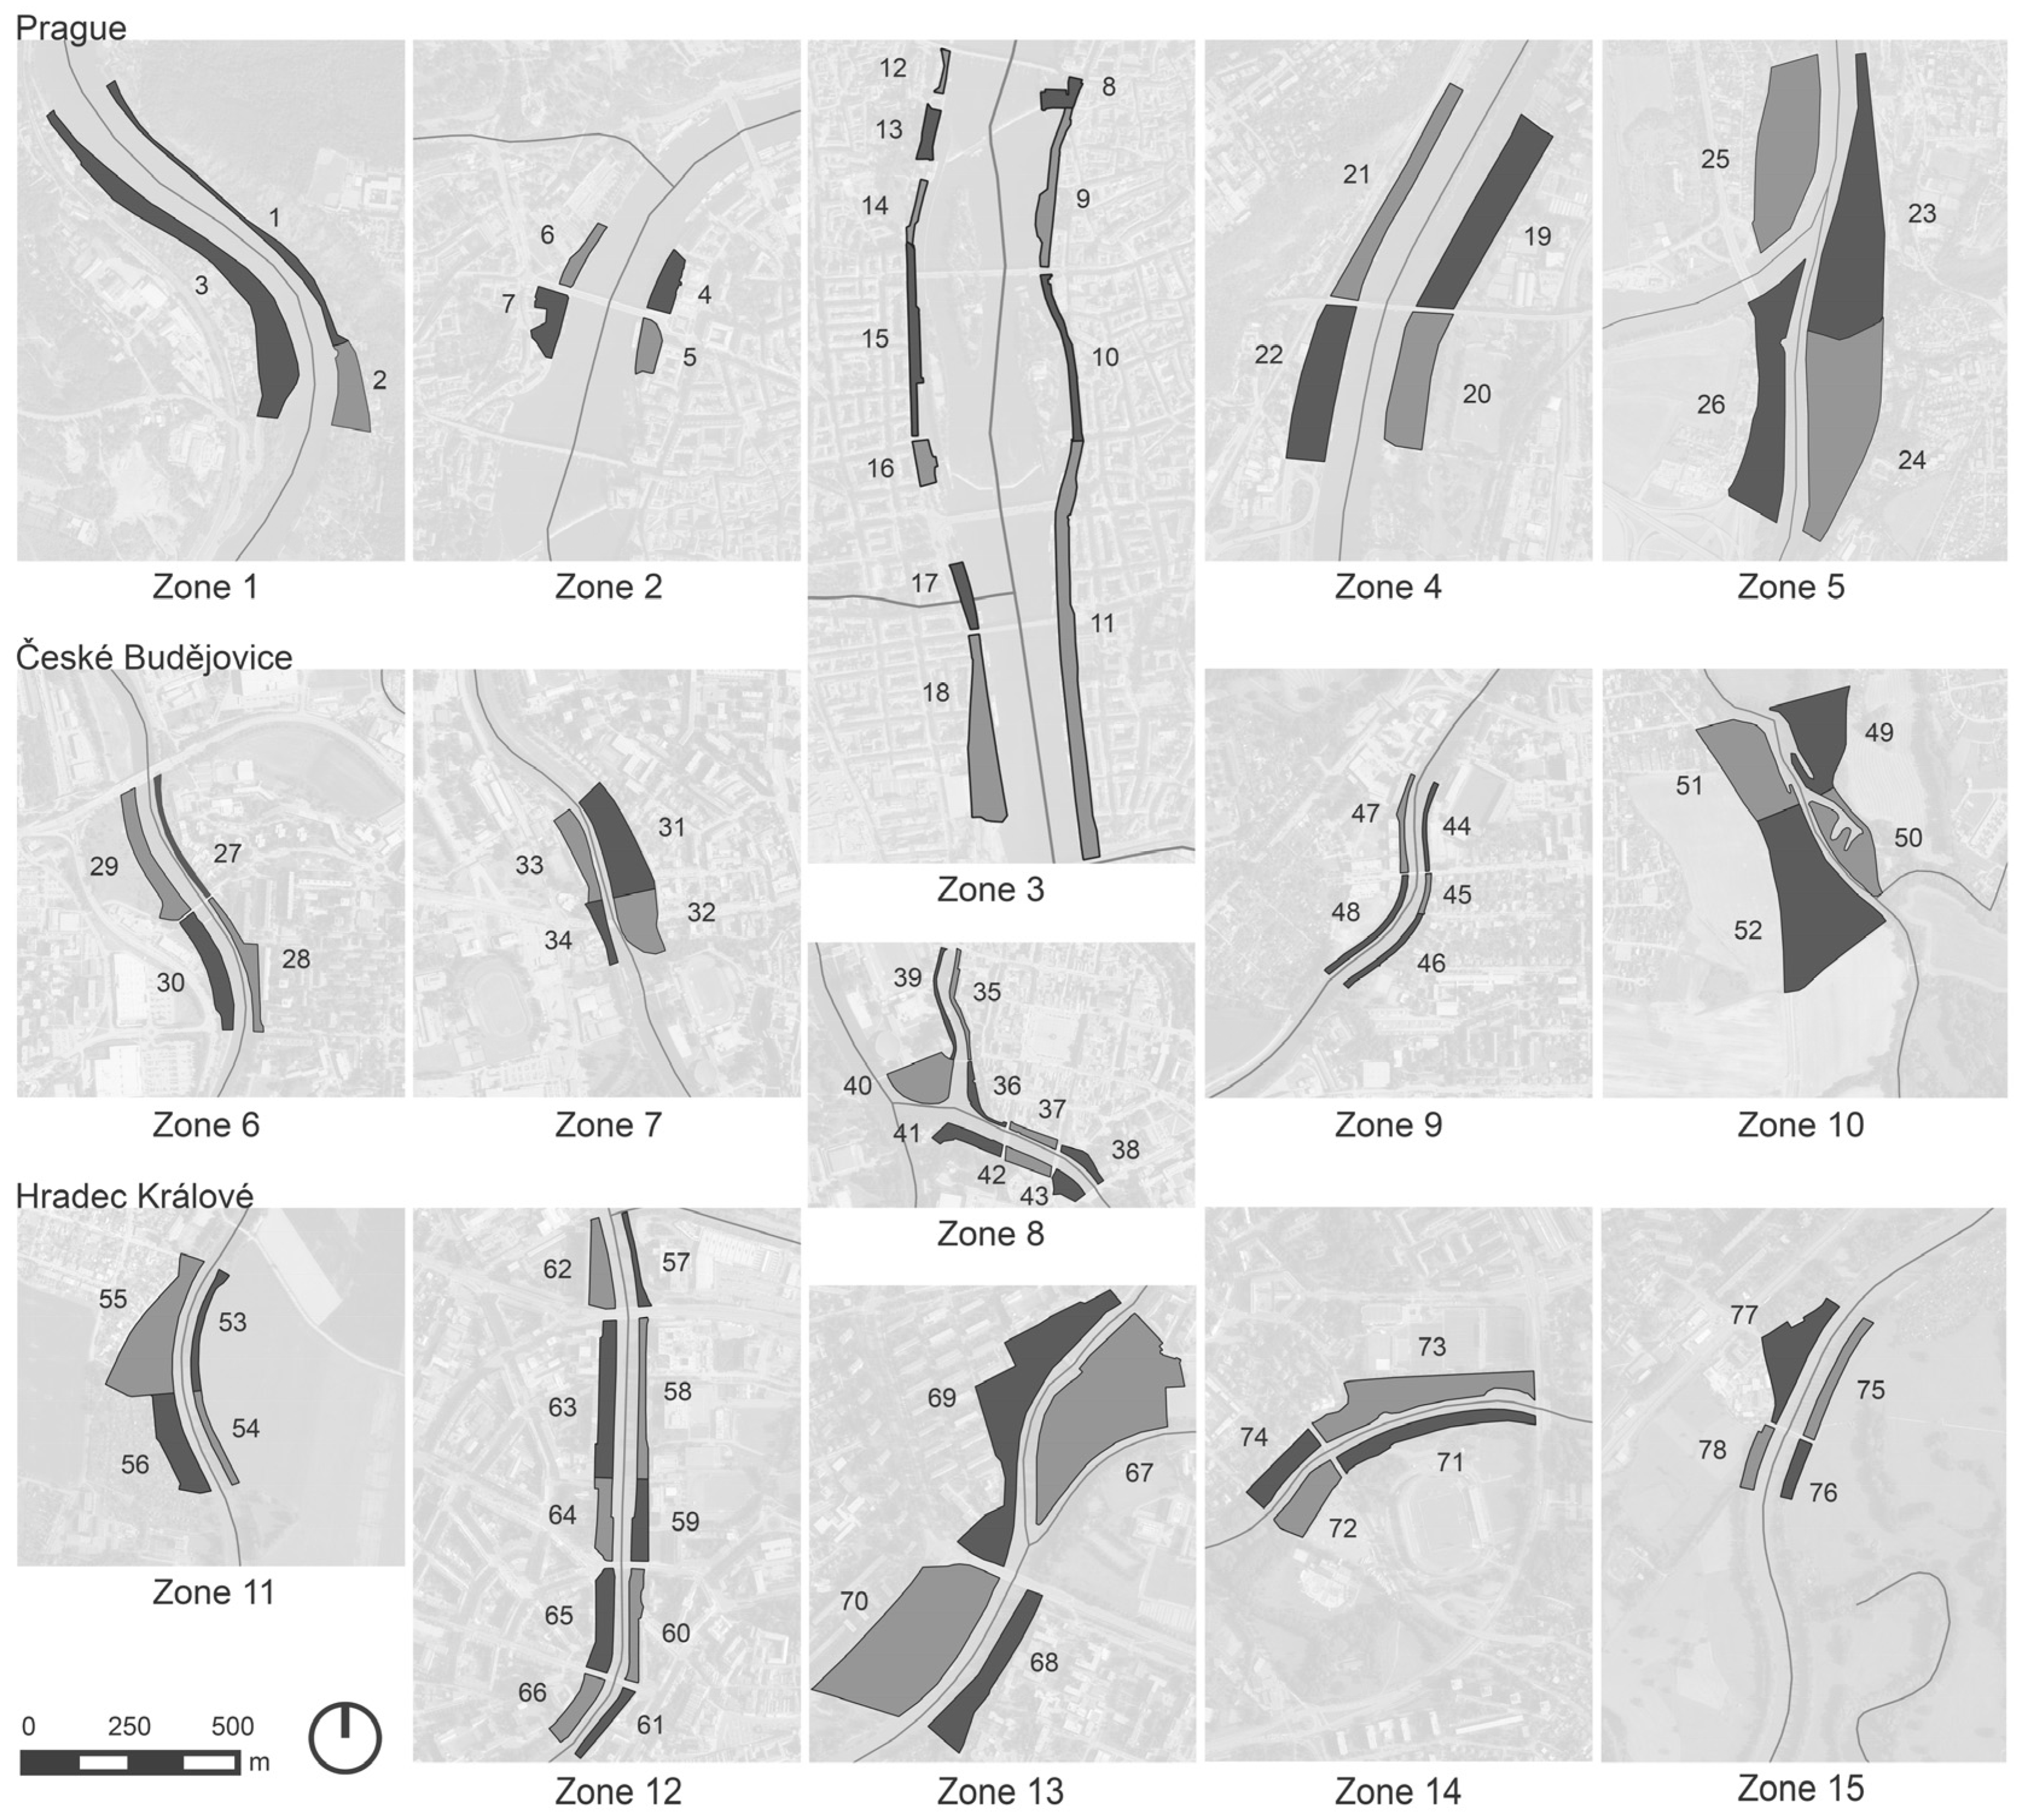
| Zone | City | Type of Territory | Number of Units |
|---|---|---|---|
| Z1 | Prague | The northern border of the urban area—a quiet, recreational part of the city, built-up on one side of the bank of the watercourse. | 3 |
| Z6 | Č. Budějovice | 4 | |
| Z11 | H. Králové | 4 | |
| Z2 | Prague | A representative part of the city. | 4 |
| Z7 | Č. Budějovice | 4 | |
| Z13 | H. Králové | 4 | |
| Z3 | Prague | The historic center with waterfronts. | 11 |
| Z8 | Č. Budějovice | 9 | |
| Z12 | H. Králové | 10 | |
| Z4 | Prague | Waterfront with linear greenery and a central cycle path. | 4 |
| Z9 | Č. Budějovice | 5 | |
| Z14 | H. Králové | 4 | |
| Z5 | Prague | The southern border of the urban area—only partially built-up, and close to industrial areas and cottage areas. | 4 |
| Z10 | Č. Budějovice | 4 | |
| Z15 | H. Králové | 4 |
| Indicators | Weighing | Required Information; Sources |
|---|---|---|
| Connectivity a. Spatial and visual accessibility | ||
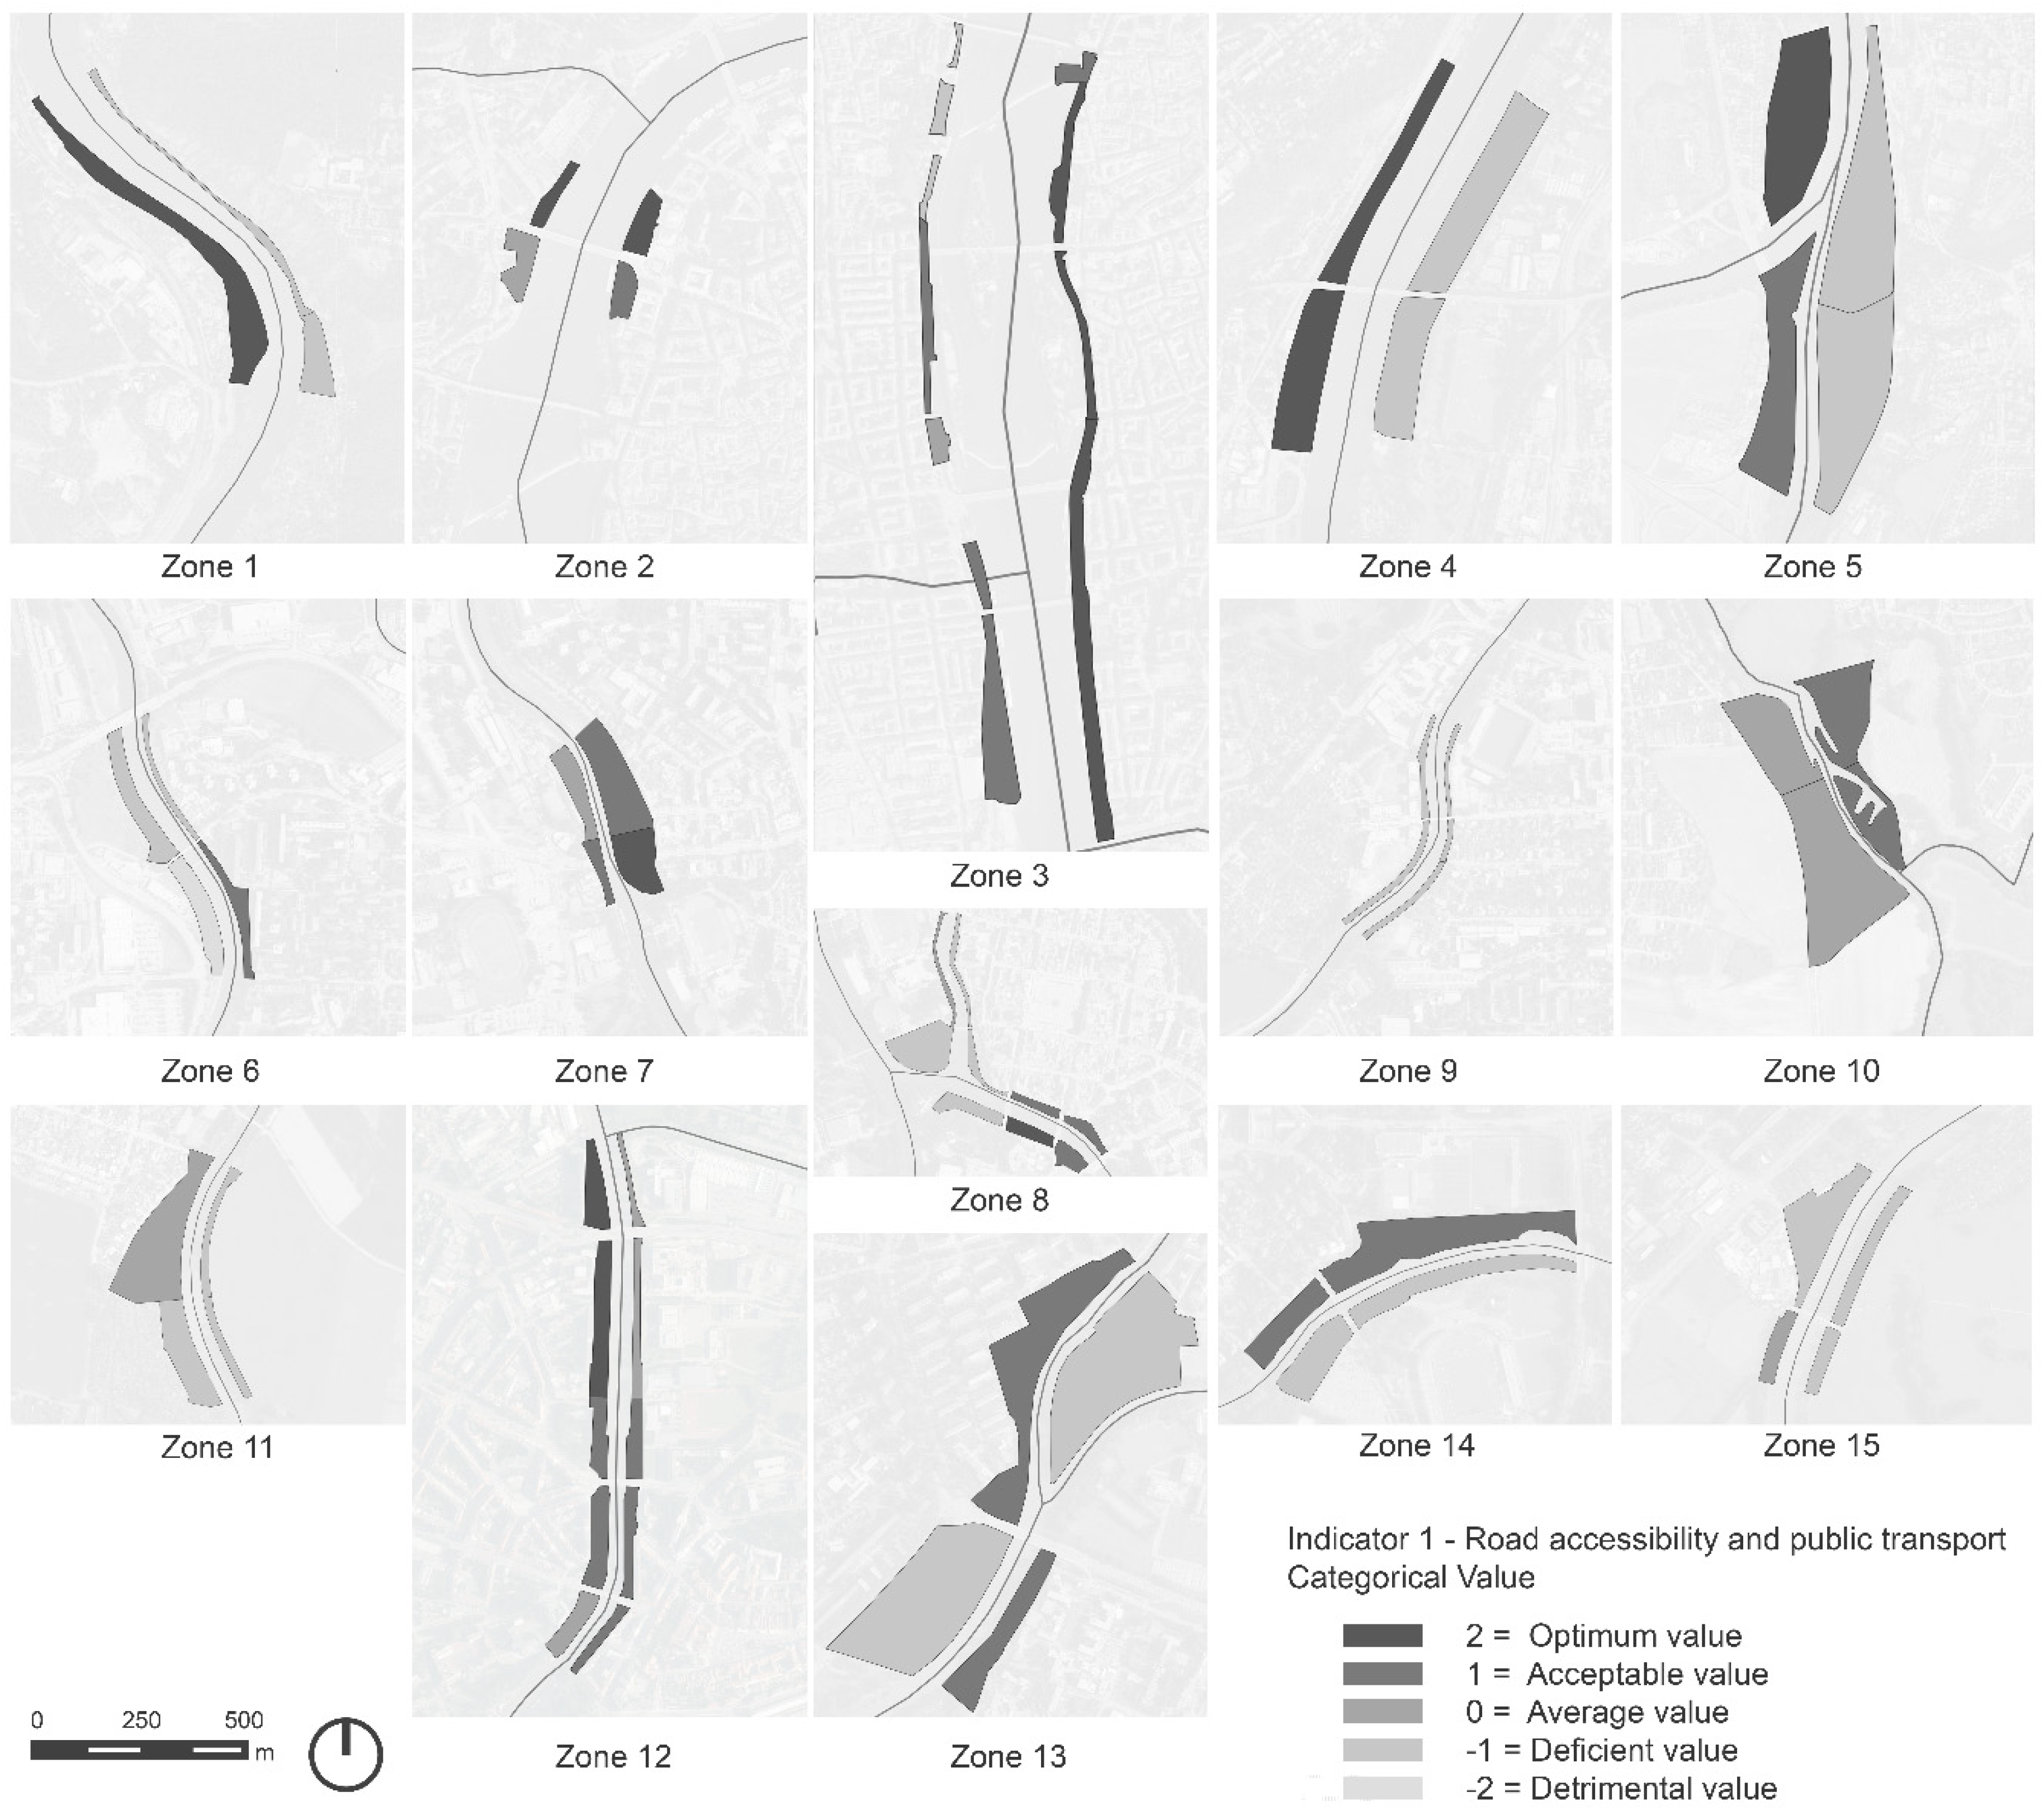
| 1. Road accessibility and public transport Evaluates the connection of the road network and different modes of transport to the given public space [51]. | ||
| AV = A + B A: road accessibility Has vehicular, pedestrian, and cycle path = 3 Has vehicular and pedestrian path = 2 Has pedestrian path = 1 Has no path = 0 B: accessibility to public transport Has public transport (on the riverbank) = 1 Does not have public transport = 0 | Optimum: = > 3.5 Acceptable: = > 2.5 < 3.5 Medium: = > 1.5 < 2.5 Deficient: = > 0.5 < 1.5 Detrimental: = > 0 < 0.5 Universal scale (same for all calculations) Optimum value = 2 Acceptable value = 1 Average value = 0 Deficient value = −1 Detrimental value = −2 | Required information: Type of road: pedestrian, bike path, and vehicular Public transport: network and bus stops Sources: Map applications [52,53,54,55,56] and field survey |
| 2. Access to the pedestrian network Quantifies the representation of suitable walking trails, and therefore, the possibility of safe movement of people with reduced mobility [57]. | ||
| AP = Σ (P + L)/2 P: slopes < 5% P = (slopes areas < 5%)/(analysis unit areas) × 100 L: walking trails ≥ 90 cm L = (walking trails ≥ 90 cm)/(analysis unit areas) × 100 | Optimum = > 80% Acceptable = > 60% < 80% Average = > 40% < 60% Deficient = > 20% < 40% Detrimental = > 0% < 20% | Required information: Slope of walking paths, width of walking paths, and length of walking paths Sources: Map applications [52,53,54,55,58], and field survey and measurement |
| 3. Height of the surrounding buildings Evaluates the height of the surrounding buildings, which determines the pedestrian’s field of vision. Lower buildings allow users to enjoy a larger field of vision [59]. | ||
| HB = Σ (h)/P h: height factor Without building or ≤ 4 floors = 3 Building > 4 ≤ 10 floors = 2 Building > 10 floors = 1 P: total number of plots in the analysis unit | Optimum = > 2.40 Acceptable = > 1.80 < 2.40 Average = > 1.20 < 1.80 Deficient = > 0.60 < 1.20 Detrimental = > 0 < 0.60 | Required information: Number of floors on the first built line and number of buildings in the first built line Sources: Map applications [58,60] and field survey |
| b. Condition of the green corridor | ||
| 4. Soil permeability Evaluates the representation of permeable and impervious surfaces. Soil permeability is key to supporting the ecosystem properties of urban environments [61]. | ||
| SP = (permeable soil + emipermeable soil)/(analysis unit area) × 100 Types of soil surface: Permeable soil = vegetation and bare ground Semipermeable soil = aggregates and textures that allow the passage of water Impermeable = concrete, asphalt, and construction | Optimum = > 1.6 Acceptable = > 1.2 < 1.6 Average = > 0.8 < 1.2 Deficient = > 0.4 < 0.8 Detrimental = > 0 < 0.4 | Required information: Orthophoto of the evaluated area with a resolution of surfaces Sources: WMS data for QGIS, orthophoto [62], map applications [63], and field survey |
| 5. Vegetation diversity Evaluates the richness of plant species—the relationship between the number of individuals and the number of species. This uses Fisher’s alpha index, which is based on the assumption that species’ abundance follows a logarithmic distribution and does not have fixed thresholds. A higher number on this index corresponds to higher species diversity [64]. | ||
| VD = αfis × ln (1 + n/αfis) n = number of individuals for each species | Optimum = > 16 Acceptable = > 12 < 16 Average = > 8 < 12 Deficient = > 4 < 8 Detrimental = > 0 < 4 | Required information: Number of species and number of individuals for each species Sources: WMS data for QGIS, orthophoto [62], map applications [47], field survey, and secondary information obtained from the municipality |
| COMFORT c. Condition of public space | ||
| 6. Facilities mixture Quantifies the existence and diversity of facilities in a given area. The Shannon diversity index is used as a conceptual basis, the value of which is usually influenced not only by the data distribution but also by the number of species categories in a given ecosystem [50]. | ||
| FM = −Σ [(pi) × ln(pi)] pi: share of units in individual species pi = Ni/N Ni = types of facilities Rest: benches, seats Playful: playground and equipment Sports: exercise machines and sports fields Food consumption: tables and barbeque | Optimum = > 1.6 Acceptable = > 1.2 < 1.6 Average = > 0.8 < 1.2 Deficient = > 0.4 < 0.8 Detrimental = > 0 < 0.4 | Required information: Number of facilities classified by type of activity Sources: Field survey and map applications [53] |
| 7. Surface with shadow Quantifies the representation of paved areas in the territory that are protected by temperature-regulating shade. The most effective source of shade is vegetation [65]. | ||
| SS = (shadow projected from the trees)/(area of the stay areas and trails) × 100 | Optimum = > 80% Acceptable = > 60% < 80% Average = > 40% < 60% Deficient = > 20% < 40% Detrimental = > 0% < 20% | Required information: Orthophoto of the study area: wood surface Sources: WMS data for QGIS, orthophoto [62,66], and field survey |
| 8. Night lighting Evaluates the level of surface illumination during night hours. | ||
| NL = (illuminated area)/(analysis unit area) × 100 | Optimum = > 80% Acceptable = > 60% < 80% Average = > 40% < 60% Deficient = > 20% < 40% Detrimental = > 0% < 20% | Required information: Number of luminaires and illuminated surface Sources: Secondary information obtained from the municipality and field survey |
| 9. Maintenance and management of public space Evaluates the level of care for public spaces. | ||
| MM = (Σ F/FA)/(Na) × 100 F: frequency in days each activity must be carried out per week F = 7/E E = frequency in days when each activity must be carried out Fa: frequency in days each activity is carried out per week Fa = 7/Ea Ea = frequency in days when each activity is carried out Na = total number of activities | Optimum = > 80% Acceptable = > 60% < 80% Average = > 40% < 60% Deficient = > 20% < 40% Detrimental = > 0% < 20% | Required information: Quantity and type of activities managed in an area Sources: Secondary information obtained from the municipality Field survey |
| d. Condition of the first built line | ||
| 10. Diversity of uses Evaluates the variety and frequency of individual types of establishments in the first built line. | ||
| DU = −Σ [(pi) × ln(pi)] pi: share of units in individual types pi = Ni/N Ni = types of establishments | Optimum = > 4 Acceptable = > 3 < 4 Average = > 2 < 3 Deficient = > 1 < 2 Detrimental = > 0 < 1 | Required information: List of uses on the ground floor by property of the first built line Sources: Map applications [53,57], secondary information obtained from the municipality, and field survey |
| 11. Socio-spatial integration Evaluates the degree of representation of the population with lower incomes (quartile one) in the waterfront area compared to the general representation in the entire city district. The index of spatial segregation (ISEA index) is applied to the evaluation [67]. | ||
| ISEA = a1 + b1 a1: percentage of people in Q1 in the blocks surrounding the analysis unit a1 = (number of people in Q1 in the analysis unit)/(total number of people in the analysis unit) b1: percentage of people in Q1 in the city | Optimum = > 0.76 = < 1.25 Acceptable = > 0.57 < 0.76 or > 1.25 = < 1.41 Average = > 0.38 < 0.57 or > 1.41 = < 1.58 Deficient = > 0.19 < 0.38 or > 1.58 = < 1.75 Detrimental = > 0 < 0,19 or > 1.75 | Required information: Information about the population in each specific city district Sources: Secondary information obtained from the municipality, databases [41,42,43], and field survey |
| 12. Porosity of the first built line Evaluates the height of the fence and the percentage of free space of the first built line. | ||
| AP = Σ [l × (ae + re)]/L l: the length of a particular plot of land L: the sum of the lengths of all plots in the analyzed unit ae = height of the first built line Height of the enclosure of the building = > 1.65 m = 0 Height of the enclosure of the building = > 1 m < 1.65 m = 0.5 Height of the enclosure of the building = > 0 m < 1 m = 1 re = full-empty relation of the first built line = < 33% of empty = 0 33–66% of empty = 0.5 = > 66% of empty = 1 | Optimum = > 1.6 Acceptable = > 1.2 < 1.6 Average = > 0.8 < 1.2 Deficient = > 0.4 < 0.8 Detrimental = > 0 < 0.4 | Required information: Lengths of individual plots, the sums of the lengths of all plots, the fence heights, and filling the land with construction Sources: Map applications [52,53,60,68] and field survey |
| 13. Accessibility to the first built line Evaluates the car or pedestrian accessibility of buildings in the first built line. | ||
| AF = Σ (l × c)/L l: length of each plot L: sum of the front length of plots in the analysis unit c = presence or absence of access to each plot Plot has direct access = 1 Plot does not have access = 0 | Optimum = > 0.8 Acceptable = > 0.6 < 0.8 Average = > 0.4 < 0.6 Deficient = > 0.2 < 0.4 Detrimental = > 0 < 0.2 | Required information: Lengths of individual plots, the sums of the lengths of all plots, and information about the accessibility of the plot Sources: Map applications [53,60] and field survey |
| Dimensions and Indicators | Sum of the Experts Evaluation | Average Sum/Number of Experts | Weighting Values | |
|---|---|---|---|---|
| CONNECTIVITY a. Spatial and visual accessibility | ||||
| 1 | Road accessibility and public transport | 52 | 4.73 | 8/51 |
| 2 | Access to the pedestrian network | 50 | 4.55 | 8/51 |
| 3 | Height of the surrounding buildings | 37 | 3.36 | 1/51 |
| b. Condition of the green corridor | ||||
| 4 | Soil permeability | 43 | 3.91 | 2/51 |
| 5 | Vegetation diversity | 46 | 4.18 | 4/51 |
| COMFORT c. Condition of public space | ||||
| 6 | Facilities mixture | 46 | 4.18 | 4/51 |
| 7 | Surface with shadow | 44 | 4.00 | 2/51 |
| 8 | Night lighting | 53 | 4.82 | 8/51 |
| 9 | Maintenance and management of public space | 49 | 4.45 | 4/51 |
| d. Condition of the first built line | ||||
| 10 | Diversity of uses | 47 | 4.27 | 4/51 |
| 11 | Socio-spatial integration | 43 | 3.91 | 2/51 |
| 12 | Porosity of the first built line | 39 | 3.55 | 2/51 |
| 13 | Accessibility to the first built line | 40 | 3.64 | 2/51 |
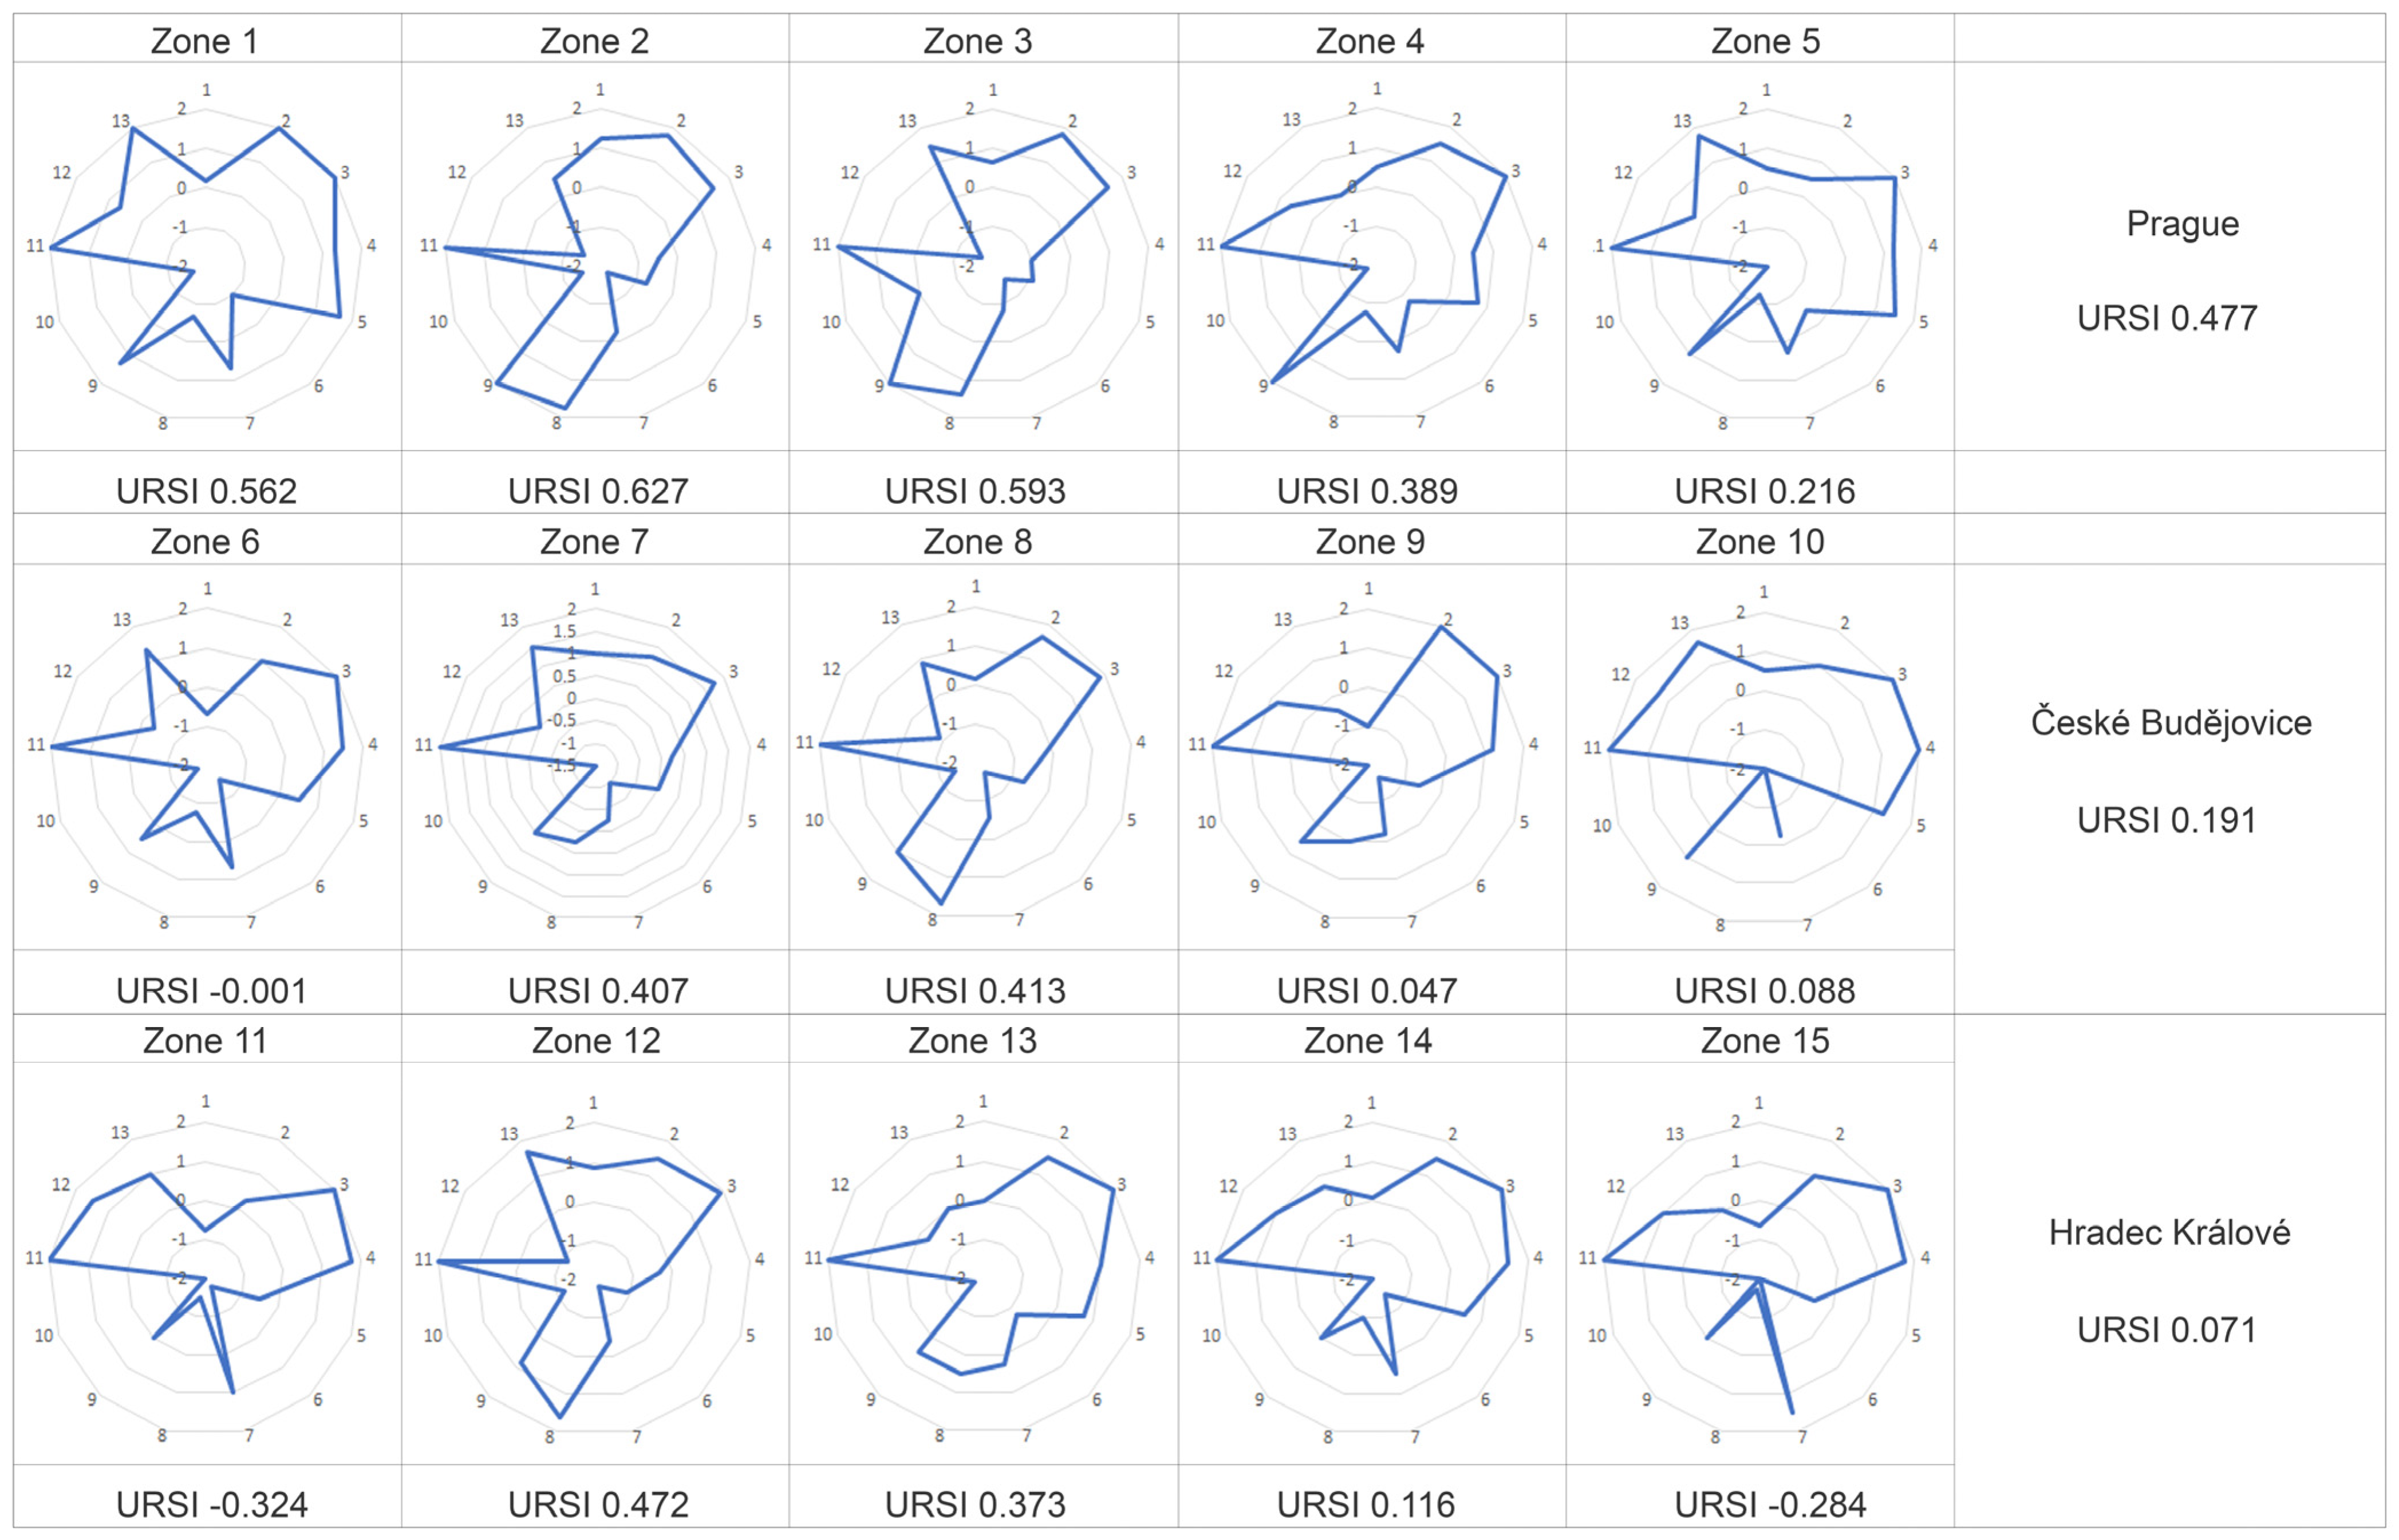
| Ind. 1. | Ind. 2. | Ind. 3. | Ind. 4. | Ind. 5. | Ind. 6. | Ind. 7. | Ind. 8. | Ind. 9. | Ind. 10. | Ind. 11. | Ind. 12. | Ind. 13. | |
|---|---|---|---|---|---|---|---|---|---|---|---|---|---|
| Prague | 0.62 | 1.51 | 1.81 | 0.31 | 0.45 | −1.11 | 0.02 | 0.09 | 1.67 | −1.38 | 2 | −0.31 | 1.14 |
| Zone 1 | 0.17 | 2 | 2 | 1.33 | 1.67 | −1 | 0.67 | −0.67 | 1.33 | −1.67 | 2 | 0.67 | 2 |
| Zone 2 | 1.25 | 1.75 | 1.5 | −0.5 | −0.75 | −1.75 | −0.25 | 1.75 | 2 | −1.5 | 2 | −1.5 | 0.5 |
| Zone 3 | 0.64 | 1.82 | 1.55 | −1 | −0.91 | −1.55 | −0.82 | 1.36 | 2 | 0 | 2 | −1.63 | 1.45 |
| Zone 4 | 0.5 | 1.5 | 2 | 0.5 | 0.75 | −0.75 | 0.25 | −0.75 | 2 | −1.75 | 2 | 0.67 | 0 |
| Zone 5 | 0.5 | 0.5 | 2 | 1.25 | 1.5 | −0.5 | 0.25 | −1.25 | 1 | −2 | 2 | 0.25 | 1.75 |
| ČB | −0.01 | 1.38 | 1.93 | 0.95 | 0.1 | −1.55 | −0.12 | −0.17 | 0.72 | −1.74 | 2 | 0.18 | 1 |
| Zone 6 | −0.68 | 1 | 2 | 1.5 | 0.5 | −1.5 | 0.67 | −0.75 | 0.5 | −1.75 | 2 | −0.33 | 1.33 |
| Zone 7 | 1 | 1.25 | 1.75 | 0.25 | 0 | −1 | −0.25 | 0.25 | 0.5 | −1.5 | 2 | 0 | 1.5 |
| Zone 8 | 0.14 | 1.67 | 1.89 | −0.22 | −0.67 | −1.67 | −0.56 | 1.67 | 1 | −1.44 | 2 | −0.89 | 0.89 |
| Zone 9 | −1 | 2 | 2 | 1.2 | −0.6 | −1.6 | −0.2 | 0 | 0.6 | −2 | 2 | 0.8 | −0.4 |
| Zone 10 | 0.5 | 1 | 2 | 2 | 1.25 | −2 | −0.25 | −2 | 1 | −2 | 2 | 1.33 | 1.67 |
| HK | 1.14 | −0.43 | 1.15 | 1.98 | −0.17 | −1.56 | 0.57 | −0.43 | 0.26 | −1.79 | 2 | 0.41 | 0.67 |
| Zone 11 | −0.75 | 0.25 | 2 | 1.75 | −0.5 | −1.75 | 1 | −1.5 | 0 | −2 | 2 | 1.5 | 1 |
| Zone 12 | 0.87 | 1.5 | 1.9 | −0.3 | −1.1 | −1.8 | −0.4 | 1.6 | 0.8 | −1.2 | 2 | −1.2 | 1.7 |
| Zone 13 | 0 | 1.5 | 2 | 1 | 0.75 | −0.75 | 0.25 | 0.5 | 0.5 | −1.75 | 2 | −0.25 | 0 |
| Zone 14 | 0.08 | 1.5 | 2 | 1.5 | 0.5 | −1.5 | 0.5 | −1 | 0 | −2 | 2 | 1 | 0.67 |
| Zone 15 | −0.63 | 1 | 2 | 1.75 | −0.5 | −2 | 1.5 | −1.75 | 0 | −2 | 2 | 1 | 0 |
| Indicators | Prague | České Budějovice | Hradec Králové | Average of Czech Cities | |
|---|---|---|---|---|---|
| 1 | Road accessibility and public transport | 57.7% | 38.5% | 42.3% | 46.2% |
| 2 | Access to the pedestrian network | 92.3% | 84.6% | 80.8% | 85.9% |
| 3 | Height of the surrounding buildings | 100% | 100% | 100% | 100% |
| 4 | Soil permeability | 42.3% | 69.2% | 69.2% | 60.2% |
| 5 | Vegetation diversity | 46.2% | 34.6% | 19.2% | 33.3% |
| 6 | Facilities mixture | 7.7% | 0% | 0% | 2.6% |
| 7 | Surface with shadow | 26.9% | 34.6% | 42.3% | 34.6% |
| 8 | Night lighting | 65.4% | 53.8% | 42.3% | 53.8% |
| 9 | Maintenance and manag. of publ. space | 100% | 76.9% | 38.5% | 71.8% |
| 10 | Diversity of uses | 15.4% | 0% | 0% | 5.1% |
| 11 | Socio-spatial integration | 100% | 100% | 100% | 100% |
| 12 | Porosity of the first built line | 23.1% | 37.5% | 42.1% | 34.2% |
| 13 | Accessibility to the first built line | 76.9% | 62.5% | 66.7% | 68.7% |
| Average | 57.9% | 53.2% | 49.5% | 53.5% |
Disclaimer/Publisher’s Note: The statements, opinions and data contained in all publications are solely those of the individual author(s) and contributor(s) and not of MDPI and/or the editor(s). MDPI and/or the editor(s) disclaim responsibility for any injury to people or property resulting from any ideas, methods, instructions or products referred to in the content. |
© 2023 by the authors. Licensee MDPI, Basel, Switzerland. This article is an open access article distributed under the terms and conditions of the Creative Commons Attribution (CC BY) license (https://creativecommons.org/licenses/by/4.0/).
Share and Cite
Havránková, L.; Štych, P.; Ondr, P.; Moravcová, J.; Sláma, J. Assessment of the Connectivity and Comfort of Urban Rivers, a Case Study of the Czech Republic. Land 2023, 12, 814. https://doi.org/10.3390/land12040814
Havránková L, Štych P, Ondr P, Moravcová J, Sláma J. Assessment of the Connectivity and Comfort of Urban Rivers, a Case Study of the Czech Republic. Land. 2023; 12(4):814. https://doi.org/10.3390/land12040814
Chicago/Turabian StyleHavránková, Lucie, Přemysl Štych, Pavel Ondr, Jana Moravcová, and Jiří Sláma. 2023. "Assessment of the Connectivity and Comfort of Urban Rivers, a Case Study of the Czech Republic" Land 12, no. 4: 814. https://doi.org/10.3390/land12040814
APA StyleHavránková, L., Štych, P., Ondr, P., Moravcová, J., & Sláma, J. (2023). Assessment of the Connectivity and Comfort of Urban Rivers, a Case Study of the Czech Republic. Land, 12(4), 814. https://doi.org/10.3390/land12040814