
Spatial-Temporal Evolution Patterns and Influencing Factors of Hotels in Yellow River Basin from 2012 to 2022

 ,
,  ,
,
Abstract
:1. Introduction
2. Materials and Methods
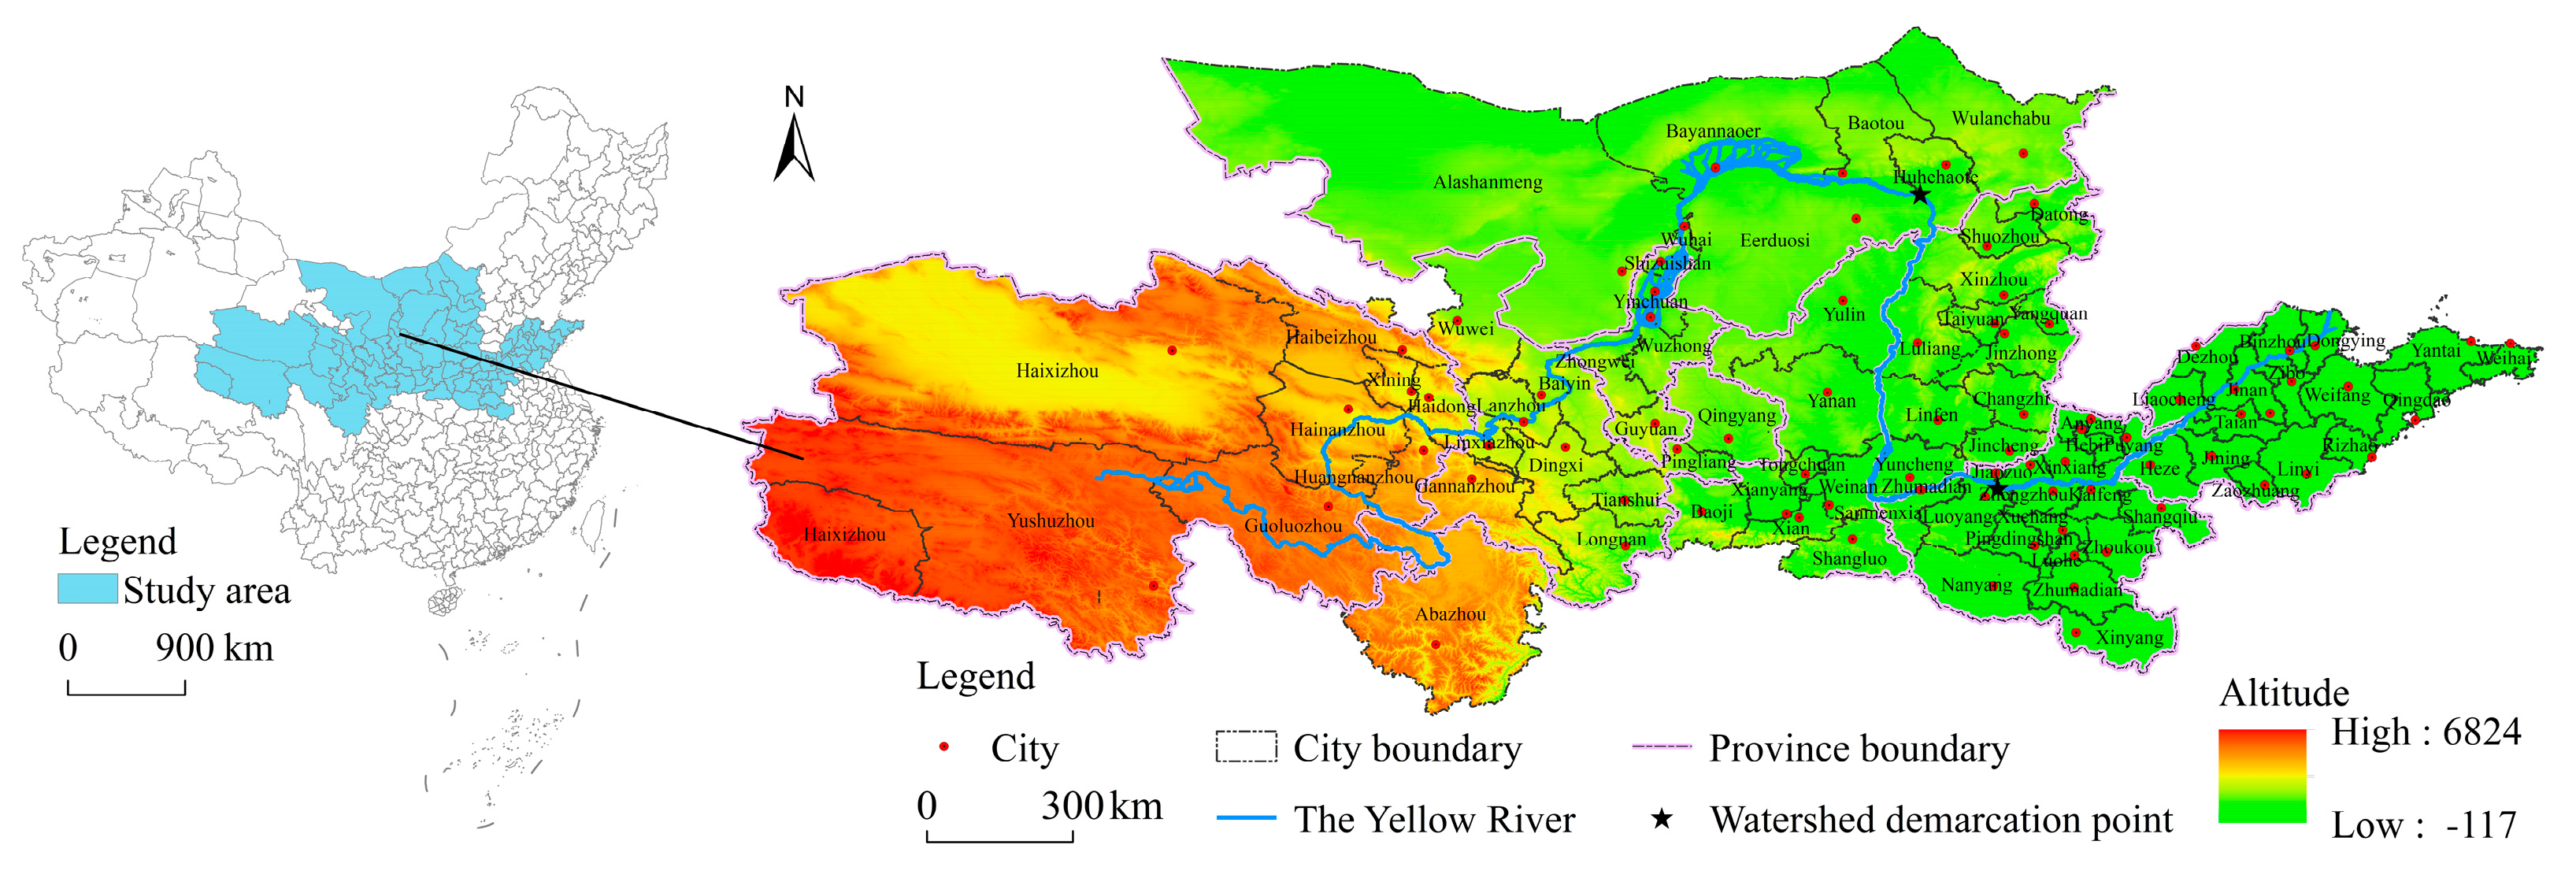
2.1. Research Area and Object
2.2. Research Data
2.3. Research Methods
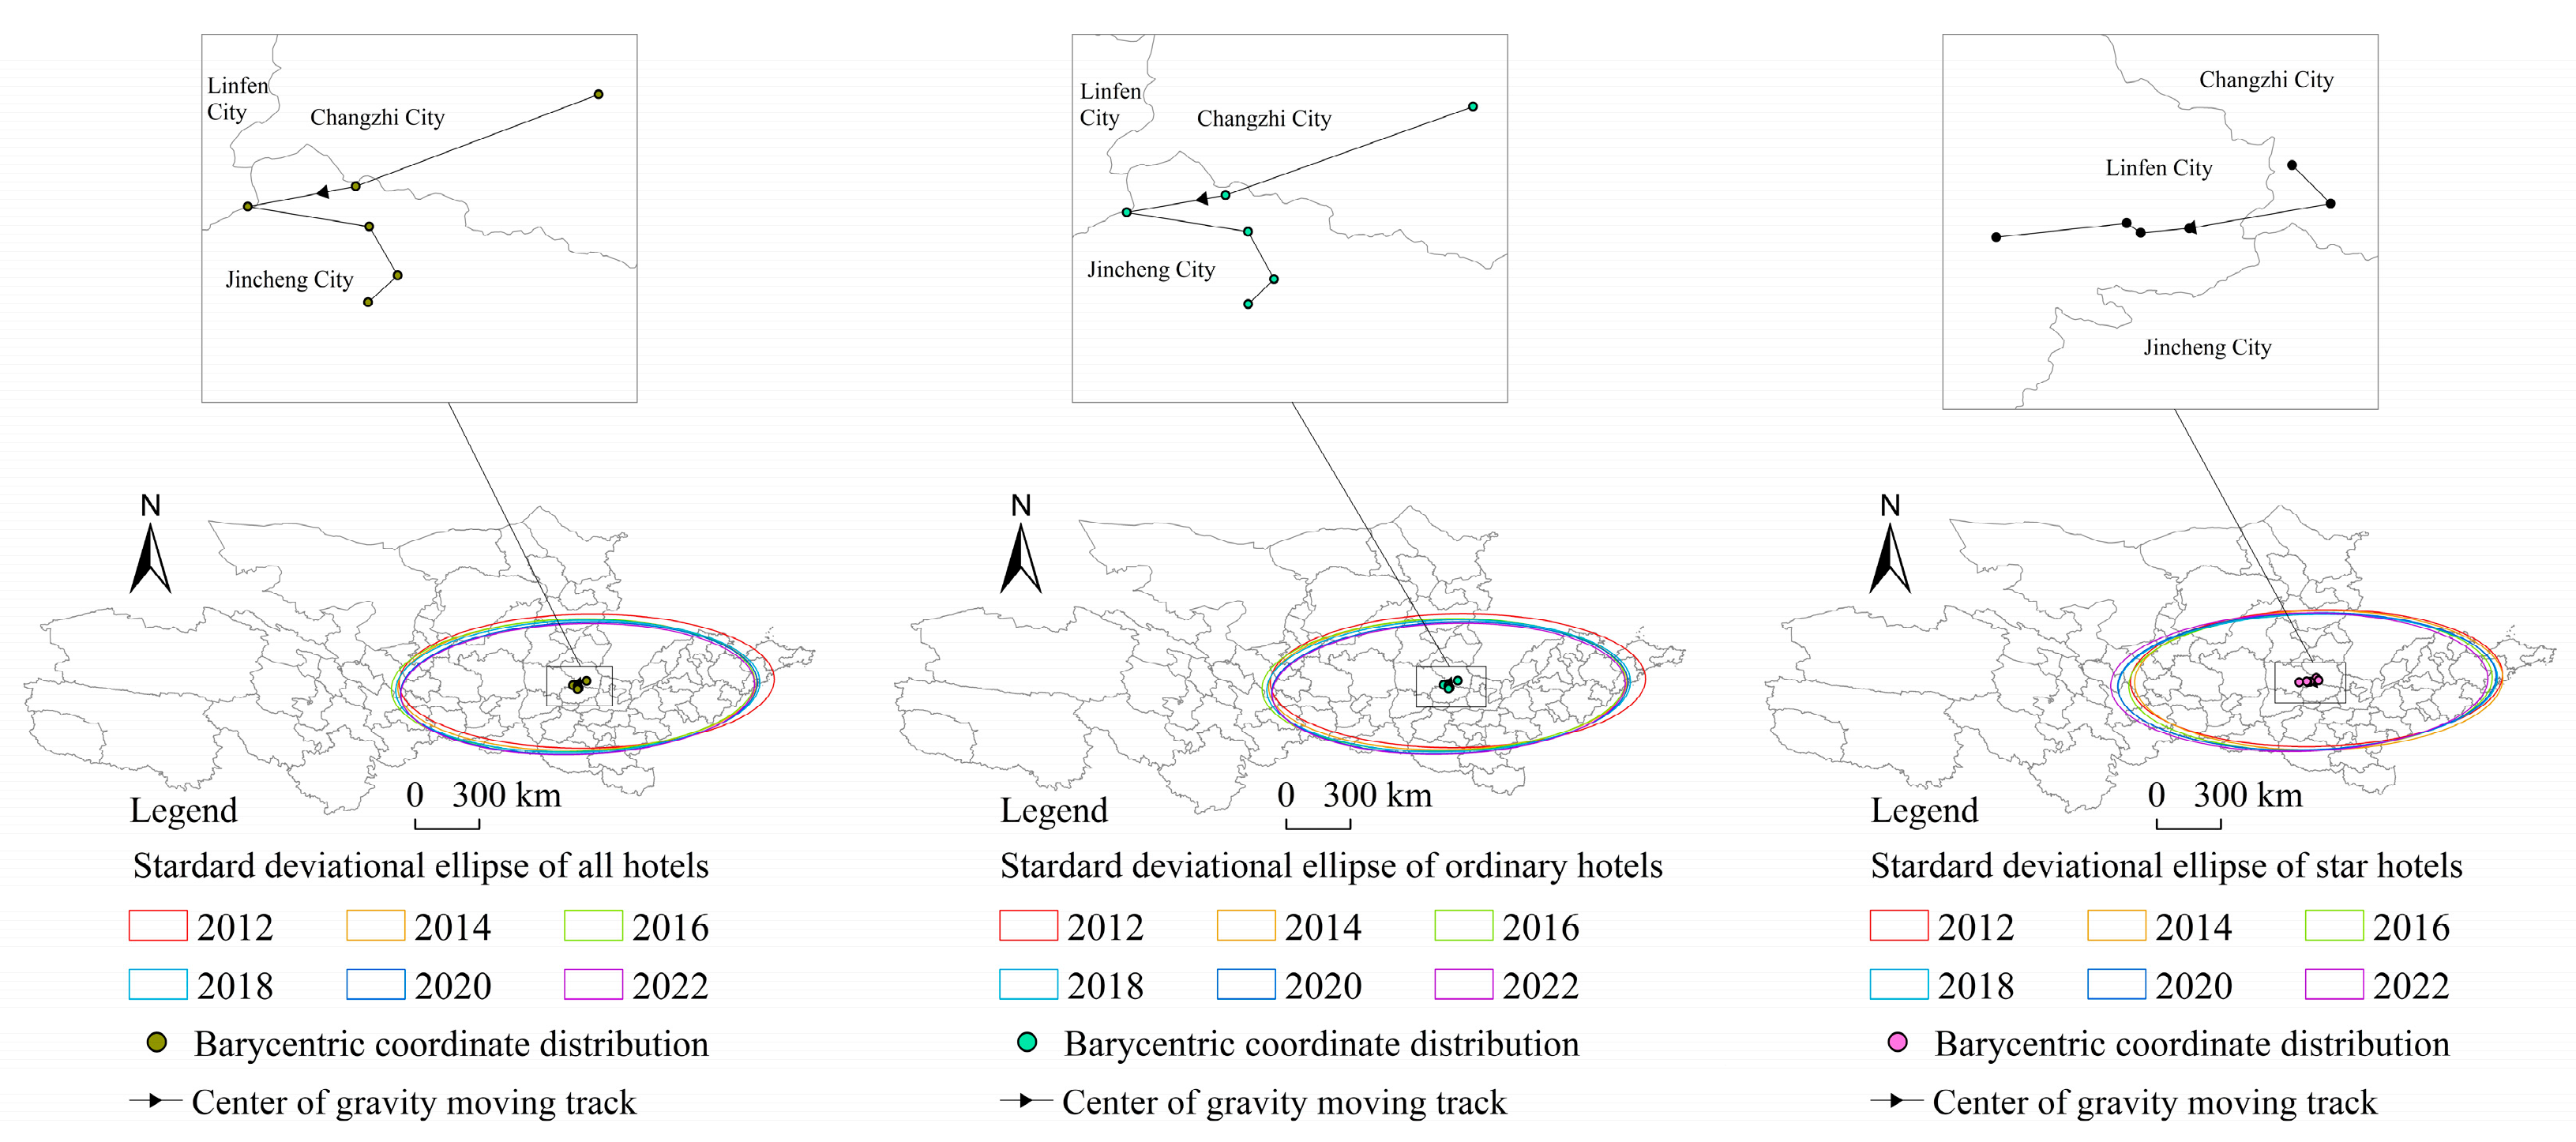
2.3.1. Standard Deviation Ellipse
2.3.2. Density Computing
2.3.3. Spatial Autocorrelation
2.3.4. Geographical Detector
2.3.5. Pearson Correlation Coefficient
3. Characteristics of Spatial-Temporal Evolution of Hotels in the Yellow River Basin
3.1. Characteristics of Spatial-Temporal Changes in Hotel Industry
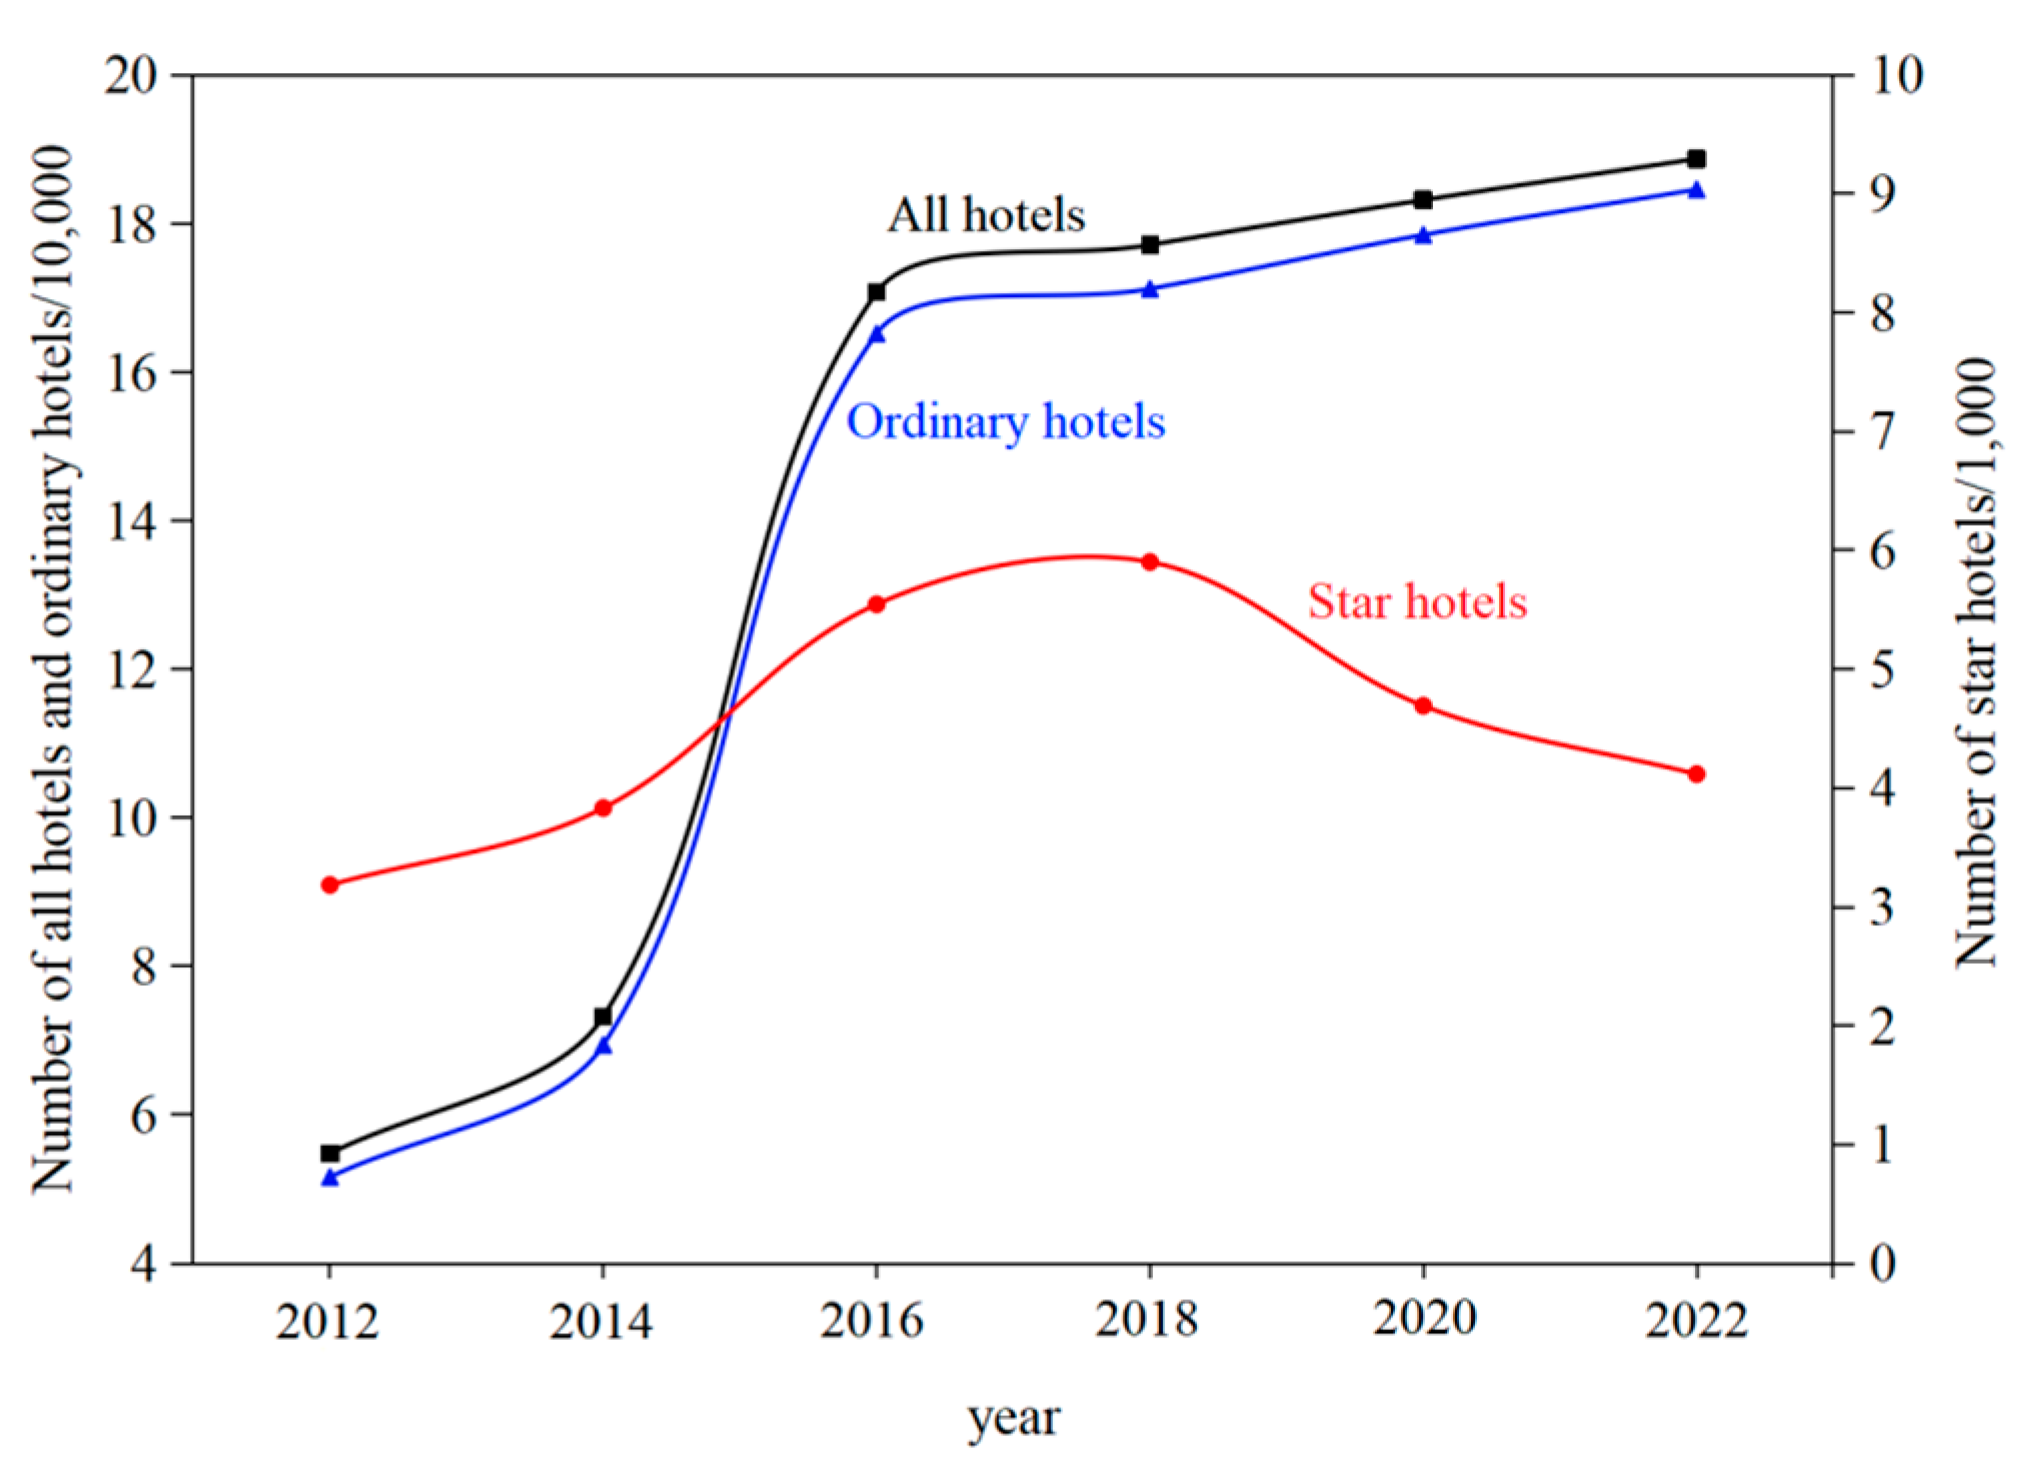
3.1.1. Temporal Evolving Characteristics
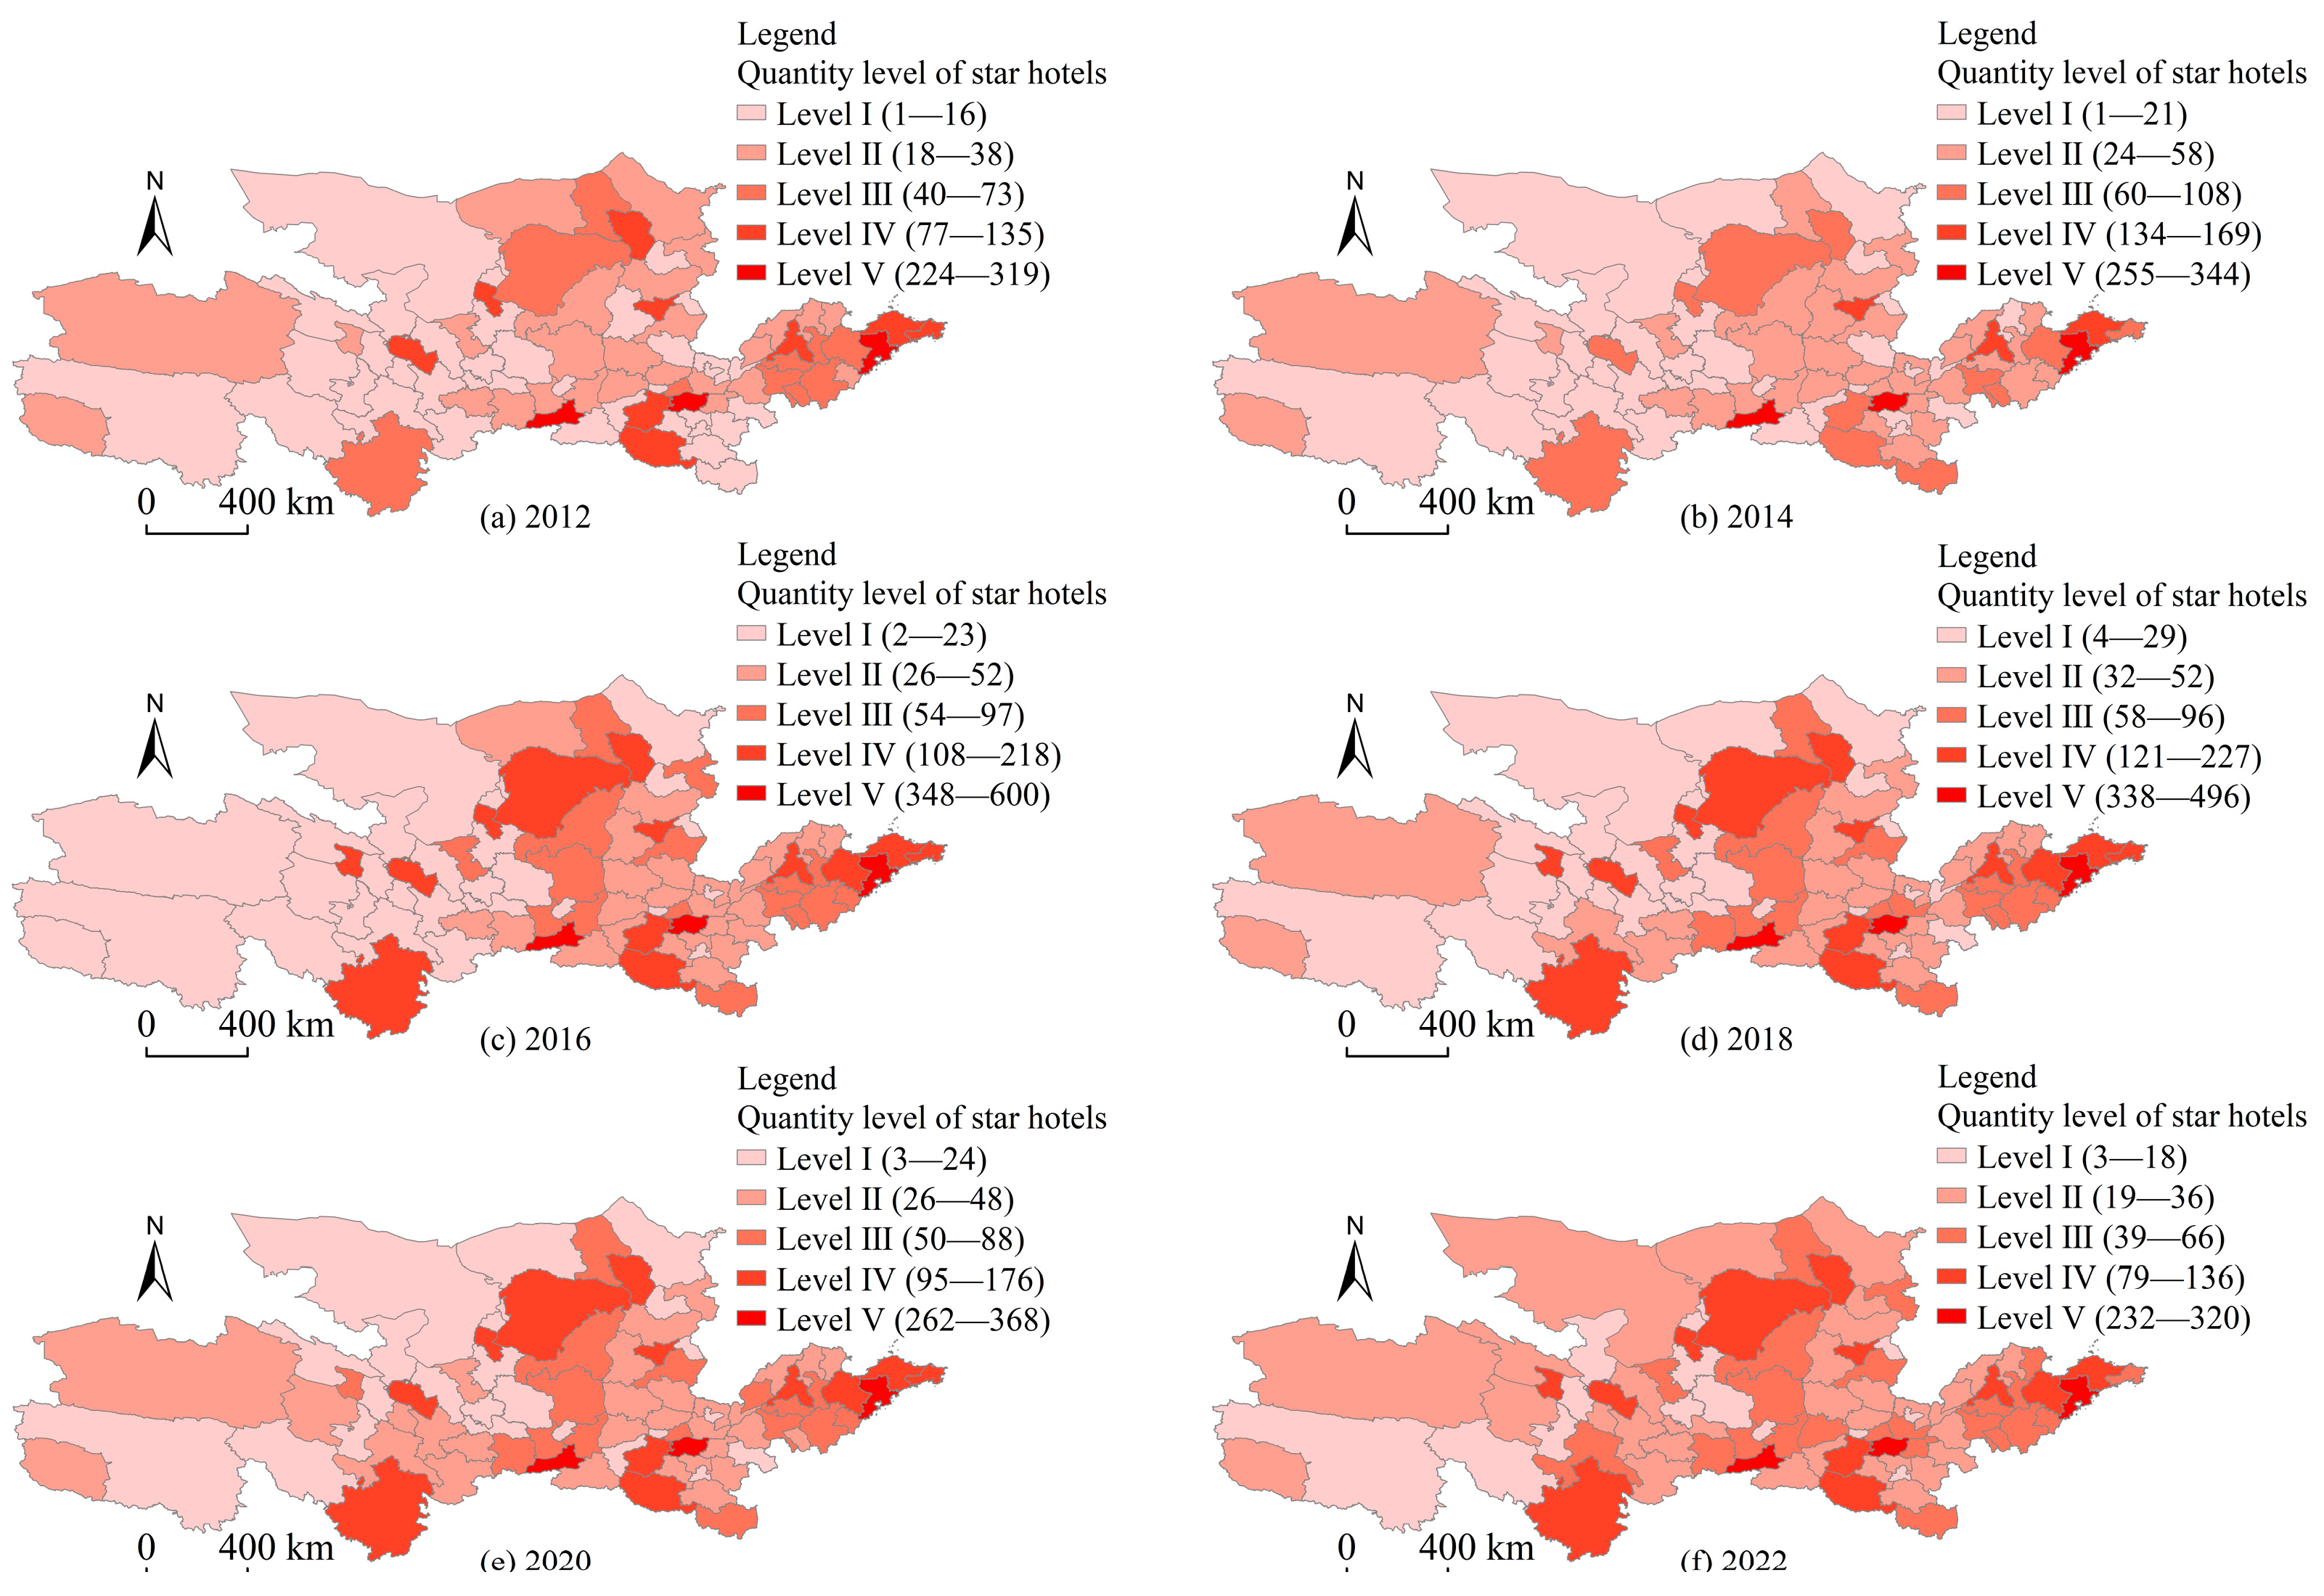
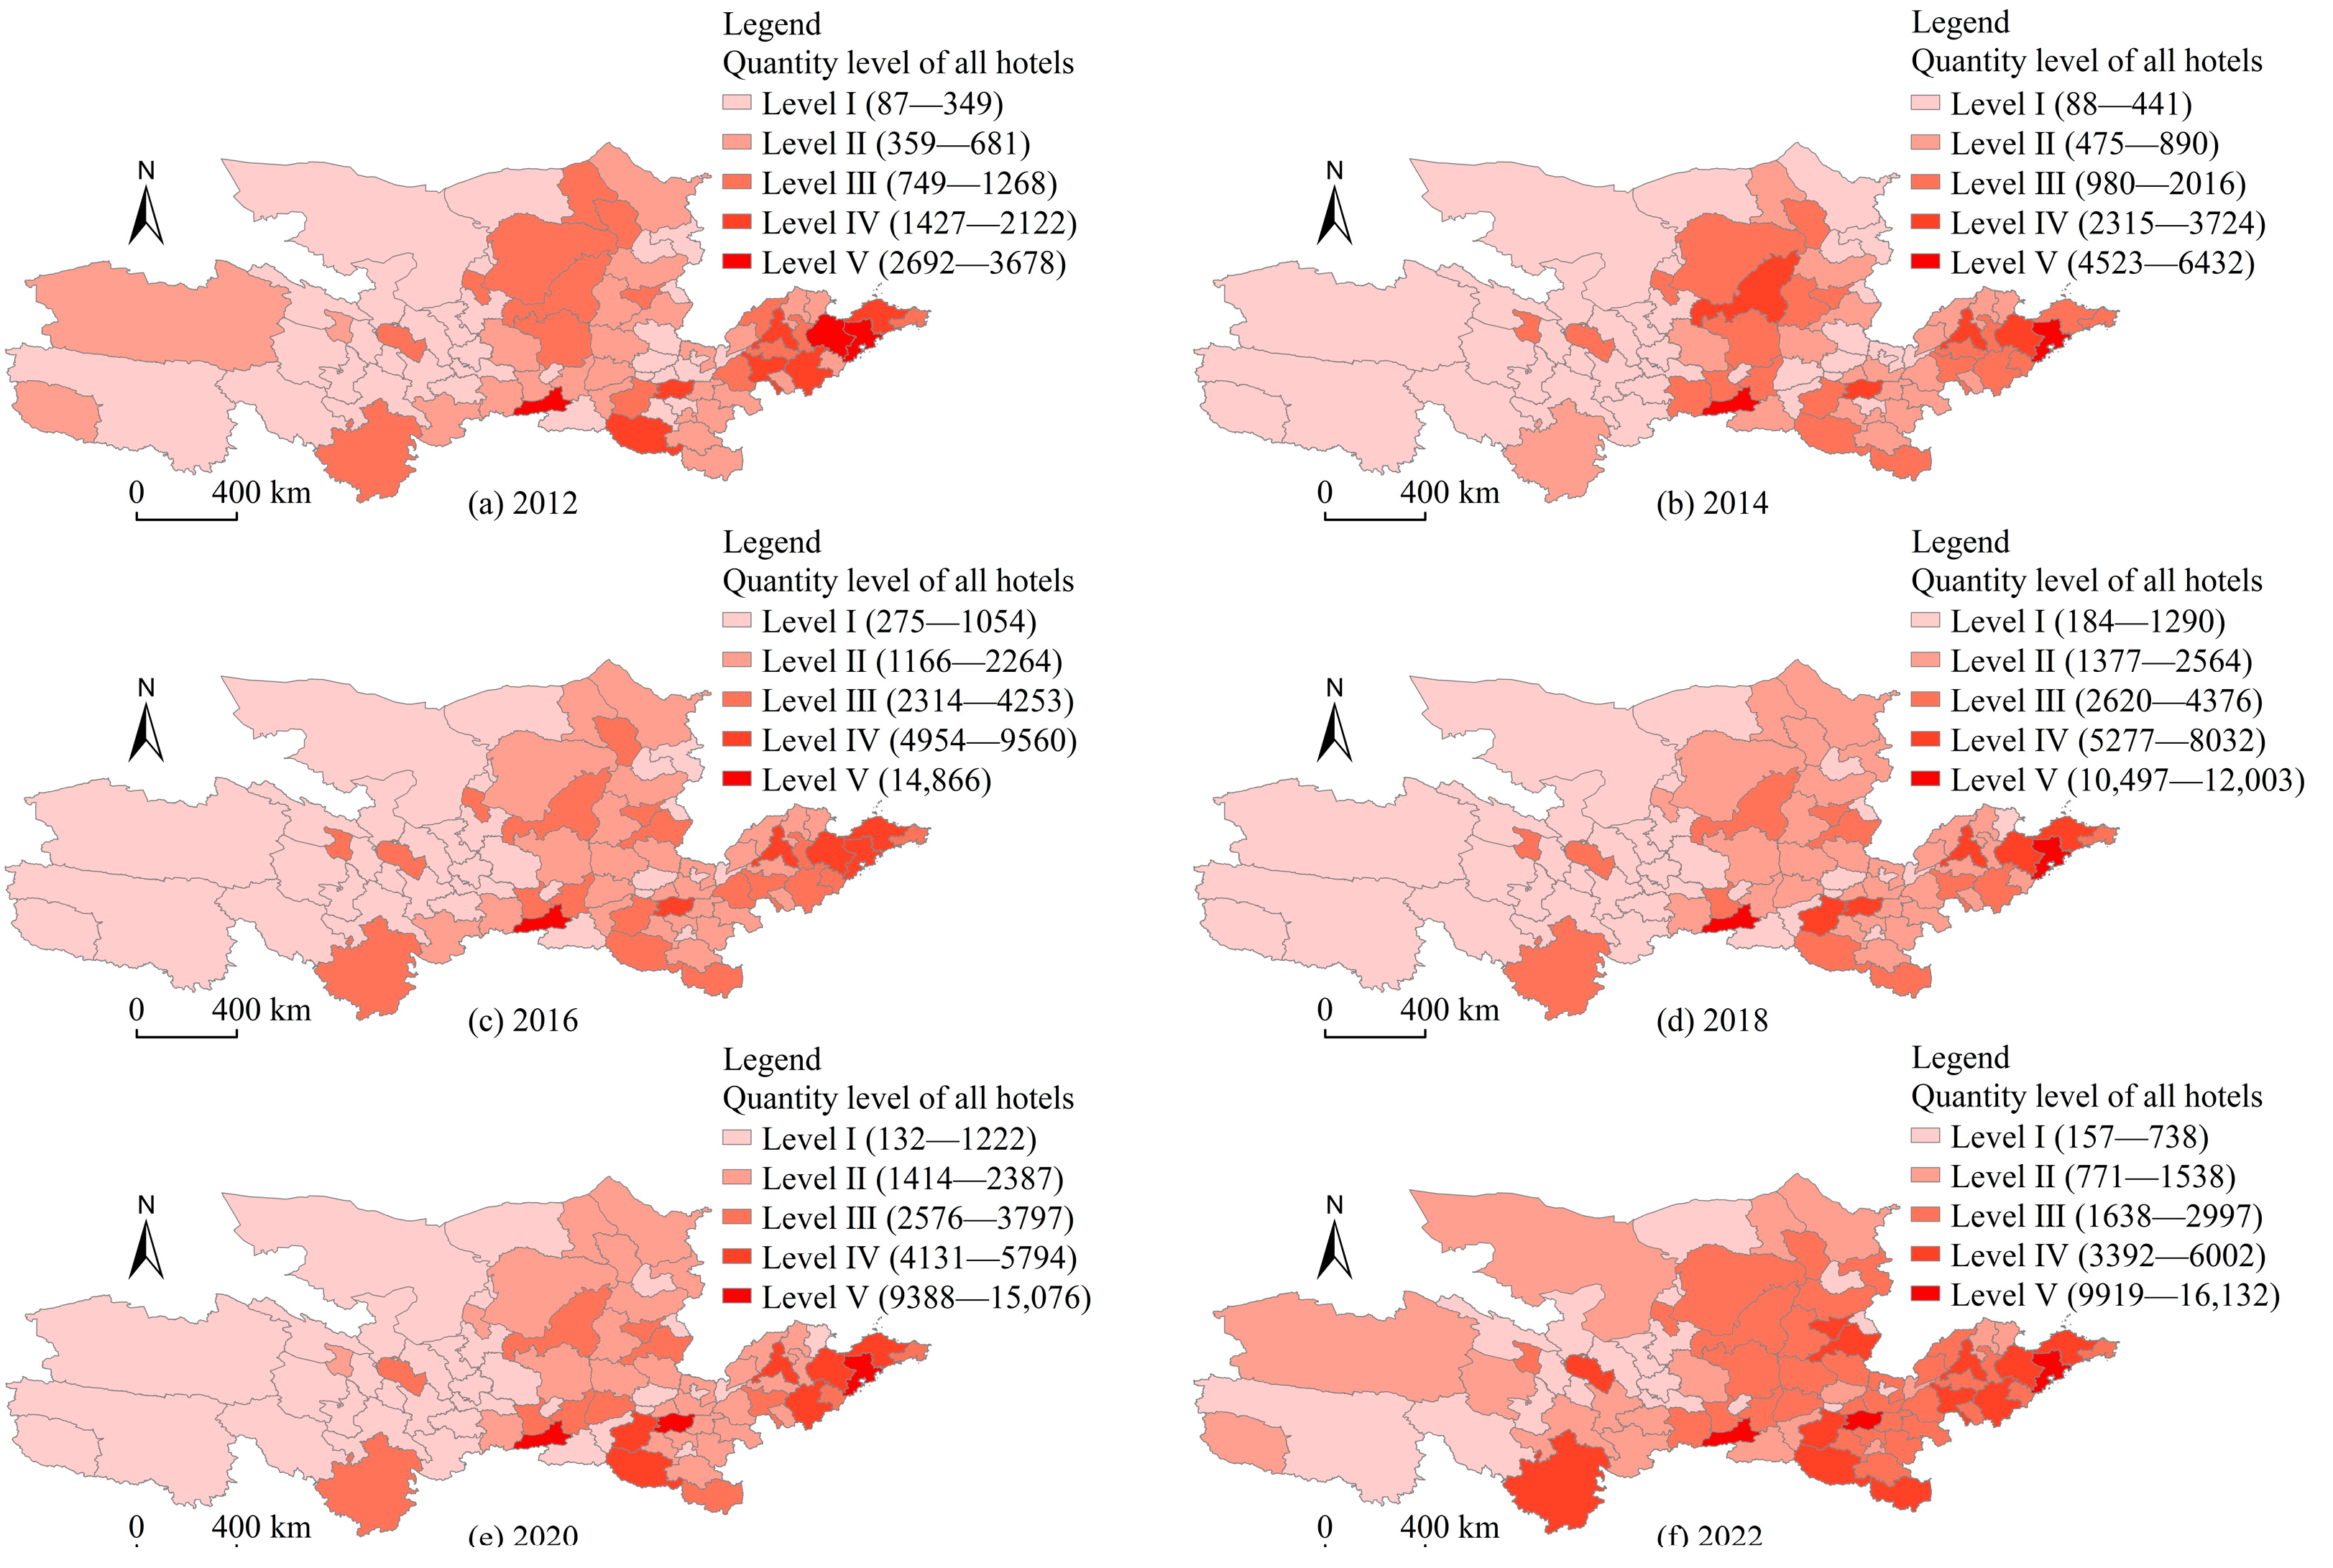
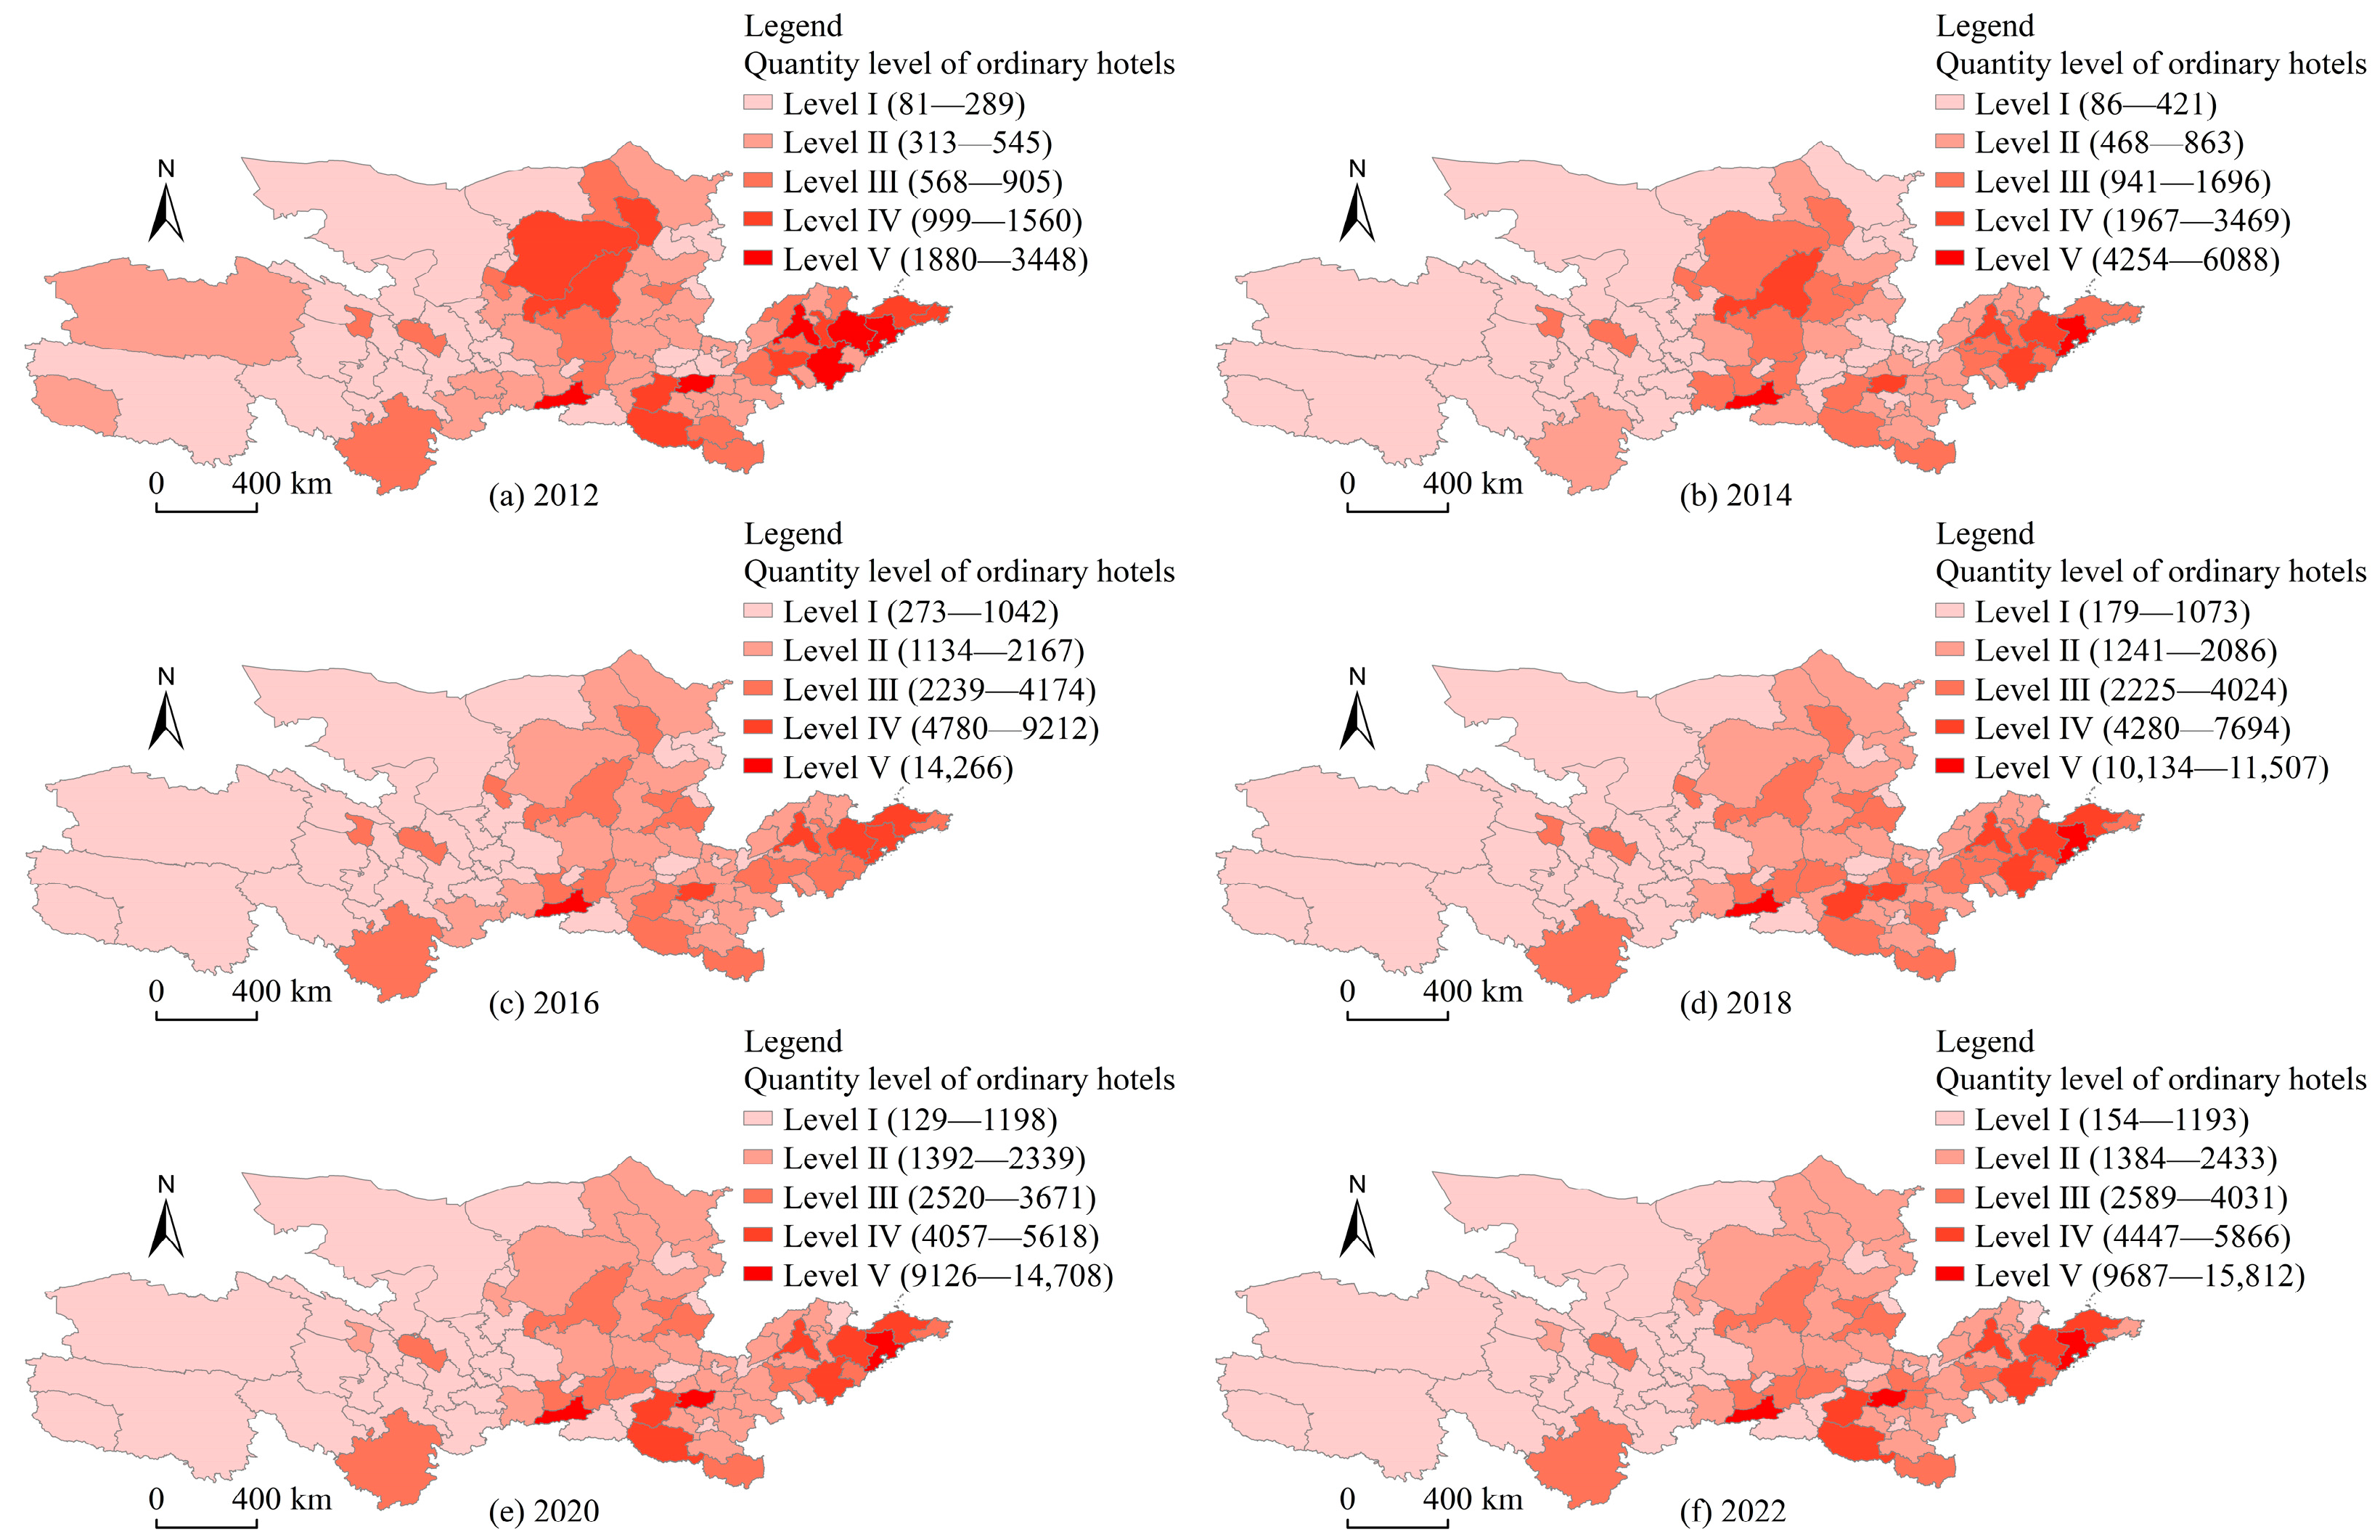
3.1.2. Spatial Evolving Characteristics
3.1.3. Spatial-Temporal Evolving Trend
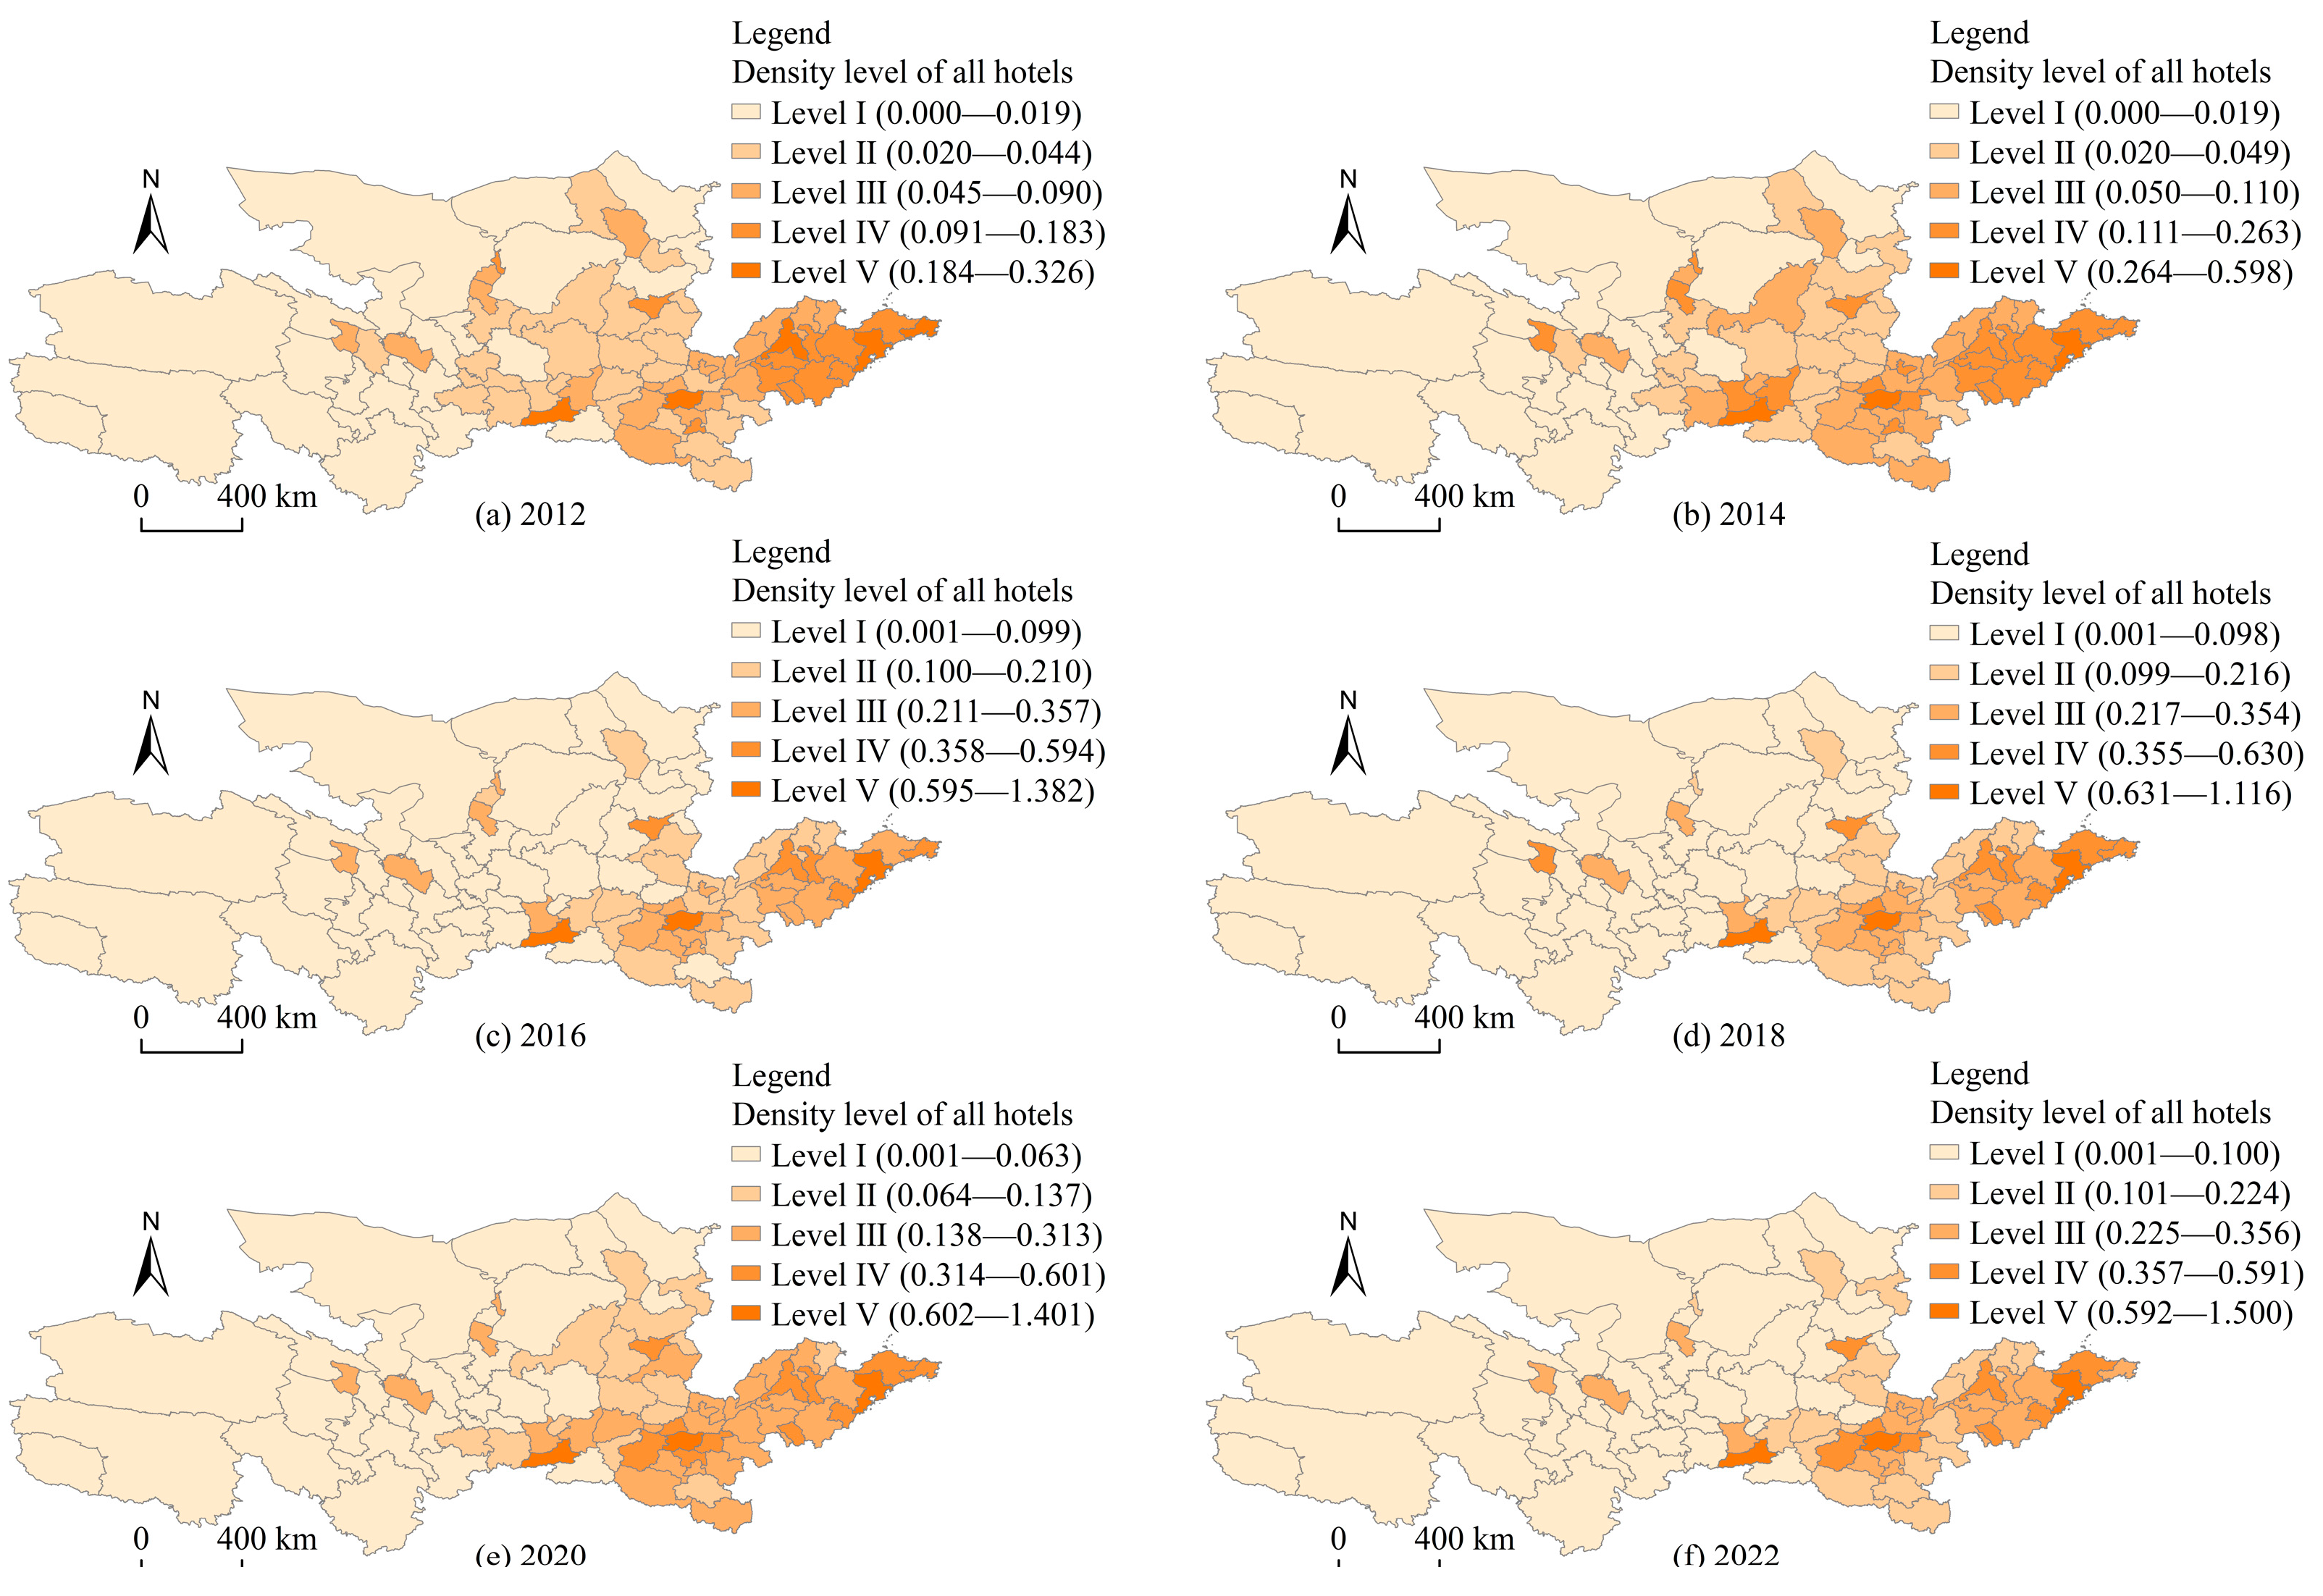
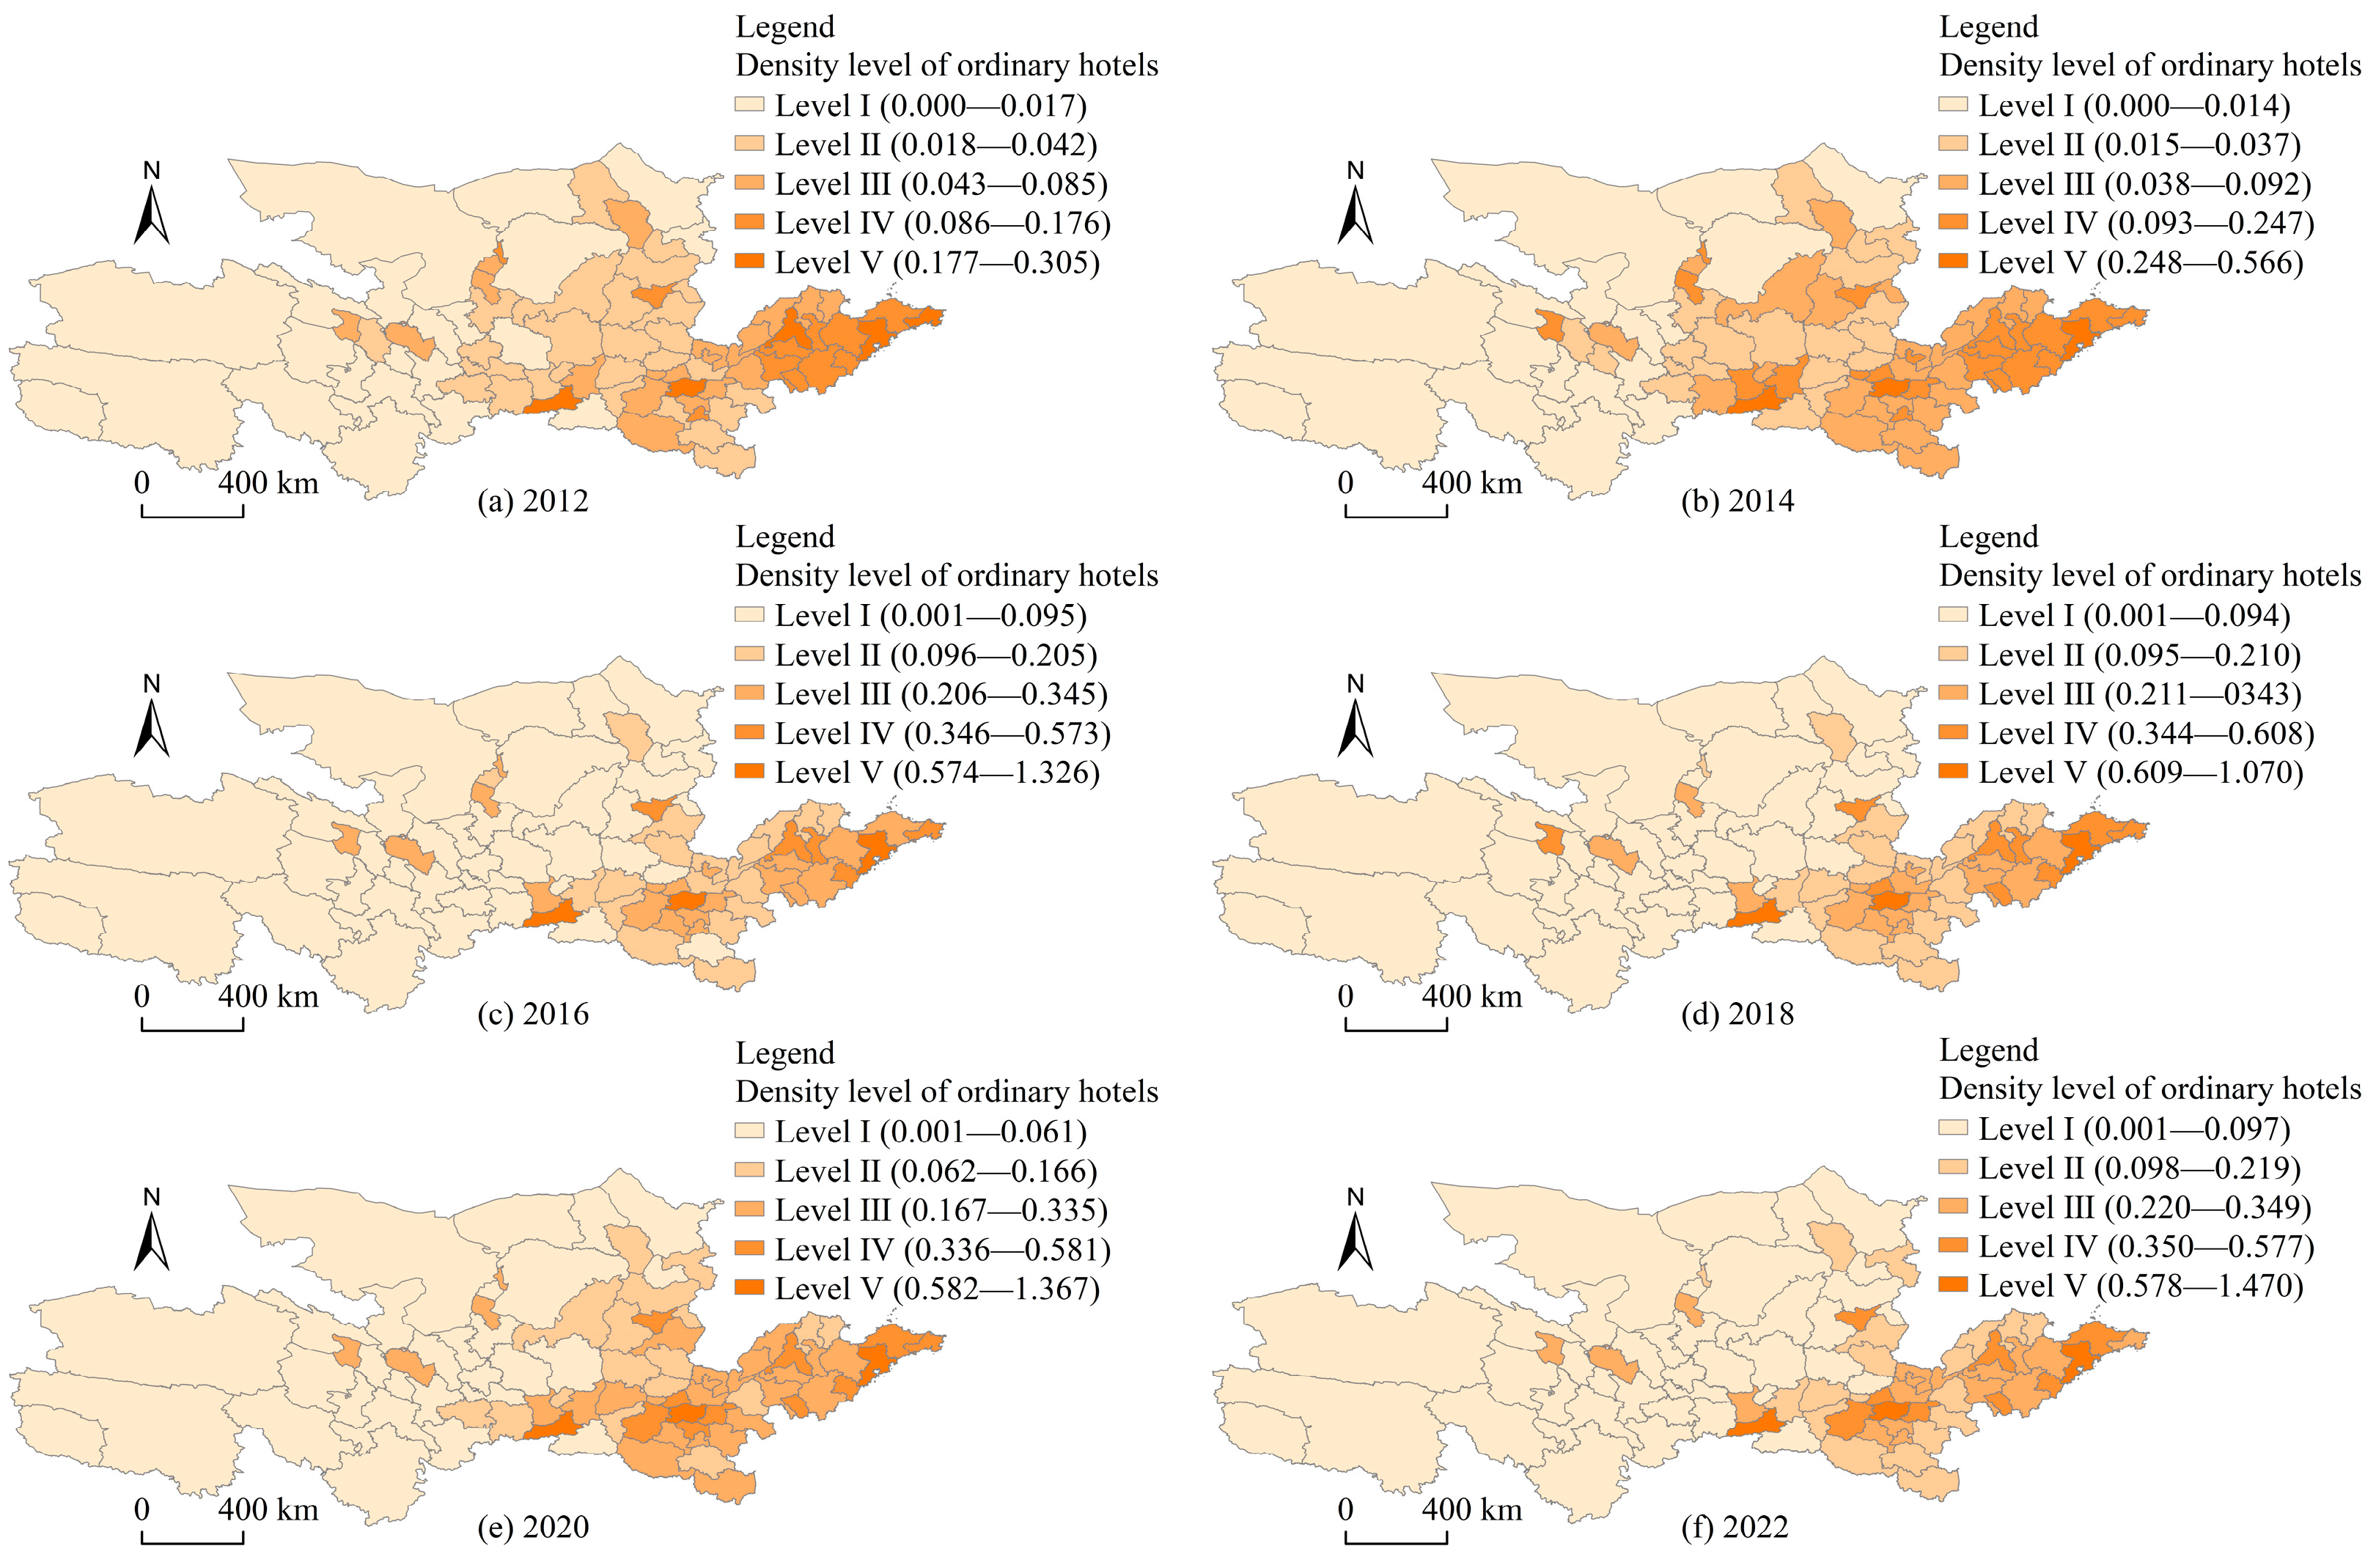
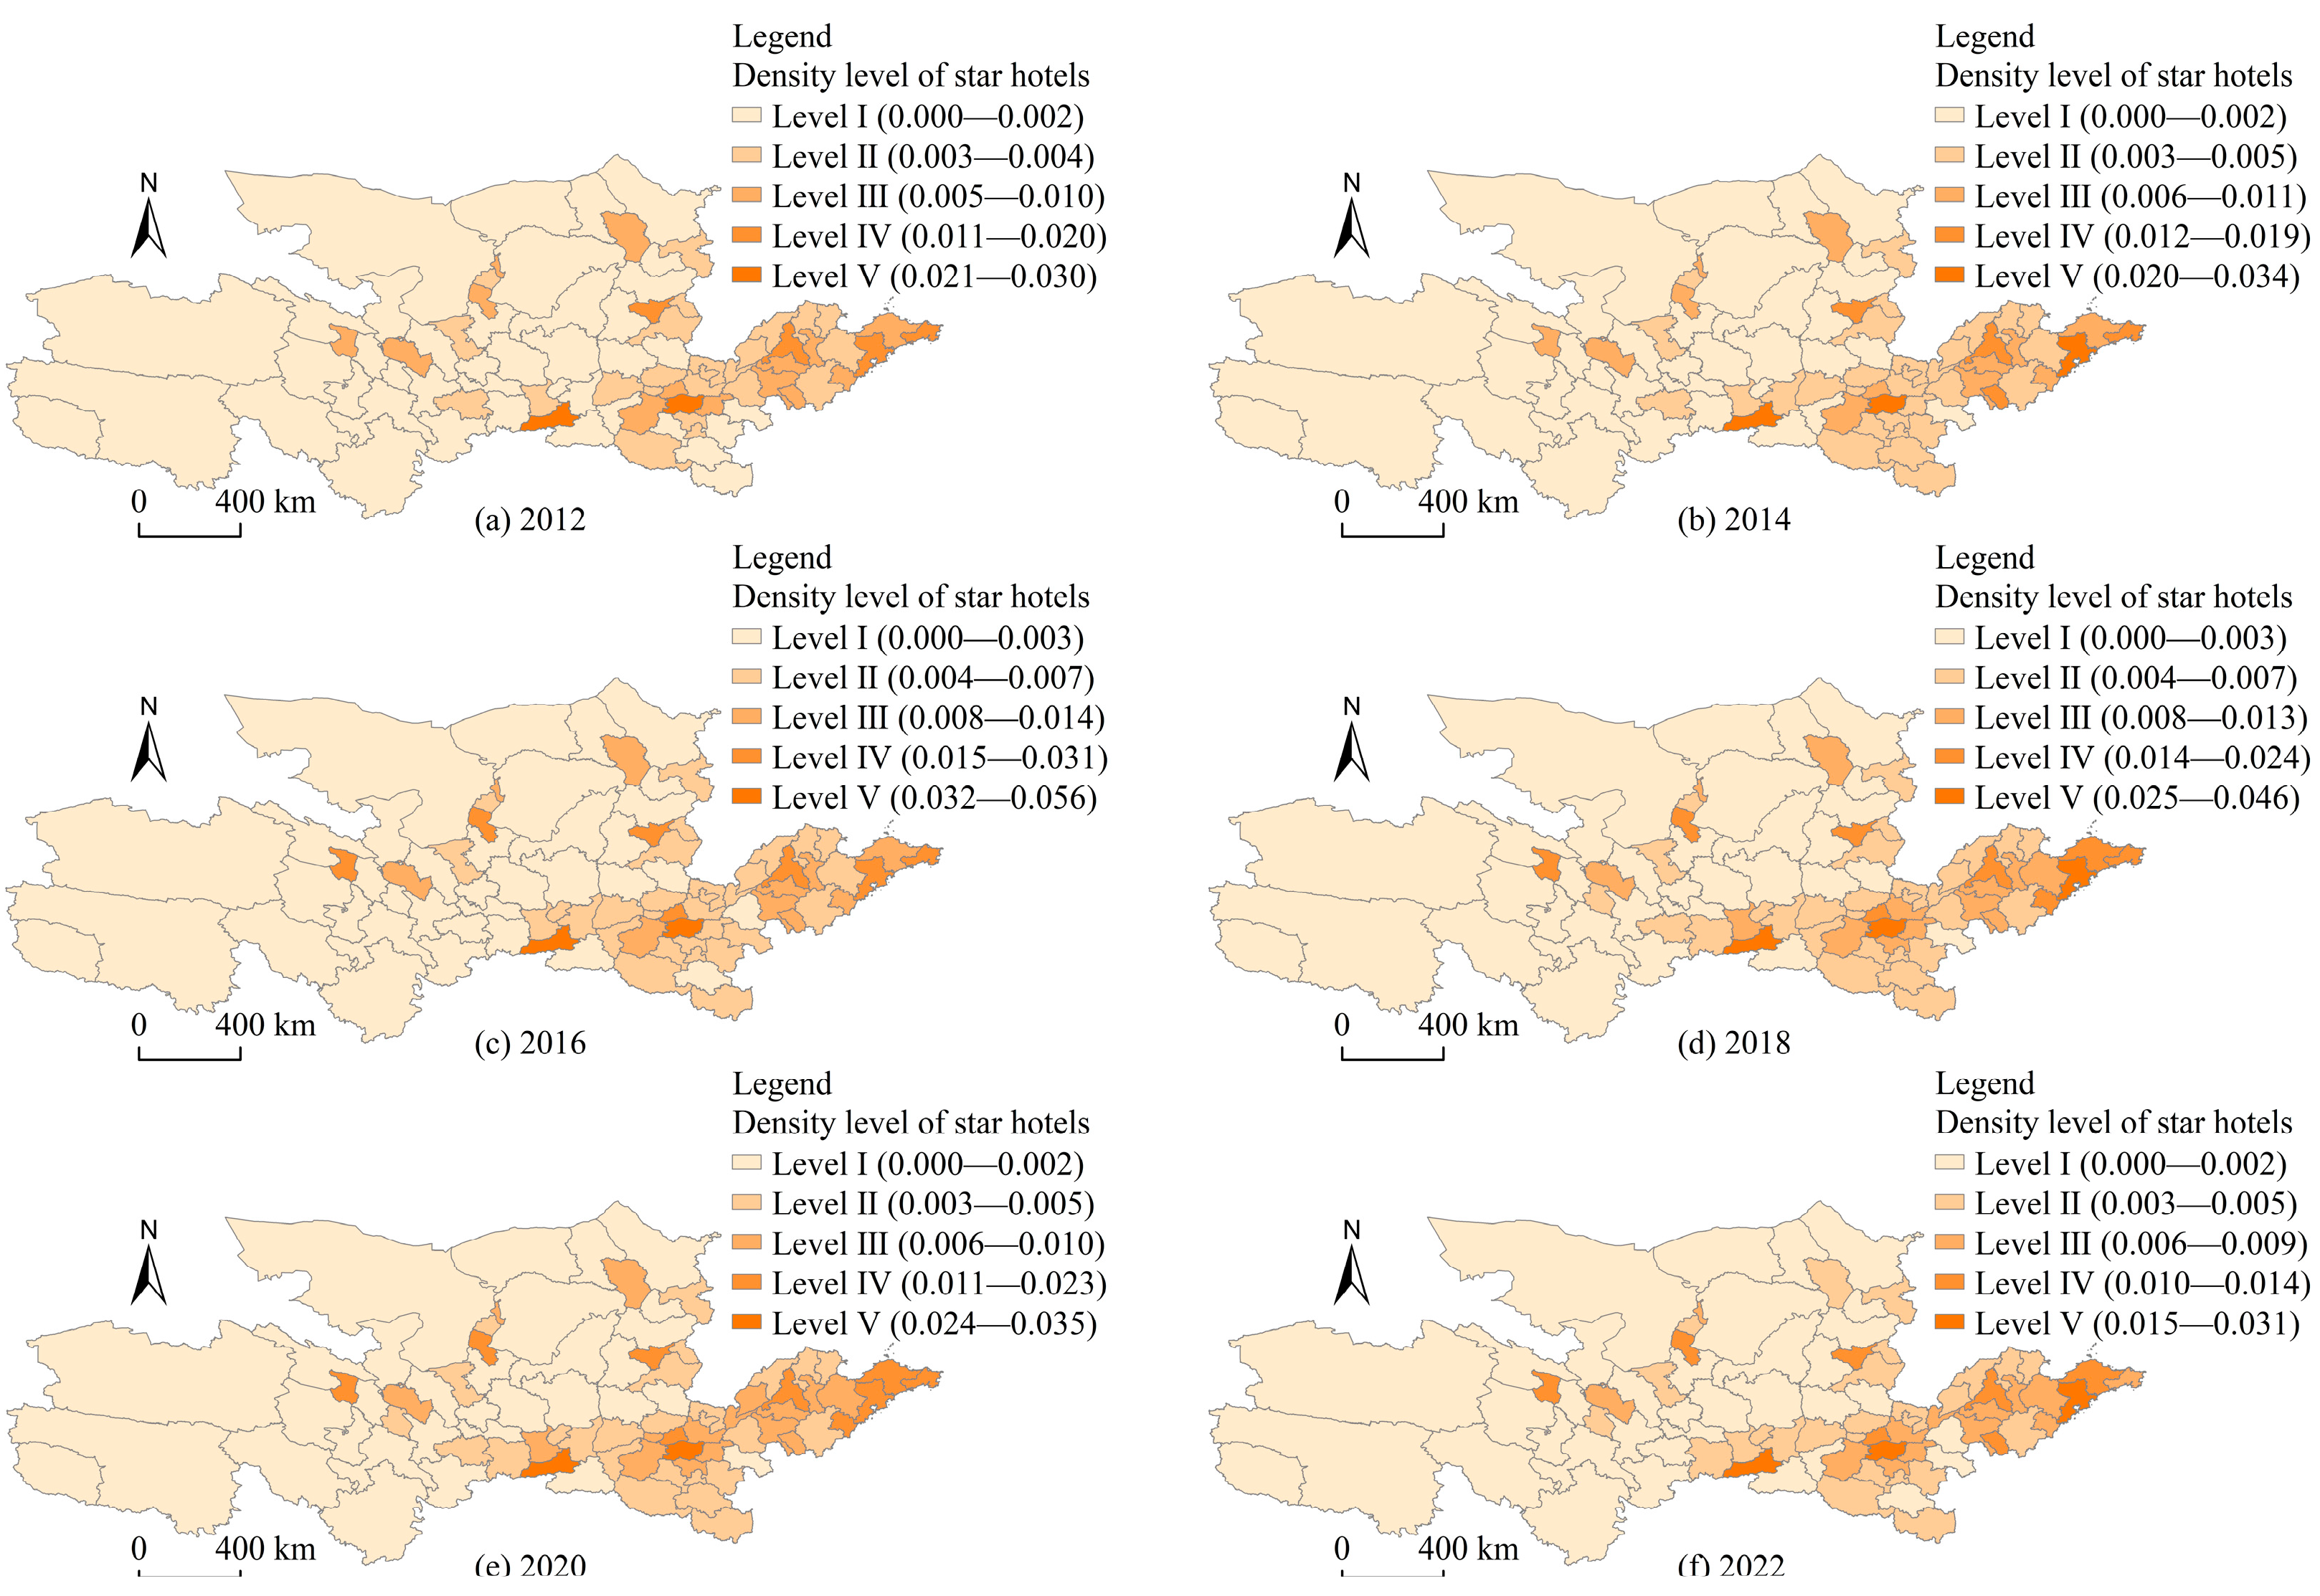
3.2. Characteristics of Hotel Industry Density Change
4. Spatial Correlation Analysis of Hotel Industry
4.1. Characteristics of Spatial-Temporal Changes in Hotel Industry
4.2. Local Spatial Autocorrelation Analysis
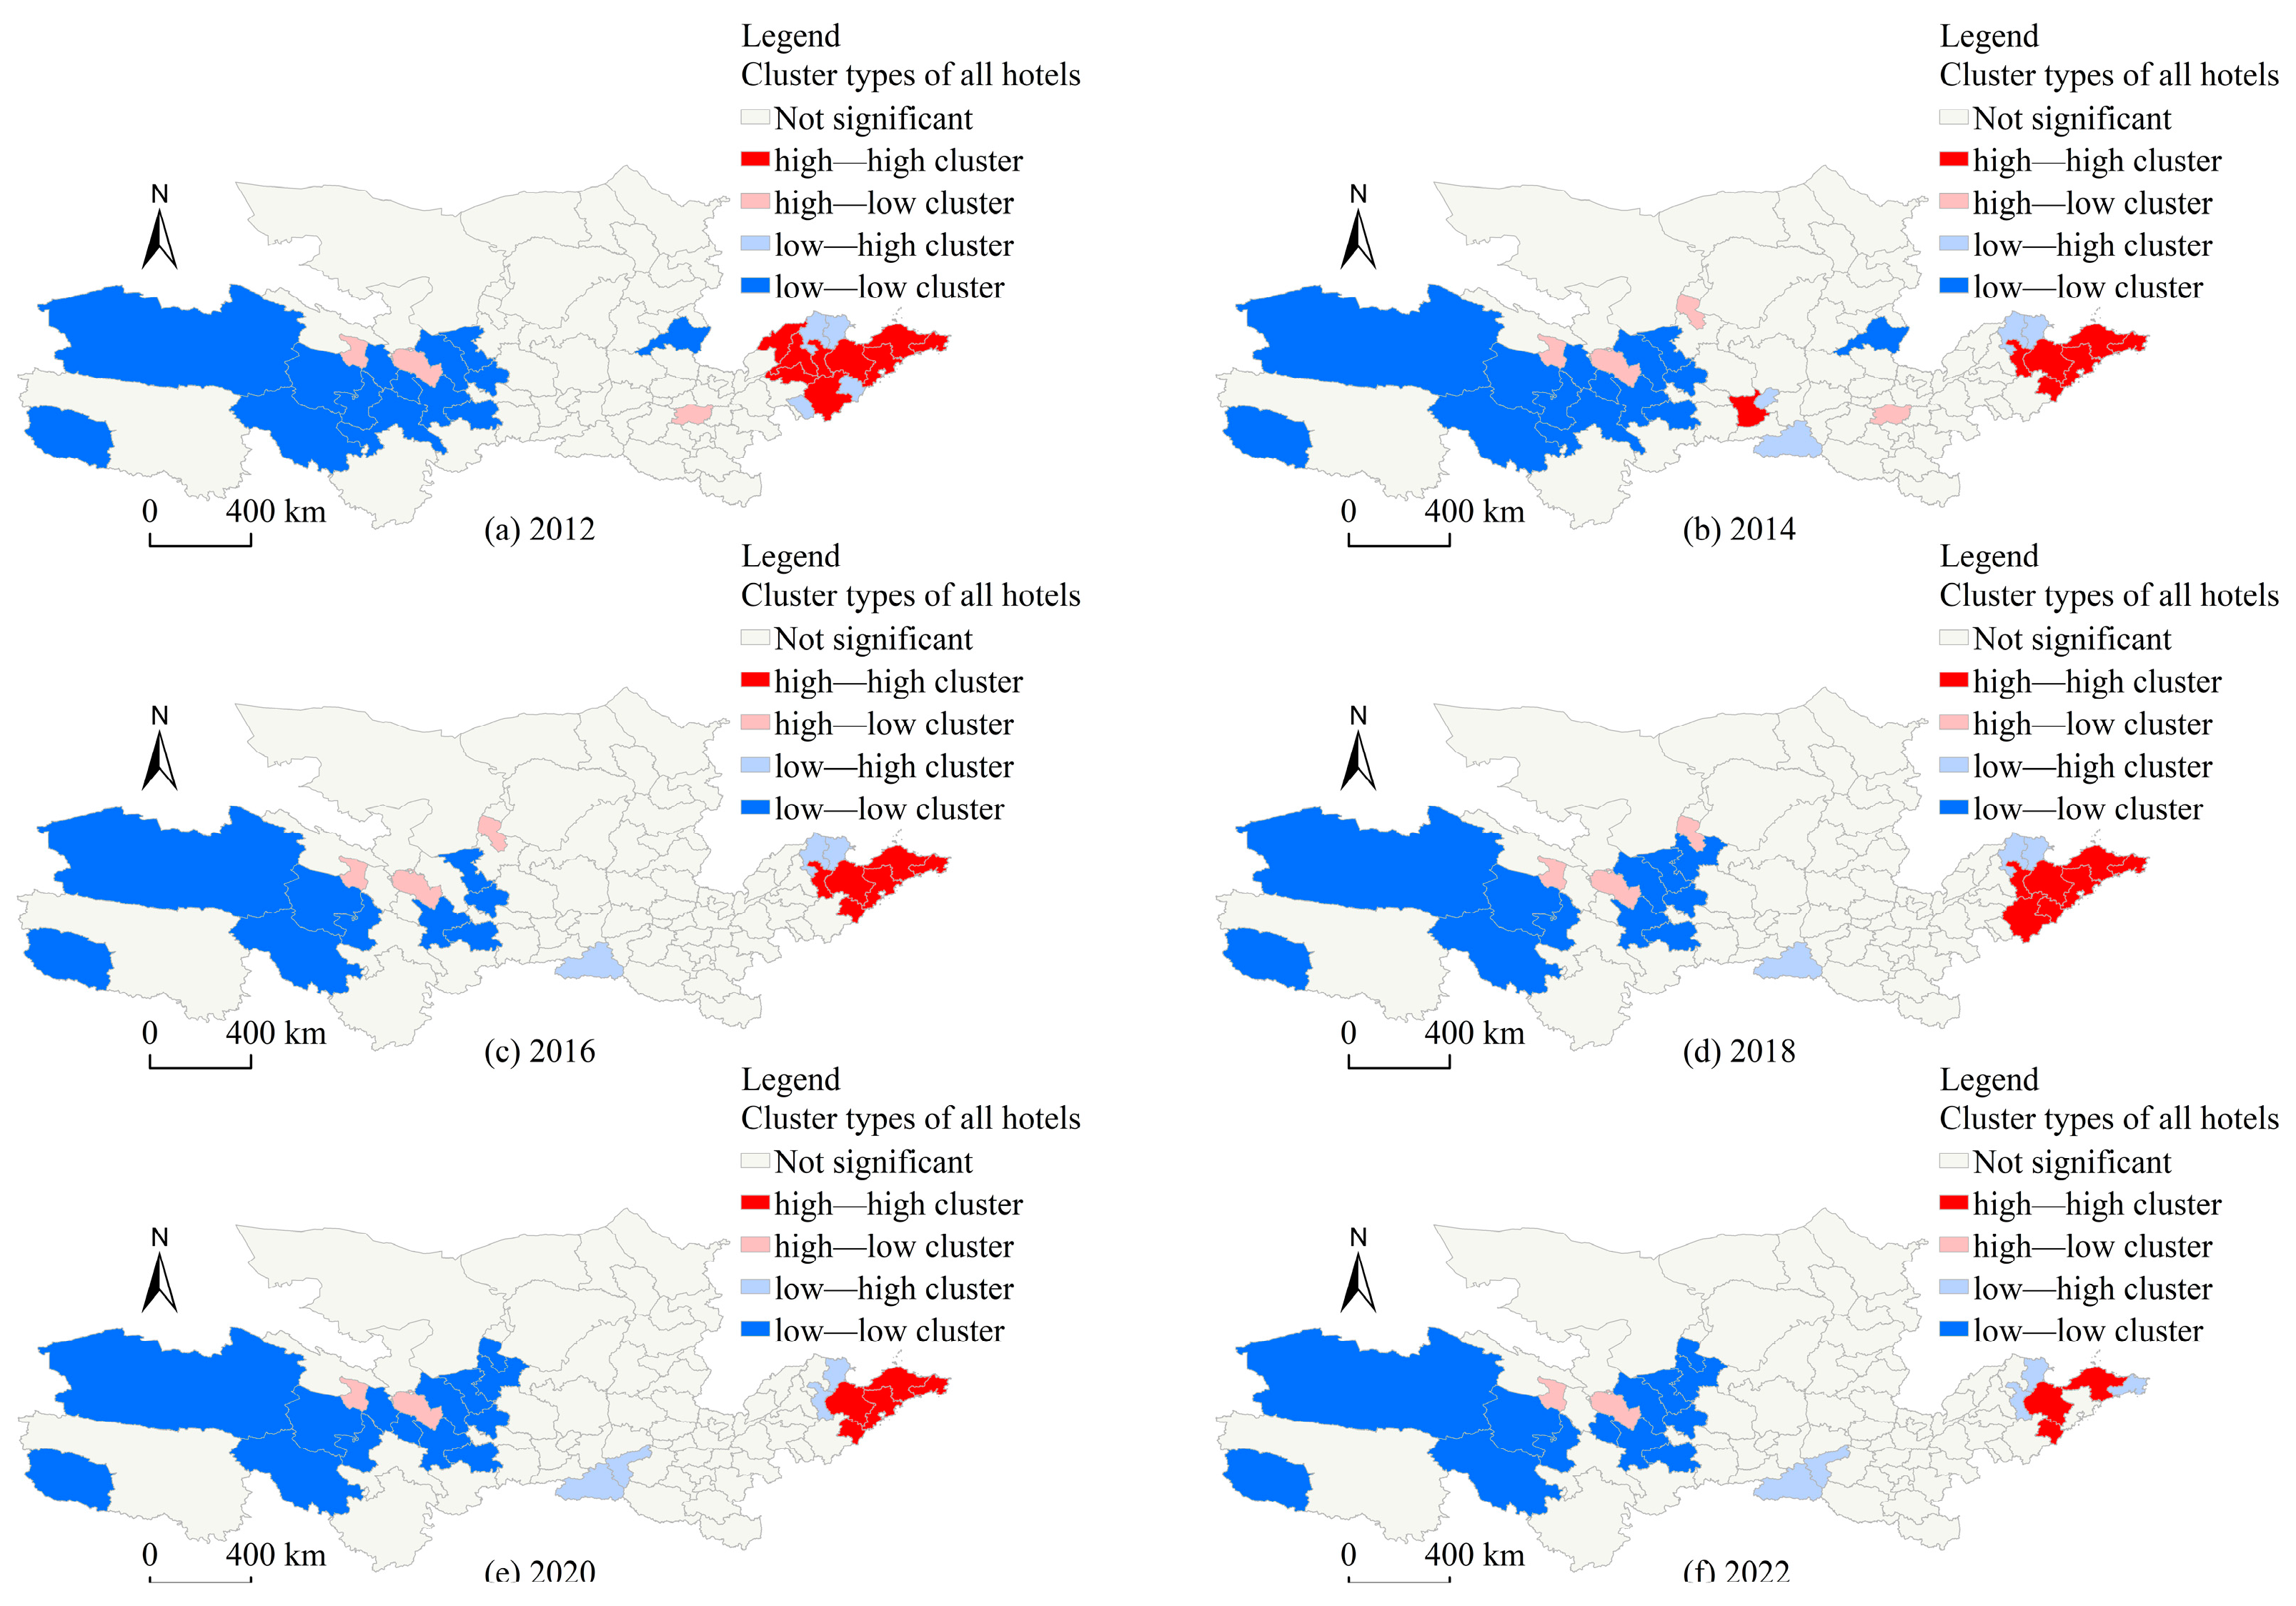
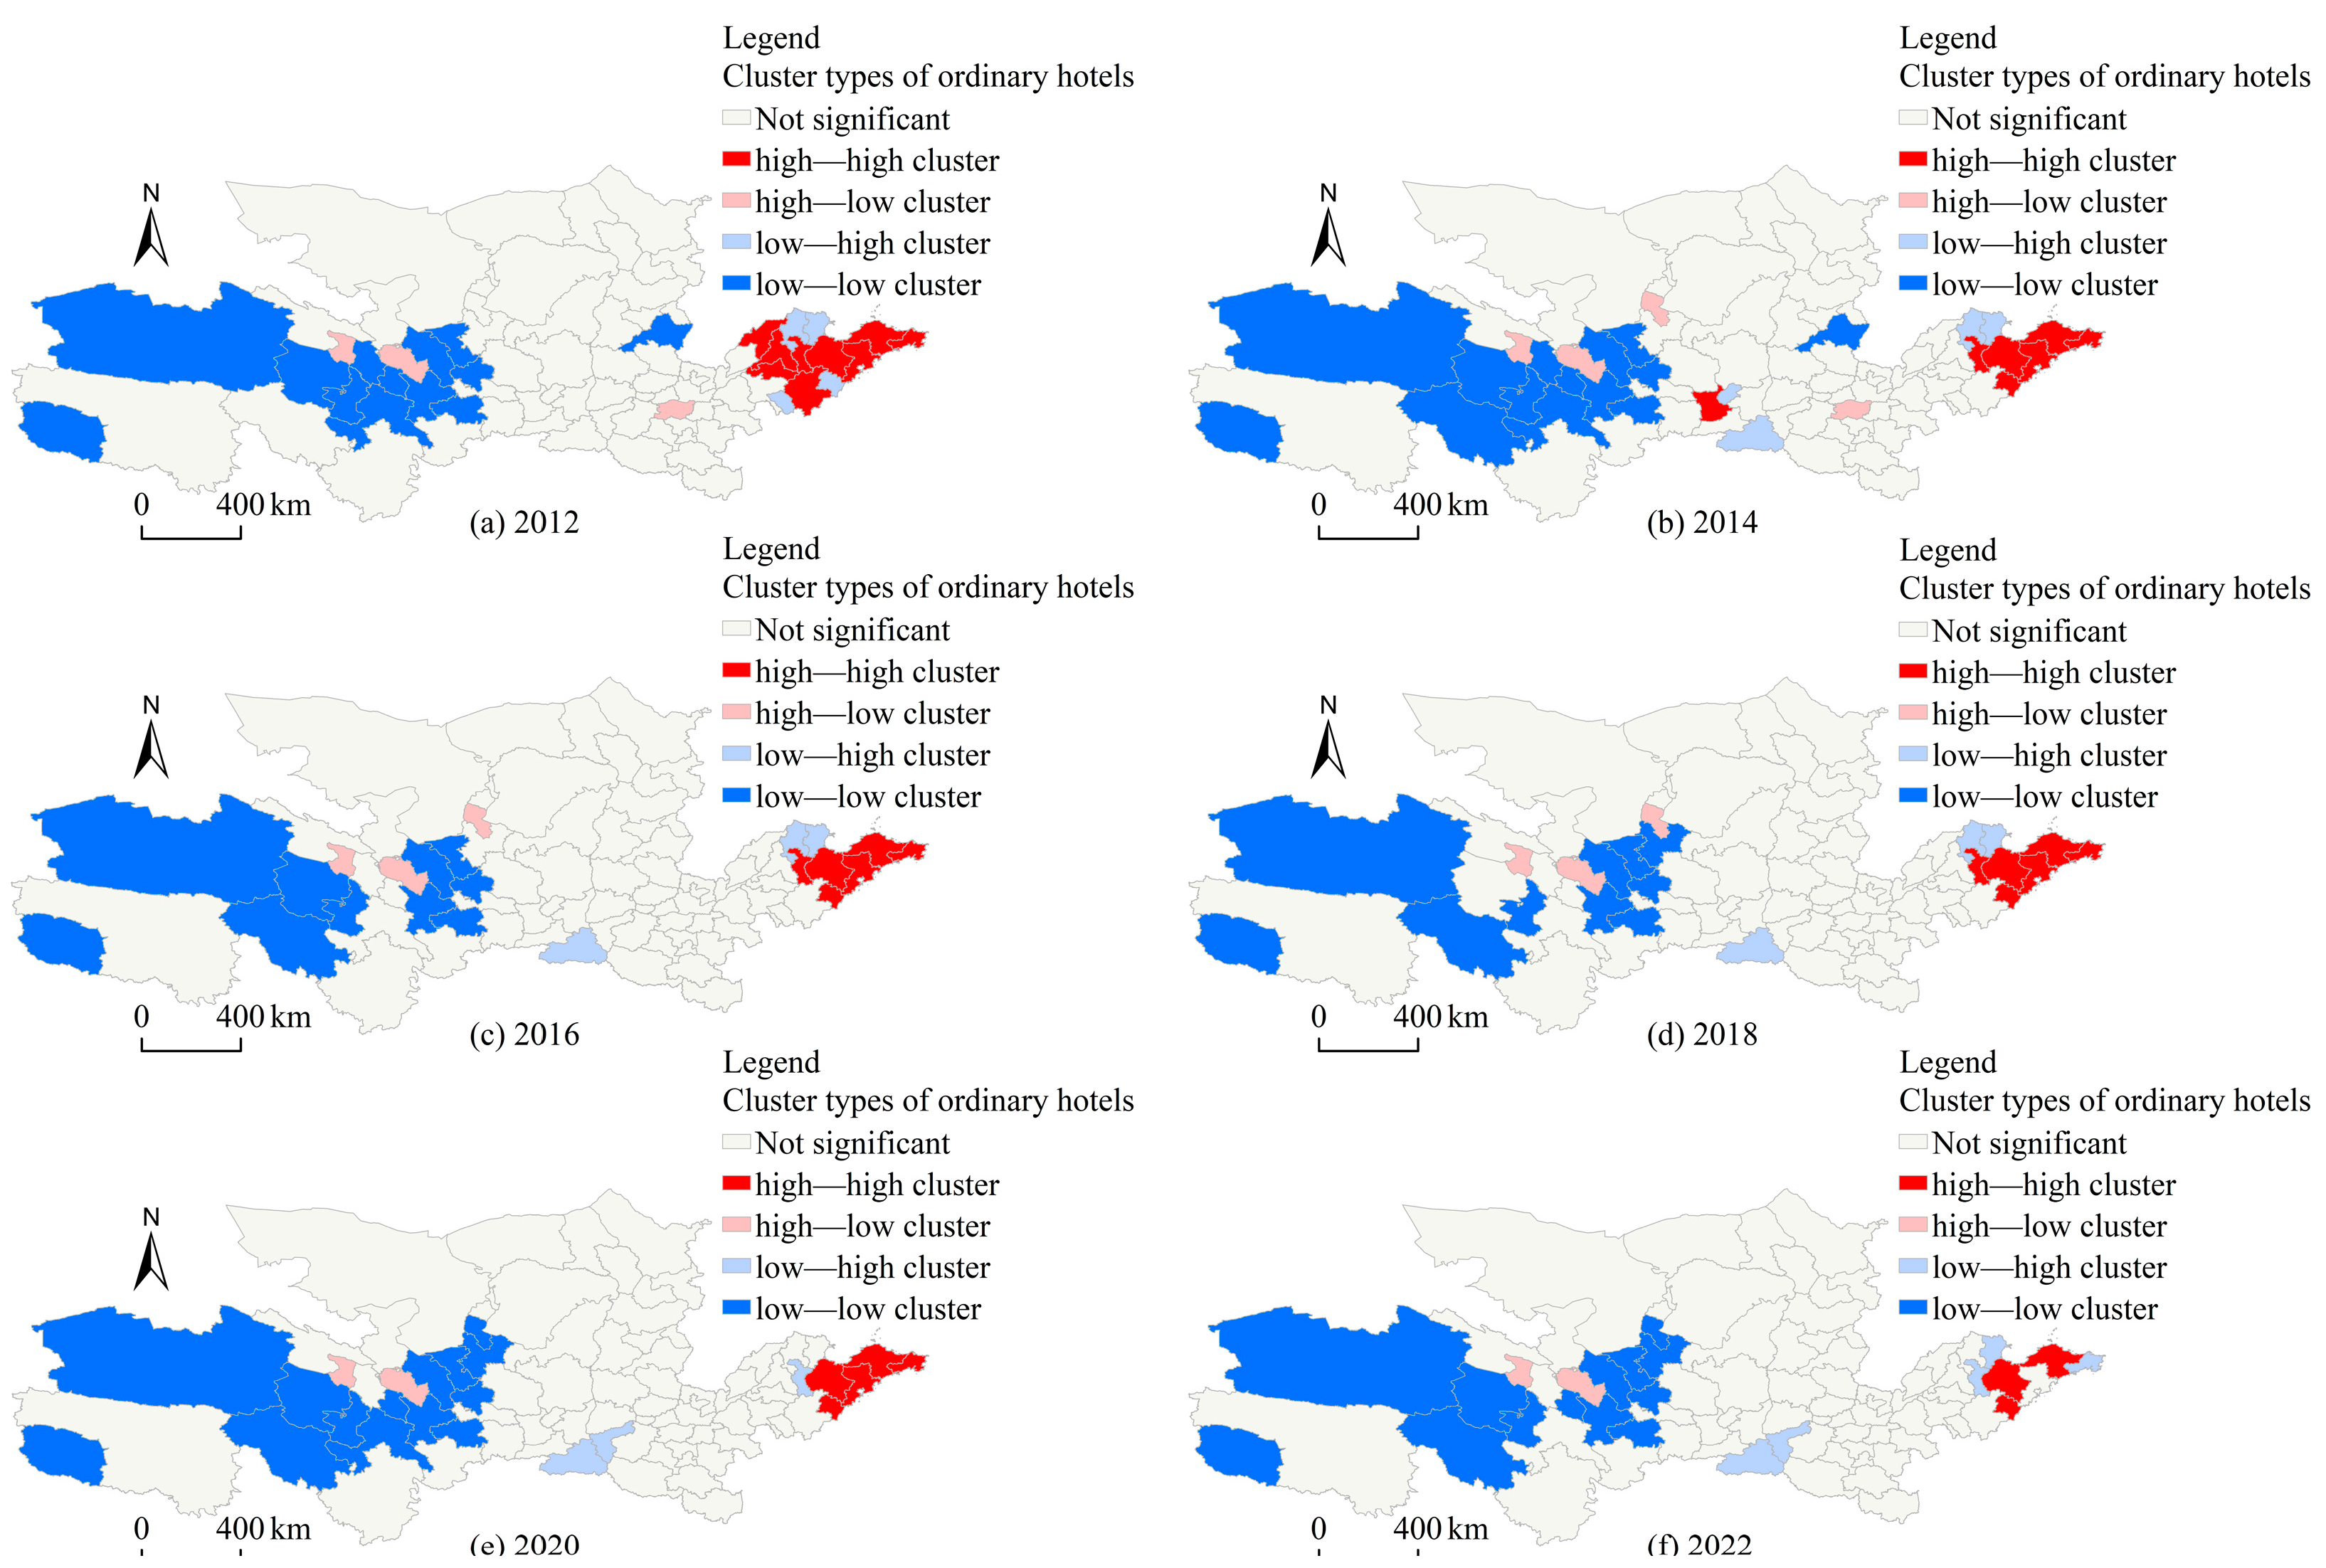
4.2.1. Analysis on the Difference of LISA Spatial Agglomeration
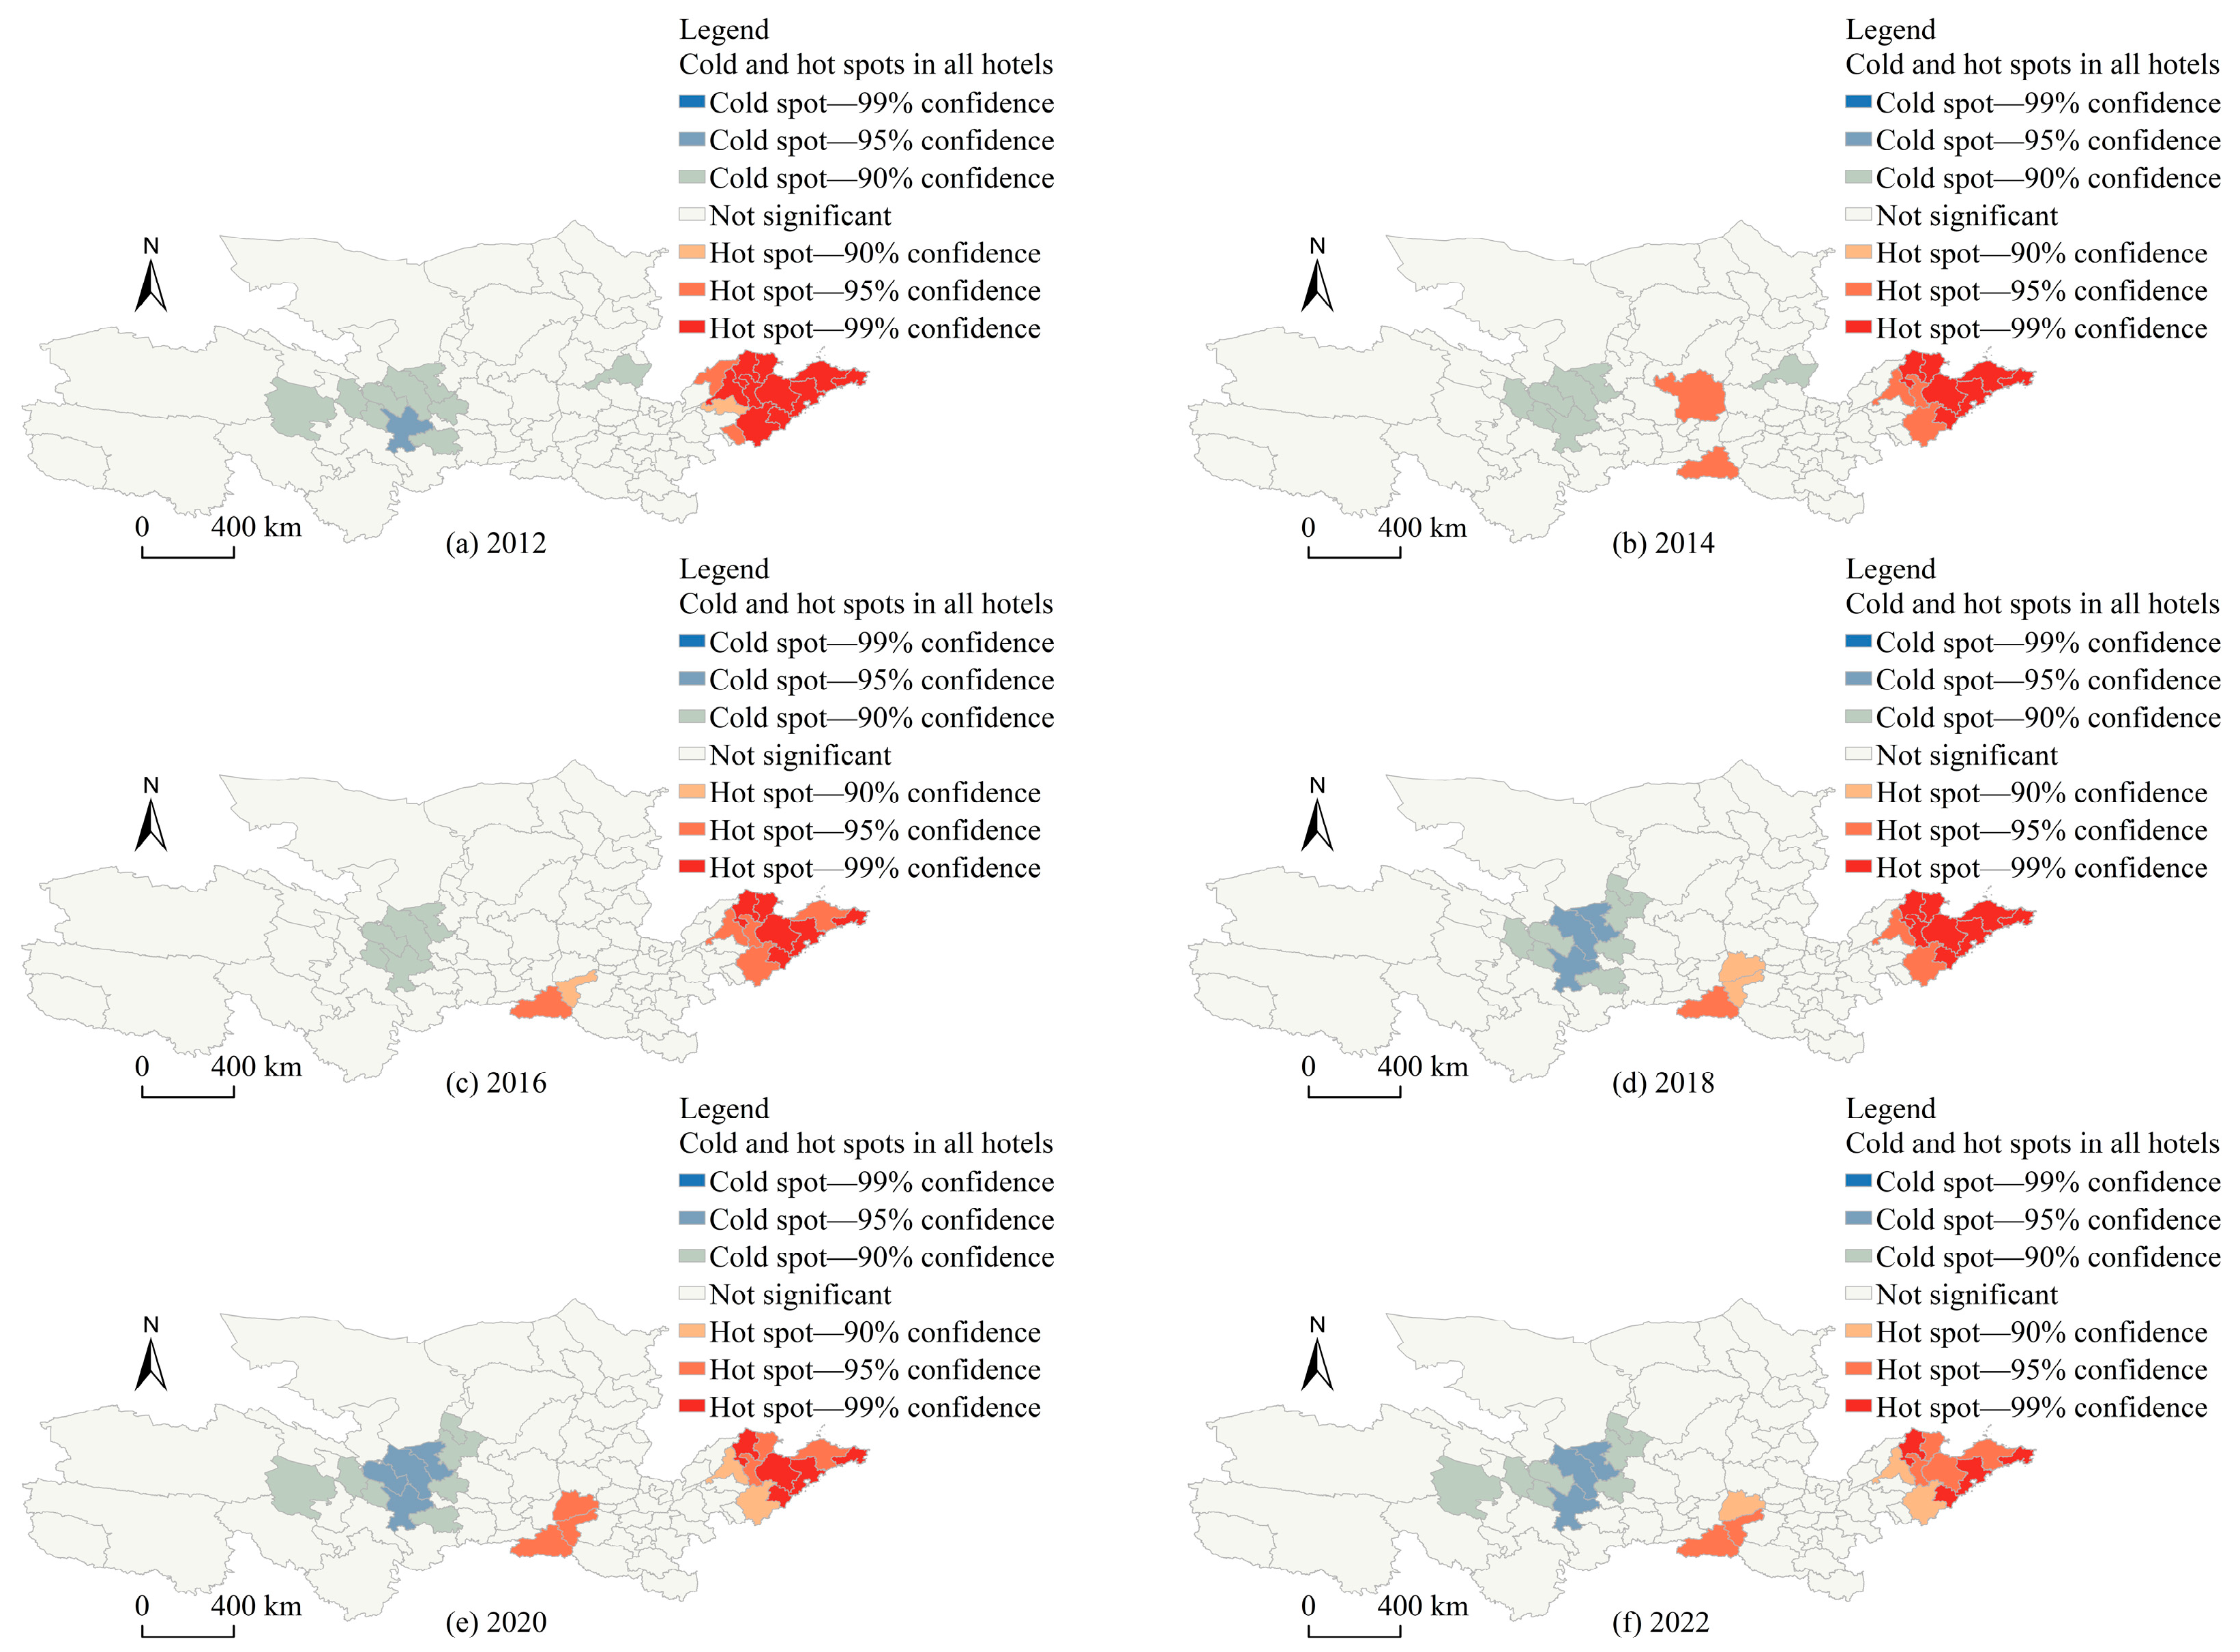
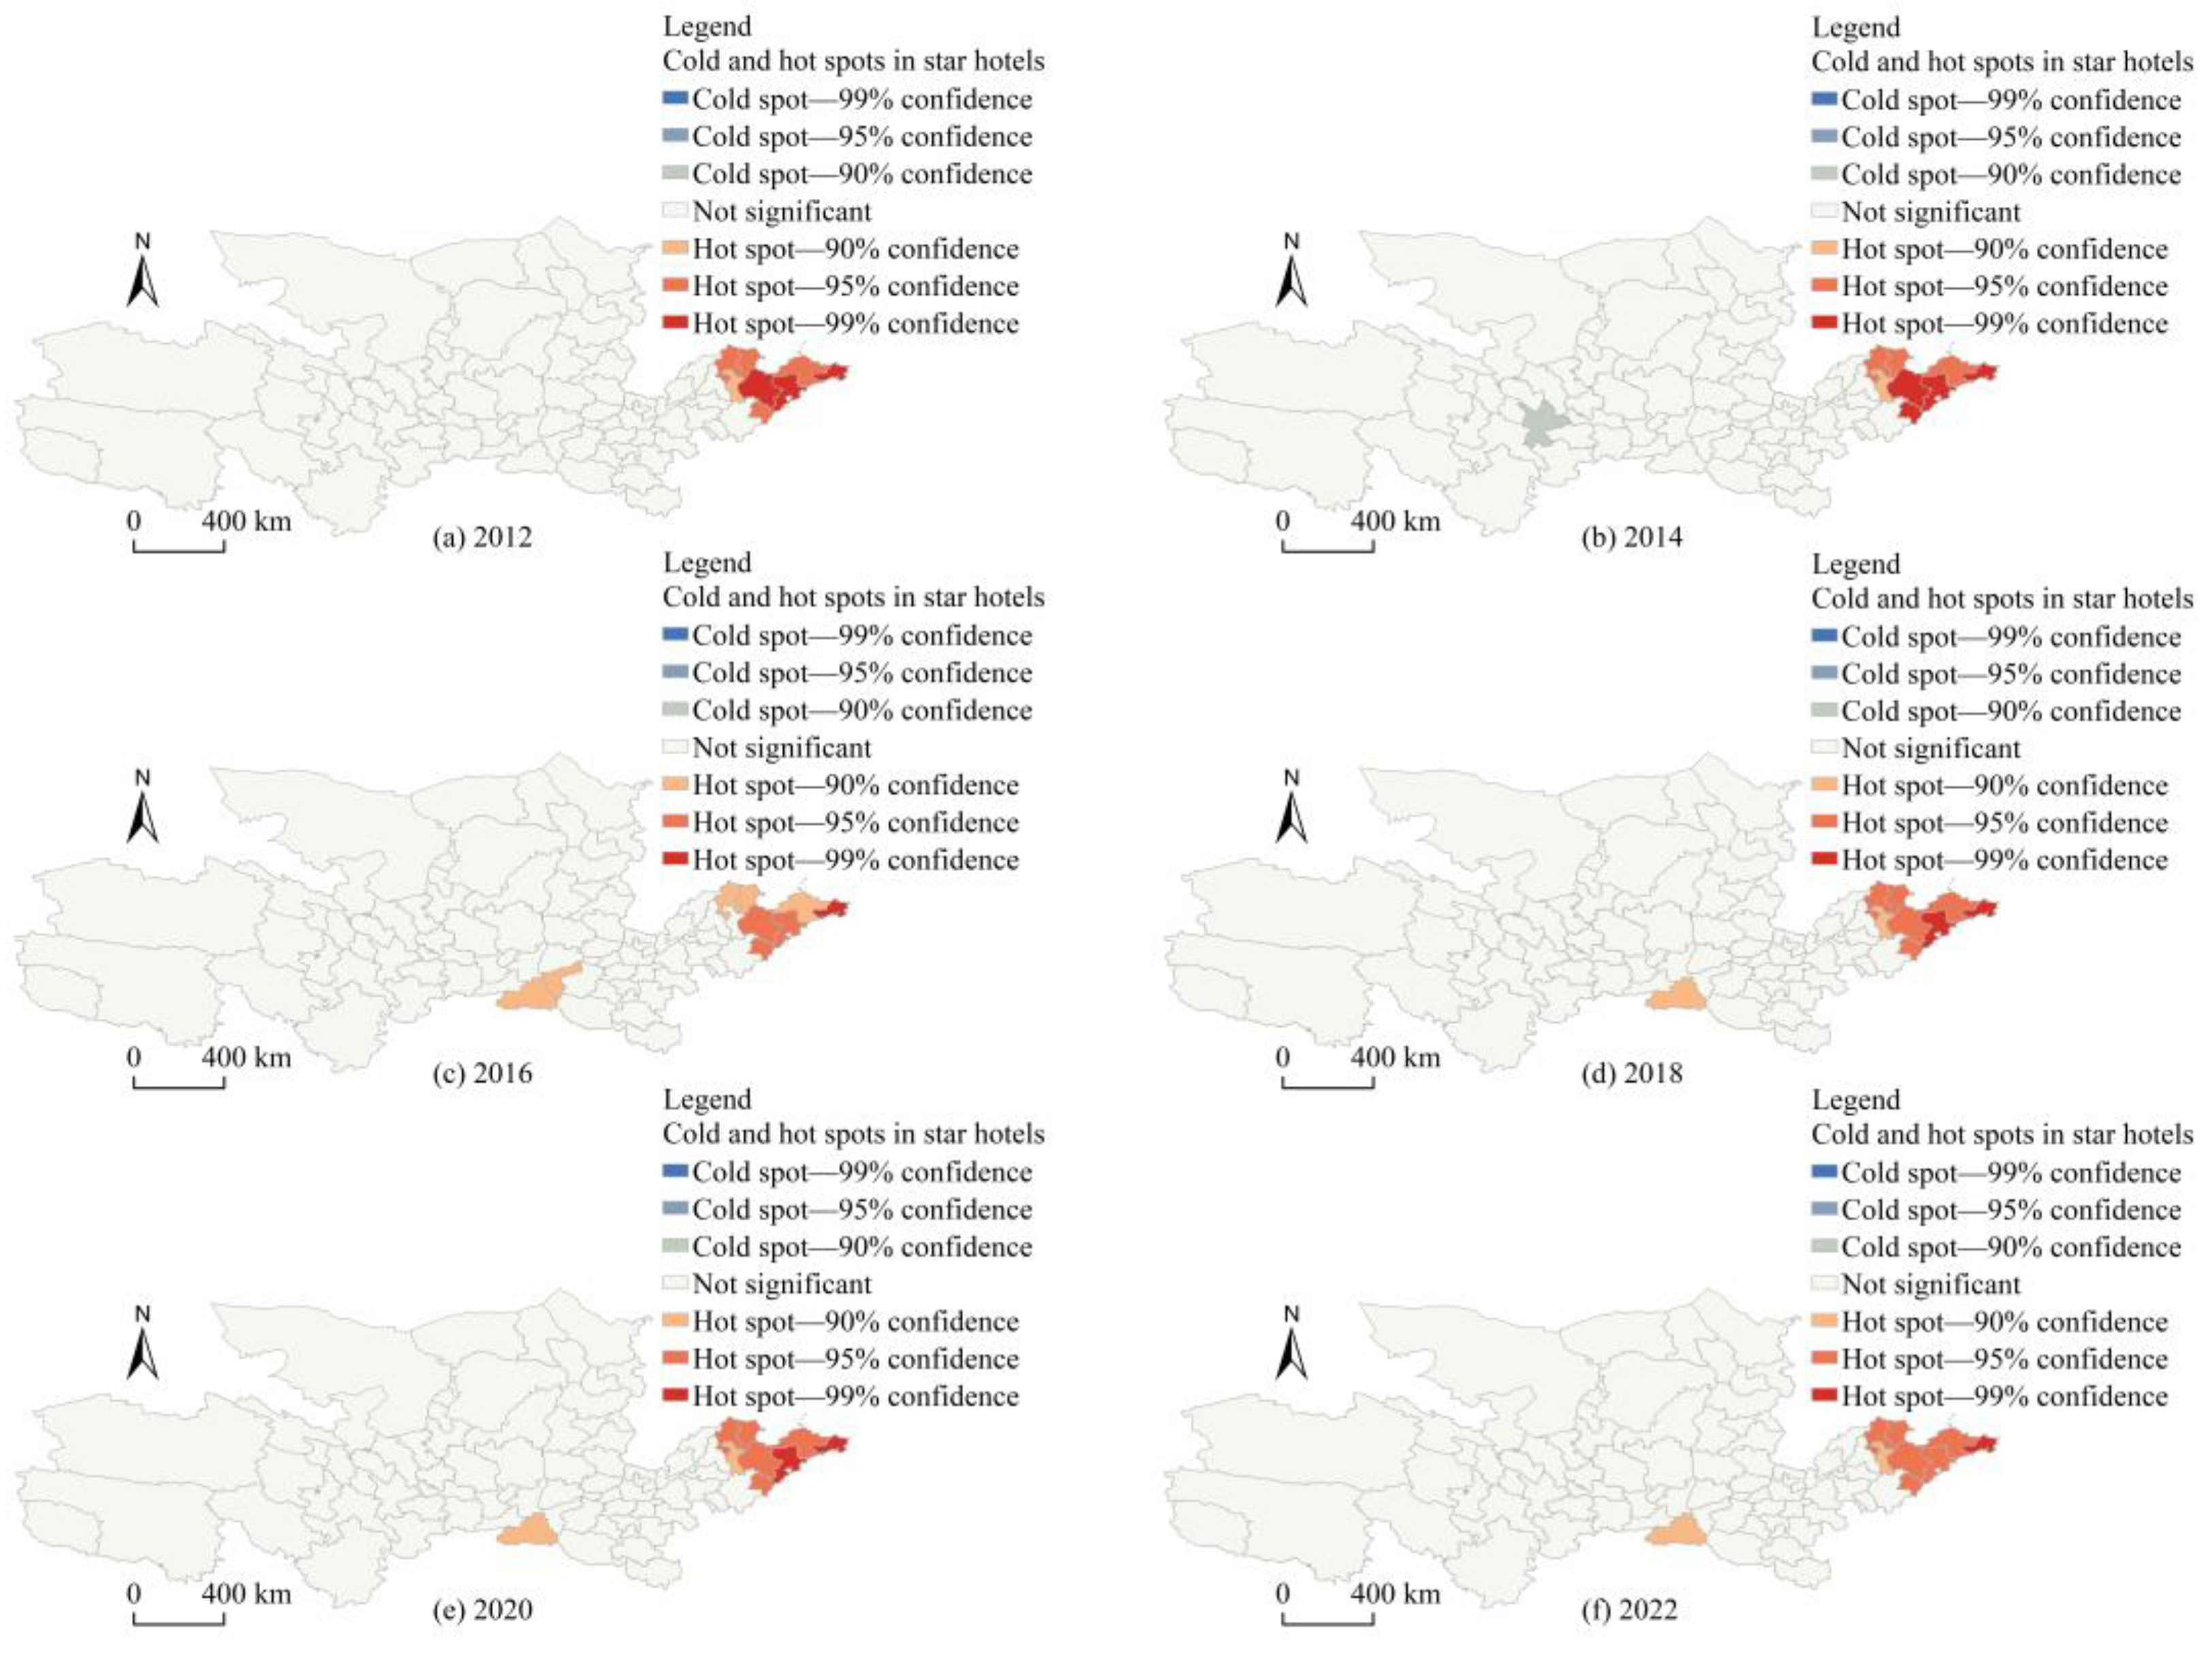
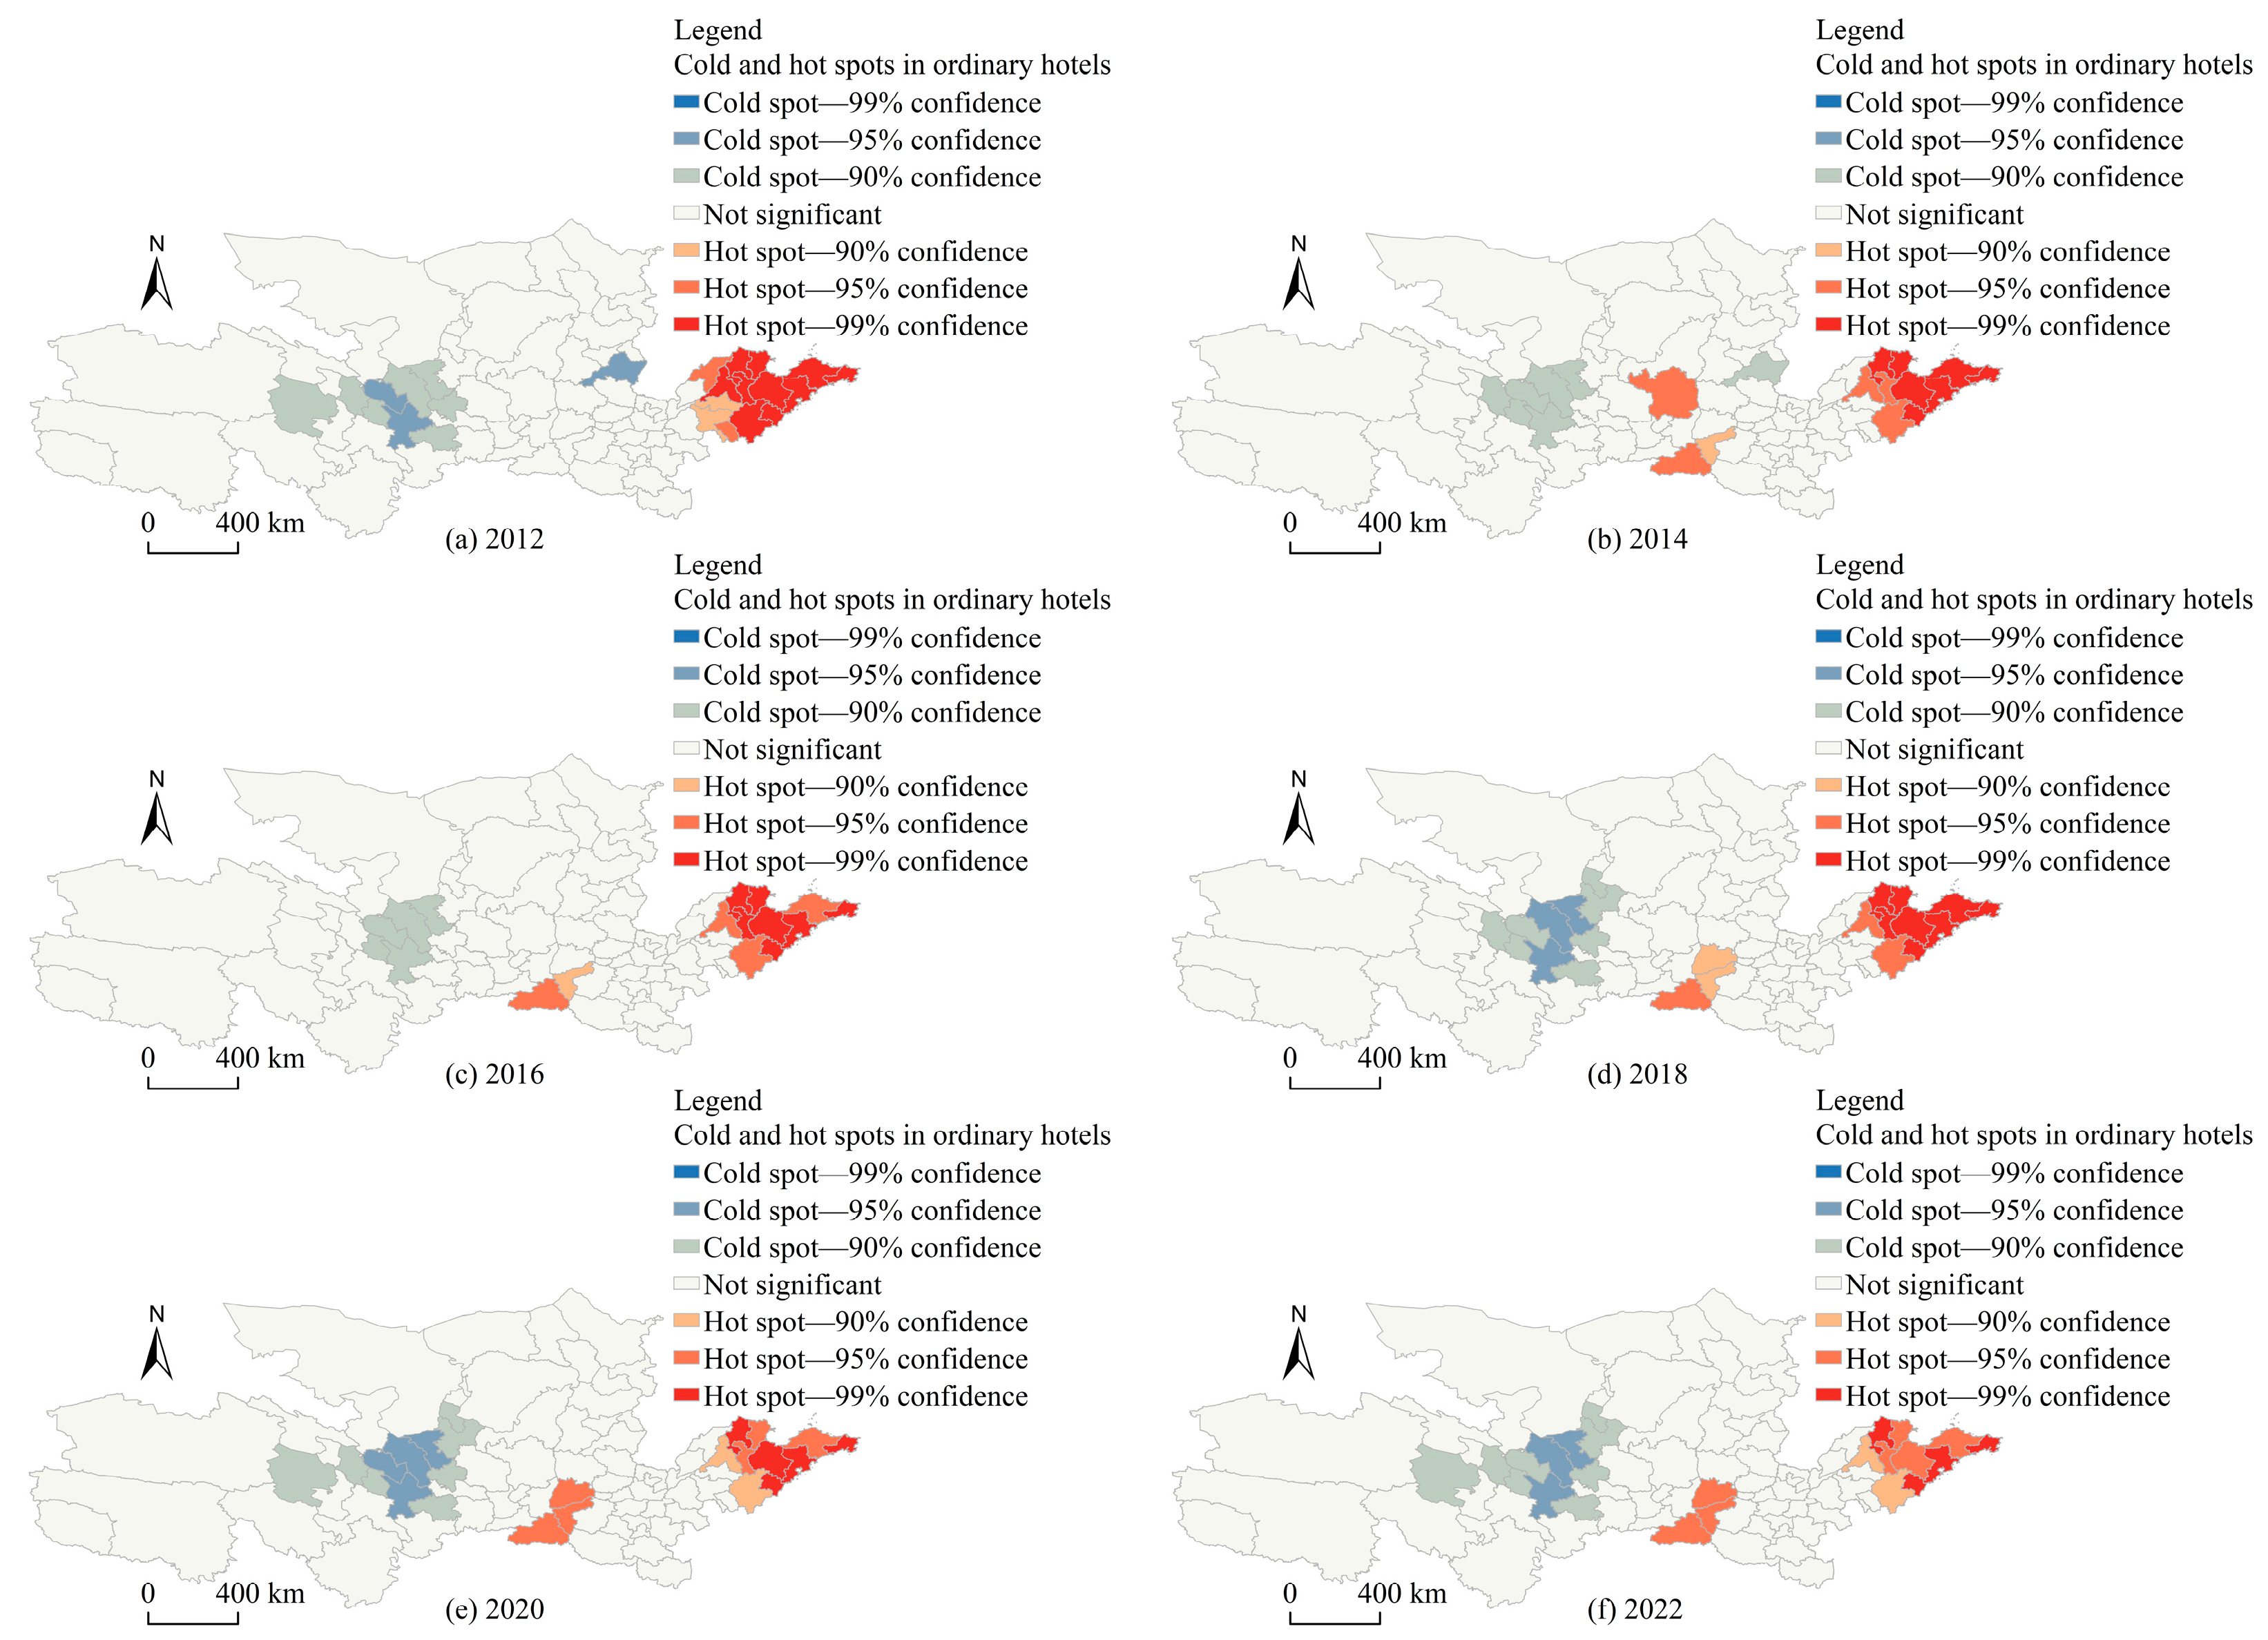
4.2.2. Cold and Hot Spot Analysis
4.3. Bivariate Spatial Correlation Analysis
4.3.1. Bivariate Global Spatial Autocorrelation Analysis
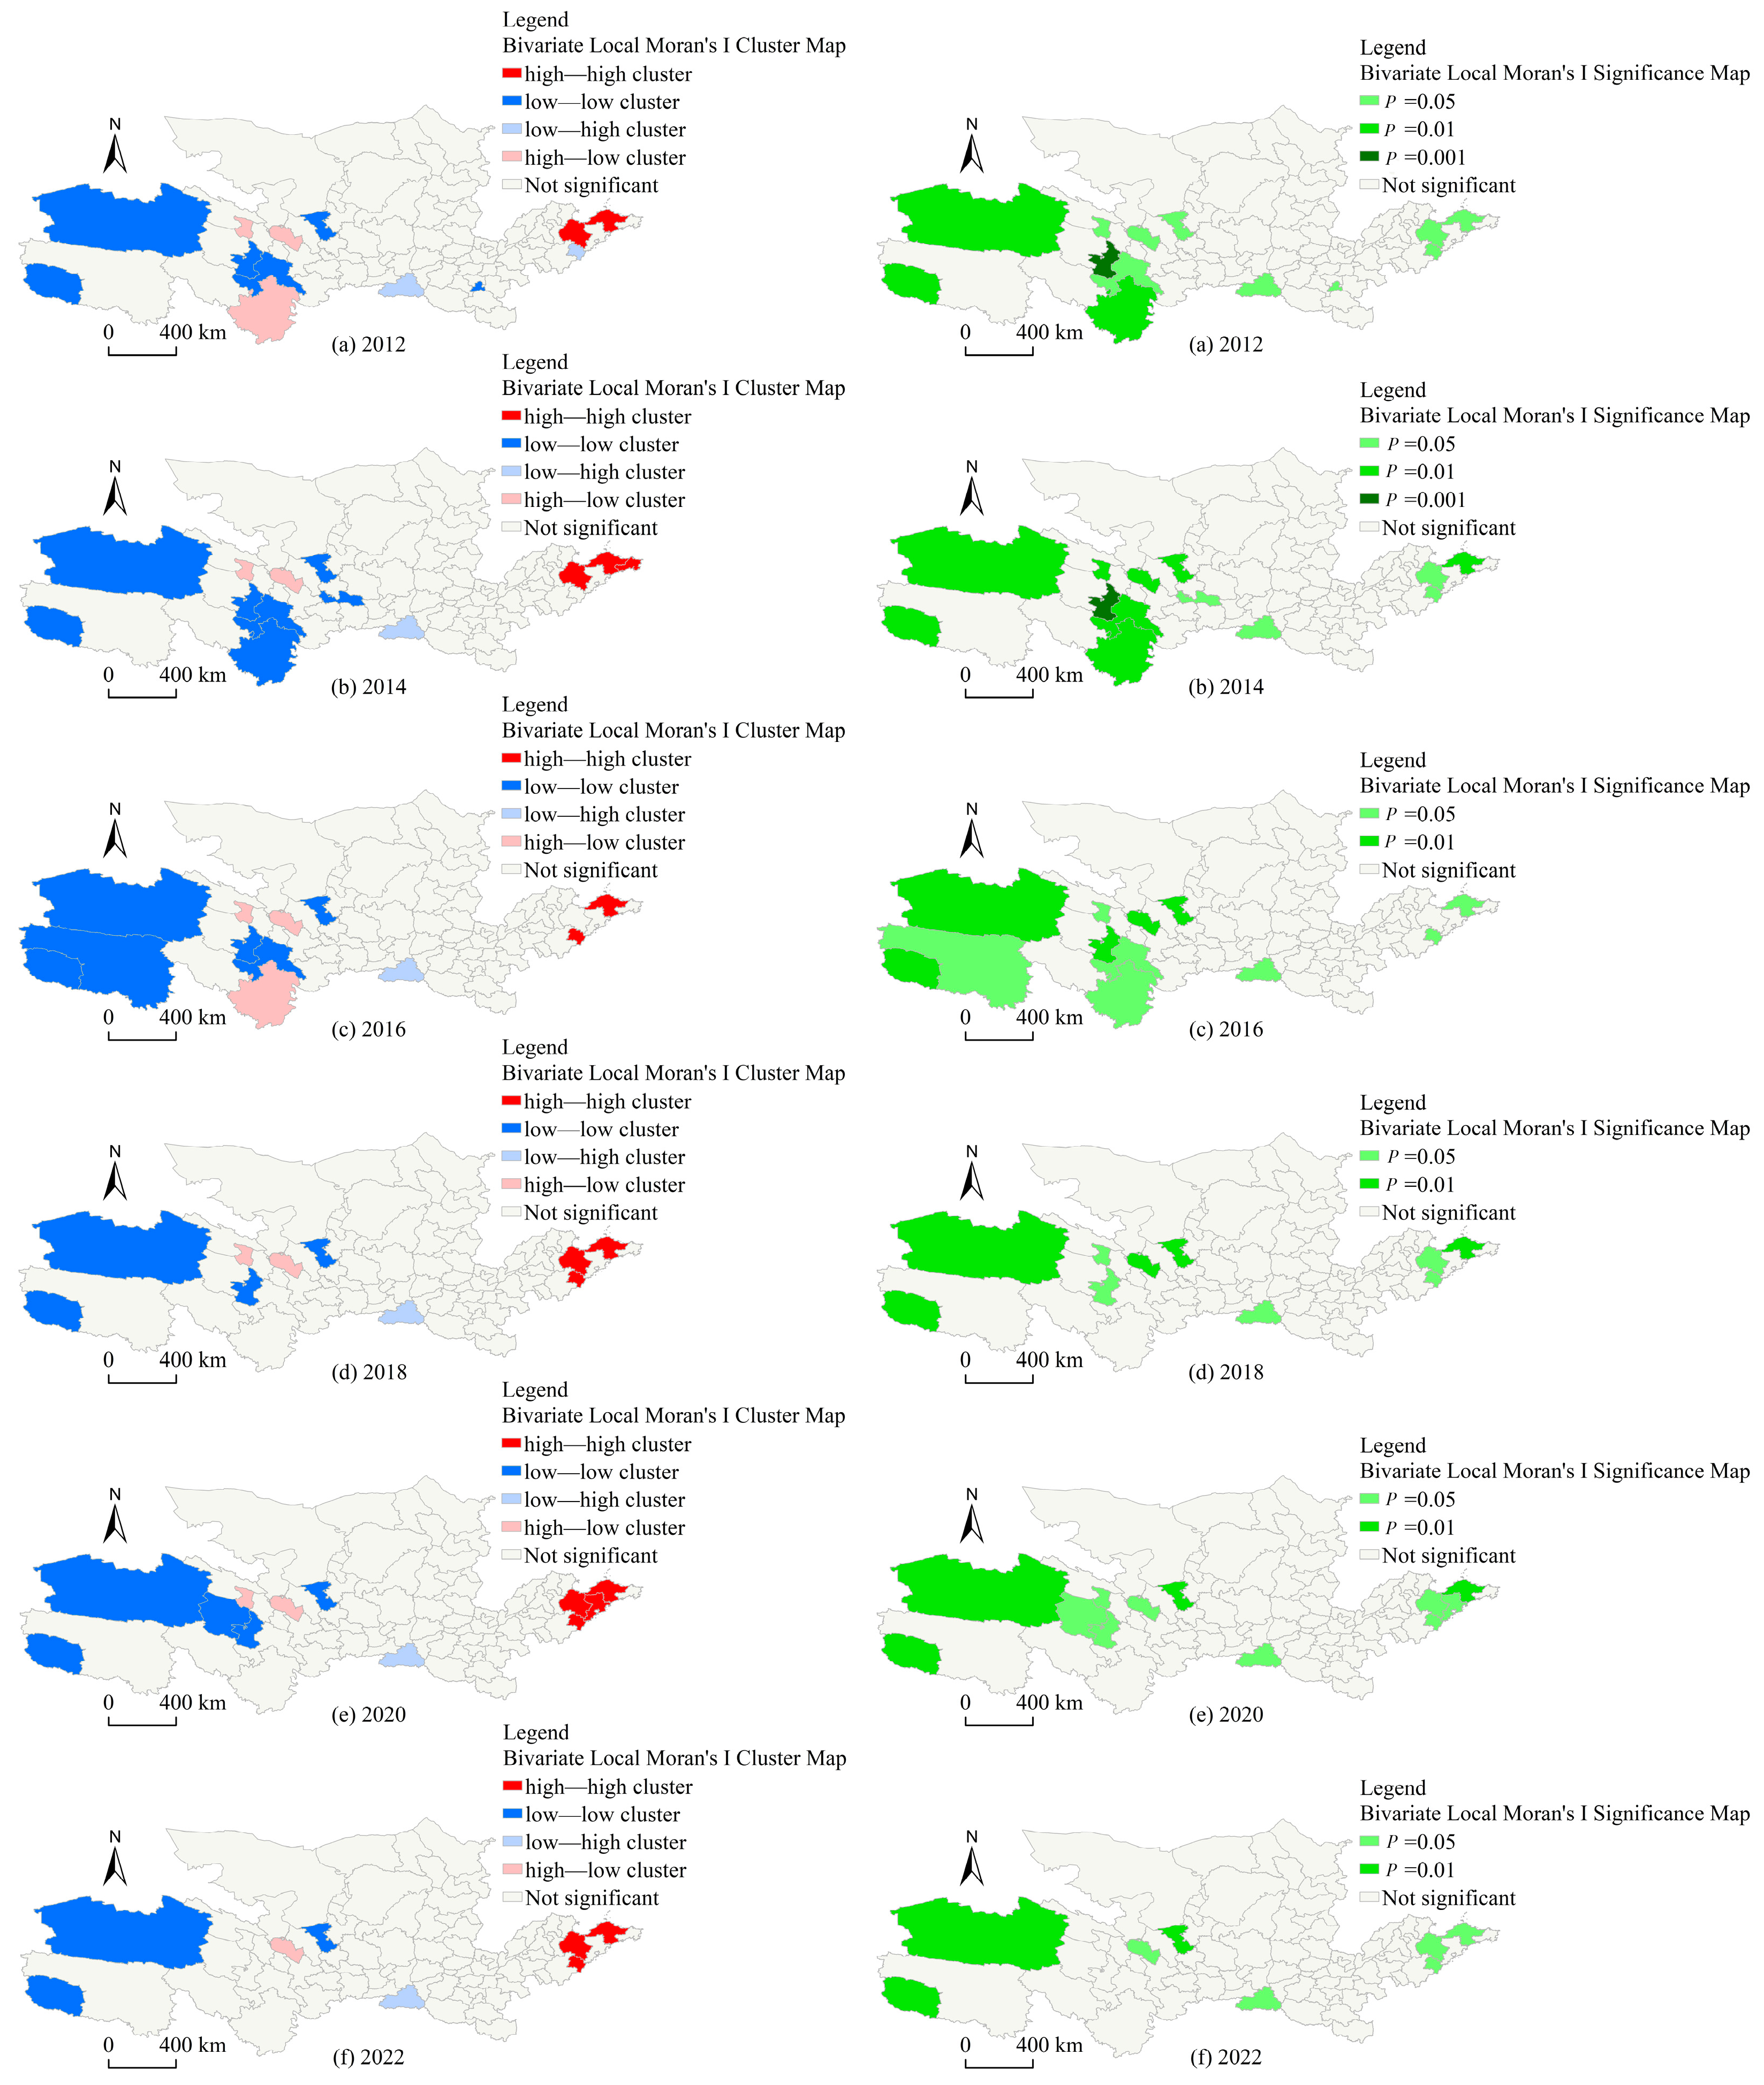
4.3.2. Bivariate Local Spatial Autocorrelation Analysis
5. Quantitative Analysis of Influencing Factors of Hotel Industry
5.1. Construction of Influencing Factor Indicator System
5.2. Comparison of Driving Forces of Influencing Factors
5.3. Correlation of Influencing Factors
- Structural force factors. The hotel industry is composed of various types of hotels, and it cooperatively develops and improves the urban service industry chain. In order to meet the needs of different consumer groups, the hotel industry has developed a variety of service products, thus gradually forming different types of hotels [62]. The development of all kinds of hotels in the hotel industry in the Yellow River basin is significantly and positively driven by indicator factors.
- The correlation strength of the influencing factors on the three dependent variables is different. On the whole, the intensity level of the influence factors on the total number of hotels and the number of ordinary hotels is similar, but compared with star hotels, the correlation intensity is significantly different; for the same factors, the development of different types of hotels is affected differently. For example, population density (x8) has a moderate correlation with ordinary hotels (0.470), but a weak correlation with star hotels (0.369).
- In the process of rapid development of the hotel industry, the correlation coefficient between the number of ordinary hotels and the number of star hotels is 0.813, indicating that there is a strong correlation between the dynamic changes of the numbers, indicating that there is a promotion relationship between the development of different types of hotels. All figures and tables should be cited in the main text as Figure 1, Table 1, etc.
6. Discussion
- Structural force factors. The hotel industry is composed of various types of hotels, and it cooperatively develops and improves the urban service industry chain. In order to meet the needs of different consumer groups, the hotel industry has developed a variety of service products, thus gradually forming different types of hotels [62].
- Macro factors. The relatively high GDP level of the city indicates that the industrial development environment is good, and business activities are frequent. Foreign businessmen provide a stable consumer group for the development of the hotel industry. Fixed asset investment can improve the production and service capacity of the city and provide basic means of production for the development of the hotel industry. Tourism revenue is an important source of regional economic growth [63]. Affected directly by the number of inbound tourists, the increasing in the number of tourists forces the scale of the hotel industry to continue to expanding.
- Ecological factors. The hotel industry is an important supporting industry for the construction of national scenic spots, which are also the most popular tourist destinations. The number of national scenic spots owned by the region represents the main competitiveness of the regional tourism industry, and is the key factor to attract tourists, thus driving the development of the hotel industry. The annual average concentration of PM 2.5 reflects the urban ecological environment and is an important consideration factor for attracting foreign people to live or travel temporarily.
- Internal dynamic factors. Population is the main service body of the hotel industry. The increase of population density provides the possibility for the hotel industry to expand market space and create market opportunities. The higher the urban population density, the greater the market demand capacity of the hotel industry. GDP per capita reflects the purchasing power of regional residents, which can effectively build the supply-demand relationship of “consumer-hotel industry” and is the internal driving force for the development of regional hotel industry.
- Consumption power factor. The proportion of the gross output value of the tertiary industry represents the overall scale expansion of the regional service industry. The reception provided by the hotel industry is the key link for various entities to carry out official business, business, tourism, and other service activities. The retail sales of social consumer goods reflect the material input of local residents in their daily life, as well as the cost of some companies, enterprises and social organizations to hold commercial and social activities. The larger the total amount, the faster the circulation of goods in the region, and the market demand for high-quality reception services.
- Intermediary factors. The passenger traffic volume and road density respectively reflect the regional traffic capacity and the improvement level of road facilities. This provides convenient transportation for people to go out and carry out life and entertainment activities, and also provides intermediary conditions for consumers to go to hotels.
- External power factor. The cross-regional tourism consumption of tourists involves clothing, food, accommodation and transportation. The accommodation services provided by the hotel industry can meet the short-term accommodation needs of foreign tourists [64], which is also an important reason why the development of the hotel industry in various cities is driven by tourism. The amount of foreign capital actually utilized can reflect the regional investment environment, as a catalyst for regional economic development, accelerate economic growth and promote the development of the hotel industry.
- Under the governmental leadership, industries can optimize the allocation of resources in the accommodation industry in combination with major regional development strategies and undertake the upper planning. The development of the accommodation industry reflects the image and function of the city. It should be closely combined with the ecological protection and high-quality development strategy of the Yellow River basin, the construction project of the Yellow River Cultural Park, and the regional tourism development plan. It should integrate the scale, quantity, service quality, spatial layout, and urban functions, and actively integrate into the “one blueprint” of the land and space planning, and make reasonable planning, make all types of hotels in the accommodation industry develop harmoniously within the regional space.
- Under the governmental leadership, the number of different types of hotels should be reasonably allocated, the product menu should be optimized for consumers, the needs of different consumer groups should be met, and the reception services such as tourism, business and trade should be carried out well to avoid homogeneous competition. The spatial layout of the future planning and construction of the accommodation industry in the Yellow River basin should adhere to the principle of “market-oriented and people-oriented” in terms of location selection, capital investment, land use index division, infrastructure and supporting facilities construction, fully consider market demand, standardize market prices, improve service levels, and avoid resource waste caused by homogeneous competition within the region.
7. Conclusions
- The scale of the hotel industry in the Yellow River Basin is undergoing continuous and dynamic changes, and there are significant differences in the comparison between the upstream, midstream, and downstream areas. From 2012 to 2022, the scale of the hotel industry in various cities in the Yellow River Basin expanded year by year, and the total number achieved rapid growth since 2016. The number and scale of hotels in prefecture-level cities were characterized by “more in the southeast and less in the northwest” in spatial distribution. The lower reaches of the Yellow River basin were mainly high value clusters of various types of hotels, the upper reach had mainly low clustering, and the middle reach were gradually becoming the clusters of central value regions. The uneven gap was gradually widening in the process of space-time evolution. However, there were differences in the number of different types of hotels. The space-time evolution characteristics of ordinary hotels were similar to those of the hotel industry, but the number of star hotels showed a trend of first increasing and then decreasing, and the numerical gap between prefecture-level cities is narrowing.
- The agglomeration degree of hotel industry and ordinary hotels among prefecture-level cities in the Yellow River Basin decreased year by year, and presented a random distribution in 2022, while the spatial agglomeration degree of star hotels always was a weak random distribution. During the dynamic development of the hotel industry, there were continuous hot spots and cold spots. The hot spots were mainly distributed in some prefecture-level cities with good social and economic development in Shandong Province, Henan Province and Sichuan Province, while the cold spots were mainly located in parts of Qinghai Province and Gansu Province in the west. In addition, the number of ordinary hotels and the number of star-rated hotels had a strong synergy in the local space.
- The total number of hotels, the number of ordinary hotels, and the number of star-rated hotels in cities across the Yellow River basin were positively driven by various factors and the degree of influence is different. On the whole, the development of the hotel industry was significantly affected by seven factors (structural force, macro force, ecological force, internal force, consumption force, intermediary force, and external force), and the forces acting on different types of hotels are different. These factors should be taken into account when chain hotels exist.
Author Contributions
Funding
Institutional Review Board Statement
Informed Consent Statement
Data Availability Statement
Acknowledgments
Conflicts of Interest
References
- Zhang, Q.; Zhang, Z.; Shi, P.; Singh, V.P.; Gu, X. Evaluation of ecological instream flow considering hydrological alterations in the Yellow River basin, China. Glob. Planet. Chang. 2018, 160, 61–74. [Google Scholar] [CrossRef]
- Wang, Y.; Wang, H.; Liu, G.; Zhang, J.; Fang, Z. Factors driving water yield ecosystem services in the Yellow River Economic Belt, China: Spatial heterogeneity and spatial spillover perspectives. J. Environ. Manag. 2022, 317, 115477. [Google Scholar] [CrossRef] [PubMed]
- Jiang, W.; Gao, W.; Gao, X.; Ma, M.; Zhou, M.; Du, K.; Ma, X. Spatio-temporal heterogeneity of air pollution and its key influencing factors in the Yellow River Economic Belt of China from 2014 to 2019. J. Environ. Manag. 2021, 296, 113172. [Google Scholar] [CrossRef] [PubMed]
- Zhang, H.; Wang, Q.; Huang, J. China’s policy for the marine engineering equipment industry and potential challenges: An appraisal of the new developments under the 14th five-year plans. Front. Mar. Sci. 2022, 9, 1014959. [Google Scholar] [CrossRef]
- Geng, W.; Li, Y.; Zhang, P.; Yang, D.; Jing, W.; Rong, T. Analyzing spatio-temporal changes and trade-offs/synergies among ecosystem services in the Yellow River Basin, China. Ecol. Indic. 2022, 138, 108825. [Google Scholar] [CrossRef]
- Chen, Y.; Miao, Q.; Zhou, Q. Spatiotemporal Differentiation and Driving Force Analysis of the High-Quality Development of Urban Agglomerations along the Yellow River Basin. Int. J. Environ. Res. Public Health 2022, 19, 2484. [Google Scholar] [CrossRef]
- Jiang, L.; Zuo, Q.; Ma, J.; Zhang, Z. Evaluation and prediction of the level of high-quality development: A case study of the Yellow River Basin, China. Ecol. Indic. 2021, 129, 107994. [Google Scholar] [CrossRef]
- Boto-García, D.; Mayor, M. Domestic tourism and the resilience of hotel demand. Ann. Tour. Res. 2022, 93, 103352. [Google Scholar] [CrossRef]
- Fam, K.-S.; Cheng, B.L.; Cham, T.-H.; Yi, M.T.C.; Ting, H. The Role of Cultural Differences in Customer Retention: Evidence from the High-Contact Service Industry. J. Hosp. Tour. Res. 2023, 47, 257–288. [Google Scholar] [CrossRef]
- Ye, X.; Fu, Y.-K.; Wang, H.; Zhou, J. Information asymmetry evaluation in hotel E-commerce market: Dynamics and pricing strategy under pandemic. Inf. Process. Manag. 2023, 60, 103117. [Google Scholar] [CrossRef]
- Fissi, S.; Romolini, A.; Gori, E. Building a business model for a new form of hospitality: The albergo diffuso. Int. J. Contemp. Hosp. Manag. 2020, 32, 307–323. [Google Scholar] [CrossRef]
- Woo, L.; Mun, S.G. Types of agglomeration effects and location choices of international hotels in an emerging market. Tour. Manag. 2019, 77, 104034. [Google Scholar] [CrossRef]
- Zhang, Z.; Ye, Q.; Law, R. Determinants of hotel room price: An exploration of travelers’ hierarchy of accommodation needs. Int. J. Contemp. Hosp. Manag. 2011, 23, 972–981. [Google Scholar] [CrossRef]
- Carter, D.; Mazumder, S.; Simkins, B.; Sisneros, E. The stock price reaction of the COVID-19 pandemic on the airline, hotel, and tourism industries. Financ. Res. Lett. 2022, 44, 102047. [Google Scholar] [CrossRef] [PubMed]
- Hao, F.; Xiao, Q.; Chon, K. COVID-19 and China’s Hotel Industry: Impacts, a Disaster Management Framework, and Post-Pandemic Agenda. Int. J. Hosp. Manag. 2020, 90, 102636. [Google Scholar] [CrossRef]
- Ozdemir, O.; Dogru, T.; Kizildag, M.; Mody, M.; Suess, C. Quantifying the economic impact of COVID-19 on the U.S. hotel industry: Examination of hotel segments and operational structures. Tour. Manag. Perspect. 2021, 39, 100864. [Google Scholar] [CrossRef] [PubMed]
- dos Santos, R.A.; Méxas, M.P.; Meiriño, M.J.; Sampaio, M.C.; Costa, H.G. Criteria for assessing a sustainable hotel business. J. Clean. Prod. 2020, 262, 121347. [Google Scholar] [CrossRef]
- Chen, B.; Pang, Y. Space Production and Scene Manifestation of the Yellow River National Cultural Park. Wuhan Univ. J. (Philos. Soc. Sci.) 2022, 75, 66–80. [Google Scholar] [CrossRef]
- Feng, Y.; Zhu, A.; Liu, P.; Liu, Z. Coupling and coordinated relationship of water utilization, industrial development and ecological welfare in the Yellow River Basin, China. J. Clean. Prod. 2022, 379, 134824. [Google Scholar] [CrossRef]
- Xia, J.; Liu, X.; Sun, D.; Li, C.; Wang, Z. Energy Consumption Connection of Industrial Sector Based on Industrial Link Theory: A Case Study of China. Front. Ecol. Evol. 2022, 10, 897574. [Google Scholar] [CrossRef]
- Giroux, M.; Franklin, D.; Kim, J.; Park, J.; Kwak, K. The Impact of Same versus Different Price Presentation on Travel Choice and the Moderating Role of Childhood Socioeconomic Status. J. Travel Res. 2022, 61, 674–695. [Google Scholar] [CrossRef]
- Butcher, K.; Chomvilailuk, R. Guest benefits of hedonic value and perceived community value drive hotel CSR participation. J. Sustain. Tour. 2021, 30, 1262–1279. [Google Scholar] [CrossRef]
- Roma, P.; Panniello, U.; Vasi, M.; Nigro, G.L. Sharing economy and dynamic pricing: Is the impact of Airbnb on the hotel industry time-dependent? J. Hosp. Tour. Manag. 2021, 49, 341–352. [Google Scholar] [CrossRef]
- Chen, Q.; Guan, X.; Huan, T.-C. The spatial agglomeration productivity premium of hotel and catering enterprises. Cities 2021, 112, 103113. [Google Scholar] [CrossRef]
- Destefanis, A.; Neirotti, P.; Paolucci, E.; Raguseo, E. The impact of Airbnb on the economic performance of independent hotels: An empirical investigation of the moderating effects. Curr. Issues Tour. Res. 2020, 25, 3534–3564. [Google Scholar] [CrossRef]
- Qin, J.; Qin, Y.; Liu, C. Location and regionalization patterns of hotel chains: Evidence from China. Tour. Geogr. 2021, 2, 1–19. [Google Scholar] [CrossRef]
- Qin, Y.; Qin, J.; Liu, C. Spatial-temporal evolution patterns of hotels in China: 1978–2018. Int. J. Contemp. Hosp. Manag. 2021, 33, 2194–2218. [Google Scholar]
- La, L.; Xu, F.; Hu, M.; Xiao, C. Location of Airbnb and hotels: The spatial distribution and relationships. Tour. Rev. 2021, 77, 209–224. [Google Scholar] [CrossRef]
- Zhang, D.; Tu, J.; Zhou, L.; Yu, Z. Higher tourism specialization, better hotel industry efficiency? Int. J. Hosp. Manag. 2020, 87, 102509. [Google Scholar] [CrossRef]
- Zhao, H.; Gu, T.; Yue, L.; Xu, X. Locational Dynamics of Luxury Hotels in Shanghai Metropolis, China: A Spatial-Temporal Perspective. Land 2022, 11, 1690. [Google Scholar] [CrossRef]
- Vivel-Búa, M.; Lado-Sestayo, R. Contagion Effect on Business Failure: A Spatial Analysis of the Hotel Sector. J. Hosp. Tour. Res. 2023, 47, 482–502. [Google Scholar] [CrossRef]
- Lado-Sestayo, R.; Vivel-Búa, M.; Otero-González, L. Connection between hotel location and profitability drivers: An analysis of location-specific effects. Curr. Issues Tour. 2020, 23, 452–469. [Google Scholar] [CrossRef]
- Valentin, M.; O’Neill, J.W. The Value of Location for Urban Hotels. Cornell Hosp. Q. 2019, 60, 5–24. [Google Scholar] [CrossRef]
- Maté-Sánchez-Val, M.; Teruel-Gutierrez, R. Evaluating the effects of hotel location on the adoption of green management strategies and hotel performance. J. Sustain. Tour. 2022, 30, 2029–2052. [Google Scholar] [CrossRef]
- Orhan, E. Locational attributes of the lodging industry: An empirical study on urban hotels in Ankara, Turkey. Land Use Policy 2023, 125, 106504. [Google Scholar] [CrossRef]
- Muisyo, P.K.; Su, Q.; Hashmi, H.B.A.; Ho, T.H.; Julius, M.M. The role of green HRM in driving hotels’ green creativity. Int. J. Contemp. Hosp. Manag. 2022, 34, 1352. [Google Scholar] [CrossRef]
- Yin, J.; Fang, S.; Cheng, Y. Is traditional marketing mix still suitable for hotel banquets? An empirical study of banquet marketing in five-star hotels. Front. Psychol. 2022, 13, 973904. [Google Scholar] [CrossRef]
- Moreno-Perdigón, M.C.; Guzmán-Pérez, B.; Mesa, T.R. Guest satisfaction in independent and affiliated to chain hotels. Int. J. Hosp. Manag. 2021, 94, 102812. [Google Scholar] [CrossRef]
- Farooq, R.; Zhang, Z.; Talwar, S.; Dhir, A. Do green human resource management and self-efficacy facilitate green creativity? A study of luxury hotels and resorts. J. Sustain. Tour. 2022, 30, 824–845. [Google Scholar] [CrossRef]
- Rehman, K.U.; Adnan, M.; Ahmad, N.; Scholz, M.; Khalique, M.; Naveed, R.T.; Han, H. Impact of Substantive Staging and Communicative Staging of Sustainable Servicescape on Behavioral Intentions of Hotel Customers through Overall Perceived Image: A Case of Boutique Hotels. Int. J. Environ. Res. Public Health 2021, 18, 9123. [Google Scholar] [CrossRef]
- Filimonau, V.; Matute, J.; Mika, M.; Kubal-Czerwińska, M.; Krzesiwo, K.; Pawłowska-Legwand, A. Predictors of patronage intentions towards ‘green’ hotels in an emerging tourism market. Int. J. Hosp. Manag. 2022, 103, 103221. [Google Scholar] [CrossRef]
- Fang, L.; Li, H.; Li, M. Does hotel location tell a true story? Evidence from geographically weighted regression analysis of hotels in Hong Kong. Tour. Manag. 2019, 72, 78–91. [Google Scholar] [CrossRef]
- Rahman, I.; Chen, H.; Reynolds, D. Evidence of green signaling in green hotels. Int. J. Hosp. Manag. 2020, 85, 102444. [Google Scholar] [CrossRef]
- Zhang, F.; Xiao, Q.; Lee, S. What drives cross-border acquisitions of hotel companies based in an emerging economy? A Study Chin. Hotel. Corp. 2021, 49, 481–493. [Google Scholar] [CrossRef]
- Magro, B.; Borg, S.P. A Feasibility Study on CHP Systems for Hotels in the Maltese Islands: A Comparative Analysis Based on Hotels’ Star Rating. Sustainability 2023, 15, 1337. [Google Scholar] [CrossRef]
- Zheng, W.; Gao, S.; Fang, B. How Does Public Transportation Influence Hotel Demand? Evidence From a Natural Experiment. Int. J. Hosp. Manag. 2022, 107, 103338. [Google Scholar] [CrossRef]
- Arzaghi, M.; Genc, I.H.; Naik, S. Clustering and hotel room prices in Dubai. Tour. Econ. 2023, 29, 116–136. [Google Scholar] [CrossRef]
- Deng, T.; Gan, C.; Hu, Y. Do hotel business benefit from increased tourist accessibility? Evidence from China’s high-speed railway program. Tour. Econ. 2021, 27, 1357–1374. [Google Scholar] [CrossRef]
- Park, S.; Yang, Y.; Wang, M. Travel distance and hotel service satisfaction: An inverted U-shaped relationship. Int. J. Hosp. Manag. 2019, 76, 261–270. [Google Scholar] [CrossRef]
- Lee, Y.; Kim, D.-Y. The decision tree for longer-stay hotel guest: The relationship between hotel booking determinants and geographical distance. Int. J. Contemp. Hosp. Manag. 2020, 33, 2264–2282. [Google Scholar] [CrossRef]
- Zhang, H.; Lu, J. Forecasting hotel room demand amid COVID-19. Tour. Econ. 2022, 28, 200–221. [Google Scholar] [CrossRef]
- Wang, L.-J.; Chen, M.-H.; Lu, L. Air quality effect on the hotel industry. Tour. Econ. 2022, 28, 942–950. [Google Scholar] [CrossRef]
- Park, J.; Yoo, J.L.; Yu, J. Effect of Hotel Air Quality Management on Guests’ Cognitive and Affective Images and Revisit Intentions. Int. J. Environ. Res. Public Health 2021, 18, 9346. [Google Scholar] [CrossRef]
- Chang, H.; Huh, C.; Legendre, T.S.; Simpson, J.J. Exploring particulate matter pollution in hotel guestrooms. Int. J. Contemp. Hosp. Manag. 2020, 32, 1131–1162. [Google Scholar] [CrossRef]
- Chen, M.-H.; Wei, H.; Wei, M.; Huang, H.; Su, C. Modeling a green supply chain in the hotel industry: An evolutionary game theory approach. Int. J. Hosp. Manag. 2021, 92, 102716. [Google Scholar] [CrossRef]
- Dhirasasna, N.; Sahin, O. A system dynamics model for renewable energy technology adoption of the hotel sector. Renew. Energy 2021, 163, 1994–2007. [Google Scholar] [CrossRef]
- Walheer, B.; Zhang, L.; Luo, Y. Bidirectional technological spillover in the Chinese star-rated hotel sector: An empirical investigation. Econ. Model. 2020, 86, 210–226. [Google Scholar] [CrossRef]
- Tosetto, E.G.; Bertrand, A.; Neumann-Leitão, S.; Júnior, M.N. The Amazon River plume, a barrier to animal dispersal in the Western Tropical Atlantic. Sci. Rep. 2022, 12, 537. [Google Scholar] [CrossRef]
- Hirwa, H.; Zhang, Q.; Li, F.; Qiao, Y.; Measho, S.; Muhirwa, F.; Xu, N.; Tian, C.; Cheng, H.; Chen, G.; et al. Water Accounting and Productivity Analysis to Improve Water Savings of Nile River Basin, East Africa: From Accountability to Sustainability. Agronomy 2022, 12, 818. [Google Scholar] [CrossRef]
- Krasovich, E.; Lau, P.; Tseng, J.; Longmate, J.; Bell, K.; Hsiang, S. Harmonized nitrogen and phosphorus concentrations in the Mississippi/Atchafalaya River Basin from 1980 to 2018. Sci. Data 2022, 9, 524. [Google Scholar] [CrossRef] [PubMed]
- Manton, M.; Makrickas, E.; Banaszuk, P.; Kołos, A.; Kamocki, A.; Grygoruk, M.; Stachowicz, M.; Jarašius, L.; Zableckis, N.; Sendžikaitė, J.; et al. Assessment and Spatial Planning for Peatland Conservation and Restoration: Europe’s Trans-Border Neman River Basin as a Case Study. Land 2021, 10, 174. [Google Scholar] [CrossRef]
- Hernández Mogollón, M.J.; Sampaio, C.A.F.; Ricardo, R.G. Price Strategy, Market Orientation, and Business Performance in the Hotel Industry. J. Glob. Inf. Manag. (JGIM) 2021, 29, 85–102. [Google Scholar] [CrossRef]
- Zheng, W.; Ji, H.; Lin, C.; Wang, W.; Yu, B. Using a heuristic approach to design personalized urban tourism itineraries with hotel selection. Tour. Manag. 2019, 76, 103956. [Google Scholar] [CrossRef]
- Nurmatov, R.; Lopez, X.L.F.; Millan, P.P.C. Tourism, hospitality, and DEA: Where do we come from and where do we go? Int. J. Hosp. Manag. 2021, 95, 102883. [Google Scholar] [CrossRef]


| Class | Year | Standard Deviation Ellipse | |||||
|---|---|---|---|---|---|---|---|
| Area/10,000 km2 | Gravity Center of Longitude (°E) | Gravity Center of Latitude (°N) | Major Axis Standard Deviation/km | Short Axis Standard Deviation/km | Azimuth Angle/(°) | ||
| Hotel industry | 2012 | 68.82 | 113.09 | 36.15 | 789.46 | 277.54 | 89.34 |
| 2014 | 64.55 | 112.69 | 36.00 | 755.17 | 272.12 | 88.93 | |
| 2016 | 65.98 | 112.51 | 35.97 | 764.77 | 274.66 | 88.54 | |
| 2018 | 65.69 | 112.71 | 35.93 | 766.49 | 272.83 | 88.49 | |
| 2020 | 64.32 | 112.76 | 35.85 | 751.44 | 272.48 | 88.02 | |
| 2022 | 63.41 | 112.71 | 35.81 | 744.59 | 271.11 | 88.03 | |
| Ordinary hotels | 2012 | 68.75 | 113.12 | 36.14 | 789.68 | 277.17 | 89.37 |
| 2014 | 64.23 | 112.69 | 35.99 | 754.07 | 271.17 | 88.92 | |
| 2016 | 65.90 | 112.52 | 35.96 | 764.76 | 274.32 | 88.54 | |
| 2018 | 65.51 | 112.73 | 35.93 | 765.27 | 272.54 | 88.50 | |
| 2020 | 64.12 | 112.77 | 35.85 | 750.12 | 272.13 | 88.00 | |
| 2022 | 63.20 | 112.73 | 35.81 | 743.26 | 270.70 | 88.00 | |
| Star hotels | 2012 | 69.63 | 112.61 | 36.21 | 782.87 | 283.17 | 88.70 |
| 2014 | 70.17 | 112.70 | 36.11 | 774.82 | 288.30 | 89.24 | |
| 2016 | 68.26 | 112.36 | 36.05 | 764.80 | 284.13 | 88.43 | |
| 2018 | 70.33 | 112.24 | 36.04 | 798.13 | 280.55 | 88.26 | |
| 2020 | 70.95 | 112.21 | 36.07 | 796.51 | 283.60 | 88.25 | |
| 2022 | 71.40 | 111.89 | 36.03 | 793.72 | 286.37 | 88.74 | |
| Class | Year | Moran’s I | Z | P | Distribution |
|---|---|---|---|---|---|
| Hotel industry | 2012 | 0.201177 | 4.819515 | 0.000001 | Clustering |
| 2014 | 0.101697 | 2.671360 | 0.007554 | Clustering | |
| 2016 | 0.062153 | 1.779940 | 0.075086 | Clustering | |
| 2018 | 0.086159 | 2.246331 | 0.024683 | Clustering | |
| 2020 | 0.060036 | 1.695751 | 0.089933 | Clustering | |
| 2022 | 0.046080 | 1.373458 | 0.169610 | Radom | |
| Ordinary hotel | 2012 | 0.218517 | 5.207433 | 0.000000 | Clustering |
| 2014 | 0.107996 | 2.816145 | 0.004860 | Clustering | |
| 2016 | 0.065797 | 1.865091 | 0.062169 | Clustering | |
| 2018 | 0.089881 | 2.329298 | 0.019843 | Clustering | |
| 2020 | 0.061583 | 1.732312 | 0.083218 | Clustering | |
| 2022 | 0.047504 | 1.407161 | 0.159380 | Radom | |
| Star hotel | 2012 | −0.007499 | 0.106322 | 0.915327 | Radom |
| 2014 | −0.005379 | 0.154740 | 0.877026 | Radom | |
| 2016 | −0.016586 | −0.109942 | 0.912456 | Radom | |
| 2018 | 0.007186 | 0.446737 | 0.655065 | Radom | |
| 2020 | 0.012920 | 0.577092 | 0.563877 | Radom | |
| 2022 | −0.009336 | 0.063035 | 0.949739 | Radom |
| Class | Year | Moran’s I | Z | P |
|---|---|---|---|---|
| Bivariate global Moran’s I | 2012 | 0.1397 | 2.3301 | 0.022 |
| 2014 | 0.1200 | 1.9889 | 0.035 | |
| 2016 | 0.1018 | 1.7137 | 0.057 | |
| 2018 | 0.1477 | 2.3578 | 0.022 | |
| 2020 | 0.1505 | 2.4071 | 0.019 | |
| 2022 | 0.1104 | 1.8124 | 0.046 |
| Factors | Variable Name | Variable Meaning | Unit |
|---|---|---|---|
| Number of All Hotels (Y) | Total Number of Urban Hotels | Number | |
| Structural force | Number of ordinary hotels (x1) | Number of urban general hotels | Number |
| Number of star hotels (x2) | Number of urban star hotels | Number | |
| Macroscopic force | GDP (x3) | The annual urban final output value of production activities of all permanent units | 100 million yuan |
| Total tourism revenue (x4) | The annual total revenue of urban tourism | 100 million yuan | |
| Total investment in fixed assets (x5) | The sum of money terms for the work and costs associated with the construction and acquisition of fixed assets | 100 million yuan | |
| Ecological force | The number of national scenic spots (x6) | The number of national scenic spots | Number |
| The annual mean concentration of PM 2.5 (x7) | Average daily PM 2.5 concentration of over a one-year period | Micrograms per cubic meter | |
| Internal power | Density of population (x8) | Ratio of total population to administrative area | Person/km2 |
| Per capita GDP (x9) | Per capita GDP by city for the year | 10 thousand yuan | |
| Consumption power | Total retail sales of consumer goods (x10) | The total amount of consumer goods sold directly to urban and rural residents and social groups in various sectors of the national economy | 100 million yuan |
| The number of students enrolled in colleges and universities (x11) | Total number of students in prefecture-level institutions of higher learning | 10 thousand people | |
| The proportion of tertiary industry (x12) | Proportion of output value of service industry in total output value | % | |
| Mediating force | Passenger traffic (x13) | The annual average number of passengers transported per kilometer by various modes of transport | |
| Road density (x14) | The ratio of the total road area in the city to the district area | - | |
| External power | Inbound tourist arrivals (x15) | The number of tourist visits in a year | 10 thousand people |
| Actual utilization of foreign capital (x16) | The funds that have been received and put into commercial operation in the investment projects of foreign commercial companies in prefecture cities | 10 thousand dollars |
| Index | x1 | x2 | x3 | x4 | x5 | x6 | x7 | x8 | x9 | x10 | x11 | x12 | x13 | x14 | x15 | x16 |
|---|---|---|---|---|---|---|---|---|---|---|---|---|---|---|---|---|
| x1 | 0.938 *** | |||||||||||||||
| x2 | 0.948 | 0.697 *** | ||||||||||||||
| x3 | 0.942 | 0.768 | 0.646 *** | |||||||||||||
| x4 | 0.942 | 0.758 | 0.736 | 0.637 *** | ||||||||||||
| x5 | 0.945 | 0.772 | 0.684 | 0.739 | 0.616 *** | |||||||||||
| x6 | 0.942 | 0.722 | 0.712 | 0.665 | 0.682 | 0.190 *** | ||||||||||
| x7 | 0.946 | 0.748 | 0.689 | 0.664 | 0.659 | 0.325 | 0.123 *** | |||||||||
| x8 | 0.945 | 0.747 | 0.694 | 0.710 | 0.658 | 0.452 | 0.396 | 0.235 *** | ||||||||
| x9 | 0.943 | 0.713 | 0.677 | 0.664 | 0.637 | 0.373 | 0.312 | 0.453 | 0.156 *** | |||||||
| x10 | 0.945 | 0.798 | 0.706 | 0.737 | 0.713 | 0.744 | 0.728 | 0.728 | 0.696 | 0.683 *** | ||||||
| x11 | 0.944 | 0.739 | 0.697 | 0.698 | 0.699 | 0.618 | 0.609 | 0.609 | 0.590 | 0.720 | 0.545 *** | |||||
| x12 | 0.943 | 0.722 | 0.681 | 0.657 | 0.672 | 0.294 | 0.354 | 0.515 | 0.391 | 0.700 | 0.572 | 0.099 *** | ||||
| x13 | 0.943 | 0.750 | 0.695 | 0.689 | 0.645 | 0.383 | 0.351 | 0.459 | 0.491 | 0.715 | 0.608 | 0.378 | 0.251 *** | |||
| x14 | 0.943 | 0.785 | 0.706 | 0.728 | 0.672 | 0.420 | 0.377 | 0.509 | 0.503 | 0.744 | 0.702 | 0.373 | 0.364 | 0.182 *** | ||
| x15 | 0.945 | 0.767 | 0.724 | 0.667 | 0.705 | 0.565 | 0.572 | 0.598 | 0.624 | 0.741 | 0.654 | 0.616 | 0.578 | 0.627 | 0.530 *** | |
| x16 | 0.942 | 0.718 | 0.671 | 0.676 | 0.643 | 0.472 | 0.520 | 0.523 | 0.474 | 0.721 | 0.613 | 0.509 | 0.548 | 0.621 | 0.642 | 0.411 *** |
| Variable | Total Number of Hotel Industry | Number of Ordinary Hotels | Number of Star Hotels | |||
|---|---|---|---|---|---|---|
| R1 | Strength Level | R2 | Strength Level | R3 | Strength Level | |
| x1 | 0.968 ** | Very strong correlation | — | — | — | — |
| x2 | 0.827 ** | Very strong correlation | 0.813 ** | Very strong correlation | — | — |
| x3 | 0.776 ** | strong correlation | 0.786 ** | strong correlation | 0.747 ** | strong correlation |
| x4 | 0.770 ** | strong correlation | 0.768 ** | strong correlation | 0.751 ** | strong correlation |
| x5 | 0.757 ** | strong correlation | 0.750 ** | strong correlation | 0.684 ** | strong correlation |
| x6 | 0.430 ** | moderate degree correlation | 0.413 ** | moderate degree correlation | 0.523 ** | moderate degree correlation |
| x7 | 0.260 ** | weak correlation | 0.278 ** | weak correlation | 0.168 ** | weak correlation |
| x8 | 0.462 ** | moderate degree correlation | 0.470 ** | moderate degree correlation | 0.369 ** | weak correlation |
| x9 | 0.369 ** | weak correlation | 0.361 ** | weak correlation | 0.452 ** | moderate degree correlation |
| x10 | 0.793 ** | strong correlation | 0.795 ** | strong correlation | 0.711 ** | strong correlation |
| x11 | 0.737 ** | strong correlation | 0.734 ** | strong correlation | 0.734 ** | strong correlation |
| x12 | 0.307 ** | weak correlation | 0.299 ** | weak correlation | 0.386 ** | weak correlation |
| x13 | 0.484 ** | moderate degree correlation | 0.469 ** | moderate degree correlation | 0.397 ** | moderate degree correlation |
| x14 | 0.424 ** | moderate degree correlation | 0.421 ** | moderate degree correlation | 0.255 ** | weak correlation |
| x15 | 0.707 ** | strong correlation | 0.708 ** | strong correlation | 0.651 ** | strong correlation |
| x16 | 0.604 ** | strong correlation | 0.597 ** | moderate degree correlation | 0.584 ** | moderate degree correlation |
| N | 420 | |||||
Disclaimer/Publisher’s Note: The statements, opinions and data contained in all publications are solely those of the individual author(s) and contributor(s) and not of MDPI and/or the editor(s). MDPI and/or the editor(s) disclaim responsibility for any injury to people or property resulting from any ideas, methods, instructions or products referred to in the content. |
© 2023 by the authors. Licensee MDPI, Basel, Switzerland. This article is an open access article distributed under the terms and conditions of the Creative Commons Attribution (CC BY) license (https://creativecommons.org/licenses/by/4.0/).
Share and Cite
Zhang, E.; Wang, Z.; Chen, G.; Wang, G.; Zhou, Y.; Hu, P.; Zhao, H. Spatial-Temporal Evolution Patterns and Influencing Factors of Hotels in Yellow River Basin from 2012 to 2022. Land 2023, 12, 770. https://doi.org/10.3390/land12040770
Zhang E, Wang Z, Chen G, Wang G, Zhou Y, Hu P, Zhao H. Spatial-Temporal Evolution Patterns and Influencing Factors of Hotels in Yellow River Basin from 2012 to 2022. Land. 2023; 12(4):770. https://doi.org/10.3390/land12040770
Chicago/Turabian StyleZhang, Ershen, Zhipeng Wang, Guojun Chen, Guoen Wang, Yajuan Zhou, Pengliang Hu, and Haijuan Zhao. 2023. "Spatial-Temporal Evolution Patterns and Influencing Factors of Hotels in Yellow River Basin from 2012 to 2022" Land 12, no. 4: 770. https://doi.org/10.3390/land12040770
APA StyleZhang, E., Wang, Z., Chen, G., Wang, G., Zhou, Y., Hu, P., & Zhao, H. (2023). Spatial-Temporal Evolution Patterns and Influencing Factors of Hotels in Yellow River Basin from 2012 to 2022. Land, 12(4), 770. https://doi.org/10.3390/land12040770