Article

Glacier Change and Its Response to Climate Change in Western China

1
State Key Laboratory of Resources and Environmental Information System, Institute of Geographic Sciences and Natural Resources Research, Chinese Academy of Sciences (CAS), Beijing 100101, China
2
University of Chinese Academy of Sciences, Beijing 100049, China
*
Author to whom correspondence should be addressed.
Land 2023, 12(3), 623; https://doi.org/10.3390/land12030623
Submission received: 15 January 2023 / Revised: 3 March 2023 / Accepted: 3 March 2023 / Published: 6 March 2023
(This article belongs to the Special Issue GIS and Glaciers Landscape: Past and Present)

Abstract

:
Given that glaciers are good indicators of climate change, it is of great scientific significance to study glacier change for regional environmental protection and water resource development and utilization. Using the Google Earth Engine (GEE) platform, we obtained the distribution of glaciers in western China in 2000, 2005, 2010, 2015, and 2020. Then, we analyzed the temporal and spatial evolutions of the glacier areas and their responses to climate change. The results showed that there were 52,384 glaciers in western China in 2020, with an area of 42,903.57 km2, among which those belonging to the headwater of the Tarim River are the largest, accounting for 35.25% of the total area. From 2000 to 2020, the glaciers indicated an overall trend of retreat, with the total area decreasing by 15,575.94 km2 at a change rate of 1.46%/a. From 2000 to 2010, glaciers in the southeast Qinghai-Tibet Plateau (QTP) and Qilian Mountains saw the fastest area loss (>4%/a), followed by the Tianshan Mountains (3.31%/a), while those in the Pamir-Karakoram-West Kunlun regions and the Qiangtang Plateau had the slowest loss. From 2010 to 2020, the glacier retreat rate exhibited an accelerating trend in southeast QTP and the western Himalayas, while it slowed down in the Tianshan Mountains. The change in glaciers was greatly attributed to the combination of snowfall and summer temperature trends. The glaciers in southeast QTP showed an accelerated retreat tendency, probably due to the accelerating snowfall decrease and continuous temperature rise. The decreasing temperature mitigated the loss of glacier area in the Pamir-Karakoram-West Kunlun regions with continuously decreasing snowfall.

1. Introduction

As an important component of the cryosphere, glaciers are known as natural recorders and sensitive indicators of climate change [1,2,3]. Glaciers play an important role in the replenishing and regulating of runoff, with a profound effect on landscape evolution [4] and the socioeconomic development of basins [5]. In addition, glaciers have positive effects on regulating regional climate and atmospheric circulation due to their high reflectivity of solar radiation and the latent heat created in their phase transition [1,6]. However, glaciers worldwide are experiencing enhanced ablation due to ongoing global warming [7]. Numerous mountains and plateaus are located in western China, especially on the Qinghai-Tibet Plateau (QTP), with an average altitude of more than 4000 m and special climate characteristics. These provide favorable conditions for forming glaciers, making China the country with the largest number of mountain glaciers in middle and low latitudes [8,9]. The Second Chinese Glacier Inventory showed that, from 1990 to 2015, there were 48,571 glaciers in China, with a total area of 5.18 × 10⁴ km2 and an ice volume of 4.3 × 10³–4.7 × 10³ km3, which have undergone pronounced shrinkage [1,10,11]. Huss and Hock [12] predicted that by 2100, under the scenarios of RCP2.6, RCP4.5, and RCP8.5, the areas of global glaciers will be reduced by 43%, 58%, and 74%, respectively, while those over the QTP and its surroundings will decrease by 36%, 49%, and 64%, respectively [13]. Glacier shrinkage has garnered widespread attention due to its negative effects. On the one hand, the melting of glaciers accelerates the fragmentation of the glacier surface, promotes the formation of numerous glacial lakes, and increases the risk of glacial lake outburst floods, glacier avalanches, mud–rock flows, and other disasters [7]. On the other hand, glacial meltwater would be reduced or even exhausted in the long term, posing a great threat to water resource security and the livelihood and well-being of residents in the downstream regions [12]. Therefore, monitoring glacier change and analyzing its driving factors is of great importance.
Commonly used indicators in the study of glacier change include number, area, ice volume, thickness, and mass balance. The dynamic changes in glacier quantity, area, length, and mass balance can be monitored via remote sensing [14]. The most common methods used to assess the storage and thickness of glaciers and their changes include the empirical formula method, model estimation, field measurement, etc. However, due to the difficulties of data acquisition [14], much of the research on glaciers focuses on monitoring the area of change and discussing its driving factors. For example, Tennant et al. [2] found that the variation in glacier change of the Columbia Icefield from 1919 to 2009 was influenced by diverse factors such as debris-covered termini, glacier size, elevation, etc. Tielidze et al. [15] conducted comparisons of glacier area changes of different slopes, aspects, and glacier size classes in the Greater Caucasus mountains from 1960 to 2014 and predicted that many glaciers in the eastern Greater Caucasus will disappear by 2100 if the current rate of retreat continues. Xu et al. [16] found that the glacier retreat rate changed from fast to slow in the Keleqing River basin of the Karakoram Mountains during 1978–2015 in relation to the increasing precipitation trend. Wang et al. [17] reported that the glaciers had shown an obvious accelerated retreat in the Tianshan Mountains since 1960, which can be primarily attributed to the increasing temperature and precipitation trends in the dry and wet seasons, respectively. A large number of assessments have also been carried out at various geographic scales, such as in the QTP and its surroundings [8,10,18], other river basins [16,19], and mountain areas [2,20,21]. However, most of these studies analyzed the effects of total precipitation on glacier change. Precipitation that falls to the surface of glaciers in the form of rainfall instead of snowfall is a negative influence on mass balance [22]. Additionally, more precipitation falls as rainfall because of global warming [23], which calls for a detailed assessment of snowfall’s influence on glacier changes.
Based on the Google Earth Engine (GEE) cloud platform, we obtained the distribution information of glaciers in western China every five years from 2000 to 2020 using the band ratio method, the manual revision method, and automatic thresholding algorithms. Then, we conducted an analysis of the spatiotemporal dynamics of glacier areas in different water resource zones in the last twenty years. Finally, the response of glacier change to climate change was examined in terms of the changing trends of the average temperature during the summer and the total annual snowfall. Our study is thus able to provide a scientific basis for the protection of the cryospheric ecological environment and the utilization and management of regional water resources in western China in order to mitigate climate change. The specific objectives are (i) to explore the characteristics of glacier change during different periods; (ii) to identify the spatial patterns of glacier area change in different water resource zones; and (iii) to discuss how the glacier change responds to climate change.

2. Materials and Methods

2.1. Study Area

The glaciers in western China are mainly distributed in Qinghai, Tibet, Xinjiang, Gansu, Sichuan, and Yunnan, with a total number of 48,571, an area of 51,766.08 km2, and an ice volume of about 4494.00 ± 175.93 km3 [1] (Figure 1). Glaciers are concentrated in 14 mountain ranges, including the Altai, Tianshan, Karakoram, Kunlun, Nyainqêntanglha, Himalayas, and Hengduan mountains. Of these, the Kunlun Mountains have the largest number, area, and ice volume of glaciers. These are followed by the Nyainqêntanglha Mountains, which have the second largest area and ice volume of glaciers [24], while the number of glaciers in the Tianshan Mountains ranks second, and the number of glaciers in the Himalayas and the Karakoram Mountains are both over 5000 [1]. The total number and area of glaciers in the above five mountain ranges account for 3/4 and 4/5 of the total in China, respectively. The huge heights of these mountains offer good accumulation space and hydrothermal conditions for glaciers. These glaciers serve as major water supplies for many large rivers, such as the Yangtze and Yellow Rivers, and they affect the water discharge of other prominent Asian rivers, such as the Indus [8,25].

2.2. Data Collection

2.2.1. Chinese Glacier Inventory Data

The second Chinese Glacier Inventory dataset (http://westdc.westgis.ac.cn, accessed on 2 March 2023) was released by the Cold and Arid Regions Environmental and Engineering Research Institute, Chinese Academy of Sciences in 2014, which was a systematic inventory of the status of glacier distribution in China from 2006 to 2011. The latest glacier cataloging data were obtained from the 2017–2018 Western China Glacier cataloging dataset [24]. We used these data as the basis for interpreting glacier boundaries and analyzing their changes.

2.2.2. Elevation Data

The elevation data used for glacier region masking and attribute extraction in this paper are from the SRTM DEM V4.0 dataset, which was jointly measured by the National Aeronautics and Space Administration (NASA) and the National Integrated Medical Association (NIMA), and were generated by the International Center for Tropical Agriculture (CIAT) using a new interpolation algorithm. The spatial resolution of the data is 90 m, and the elevation accuracy is 7–14 m, which is able to meet the analysis demands under complex mountain conditions.

2.2.3. Temperature, Precipitation, and Snowfall Data

Since there are a few meteorological stations in the high-altitude area of QTP, and the time series of recorded data are short, gridded climate products were used in this research, potentially introducing some unavoidable uncertainties. The air temperature and precipitation (including snowfall and rainfall) data of ERA5 proved to be advantageous compared with other data analyses [26,27,28]. Despite the ERA5 overestimation of snowfall reported by some studies, this product maintained good trend consistency with the meteorological data of the local stations [28,29]. The ERA5 data comprise the atmospheric reanalysis of the global climate produced by the European Centre for Medium-Range Weather Forecasts (ECMWF). ERA5-Land data is produced by replaying the land component of the ECMWF ERA5 climate reanalysis with a spatial resolution of 0.1° × 0.1°. Therefore, the monthly ERA5-Land record averages, by the hour of the day, were collected and calculated in GEE, encompassing the total precipitation, snowfall, and air temperature. Finally, we obtained the annual precipitation, snowfall, and average temperature of the summers from 1981 to 2020.

2.2.4. Water Resource Zone Data

The secondary zoning data of water resources in China maintained the integrity of the river systems and were obtained from the Resource and Environment Science and Data Center (https://www.resdc.cn/, accessed on 2 March 2023). Based on the hydrological zones and considering the characteristics of regional water resources, China’s water resource zones are categorized as 10 primary zones, 80 secondary zones, and 214 third-level zones. We chose the secondary zoning data of water resources to explore the characteristics of glacier change within different water resource zones in detail in order to provide significant implications for the sustainable management of regional water resources.

2.3. Glacier Mapping and Error Estimation

Based on the GEE platform, images with little snow and less than 10% cloud cover were selected from 1 April to 31 October in 2000, 2005, 2010, 2015, and 2020, and the ratio image was obtained by the R/SWIR band ratio. Compared with other methods, such as the normalized difference snow index and visual interpretation, the band ratio threshold method is proven to have the highest efficiency and requires the least manual intervention, which is appropriate for glacier mapping in large-scale areas [9,30,31]. We applied the decision tree for classification and determined the optimal threshold after several tests, distinguishing between the glacier areas and the non-glacier areas [20]. The minimum threshold was 1.5 for Landsat TM/ETM+ images and 0.9 for Landsat OLI data. In order to avoid misclassification, we used the elevation data for the glacier mask and reserved the glacier boundary with an elevation of more than 2000 m, after which we removed the water area to obtain the preliminary results of the glacier. However, the problem of the glaciers mixing with seasonal snow remains an issue. That being said, according to previous studies [32], the NIR band of Landsat images illustrated that ice and snow have different characteristics, and a histogram can thus be utilized to segment the boundary between ice and snow.
The OTSU’s method [33] is an automatic thresholding algorithm that separates pixels into two classes, foreground, and background, according to the frequency distribution histogram. The threshold is determined by minimizing the intra-class intensity variance, or equivalently, by maximizing the inter-class variance [34]. Therefore, the OTSU algorithm can effectively distinguish between snow cover and bare ice [32]. We divided the study area into 16 regions in GEE and then applied the OTSU algorithm to automatically calculate the threshold of each region. Specifically, the pixel value greater than the threshold was classified as bare ice. Finally, the mosaiced data were manually interpreted based on the Chinese Glacier Inventory. According to the color, texture, and other features in the image combined with a glacial lake and the topographic information, the debris-covered glaciers were distinguished [20,35]. Signs of movements, supraglacial ponds, or creeks beginning at the end of the terminus were regarded as indicators to identify the position of the termini [9].
The accuracy of glacier identification is comprehensively affected by image quality (i.e., spatial and temporal resolution, cloud cover, and mountain shadow), interpretation methods, and post-processing methods [24], of which the spatial resolution of the original image has a primary impact. In this paper, the buffer method [36,37] was used to evaluate the identification accuracy of the glacier area, and half of a pixel width was taken as the buffer size (15 m). The results showed that the error caused by the resolution of remote-sensing imagery is 2.2% of the total area of glaciers, which was within a reasonable range [9].

2.4. Analysis of Glacier Change and Its Response to Climate Change

We studied the spatial and temporal characteristics of glacier changes from different perspectives in western China from 2000 to 2020. First, by mapping the intersection with DEM data, the area change of glaciers at different altitudes every five years was analyzed, and then the glacier changes at different area levels during different periods were estimated. Thereafter, the spatial variance of glacier area changes in different water resource zones in 2000–2010 and 2010–2020 was further discussed. We adopted the relative rate of the area change in order to calculate the glacier area change. The calculation formula is as follows [38]:
R = [ ( A 2 A 1 ) 1 Y 1 , 2 1 ] × 100 %
where R is the relative rate of area change (%/a); A 2 and A 1 are the glacier areas in the latter and earlier phases (km2), respectively; and Y 1 , 2 is the time interval (a) between the two phases.
Climate factors play an essential role in the glacier lifecycle [3]. Snowfall and seasonal temperatures exert an impact on the accumulation and ablation of glaciers [25]. When analyzing the relationship between climate factors and glacier change, the lag of glacier change should be taken into account; that is, the current glacier change may be the result of the response to climate change several years ago. Wang et al. [10] pointed out that the change of the mountain-glacier front in the Northern Hemisphere lags about 12 to 13 years behind the climate. Therefore, we conducted a linear trend analysis [39] on the change slope of the average temperature in the summer, annual precipitation, and snowfall from 1981 to 2000 and from 2000 to 2020 ( Slope ). Slope > 0 indicates an increasing trend in climate factors and vice versa. Then, the analysis of variance (ANOVA) method was performed to test the significance of the trend. Specifically, when p ≤ 0.01, it indicates a very significant change; when 0.01 < p ≤ 0.05, it indicates a significant change; and when p > 0.05, it did not pass the significance test. Then, we further explored the response of glacier changes to climate change by analyzing the linkage between them.

3. Results

3.1. The Current Status of the Glaciers in Western China

In 2020, there were 52,384 glaciers in western China, with an area of 42,903.57 km2, which was dominated by glaciers at an altitude of 4500–6500 m, with an area of 33,871 km2, accounting for 84.06% of the total area (Figure 2). The distribution characteristics of the glacier area in different altitudes correspond to a Gaussian distribution, which is consistent with the existing findings [40]. From the perspective of area size, it can be seen that with the rise of glacier area size, the total area of each area size decreases first and then increases (Figure 3). Specifically, the total area of glaciers with a scale of more than 100 km2 was among the largest group, namely 15,964.96 km2, accounting for 39.49% of the total area of glaciers. According to the distribution of glacier areas in different water resource zones (Figure 4), the glacier area in the inner flow region was dominated by the headwaters of the Tarim River zone, accounting for 35.25% of the total. This was followed by the inland river area of the Qiangtang Plateau, accounting for 12.62%. In terms of the outflow area, the southern Tibetan River zone had the largest glacier area, accounting for 11.86% of the total.

3.2. The Change of Glacier Area in Western China in the 2000–2020 Period

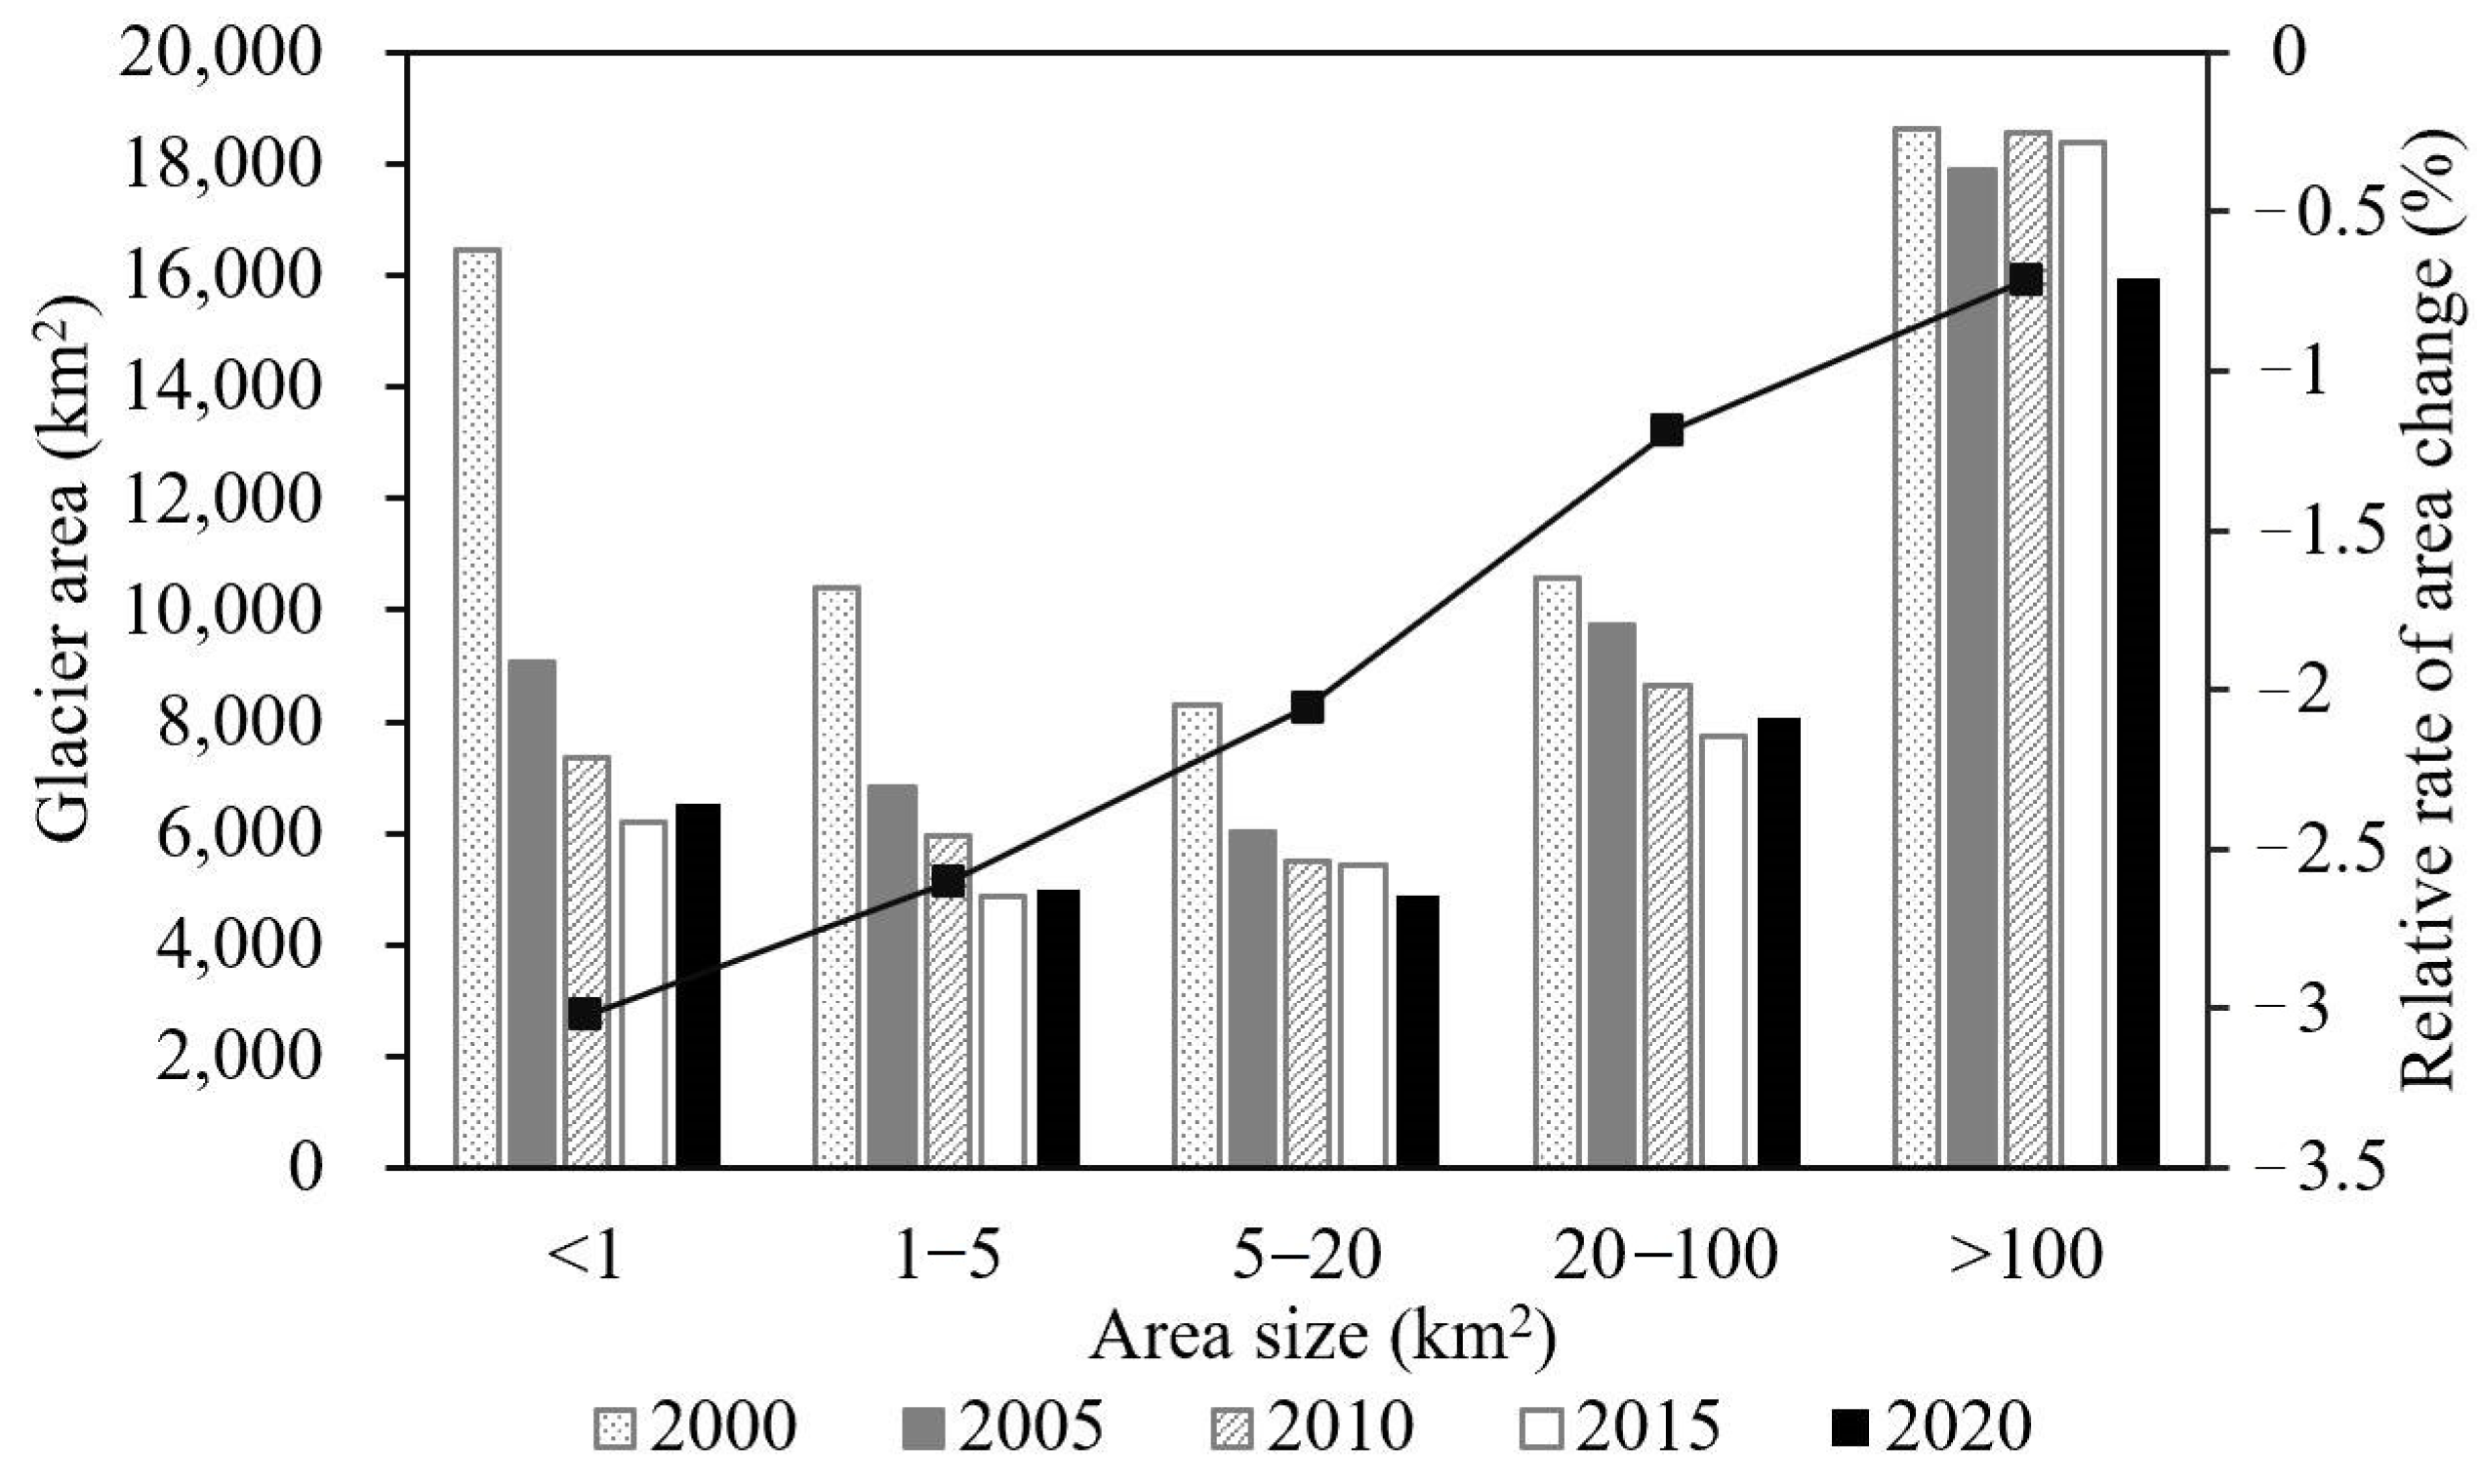
3.2.1. Area Change of Glaciers of Different Sizes

From 2000 to 2020, the glaciers in western China showed a retreating trend overall, with the area reduced by 15,575.94 km2 and an average area retreat rate of 1.46%/a. During this period, from 2000 to 2010, the glacier area decreased by 9848.06 km2, with an average shrinkage rate of 1.26%/a. From 2010 to 2020, the glacier area decreased by 5727.89 km2 with a rate of 1.85%/a. With regard to the glacier change of different area sizes (Figure 3), the results showed that in the last 20 years, glaciers of all sizes displayed a gradual reduction trend in the region. However, the smaller the size of glaciers, the greater the relative changes in the area since small-scale glaciers appear to be more sensitive to climate change [8]. Glaciers with an area less than 5 km2 experienced the greatest retreat; the retreat rate of those less than 1 km2 was about 3.02%/a, whereas those with areas of 1–5 km2 witnessed a retreat rate of about 2.60%/a.

3.2.2. Area Change of Glaciers at Different Elevations

Concerning the glacier changes at different altitudes, the total glacier area at altitudes between 4500 m and 6500 m in 2000 was 48,704 km2, which accounted for 84.89% of the total area. This surface area decreased over the following years to 48,704 km2 (84.89%) in 2005, 41,815 km2 (84.04%) in 2010, and 36,731 km2 (86.30%) in 2015 (Figure 2). From 2000 to 2020, the change in glacier areas tended to stabilize with the altitude increase. The area change rate of glaciers with altitudes of more than 6500 m was about 0.2%/a, while the areas of decrease mainly occurred in regions below 5900 m, with a relative retreat rate of 6%/a, which accounted for 98.84% of the total glacier area losses. The fastest retreat was observed at an altitude of 4300–4500 m with a relative retreat rate of 14%/a. In addition, the median elevation of all glaciers was 5594.68 m, 5606.00 m, and 5616.03 m in 2000, 2010, and 2020, respectively, from which we can confirm that glaciers in western China underwent a continuous retreat during the study period.

3.2.3. Area Change of Glaciers in Different Water Resource Zones

The glacier areas within 19 water resource zones showed an overall decreasing trend in 2000, 2005, and 2010 (Figure 4a). From 2000 to 2005, the Lancang River and the Jinsha River zone below Shigu Town showed the most extreme glacier area shrinkage, which had decreased by 168.90 km2 and 120.71 km2, respectively. From 2005 to 2010, the retreat of glacier areas in the Mintuo River zone accelerated significantly, with a retreat rate of 1.87%/a, which is nearly twice that of the previous five years. From 2000 to 2010, glacier changes in western China showed obvious spatial variation. The area loss was most pronounced in the southeast of QTP and the Qilian Mountains, with retreat rates of more than 4%/a. These were followed by the Tianshan Mountains area, where the average retreat rate was 3.31%/a. The headwater region of the Tarim River contains the largest areas of glaciers, with a relatively low retreat rate of 1.87%/a, which was also the case on the Qiangtang Plateau. The Pamir-Karakoram-West Kunlun region displayed the lowest level of glacier retreat, where the average reduction rate was about 1%/a. It has been found in previous studies that some glaciers in these areas even advanced, displaying positive mass balances [7].
From 2010 to 2015, the glaciers in the Mintuo River zone experienced an extreme area loss of 164.93 km2, followed by the Yarlung Zangbo River zone, with a loss of 1444.33 km2, whereas the reduction rate of glacier area in the Pamir-Karakoram-West Kunlun region was the lowest. From 2015 to 2020, the glaciers in the western Tibetan River zone within the western Himalayan region revealed an accelerated retreating trend. From 2010 to 2020, glacier areas in water resource zones exhibited accelerated retreat rates, especially within the Jinsha River zone below Shigu Town within the Hengduan Mountains and the Mintuo River zones (Figure 4b). The retreat rates in the western Tibetan River zone increased from 1.97%/a in the first 10 years to 4.81%/a. On the other hand, the Tianshan Mountains region exhibited a decreasing trend, where the average retreat rate was 1.31%/a. The retreat rate remained unchanged or even decreased slightly in water resource zones such as the Qaidam Basin, the headwater region of the Tarim River, and the inland river area of the Qiangtang Plateau.

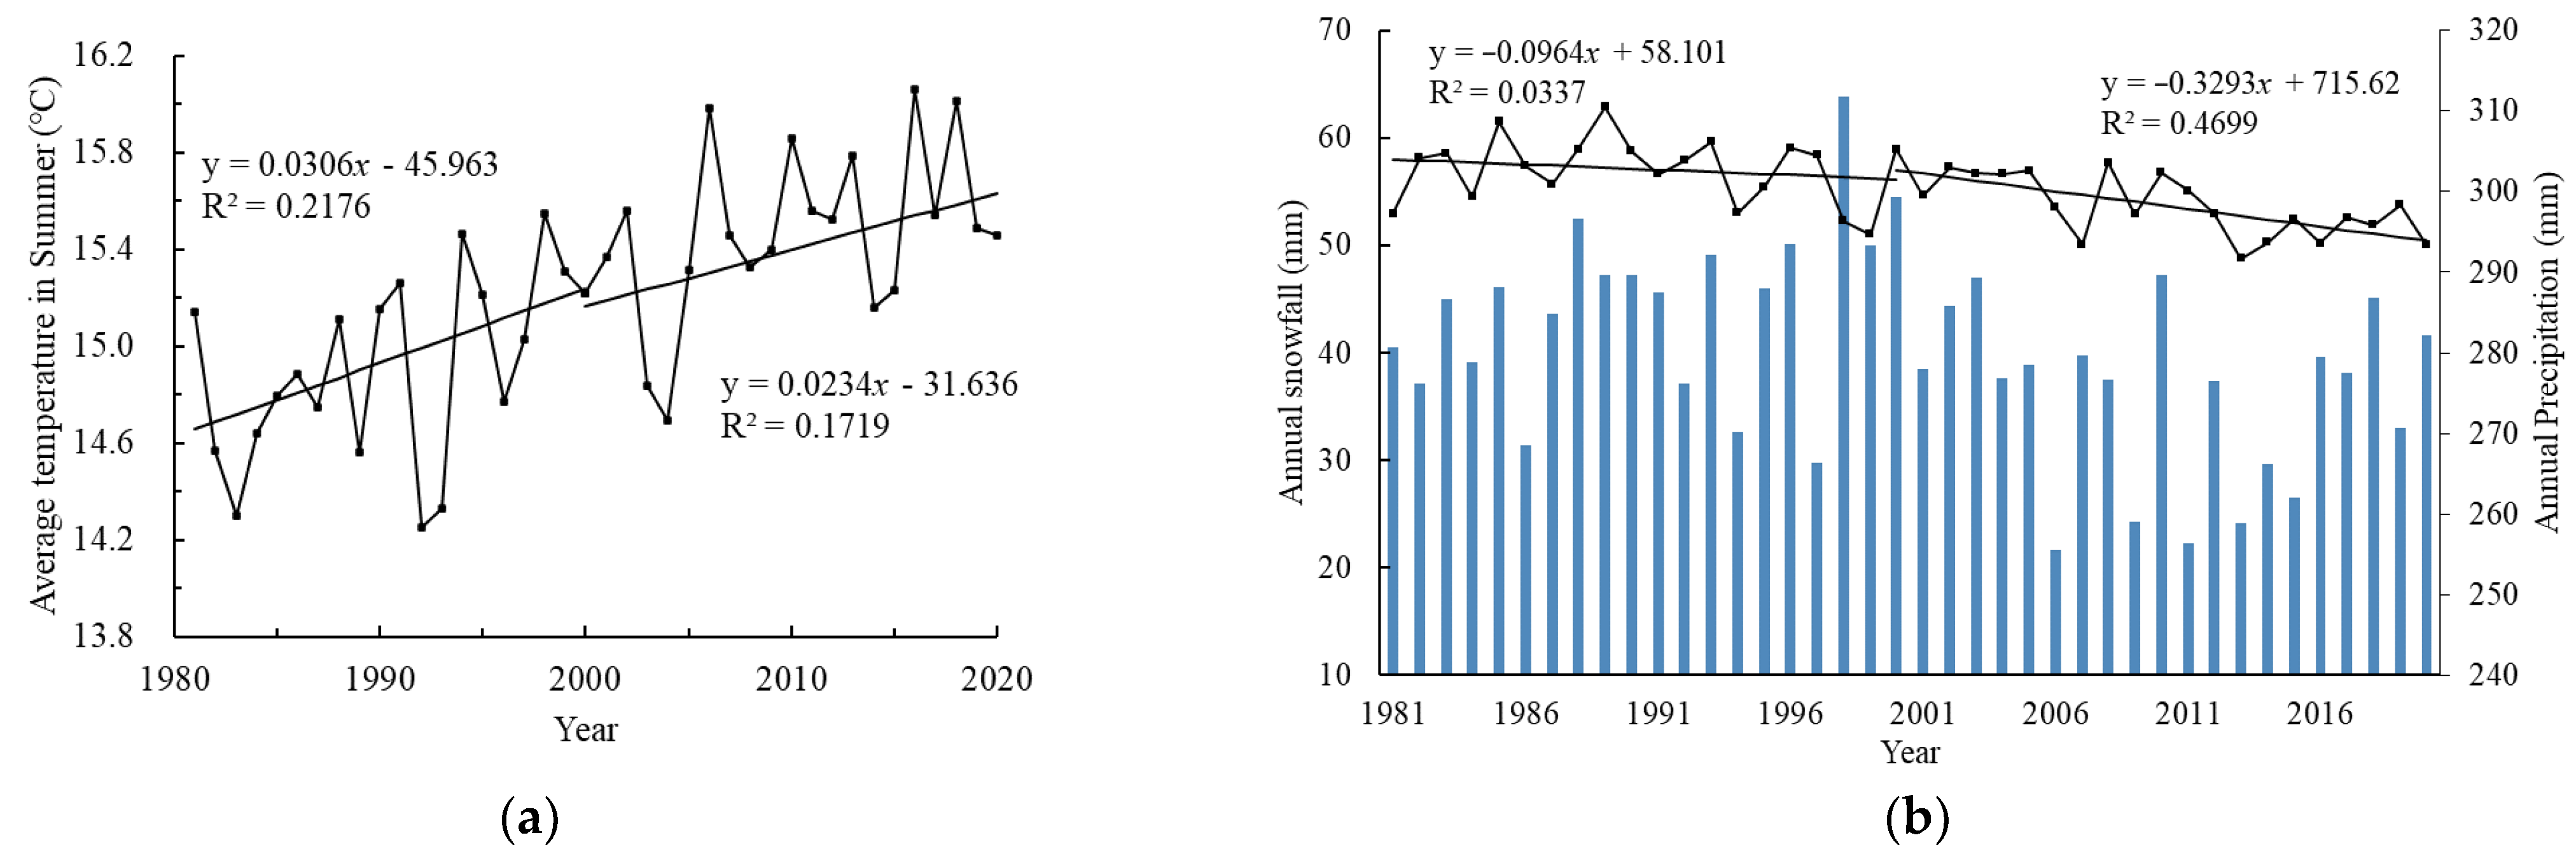
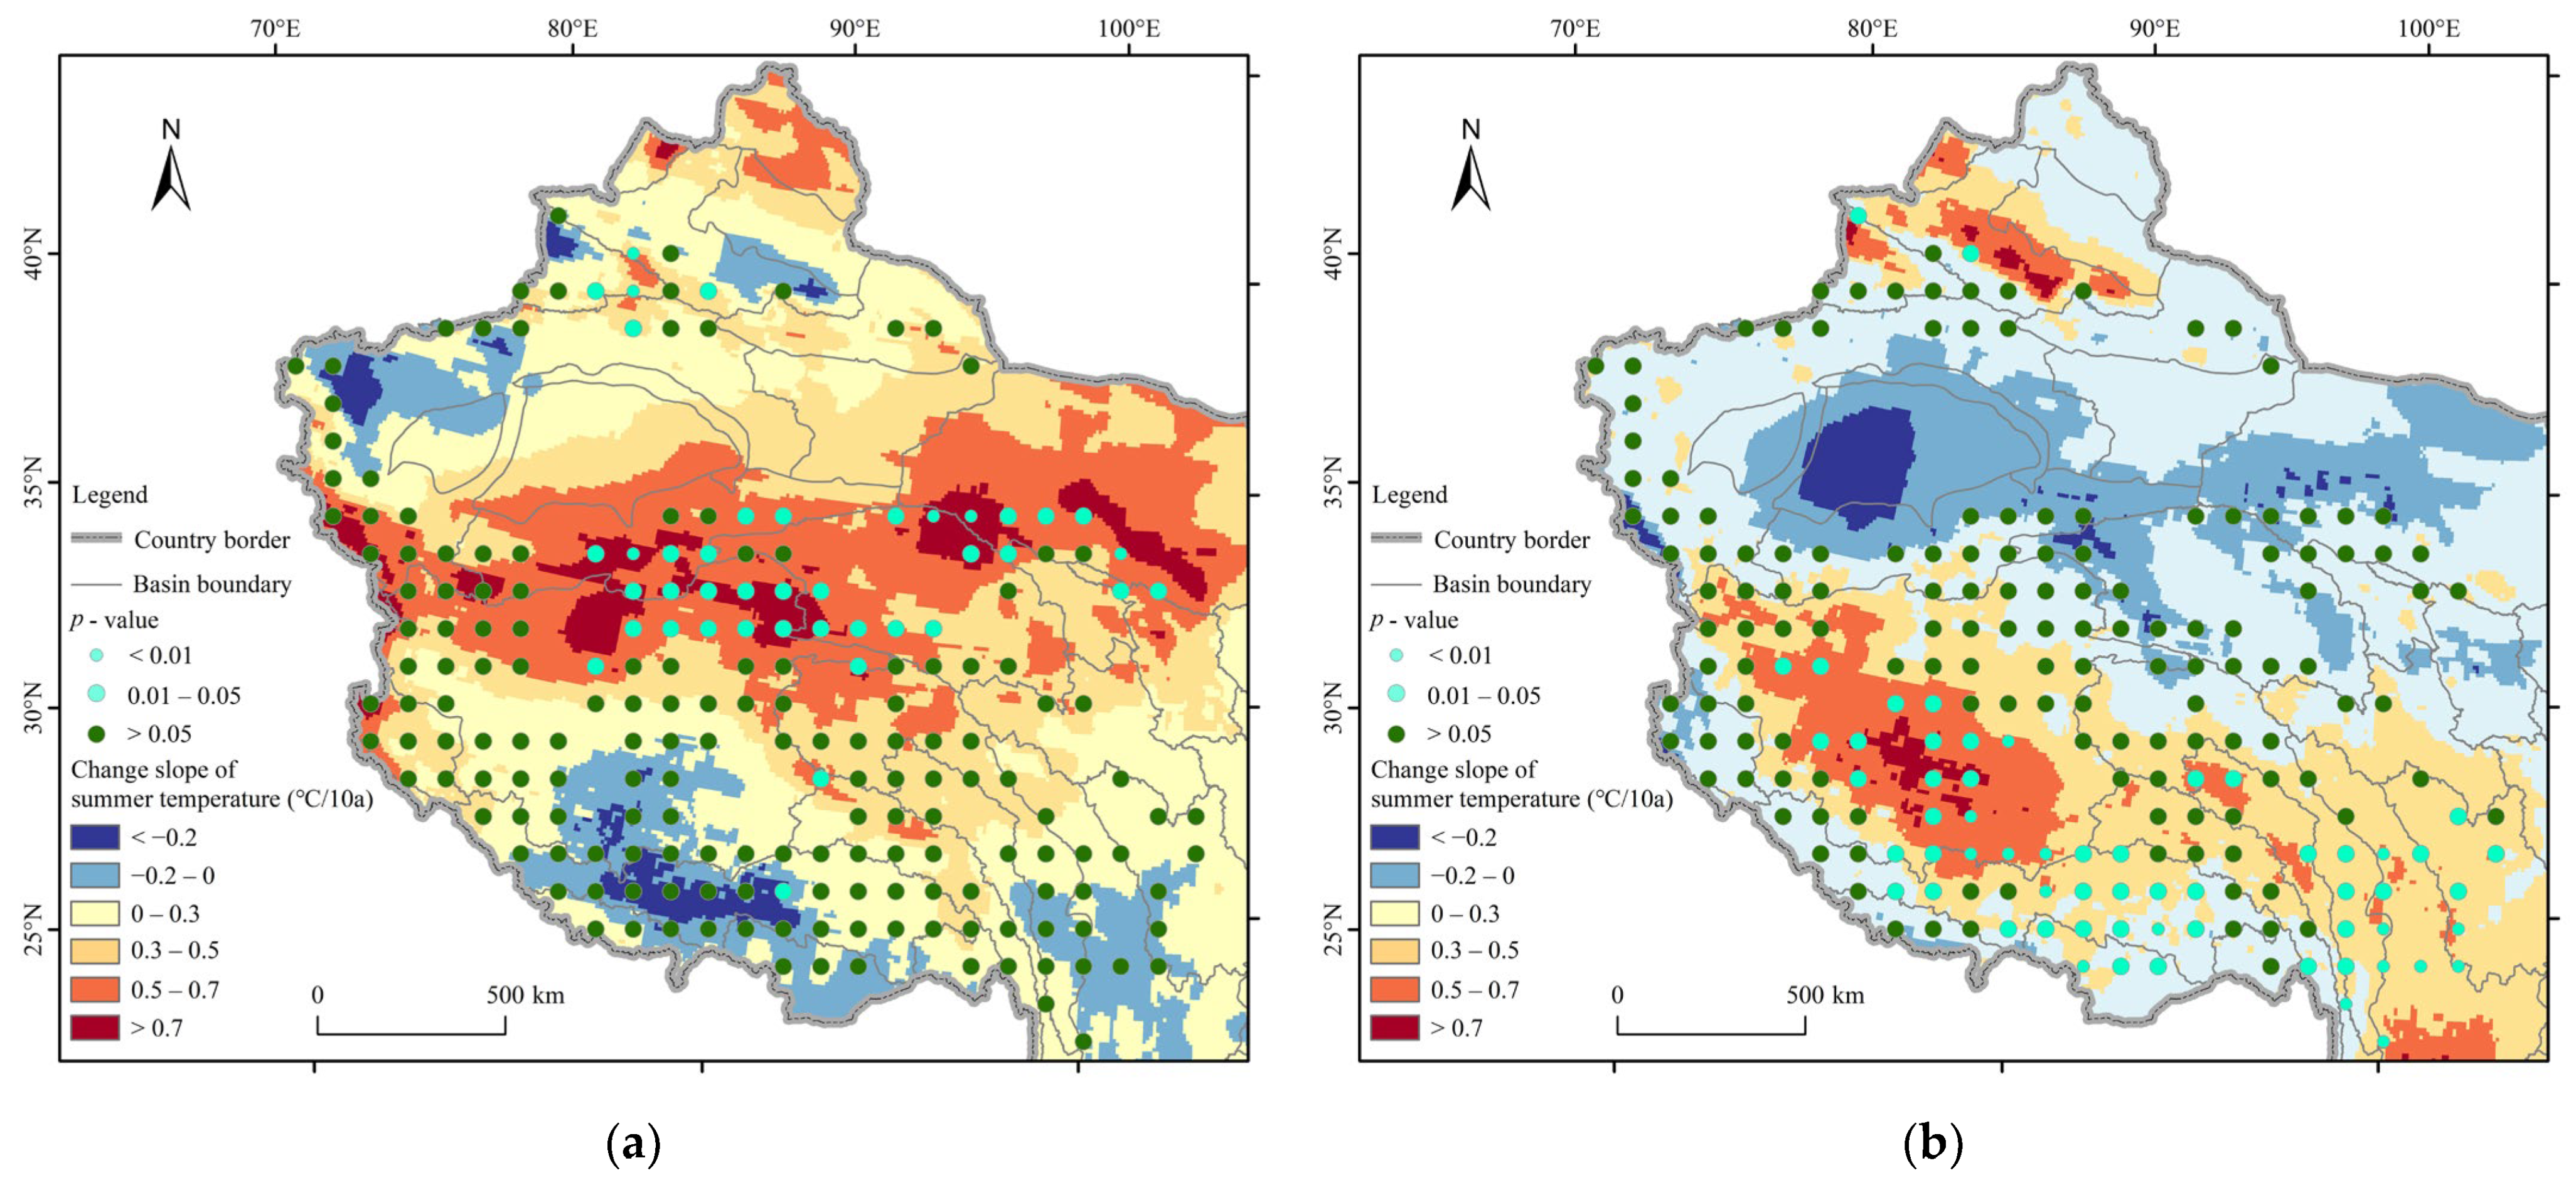
3.3. Response of Glacier Change to Climate Change

We found that from 1980 to 2020, the average temperature during the summer in western China showed an increasing trend (0.279 ℃/10a), whereas the annual precipitation and snowfall displayed a decrease, with a change rate of −3.781 mm/10a and −1.82 mm/10a, respectively (Figure 5). The rate of glacier change bears a certain relation to the combination of temperature and snowfall change in the corresponding period. From 1980 to 2000, the rising summer temperature, accompanied by a decrease in snowfall, contributed to the rapid glacier retreat in the first stage (2000–2010). From 2000 to 2020, summer temperatures showed a continuously increasing trend of 0.234 ℃/10a, and snowfall exhibited an accelerating change rate of 3.293 mm/10a. The continued warming and reduced snowfall led to the overall acceleration of glacier retreat in the second stage (2010–2020).
The spatial variance of climate change and glacier distribution sites containing the significance test results of climate-changing trends are shown in Figure 6 and Figure 7. From 1980 to 2000, changes in snowfall varied widely across a large geographical territory in western China (Figure 6). The snowfall decreased in regions mainly distributed in the Pamir-Karakoram-West Kunlun region, Qilian Mountains, and eastern and southeast QTP, where the decreasing trend exceeded 30 mm/10a. On the other hand, the Yarlung Zangbo River, southern Tibetan River, and Mintuo River zones revealed an increasing trend of more than 5 mm/10a, which mitigated the area losses of glaciers in these regions during 2000–2010. From 2000 to 2020, the Kunlun Mountains and inland QTP showed a significant decreasing trend in snowfall (p < 0.05). It is noteworthy that the change in trends of snowfall changed from increasing to decreasing in the Yarlung Zangbo River, Hengduan Mountains, and Mintuo River zones. This was accompanied by rising summer temperatures, which contributed to the accelerated shrinkage of glacier areas in these regions in 2010–2020.
An increasing warming trend at higher elevations, especially between 4800 and 6200 m over the TBP, is the main climate factor causing glacier change [10]. We found that average temperatures during the summer showed an increasing trend in more than 70% of regions in western China in 1980–2000 (Figure 7). The northern QTP exhibited a significant warming rate (> 7 ℃/10a, p < 0.05), while the Yarlung Zangbo River zone and western parts of the headwater region of the Tarim River indicated a cooling trend. The hydrothermal combination of warming and rapid snowfall decrease resulted in high levels of glacier retreat in zones surrounding the Longyang Gorge. From 2000 to 2020, an increasing warming rate was observed in the inland river area of the Qiangtang Plateau (p < 0.05), which has no significant effect on the rate of glacier change there. Despite the rapid increase in snowfall in the Qinghai Lake zone, it was not enough to compensate for the impact of global warming that was accelerating the glacial retreat. The decreasing trend in summer temperatures in the Pamir-Karakoram-West Kunlun region and Qaidam Basin zone mitigated the losses of the glacier area from 2010 to 2020.

4. Discussion

Studies have shown that global glaciers have experienced an extreme retreat since 1960, with an average retreat rate of 0.35%/a [41]. Yao et al. [7] suggested that glaciers in the QTP and its surroundings displayed abnormal states, that is, the relative stability and even partial advance seen in glaciers in the East Pamir–Karakoram–West Kunlun regions, when compared with the accelerated retreat of glaciers in southeast QTP. Our findings suggest that the glacier dynamics in southeast QTP, Himalayas, Nianqing Tanggula Mountains, Qilian Mountains, and Western Tianshan Mountains were more sensitive to temperature changes, whereas those in the inland QTP, the Western Kunlun Mountains, and Eastern Pamirs were relatively less sensitive to warming. These findings correspond with other studies, which report that the continental glaciers in the western Kunlun regions and eastern Pamirs regions are relatively insensitive to temperature change, and the precipitation increase in these regions alleviates the retreat of glaciers [7]. As compared with these glaciers, maritime glaciers concentrated in southeast QTP appear to be more sensitive to climate change. Due to low temperatures in high-elevation areas, these glaciers are recharged by summer precipitation, which falls in the form of snow [42].
Several studies found that the warming climate is more obvious in high-altitude regions, such as the QTP and its surroundings [43], where the warming magnitude is around twice the global average [44]. Rising temperatures accelerate glacier shrinkage by prolonging the melting season, reducing the proportion of ice and snow in precipitation, and weakening the albedo of glacier surfaces [28]. Yao et al. [8] revealed that the precipitation patterns in the QTP and its surroundings are driven by the changes in the atmospheric circulation; the decrease in precipitation in the Himalayas may be caused by the weakening Indian monsoon, and the increase in precipitation in the eastern Pamirs may result from strengthened westerly storms [45]. The reduction in precipitation in these regions, accompanied by the combined effects of thin surface moraines, glacier cliffs, and glacial lakes [46], have accelerated the negative mass balance and instability of glaciers, resulting in unsustainable water supplies and more frequent glacier disasters [47].
There are several limitations in this study, which should be further addressed in the future. First, the impact of other factors on glacier change was not considered, such as size, type (temperate zone, low temperature, or cold), condensation levels, topography (elevation, slope, and aspect, etc.), sublimation, or a combination of multiple factors [8,40,48,49]. Second, we only discussed the change of glaciers from the perspective of the area, which could be further studied in terms of glacier length, ice volume, mass balance, etc. Additionally, glacier disaster monitoring needs to be strengthened to reveal the disaster-causing mechanisms of glacier anomalies in an effort to facilitate regional disaster prevention, mitigation planning, and risk management [8]. Finally, the quantitative relationship between glacier change and climate change should be further studied.

5. Conclusions

Our study provides complementary evidence that the glaciers in western China have exhibited an accelerating loss of area in the last 20 years. Glaciers with a small area saw greater relative area changes. Overall, the glacier areas in waterresource zones showed accelerated rates of retreat, especially those in the Hengduan Mountain and the Mintuo River regions. Additionally, the glaciers distributed in southeastern QTP and the Himalayas appeared to be sensitive to the rising summer temperatures and decreasing snowfall, whereas glaciers in the Qiangtang Plateau and Pamir-Karakoram-West Kunlun regions showed a relatively stable status. Our findings provide a useful knowledge base to support decision makers in land-use planning and water resource management. Further research is needed to explore more climate factors that cause the retreat of glaciers and to focus on the mechanisms of glacier changes’ responses to those factors. Additionally, traditional remote sensing approaches are sometimes limited by factors such as cloud cover and hill shade. In this case, more field surveys and other emerging techniques (i.e., photogrammetric time series techniques and radar interferometry) are required to better monitor the multiple dimensions of glacier change and its response to the changing environmental conditions.

Author Contributions

Conceptualization, methodology, reviewing, resources, and editing, X.X.; methodology, software, data curation, analysis, visualization, writing, J.L. All authors have read and agreed to the published version of the manuscript.

Funding

This research was funded by the National Key Research and Development Program of China, grant number 2021YFD1500101, the Strategic Priority Research Program of the Chinese Academy of Sciences, grant number XDA20010302, and the Special Funds for Creative Research, grant number 2022C61540.

Institutional Review Board Statement

Not applicable.

Informed Consent Statement

Not applicable.

Data Availability Statement

Data can be requested from authors.

Conflicts of Interest

The authors declare no conflict of interest.

References

  1. Liu, S.; Yao, X.; Guo, W.; Xu, J.; Shangguan, D.; Wei, J.; Bao, W.; Wu, L. The contemporary glaciers in China based on the Second Chinese Glacier Inventory. Acta Geogr. Sin. 2015, 70, 3–16. [Google Scholar] [CrossRef]
  2. Tian, H. Glacier Area Changes in the Qilian Mountains, China. Ph.D. Thesis, Lanzhou University, Qinghai, China, 2013. [Google Scholar]
  3. Zhang, Y.; Yao, X.; Zhou, S.; Zhang, D. Glacier changes in the Sanjiangyuan Nature Reserve of China during 2000–2018. J. Geogr. Sci. 2022, 32, 259–279. [Google Scholar] [CrossRef]
  4. Shugar, D.H.; Clague, J.J.; Best, J.L.; Schoof, C.; Willis, M.J.; Copland, L.; Roe, G.H. River piracy and drainage basin reorganization led by climate-driven glacier retreat. Nat. Geosci. 2017, 10, 370–375. [Google Scholar] [CrossRef]
  5. Sun, Z.; Wang, S.; Zhong, F. Compilation of a glacier water resource balance sheet. J. Nat. Resour. 2021, 36, 2038–2050. [Google Scholar] [CrossRef]
  6. Sun, M.; Ma, W.; Yao, X.; Zhang, M.; Li, Z.; Qin, D. Assessment and spatiotemporal characteristics of service value of glaciers in the Qilian Mountains. Acta Geogr. Sin. 2021, 76, 178–190. [Google Scholar] [CrossRef]
  7. Yao, T.; Yu, W.; Wu, G.; Xu, B.; Yang, W.; Zhao, H.; Wang, W.; Li, S.; Wang, N.; Li, Z.; et al. Glacier anomalies and relevant disaster risks on the Tibetan Plateau and surroundings. Chin. Sci. Bull. 2019, 64, 2770–2782. [Google Scholar] [CrossRef] [Green Version]
  8. Yao, T.; Thompson, L.; Yang, W.; Yu, W.; Gao, Y.; Guo, X.; Yang, X.; Duan, K.; Zhao, H.; Xu, B.; et al. Different glacier status with atmospheric circulations in Tibetan Plateau and surroundings. Nat. Clim. Chang. 2012, 2, 663–667. [Google Scholar] [CrossRef]
  9. Bolch, T.; Yao, T.; Kang, S.; Buchroithner, M.F.; Scherer, D.; Maussion, F.; Huintjes, E.; Schneider, C. A glacier inventory for the western Nyainqentanglha Range and the Nam Co Basin, Tibet, and glacier changes 1976–2009. Cryosphere 2010, 4, 419–433. [Google Scholar] [CrossRef] [Green Version]
  10. Wang, N.; Yao, T.; Xu, B.; Chen, A.; Wang, W. Spatiotemporal pattern, trend, and influence of glacier change in Tibetan Plateau and surroundings under global warming. Bull. Chin. Acad. Sci. 2019, 34, 1220–1232. [Google Scholar] [CrossRef]
  11. Duan, J.; Wang, L.; Ren, J.; Li, L. Progress in glacier variations in China and its sensitivity to climatic change during the past century. Prog. Geogr. 2009, 28, 231–237. [Google Scholar] [CrossRef]
  12. Huss, M.; Hock, R. Global-scale hydrological response to future glacier mass loss. Nat. Clim. Chang. 2018, 8, 135–140. [Google Scholar] [CrossRef] [Green Version]
  13. Kraaijenbrink, P.D.A.; Bierkens, M.F.P.; Lutz, A.F.; Immerzeel, W.W. Impact of a global temperature rise of 1.5 degrees Celsius on Asia’s glaciers. Nature 2017, 549, 257–260. [Google Scholar] [CrossRef] [PubMed]
  14. Zhang, W.; Li, Y.; Chai, L.; Tang, Q.; Ge, R.; Ma, H. Glacier change and response to climate in the northern slope of the middle Nyainqentanglha Mountains during 1990–2020. Prog. Geogr. 2021, 40, 2073–2085. [Google Scholar] [CrossRef]
  15. Tielidze, L.G.; Wheate, R.D. The Greater Caucasus glacier inventory (Russia, Georgia and Azerbaijan). Cryosphere 2018, 12, 81–94. [Google Scholar] [CrossRef] [Green Version]
  16. Xu, A.; Yang, T.; Wang, C.; Ji, Q. Variation of glaciers in the Shaksgam River Basin, Karakoram Mountains during 1978–2015. Prog. Geogr. 2016, 35, 878–888. [Google Scholar] [CrossRef] [Green Version]
  17. Wang, S.; Zhang, M.; Li, Z.; Wang, F.; Li, H.; Li, Y.; Huang, X. Response of glacier area variation to climate change in Chinese Tianshan Mountains in the past 50 years. Acta Geogr. Sin. 2011, 66, 38–46. [Google Scholar] [CrossRef]
  18. Zhou, Y.; Li, Z.; Li, J.; Zhao, R.; Ding, X. Glacier mass balance in the Qinghai Tibet Plateau and its surroundings from the mid-1970s to 2000 based on Hexagon KH-9 and SRTM DEMs. Remote Sens. Environ. 2018, 210, 96–112. [Google Scholar] [CrossRef]
  19. Zhang, H.; Ouyang, Z.; Zheng, H.; Xiao, Y. Valuation of glacier ecosystem services in the Manas River Watershed, Xinjiang. Acta Ecol. Sin. 2009, 29, 5877–5881. [Google Scholar] [CrossRef]
  20. Ji, Q.; Dong, J.; Liu, R.; Xiao, Z.; Yang, T. Glacier changes in response to climate change in the Himalayas in 1990–2015. Sci. Geol. Sin. 2020, 40, 486–496. [Google Scholar] [CrossRef]
  21. Zhen, W.; Huiwen, Z.; Shiyin, L. Dynamic process simulation of a glacier on Qilian Mountain based on a thermo-mechanically coupled model. Sci. Total Environ. 2021, 781, 147027. [Google Scholar] [CrossRef]
  22. Fujita, K. Effect of precipitation seasonality on climatic sensitivity of glacier mass balance. Earth Planet. Sci. Lett. 2008, 276, 14–19. [Google Scholar] [CrossRef]
  23. Kaser, G.; Cogley, J.; Dyurgerov, M.; Meier, M.; Ohmura, A. Mass balance of glaciers and ice caps: Consensus estimates for 1961–2004. Geophys. Res. Lett. 2006, 33, L19501. [Google Scholar] [CrossRef] [Green Version]
  24. Zhao, H.; Wang, X.; Zhao, X.; Guo, W.; Liu, S.; Wei, J.; Zhang, Y. Analysis of glacier changes in China from 2008 to 2018. J. Glaciol. Geocryol. 2021, 43, 976–986. [Google Scholar] [CrossRef]
  25. Immerzeel, W.W.; van Beek, L.P.H.; Bierkens, M.F.P. Climate change will affect the Asian water towers. Science 2010, 328, 1382–1385. [Google Scholar] [CrossRef]
  26. Liu, L.; Gu, H.; Xie, J.; Xu, Y.P. How well do the ERA-Interim, ERA-5, GLDAS-2.1 and NCEP-R2 reanalysis datasets represent daily air temperature over the Tibetan Plateau? Int. J. Climatol. 2021, 41, 1484–1505. [Google Scholar] [CrossRef]
  27. Yuan, X.; Yang, K.; Lu, H.; He, J.; Sun, J.; Wang, Y. Characterizing the features of precipitation for the Tibetan Plateau among four gridded datasets: Detection accuracy and spatio-temporal variabilities. Atmos. Res. 2021, 264, 105875. [Google Scholar] [CrossRef]
  28. Xiao, Y.; Ke, C.-Q.; Shen, X.; Cai, Y.; Li, H. What drives the decrease of glacier surface albedo in High Mountain Asia in the past two decades? Sci. Total Environ. 2023, 863, 160945. [Google Scholar] [CrossRef]
  29. Daloz, A.S.; Mateling, M.; L’Ecuyer, T.; Kulie, M.; Wood, N.B.; Durand, M.; Wrzesien, M.; Stjern, C.W.; Dimri, A.P. How much snow falls in the world’s mountains? A first look at mountain snowfall estimates in A-train observations and reanalyses. Cryosphere 2020, 14, 3195–3207. [Google Scholar] [CrossRef]
  30. Racoviteanu, A.E.; Paul, F.; Raup, B.; Khalsa, S.J.S.; Armstrong, R. Challenges and recommendations in mapping of glacier parameters from space: Results of the 2008 Global Land Ice Measurements from Space (GLIMS) workshop, Boulder, Colorado, USA. Ann. Glaciol. 2009, 50, 53–69. [Google Scholar] [CrossRef] [Green Version]
  31. Paul, F.; Kaab, A.; Maisch, M.; Kellenberger, T.; Haeberli, W. The new remote-sensing-derived swiss glacier inventory: I. Methods. Ann. Glaciol. 2002, 34, 355–361. [Google Scholar] [CrossRef] [Green Version]
  32. Li, X. Research on Glacier Snowline Changes in High Mountain Asia in the Past 30 Years Using GEE. Master’s Thesis, Northwest University, Xi’an, China, 2021. [Google Scholar]
  33. Otsu, N. A threshold selection method from gray-level histograms. IEEE Trans. Syst. Man Cybern. Syst. 1979, 9, 62–66. [Google Scholar] [CrossRef] [Green Version]
  34. Kaparias, I.; Bell, M.G.H.; Greensted, J.; Cheng, S.; Miri, A.; Taylor, C.; Mount, B. Development and implementation of a Vehicle-Pedestrian Conflict Analysis Method adaptation of a Vehicle-Vehicle Technique. Transport. Res. Rec. 2010, 2198, 75–82. [Google Scholar] [CrossRef]
  35. Vincent, C.; Wagnon, P.; Shea, J.M.; Immerzeel, W.W.; Kraaijenbrink, P.; Shrestha, D.; Soruco, A.; Arnaud, Y.; Brun, F.; Berthier, E.; et al. Reduced melt on debris-covered glaciers: Investigations from Changri Nup Glacier, Nepal. Cryosphere 2016, 10, 1845–1858. [Google Scholar] [CrossRef] [Green Version]
  36. Bolch, T.; Menounos, B.; Wheate, R. Landsat-based inventory of glaciers in western Canada, 1985–2005. Remote Sens. Environ. 2010, 114, 127–137. [Google Scholar] [CrossRef]
  37. Granshaw, F.D.; Fountain, A.G. Glacier change (1958–1998) in the North Cascades National Park Complex, Washington, USA. J. Glaciol. 2006, 52, 251–256. [Google Scholar] [CrossRef] [Green Version]
  38. Sun, M.; Liu, S.; Yao, X.; Guo, W.; Xu, J. Glacier changes in the Qilian Mountains in the past half century: Based on the revised First and Second Chinese Glacier Inventory. Acta Geogr. Sin. 2015, 70, 1402–1414. [Google Scholar] [CrossRef] [Green Version]
  39. Hess, A.; Iyer, H.; Malm, W. Linear trend analysis: A comparison of methods. Atmos. Environ. 2001, 35, 5211–5222. [Google Scholar] [CrossRef]
  40. Zhao, X.; Wang, X.; Wei, J.; Jiang, Z.; Zhang, Y.; Liu, S. Spatiotemporal variability of glacier changes and their controlling factors in the Kanchenjunga region, Himalaya based on multi-source remote sensing data from 1975 to 2015. Sci. Total Environ. 2020, 745, 140995. [Google Scholar] [CrossRef]
  41. Mu, J.; Li, Z.; Zhang, H.; Liang, P. The global glacierized area: Current situation and recent change, based on the Randolph Glacier Inventory (RGI 6.0) published in 2017. J. Glaciol. Geocryol. 2018, 40, 238–248. [Google Scholar] [CrossRef]
  42. Zhang, Y.; Yukiko, H.; Koji, F.; Liu, S.Y.; Liu, Q. Heterogeneity in supraglacial debris thickness and its role in glacier mass changes of the Mount Gongga. Sci. China Earth Sci. 2016, 59, 170–184. [Google Scholar] [CrossRef]
  43. Pepin, N.; Bradley, R.S.; Diaz, H.F.; Baraer, M.; Caceres, E.B.; Forsythe, N.; Fowler, H.; Greenwood, G.; Hashmi, M.Z.; Liu, X.D. Elevation-dependent warming in mountain regions of the world. Nat. Clim. Chang. 2015, 5, 424–430. [Google Scholar] [CrossRef] [Green Version]
  44. Qin, J.; Yang, K.; Liang, S.L.; Guo, X.F. The altitudinal dependence of recent rapid warming over the Tibetan Plateau. Clim. Change 2009, 97, 321–327. [Google Scholar] [CrossRef]
  45. Sun, C.; Xu, X.; Zhao, T.; Yao, T.; Zhang, D.; Wang, N.; Ma, Y.; Ma, W.; Chen, B.; Zhang, S.; et al. Distinct impacts of vapor transport from the tropical oceans on the regional glacier retreat over the Qinghai-Tibet Plateau. Sci. Total Environ. 2022, 823, 153545. [Google Scholar] [CrossRef]
  46. Zhang, Y.; Hirabayashi, Y.; Liu, S.Y. Catchment-scale reconstruction of glacier mass balance using observations and global climate data: Case study of the Hailuogou catchment, south-eastern Tibetan Plateau. J. Hydrol. 2012, 444, 146–160. [Google Scholar] [CrossRef]
  47. Zhao, Y.; Zhang, Y.; Liu, S.; Wang, X. Review of maritime glacier mass balance in the southeastern Tibetan Plateau. J. Glaciol. Geocryol. 2022, 44, 930–945. [Google Scholar] [CrossRef]
  48. Scherler, D.; Bookhagen, B.; Strecker, M.R. Spatially variable response of Himalayan glaciers to climate change affected by debris cover. Nat. Geosci. 2011, 4, 156–159. [Google Scholar] [CrossRef]
  49. Xu, B.; Wang, M.; Joswiak, D.R.; Cao, J.; Yao, T.; Wu, G.; Yang, W.; Zhao, H. Deposition of anthropogenic aerosols in a southeastern Tibetan glacier. J. Geophys. Res-Atmos. 2009, 114, D17209. [Google Scholar] [CrossRef] [Green Version]
Figure 1. Glacier distribution in western China.
Land 12 00623 g001
Figure 2. Glacier area change with the increasing altitude in western China from 2000 to 2020.
Land 12 00623 g002
Figure 3. Area and relative rate of area change for glaciers of different sizes in western China from 2000 to 2020.
Land 12 00623 g003
Figure 4. Spatiotemporal differentiation of glacier area change in different water resource zones of western China from 2000 to 2010 (a) and from 2010 to 2020 (b).
Land 12 00623 g004
Figure 5. Change in average temperature during the summer (a) and annual total precipitation and snowfall (b) in western China from 1980 to 2020.
Land 12 00623 g005
Figure 6. Spatiotemporal differentiation of change rate and its significance tests of annual snowfall in western China from 1980 to 2000 (a) and from 2000 to 2020 (b).
Land 12 00623 g006
Figure 7. Spatiotemporal differentiation of change rate and its significance tests of average air temperature during the summer in western China from 1980 to 2000 (a) and from 2000 to 2020 (b).
Land 12 00623 g007
Disclaimer/Publisher’s Note: The statements, opinions and data contained in all publications are solely those of the individual author(s) and contributor(s) and not of MDPI and/or the editor(s). MDPI and/or the editor(s) disclaim responsibility for any injury to people or property resulting from any ideas, methods, instructions or products referred to in the content.

