A Lake Extraction Method Combining the Object-Oriented Method with Boundary Recognition
Abstract
1. Introduction
2. Materials and Methods
2.1. Materials
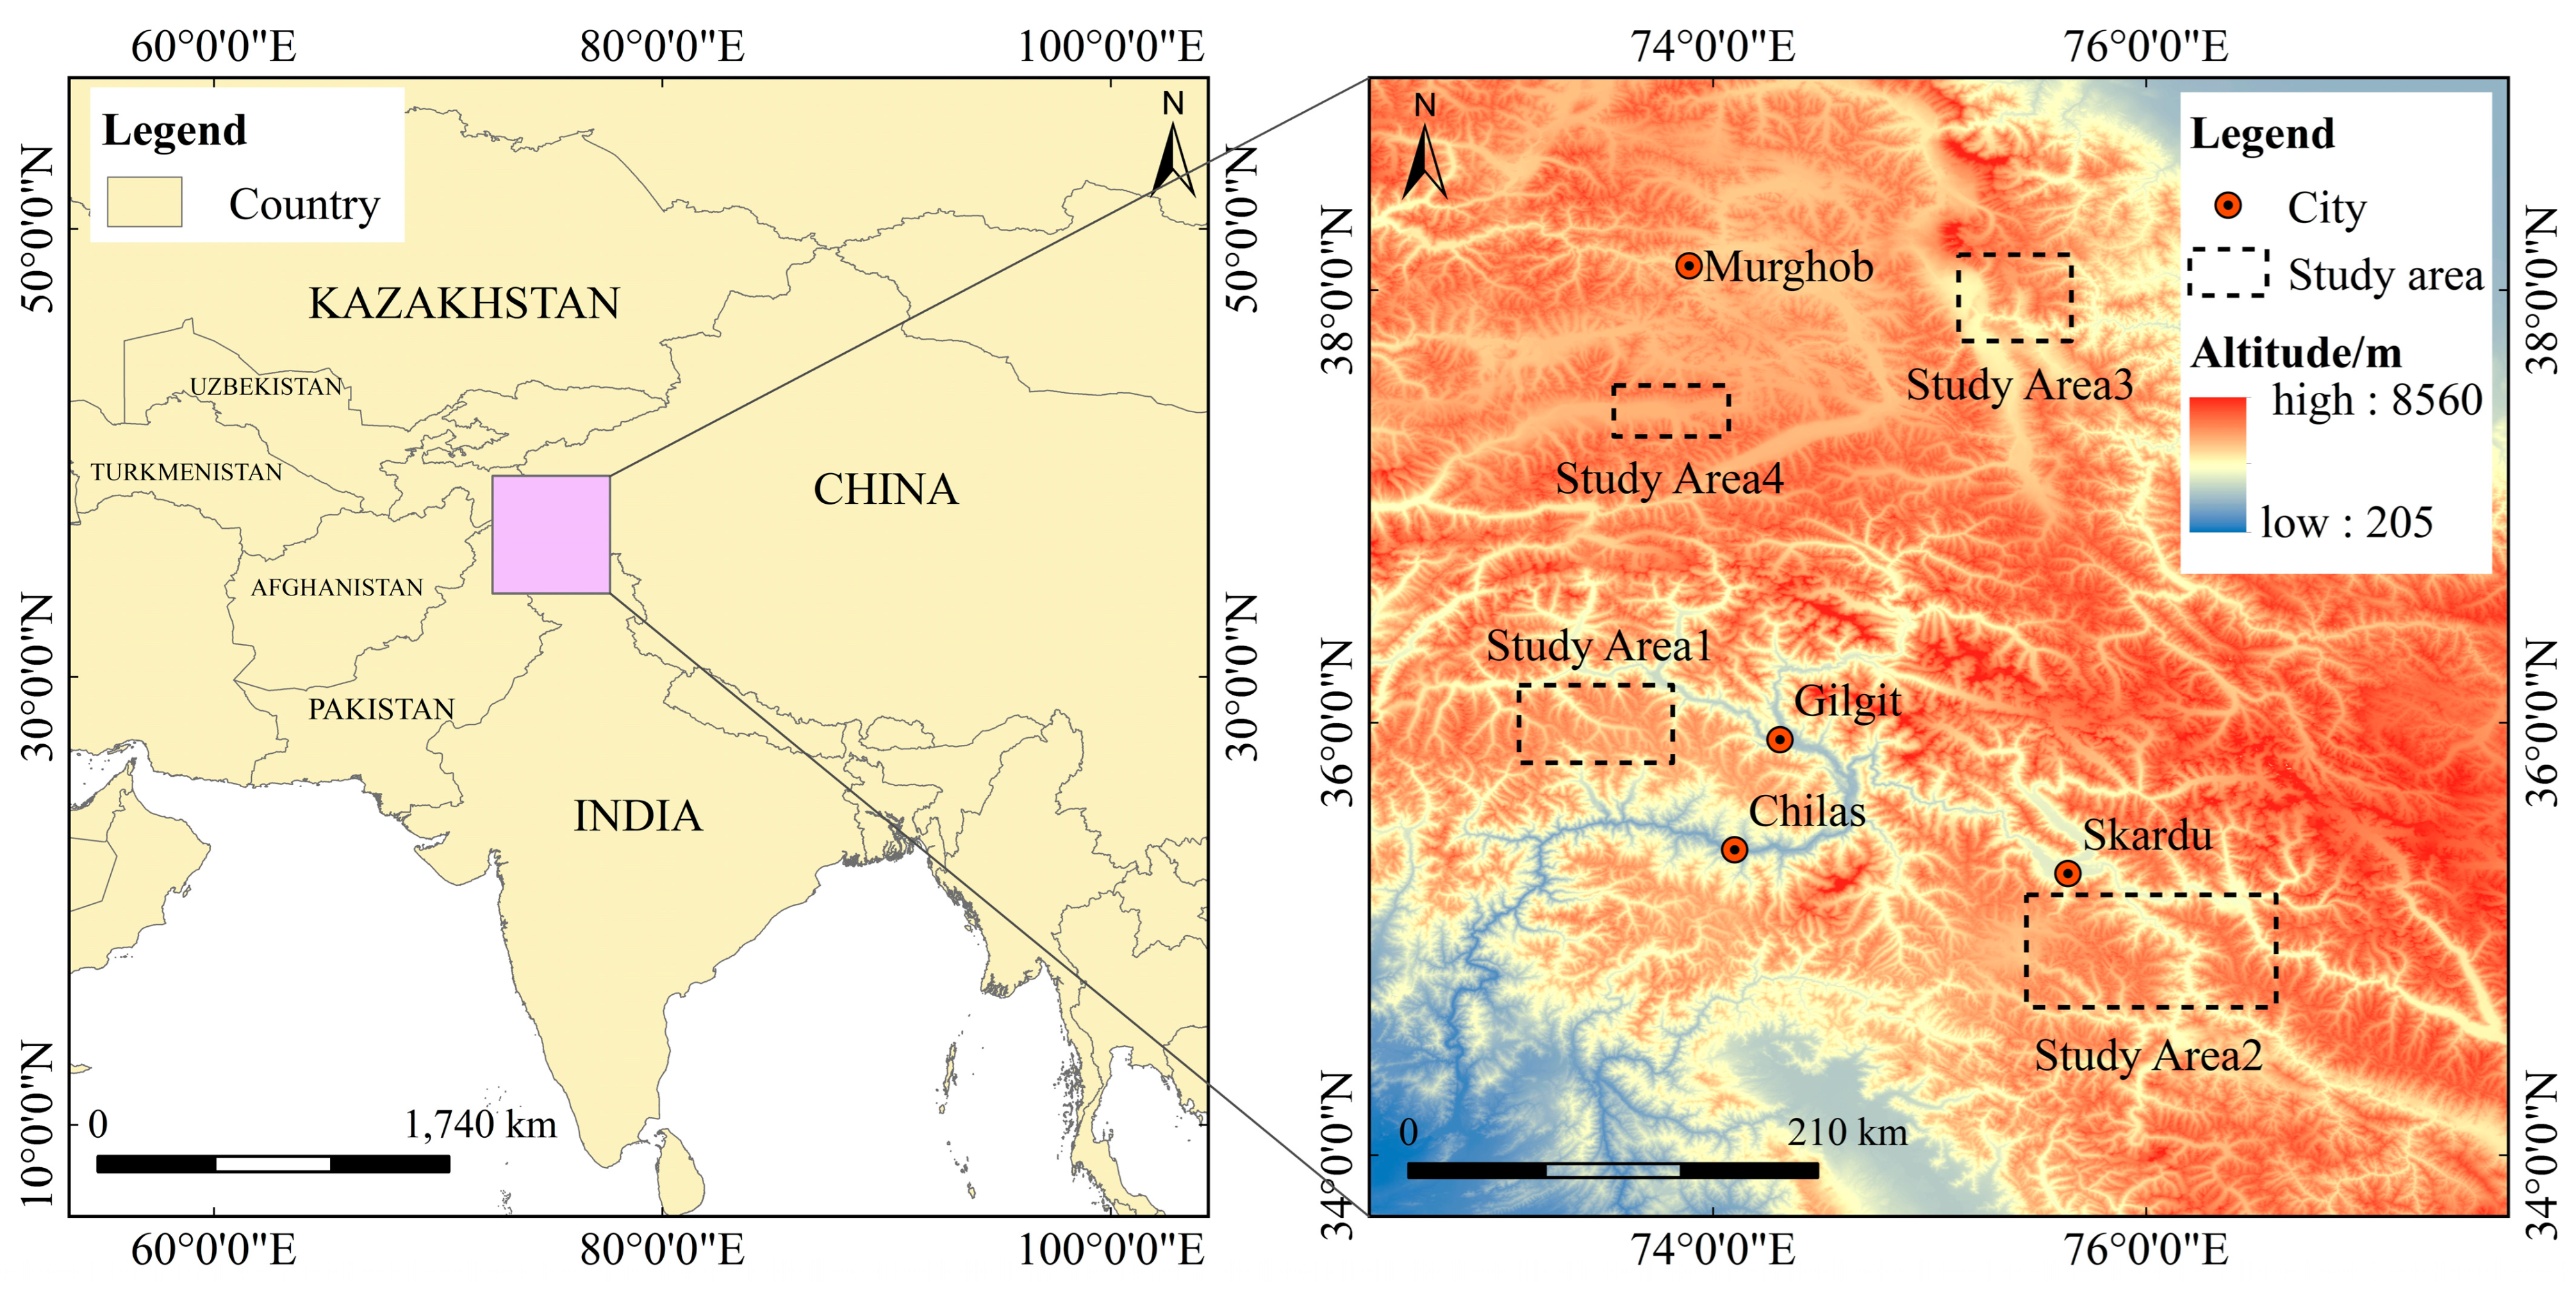
2.1.1. Study Region
2.1.2. Preparation and Preprocessing of Data
2.2. Methods
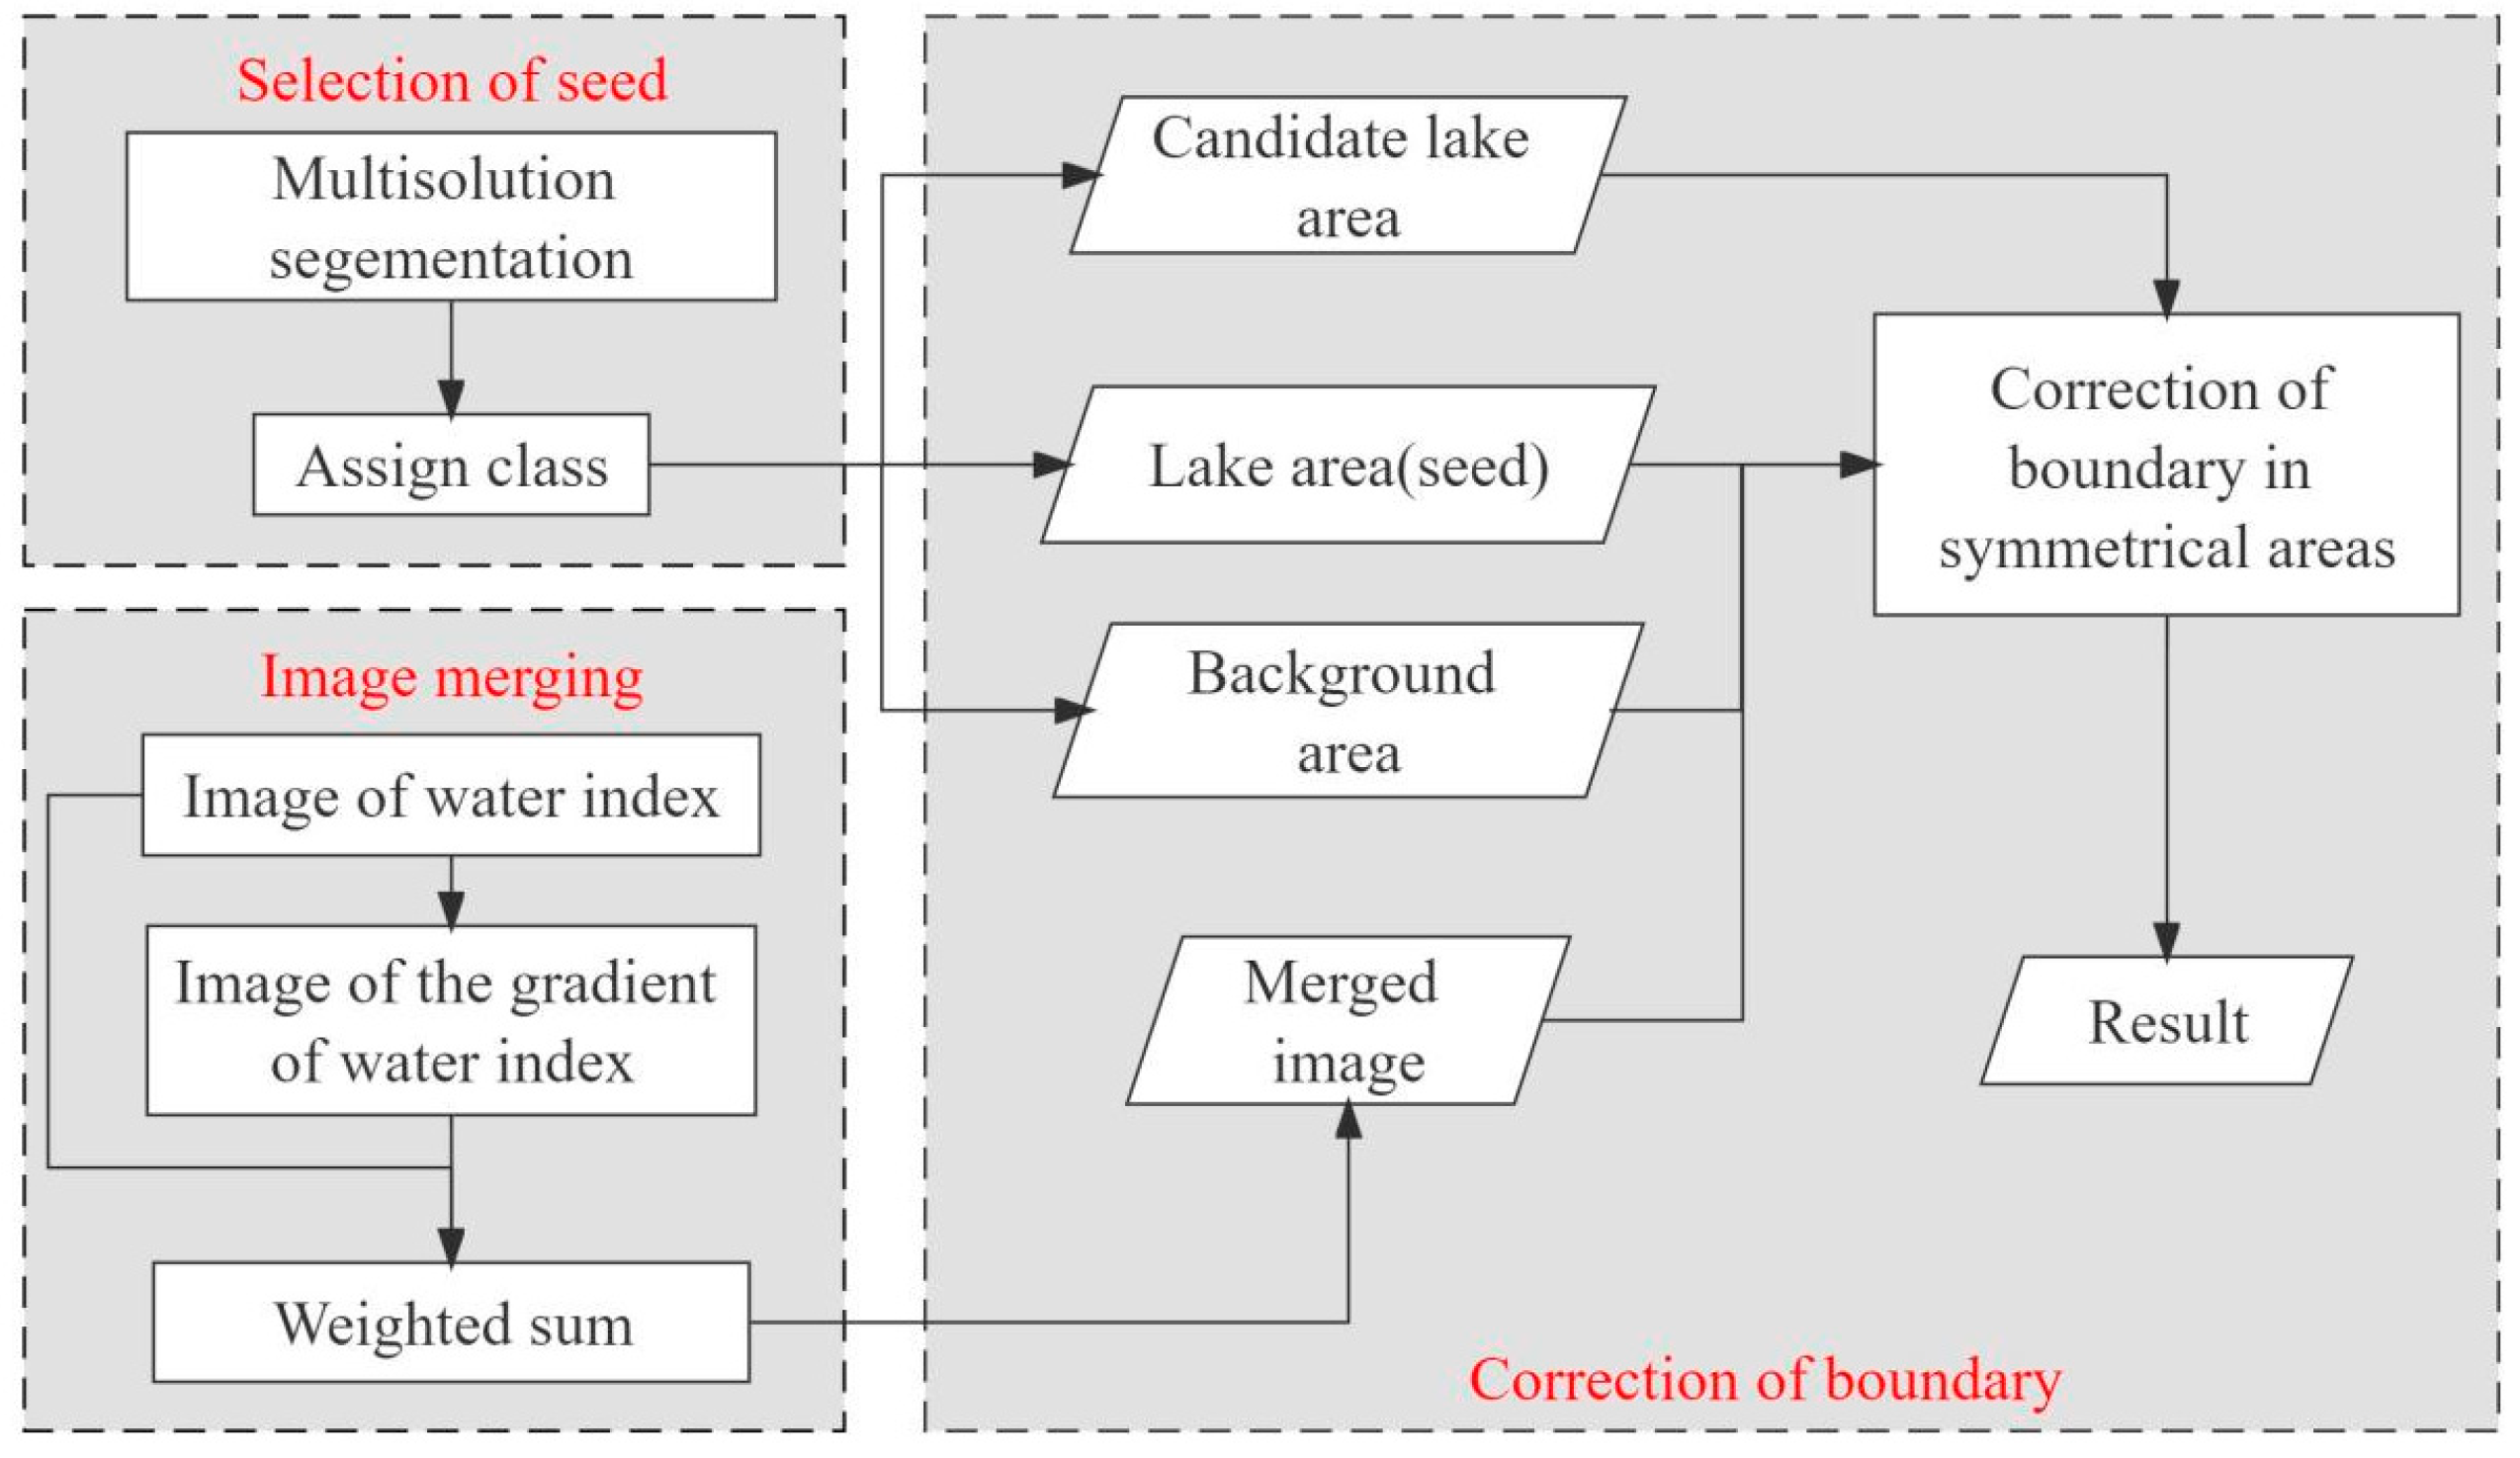
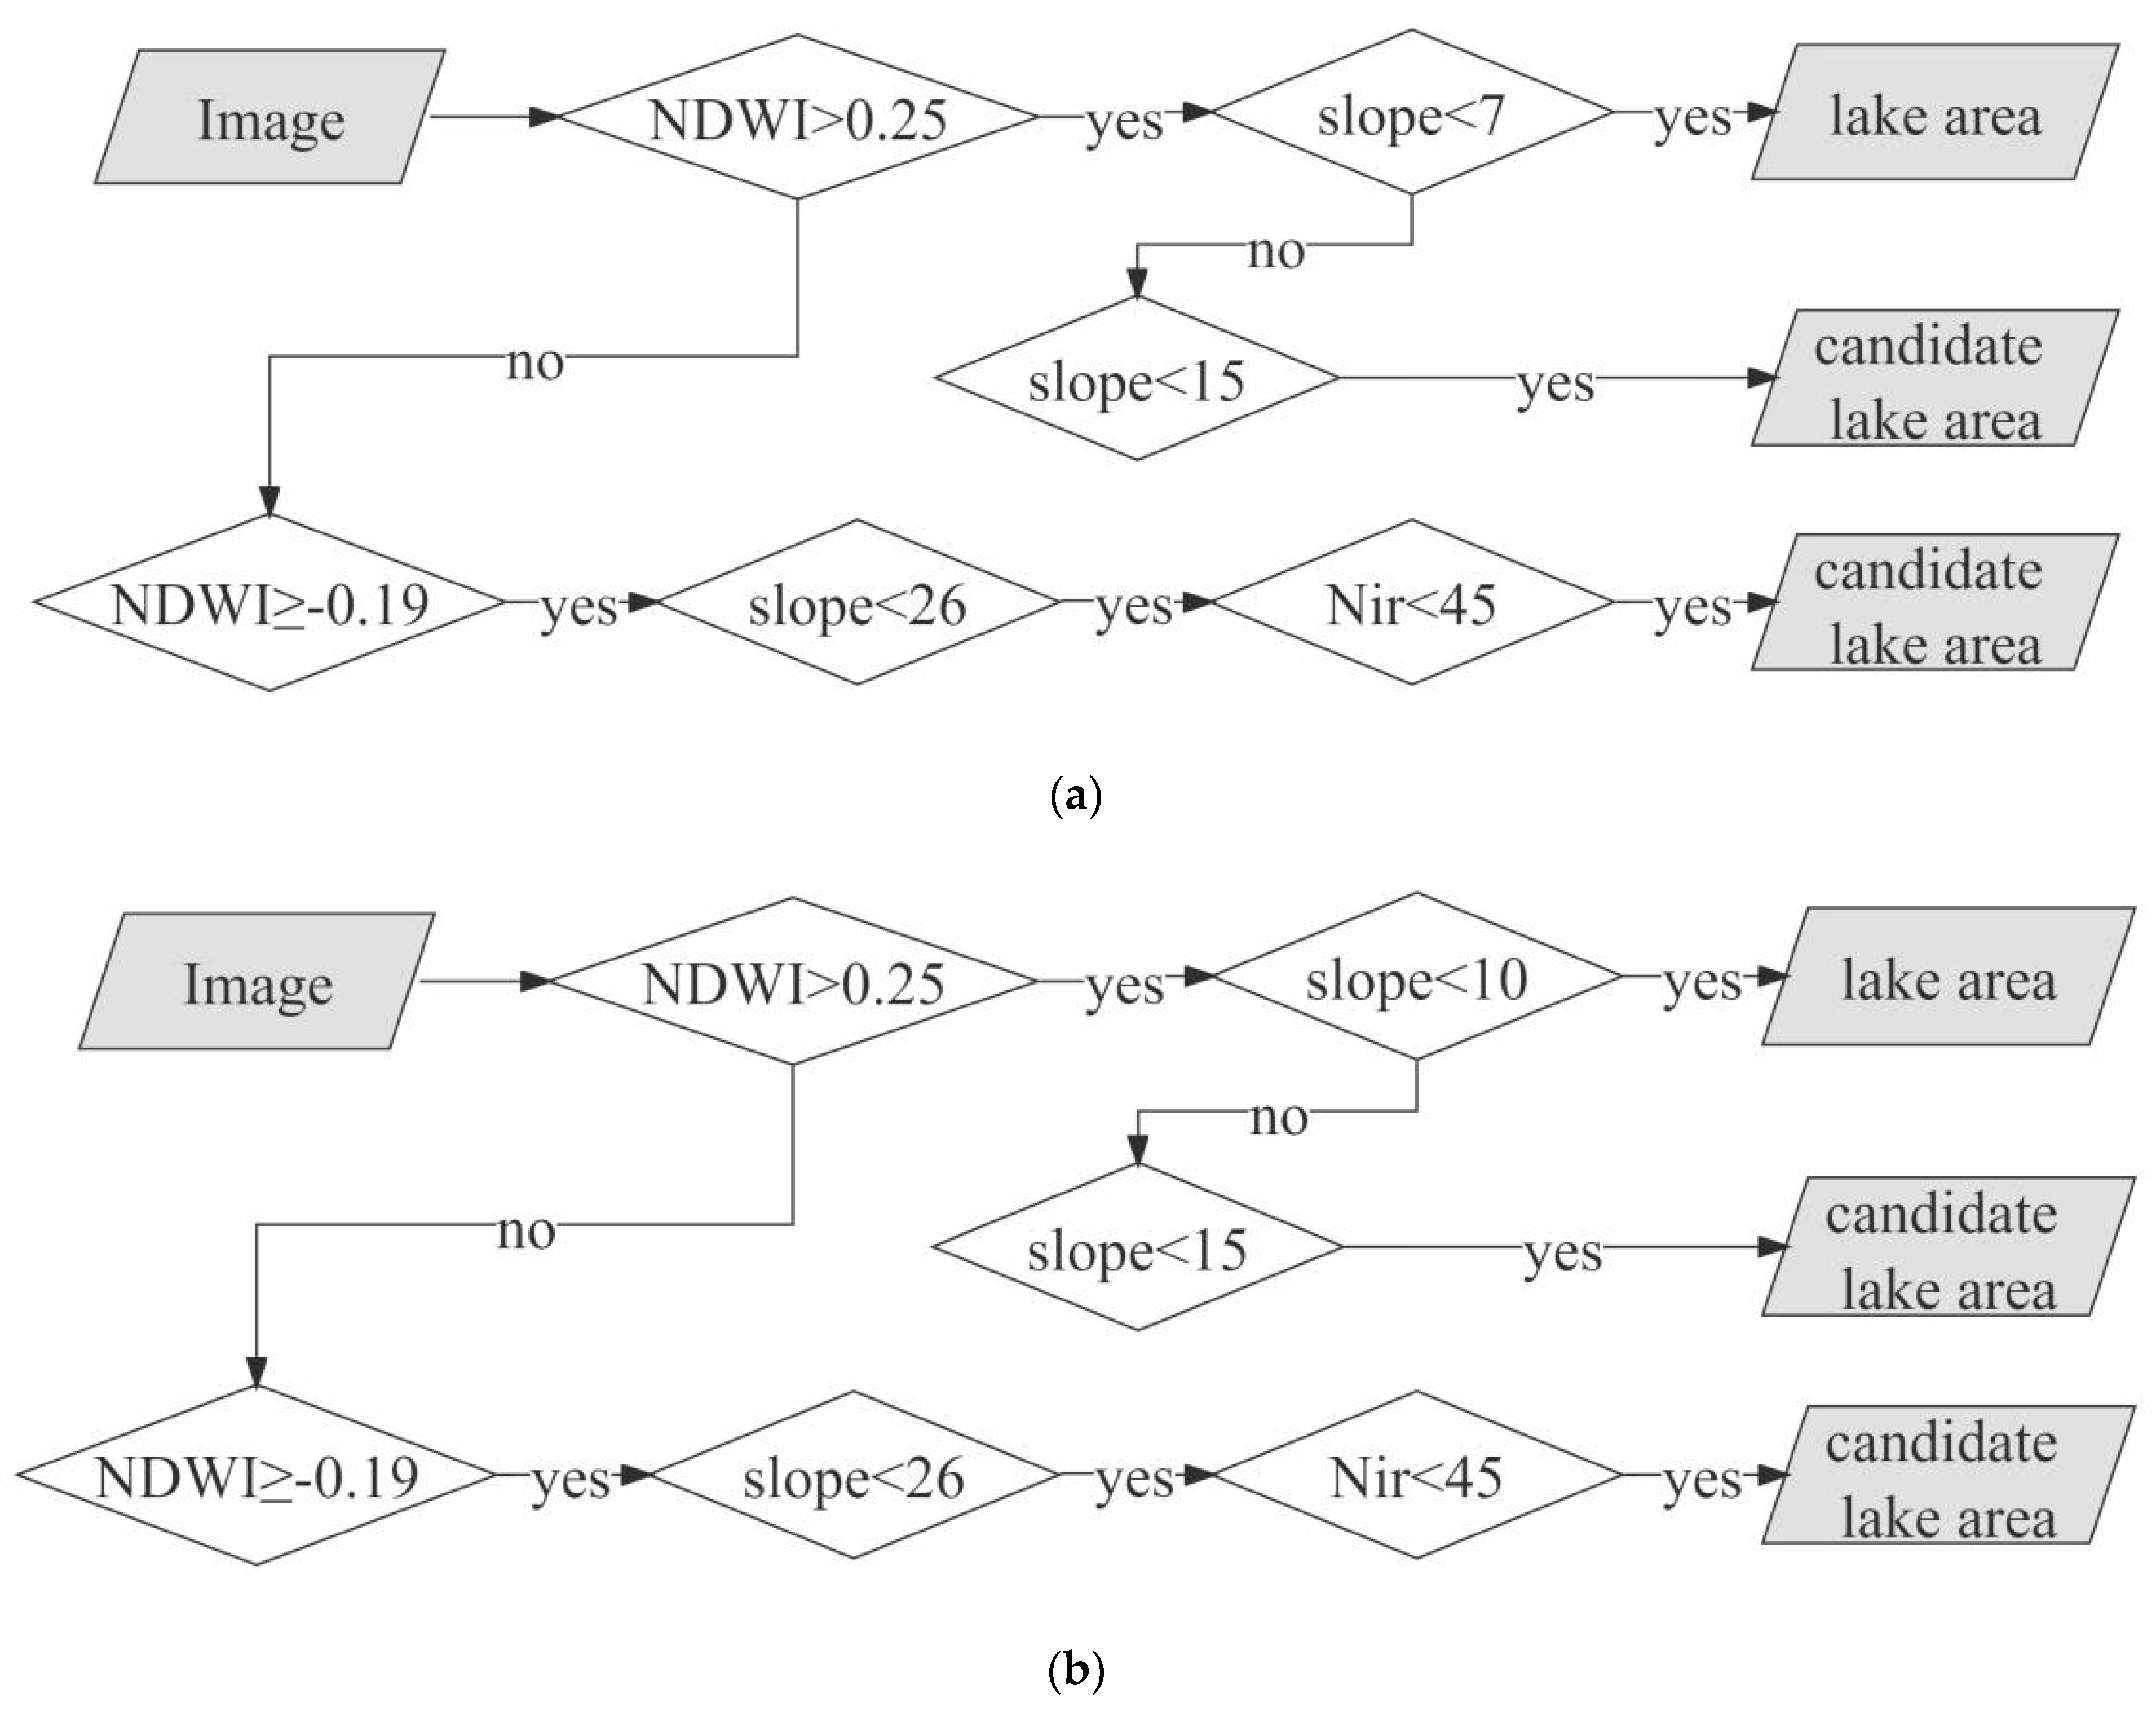
2.2.1. Feature Extraction: Selection of Seeds
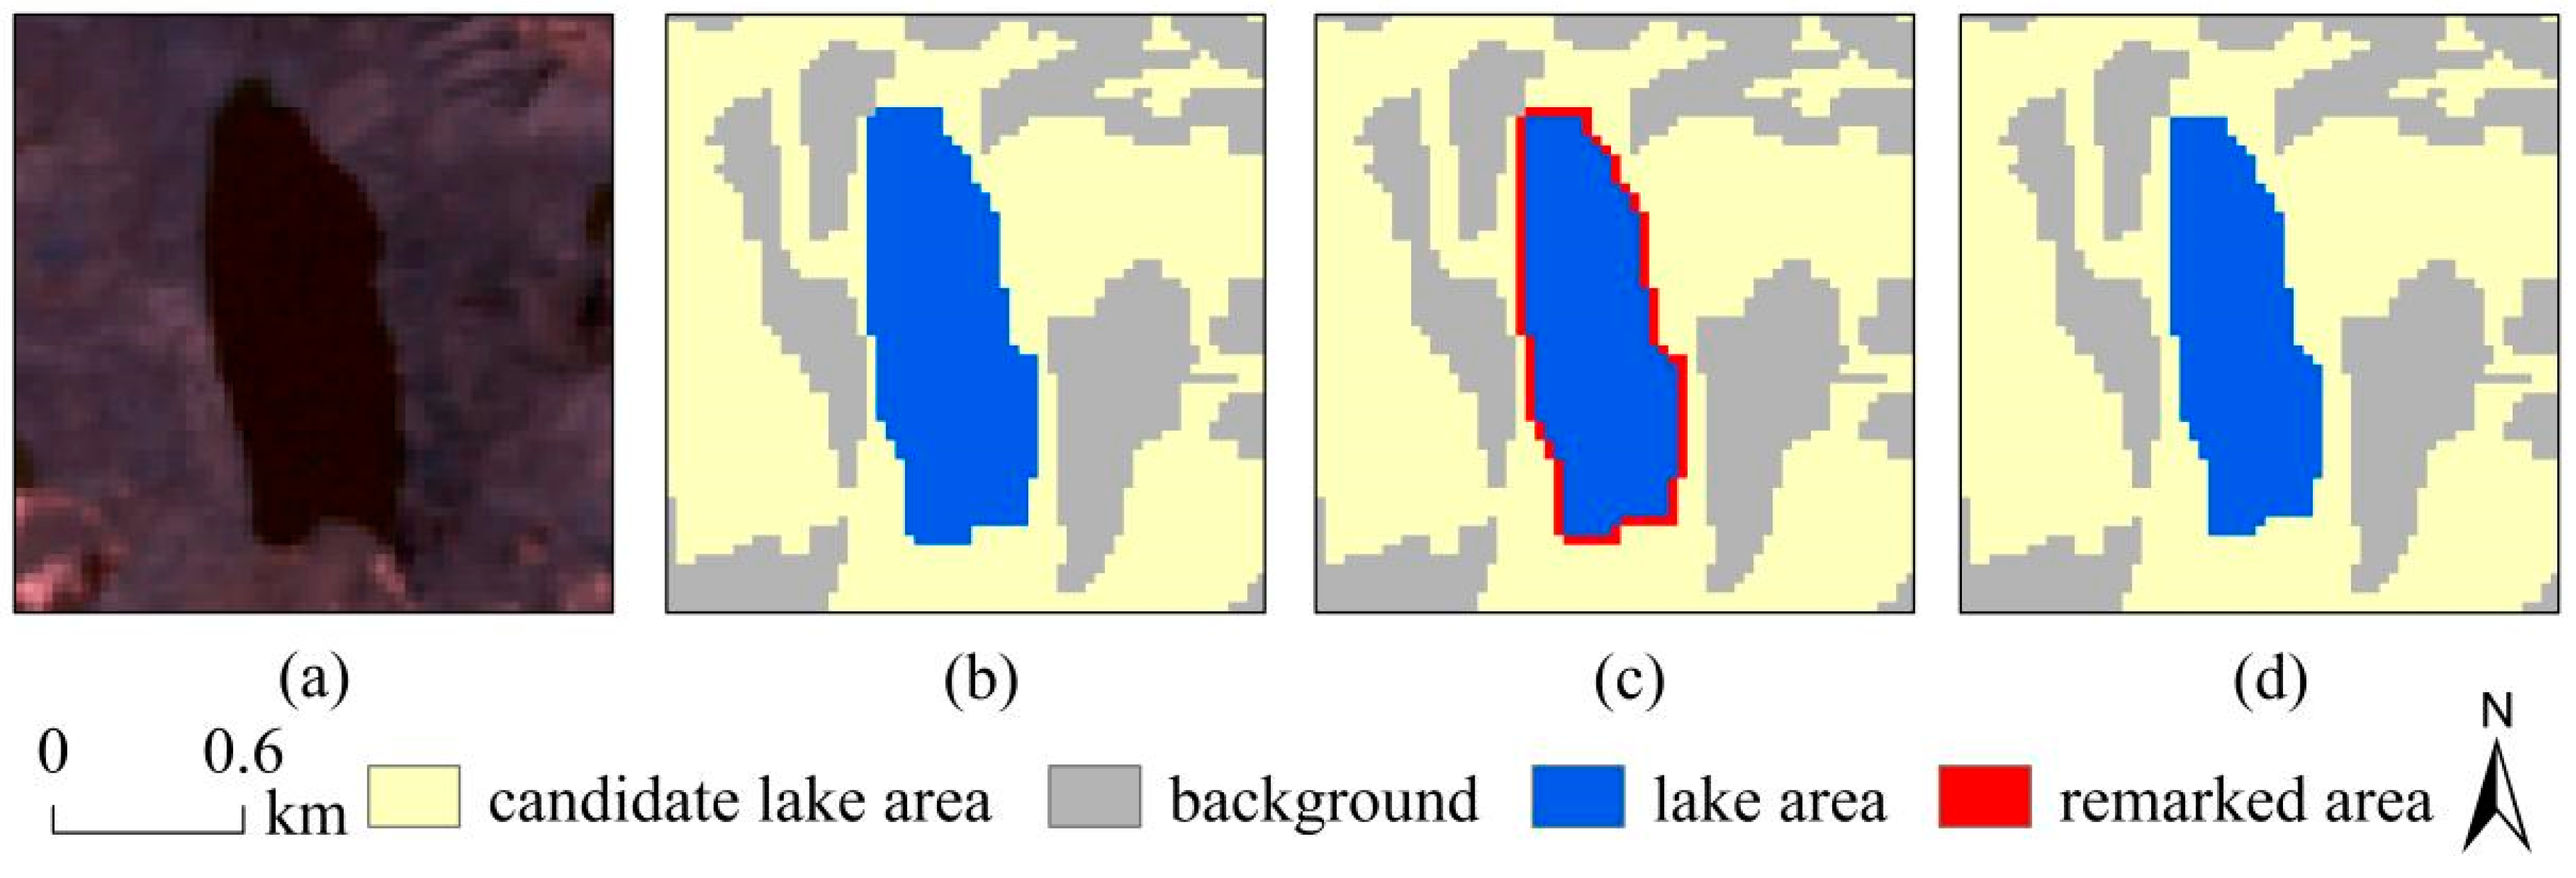
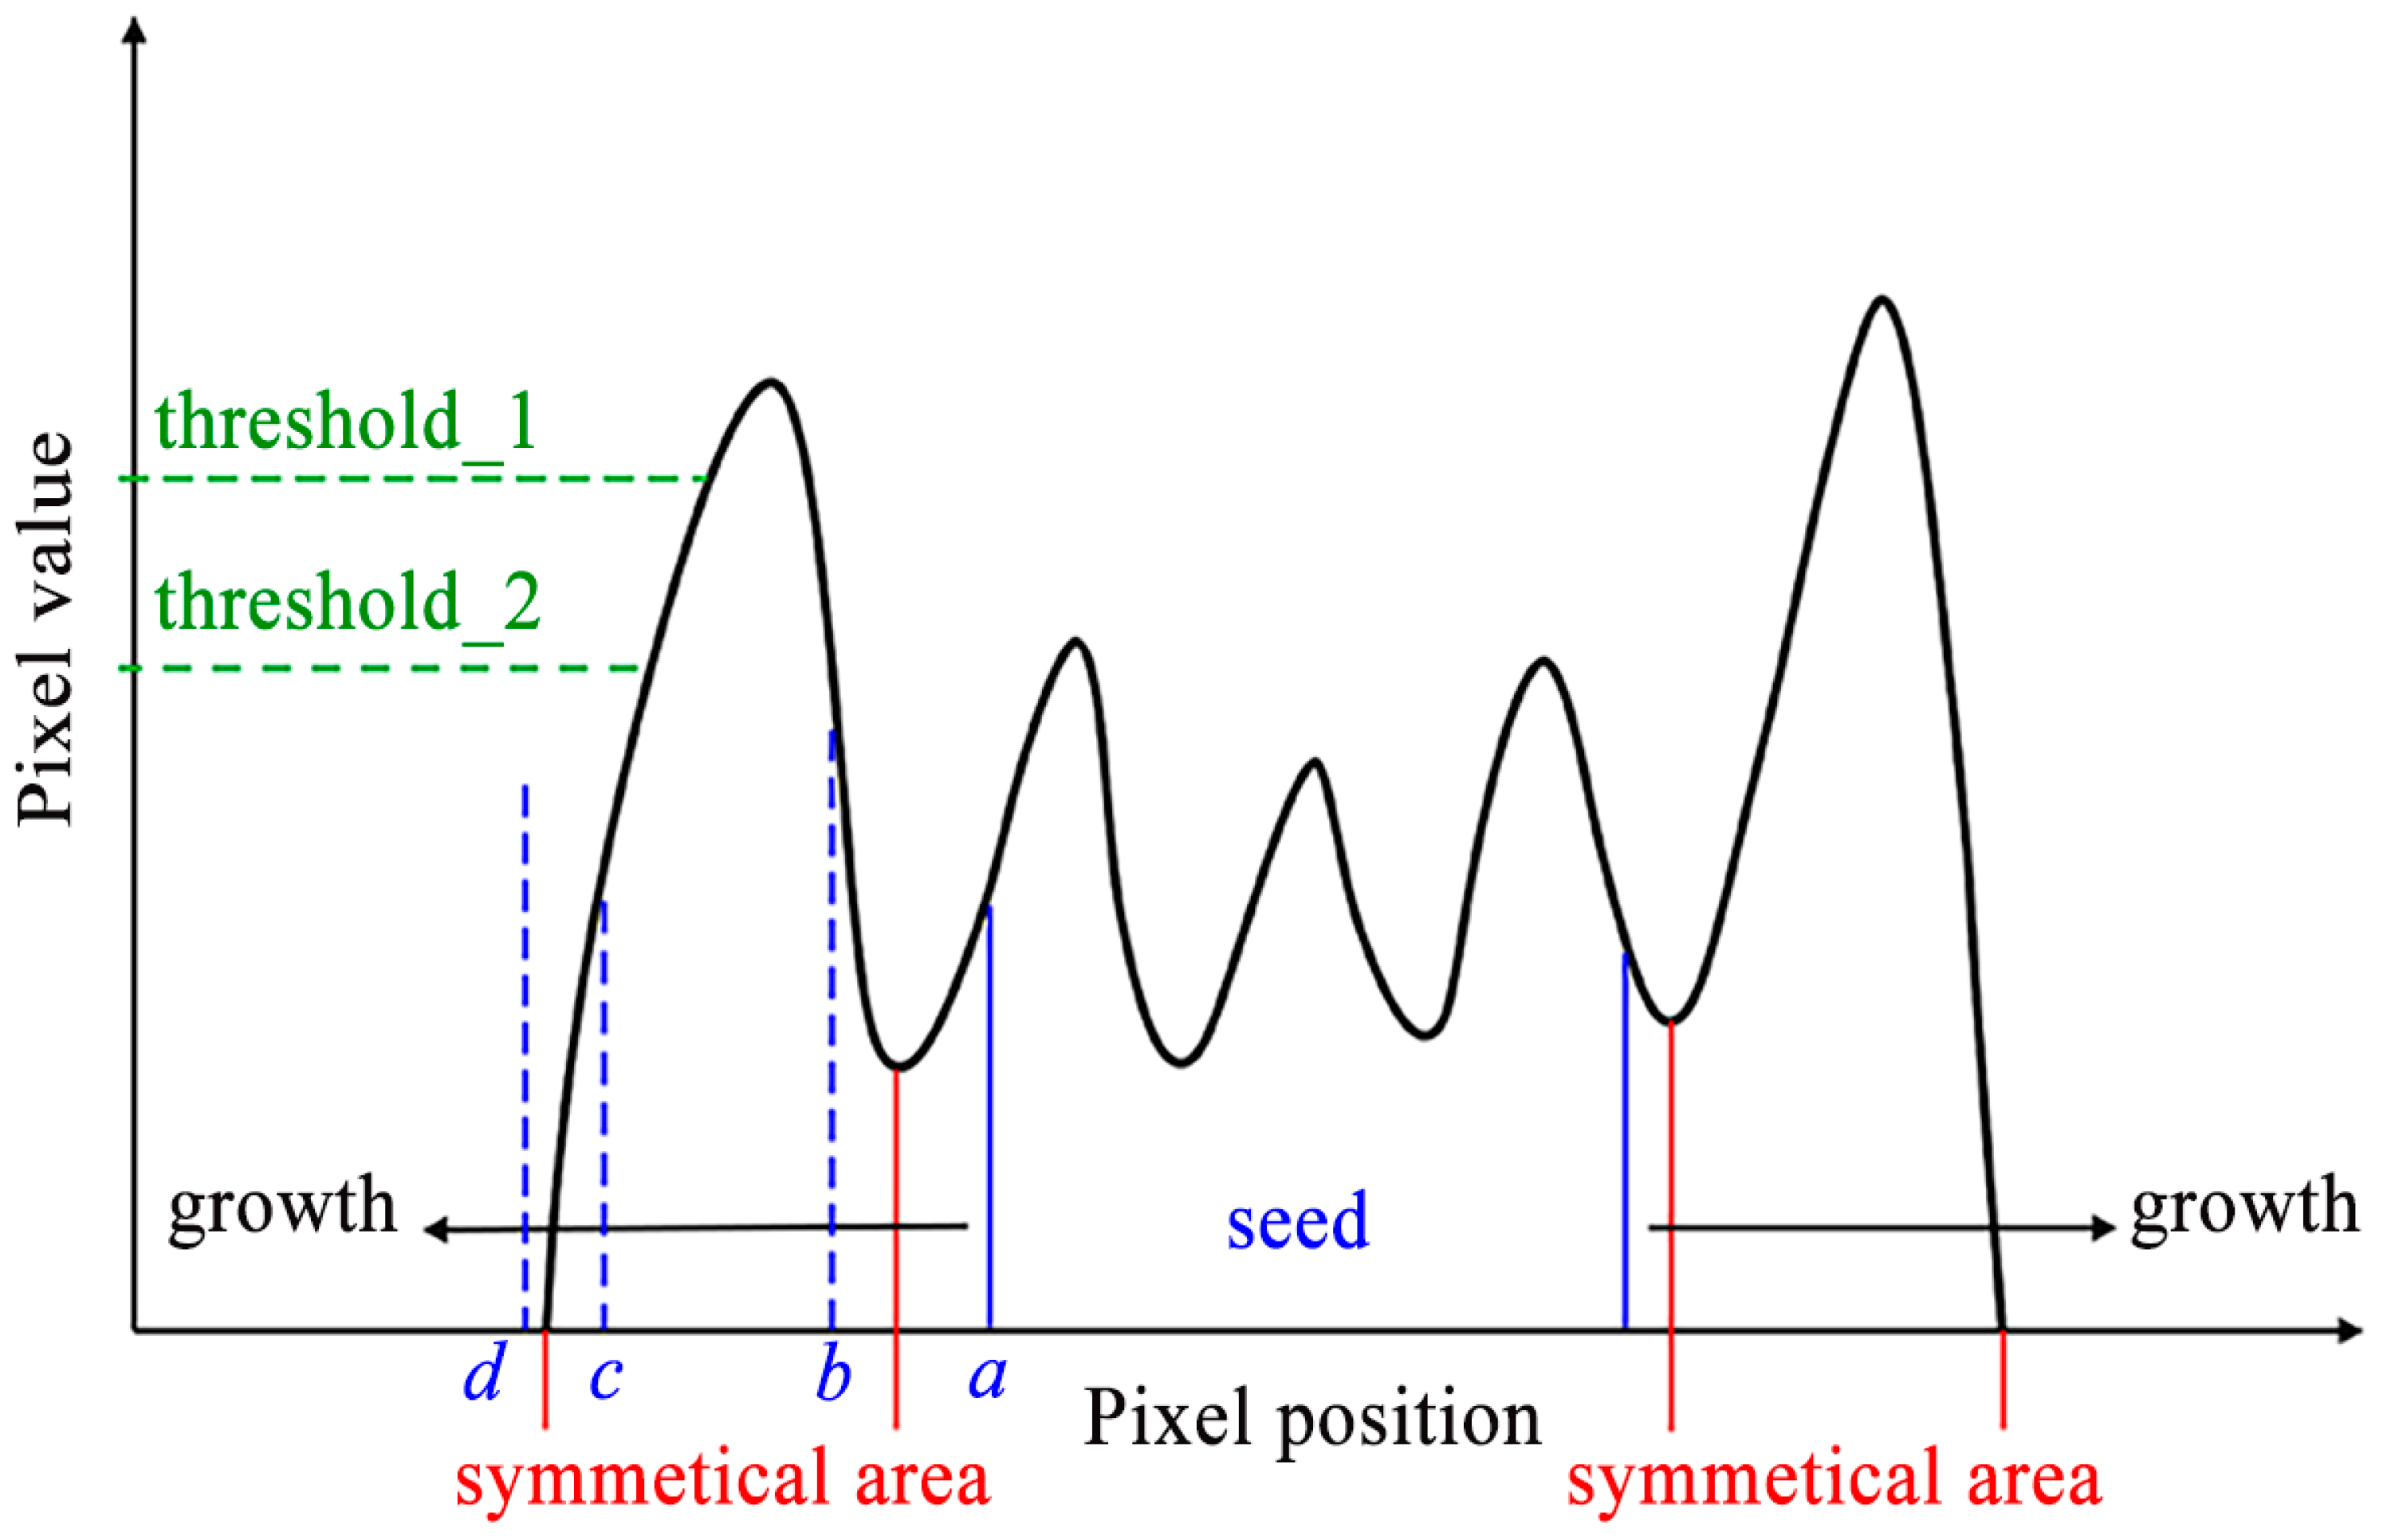
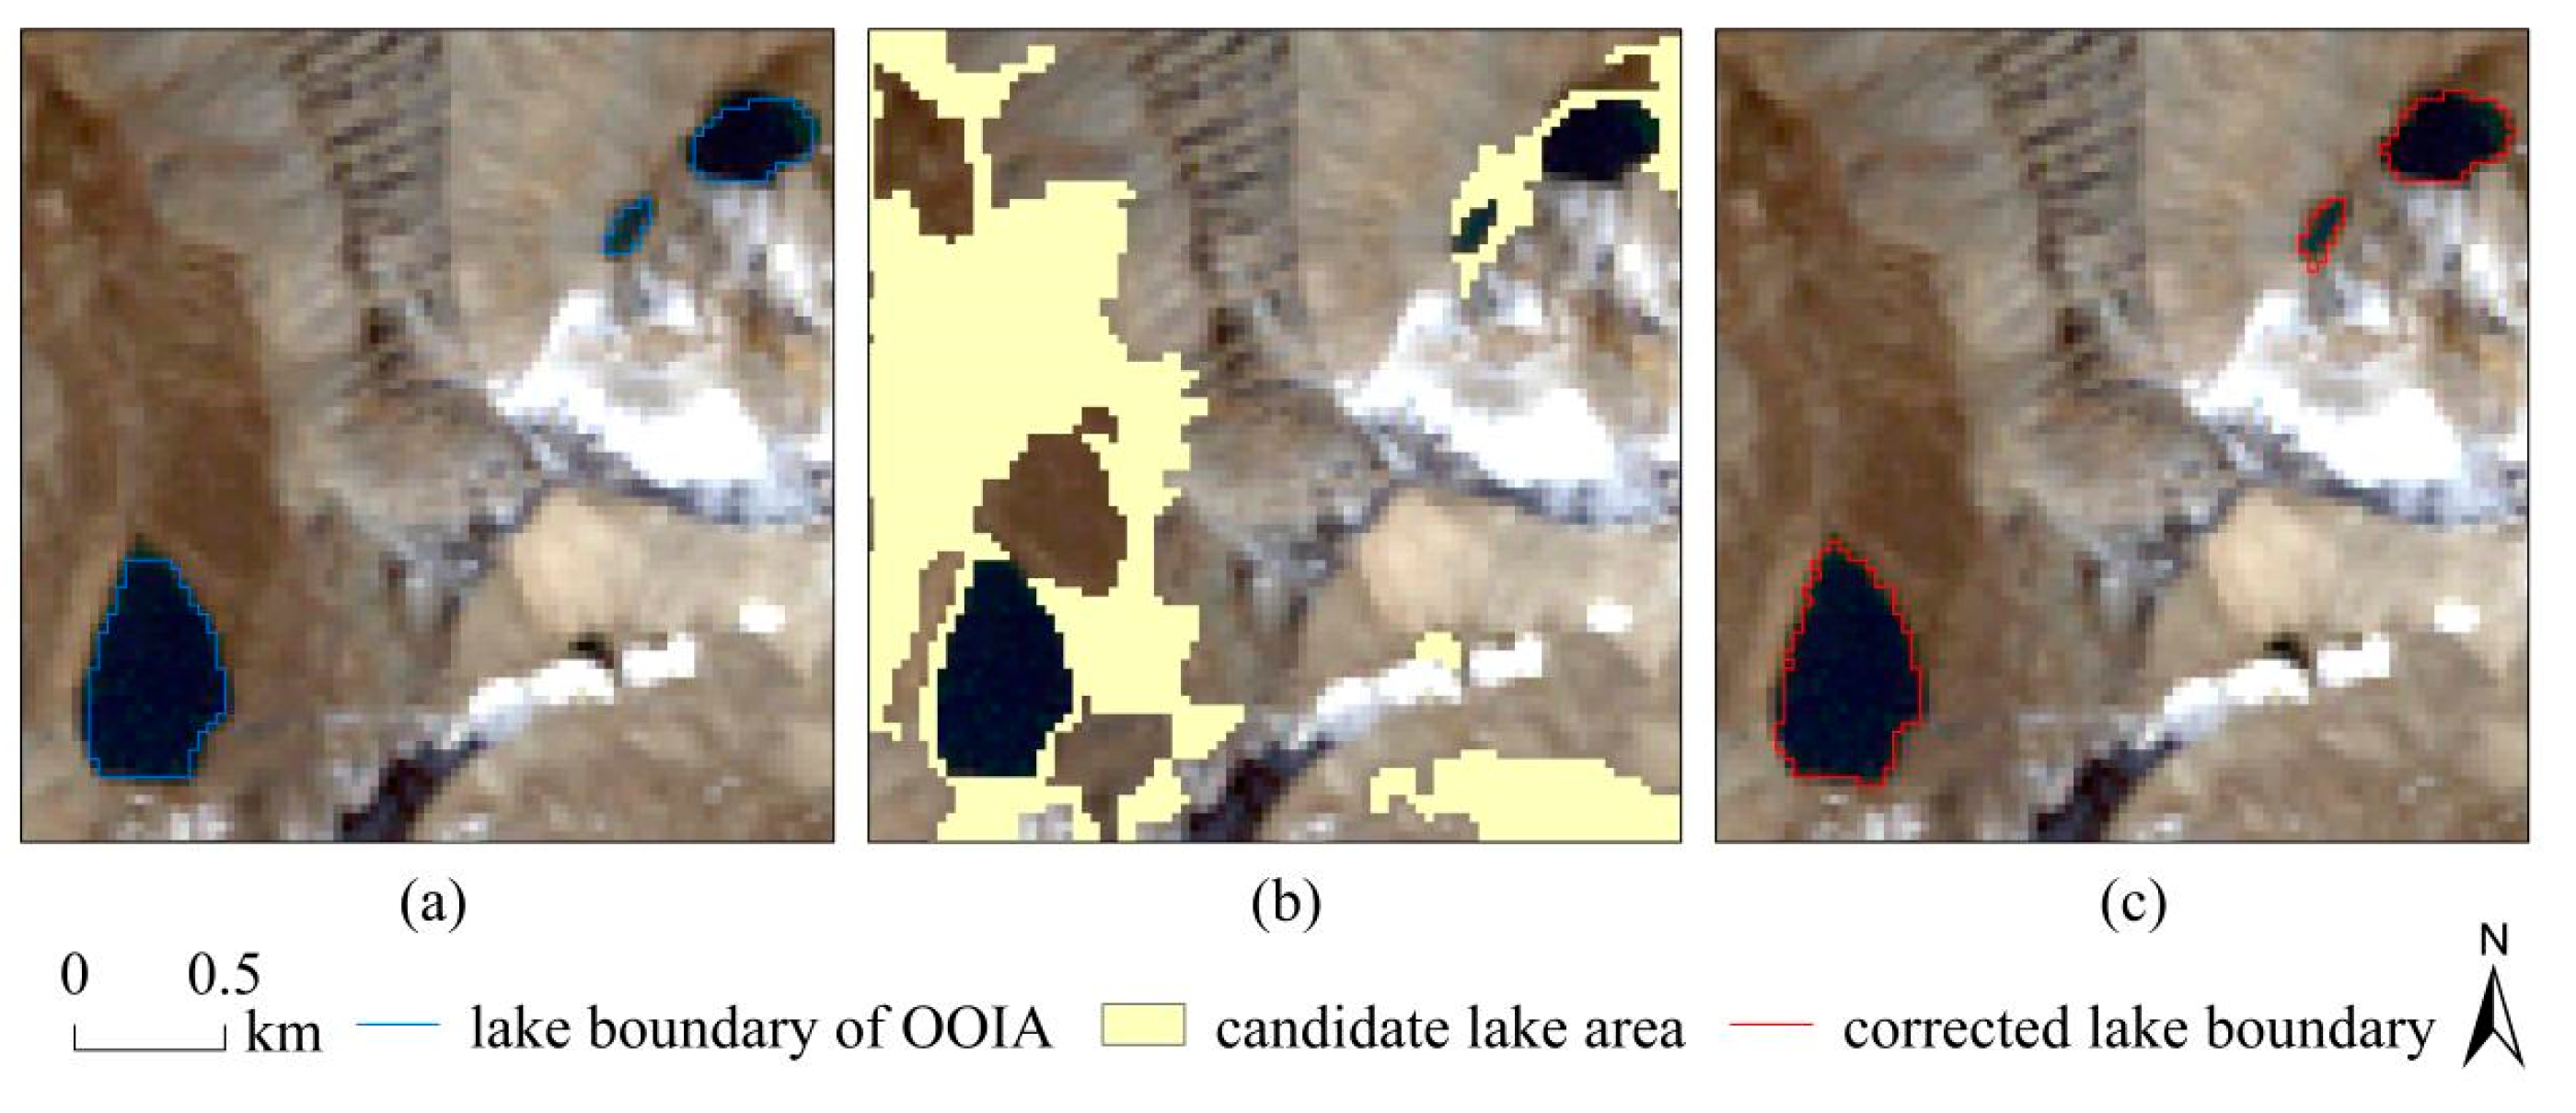
2.2.2. Post Classification: Correction of Boundary
2.3. Setting of Parameters
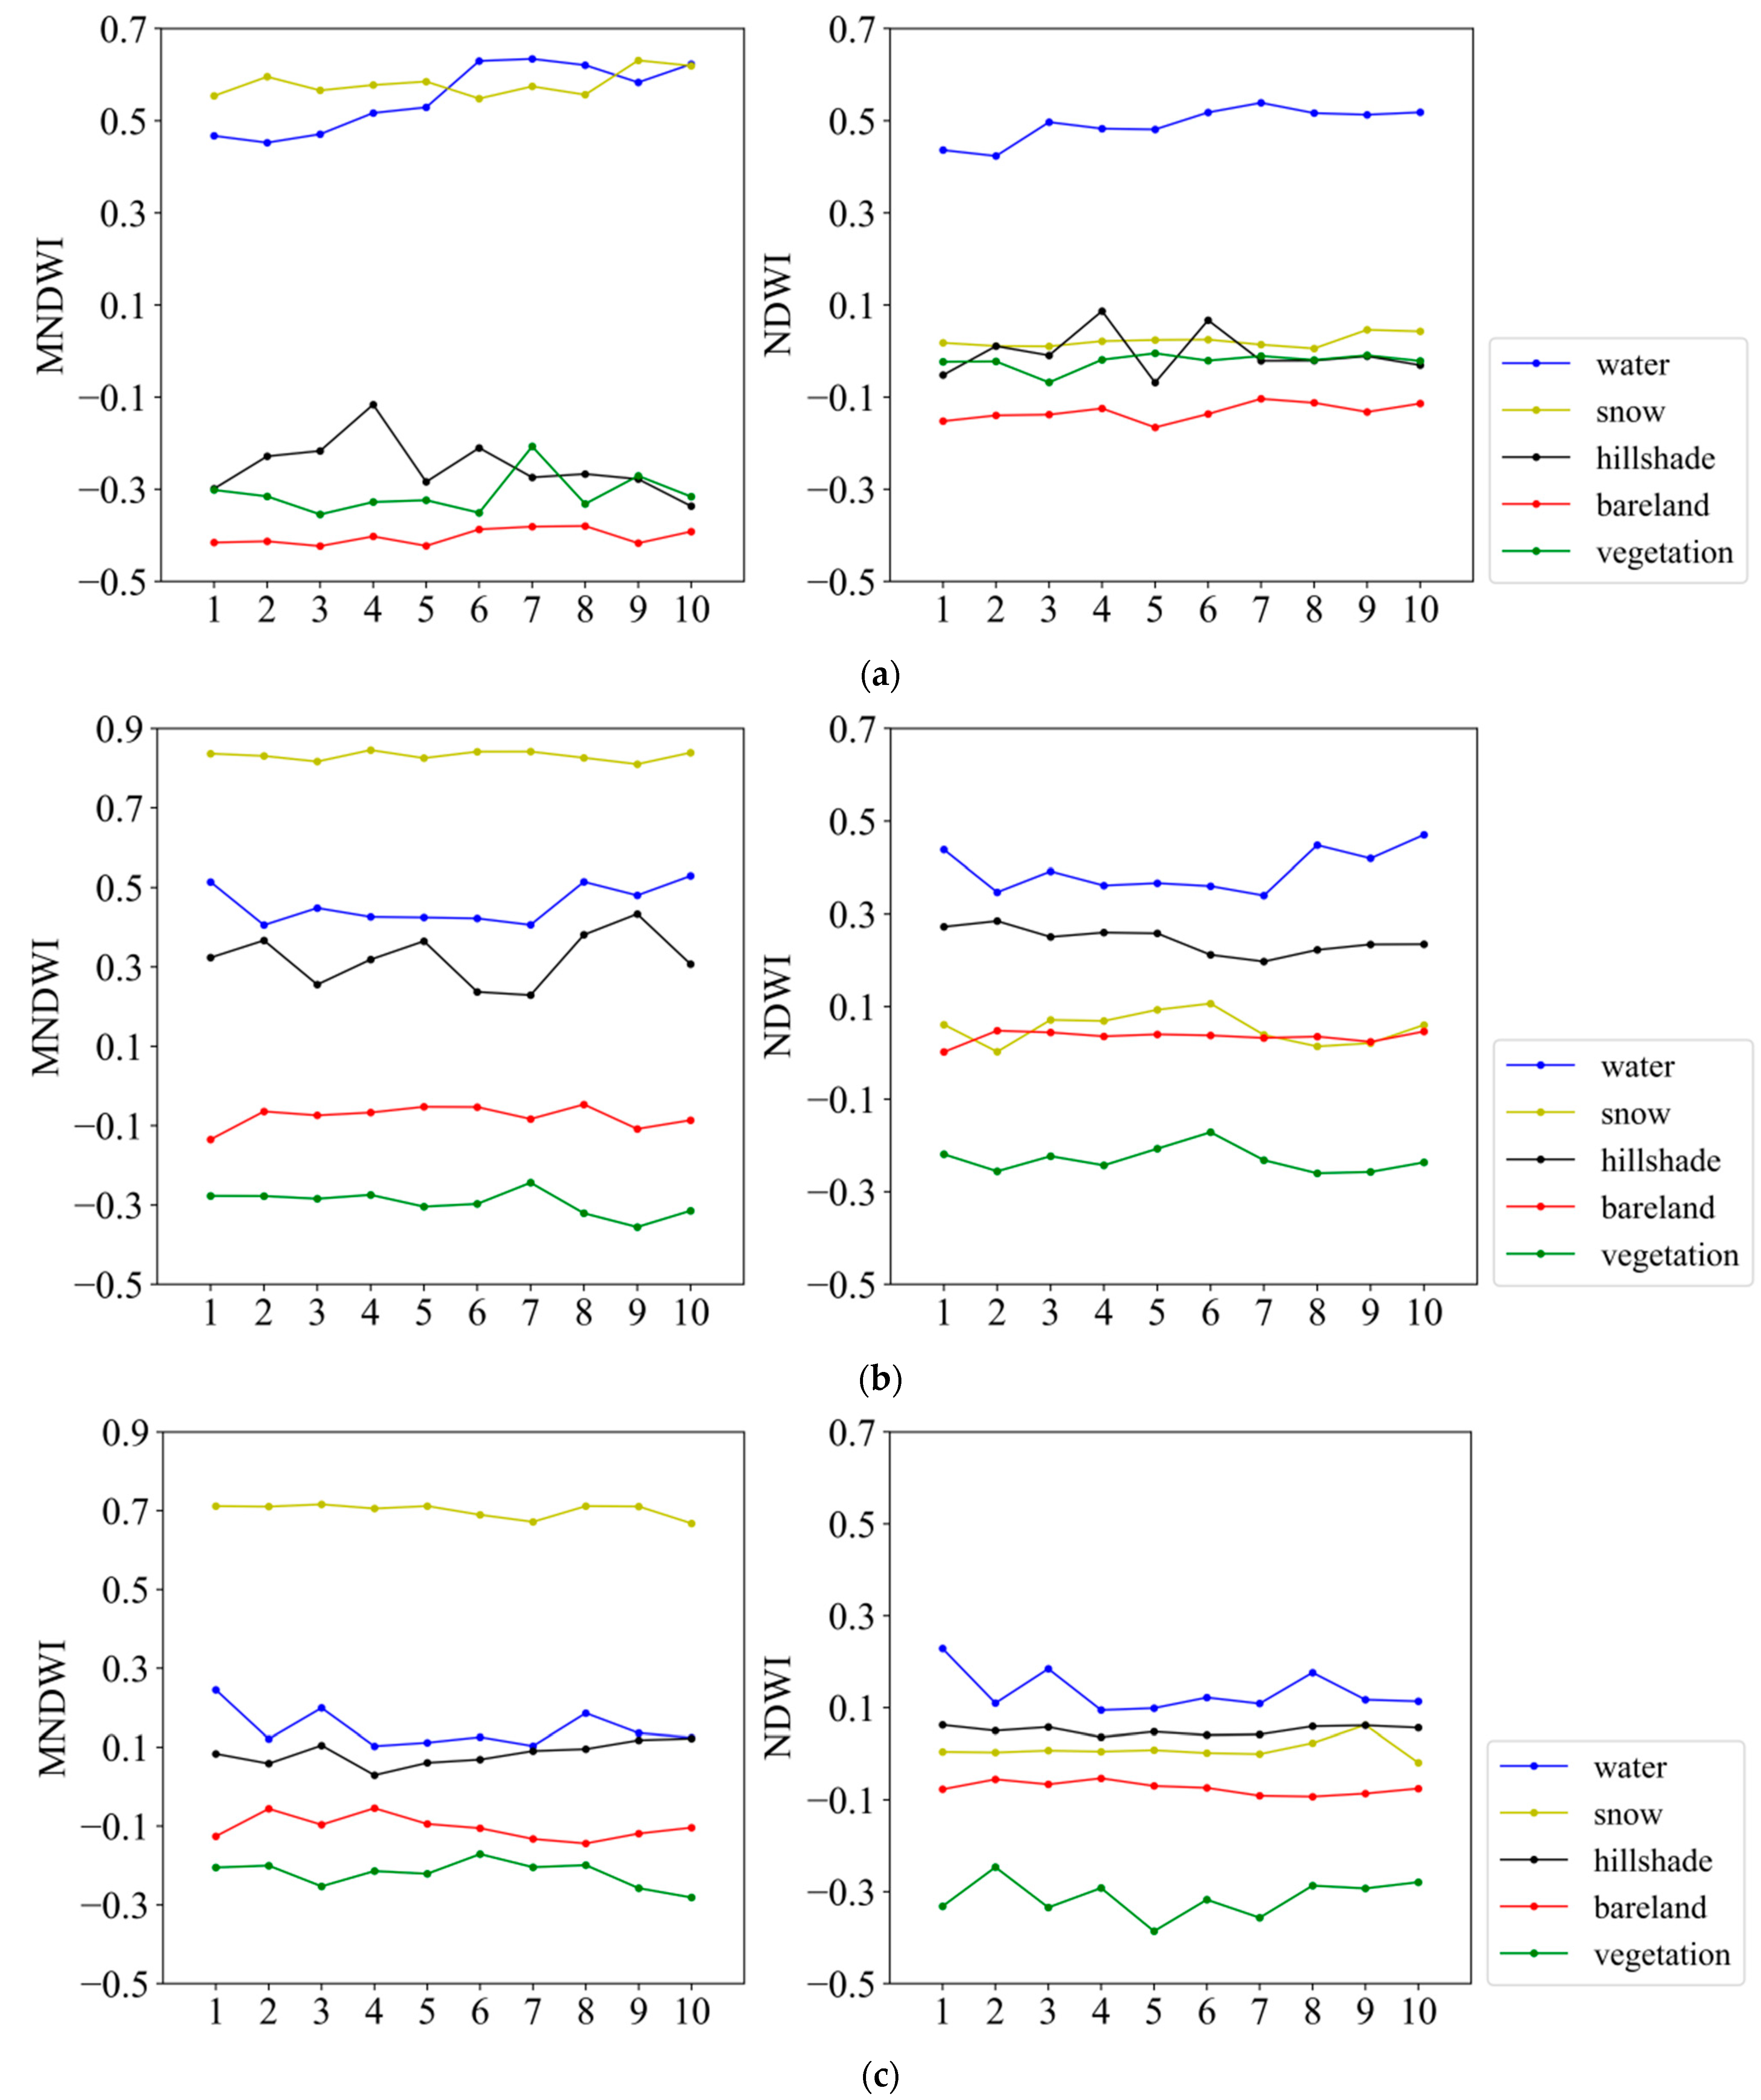
2.3.1. Water Index in Feature Rule Set
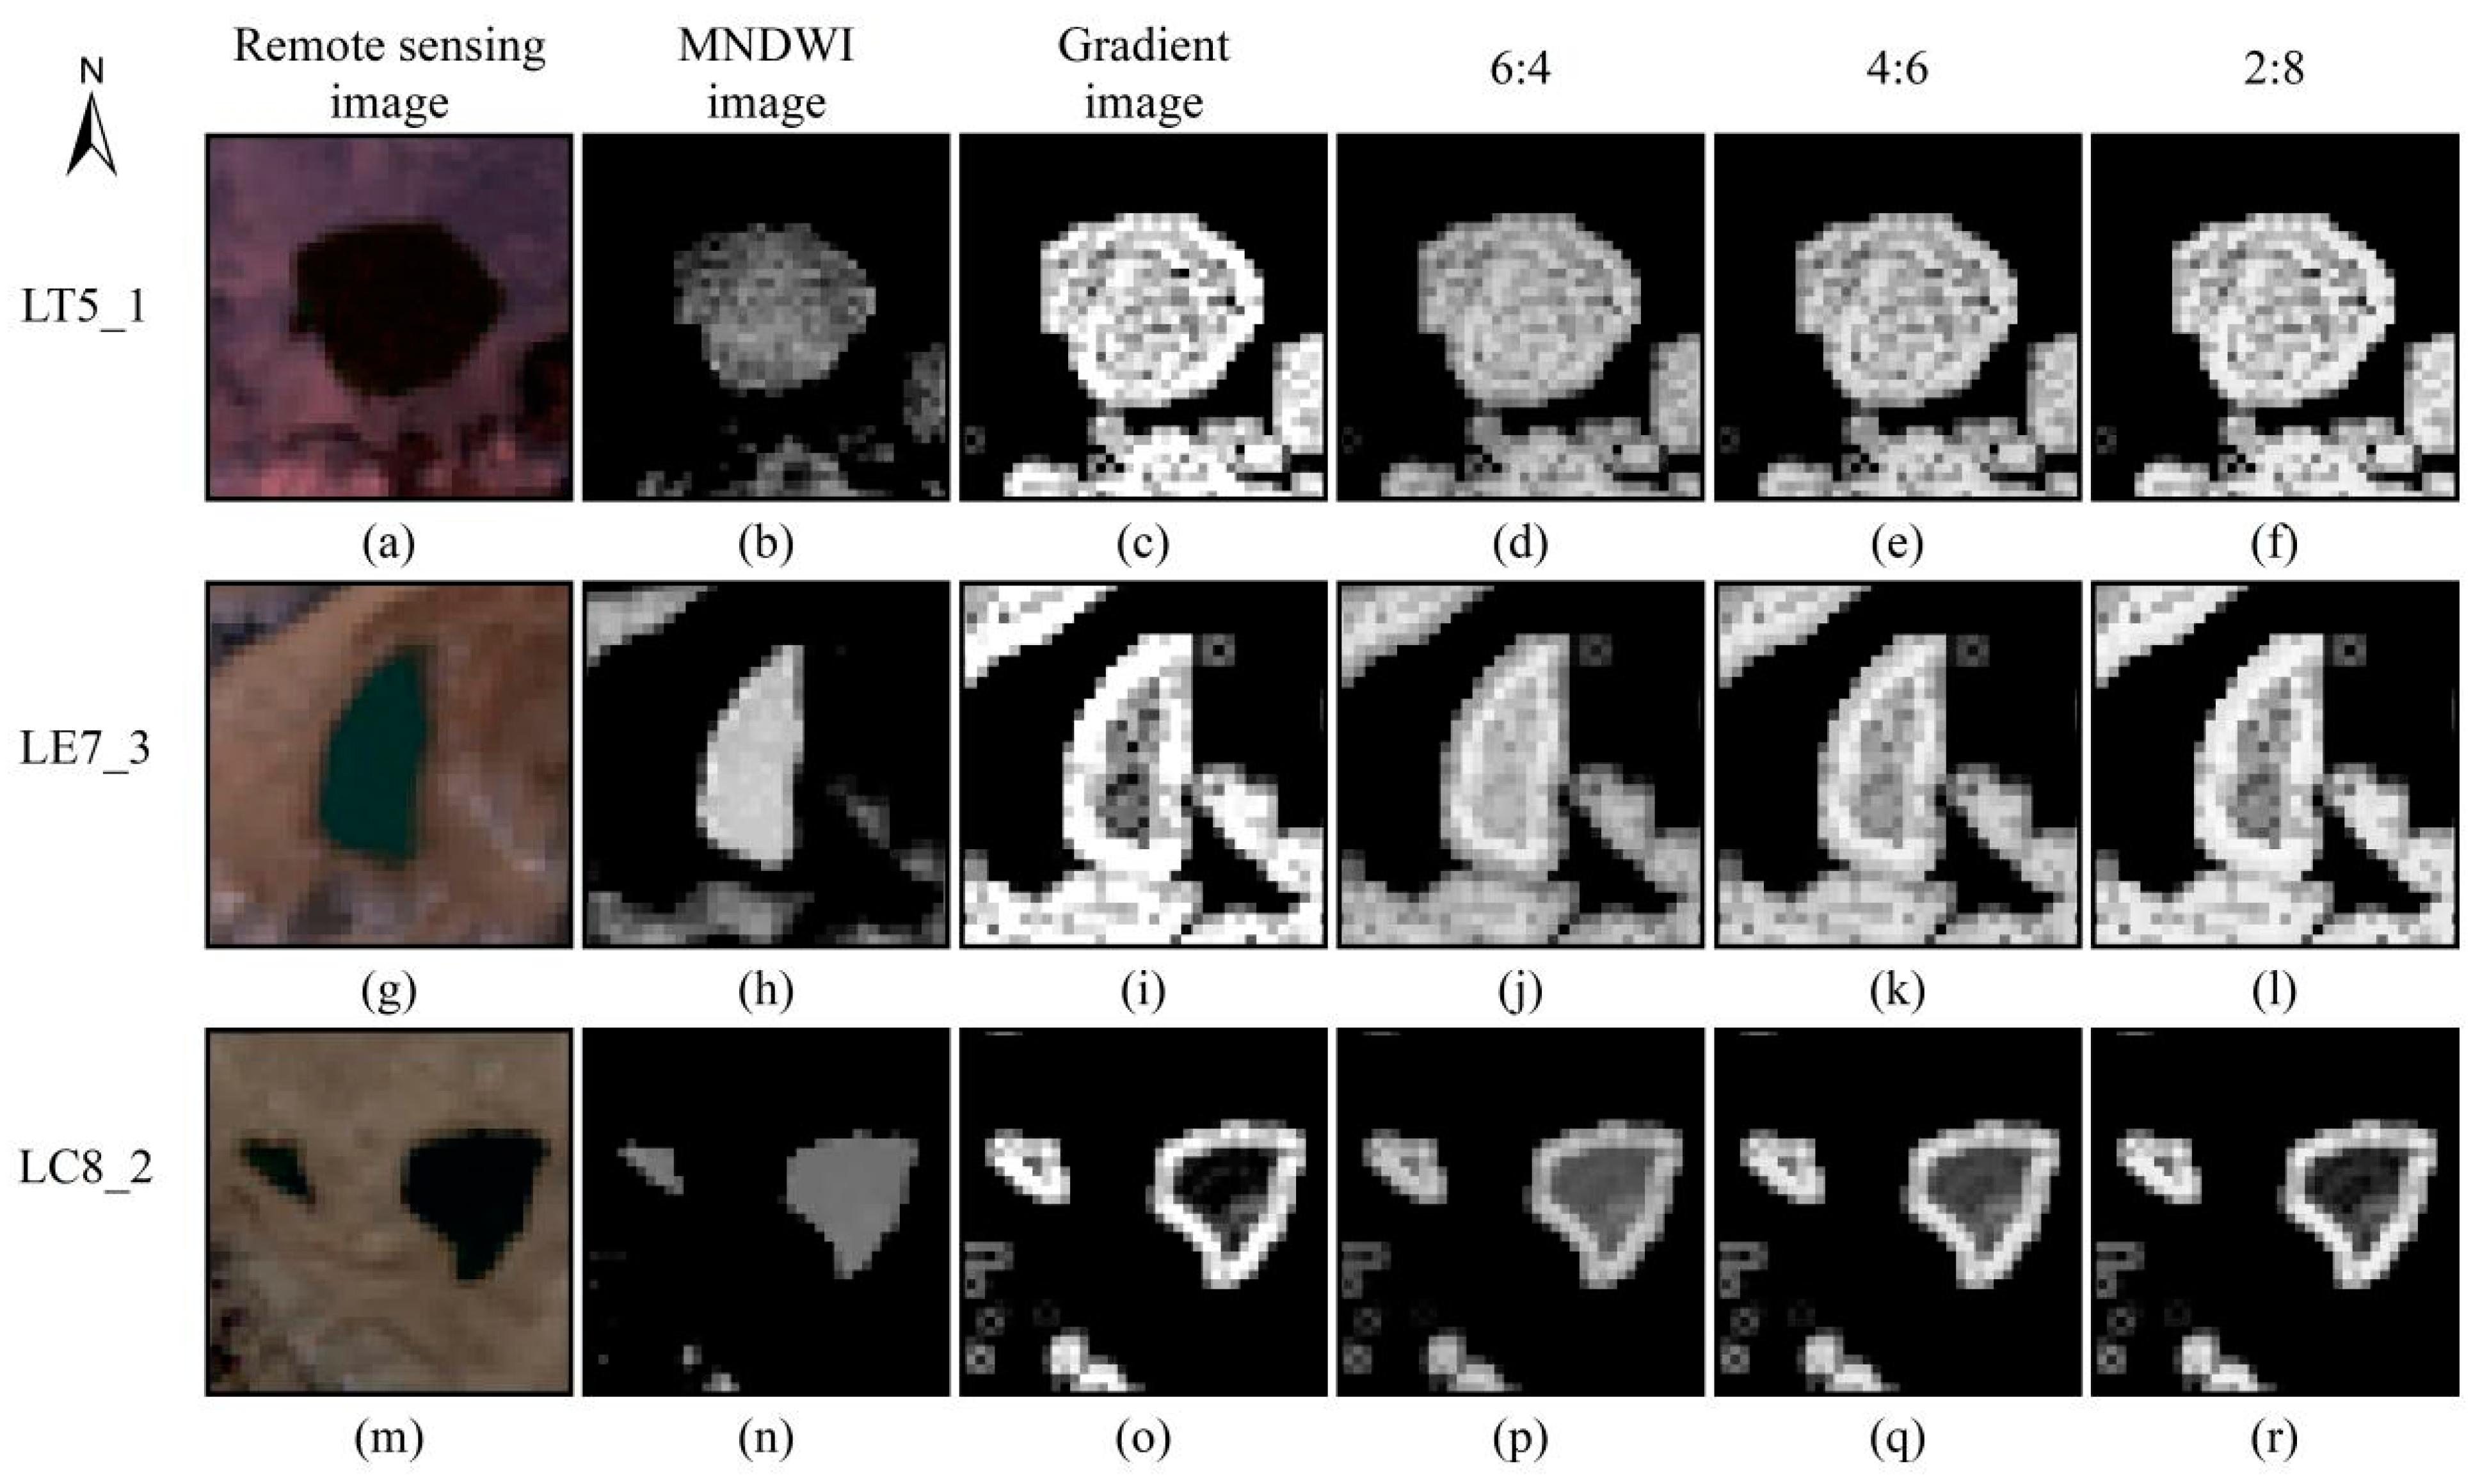
2.3.2. Water Index Image for Image Merging
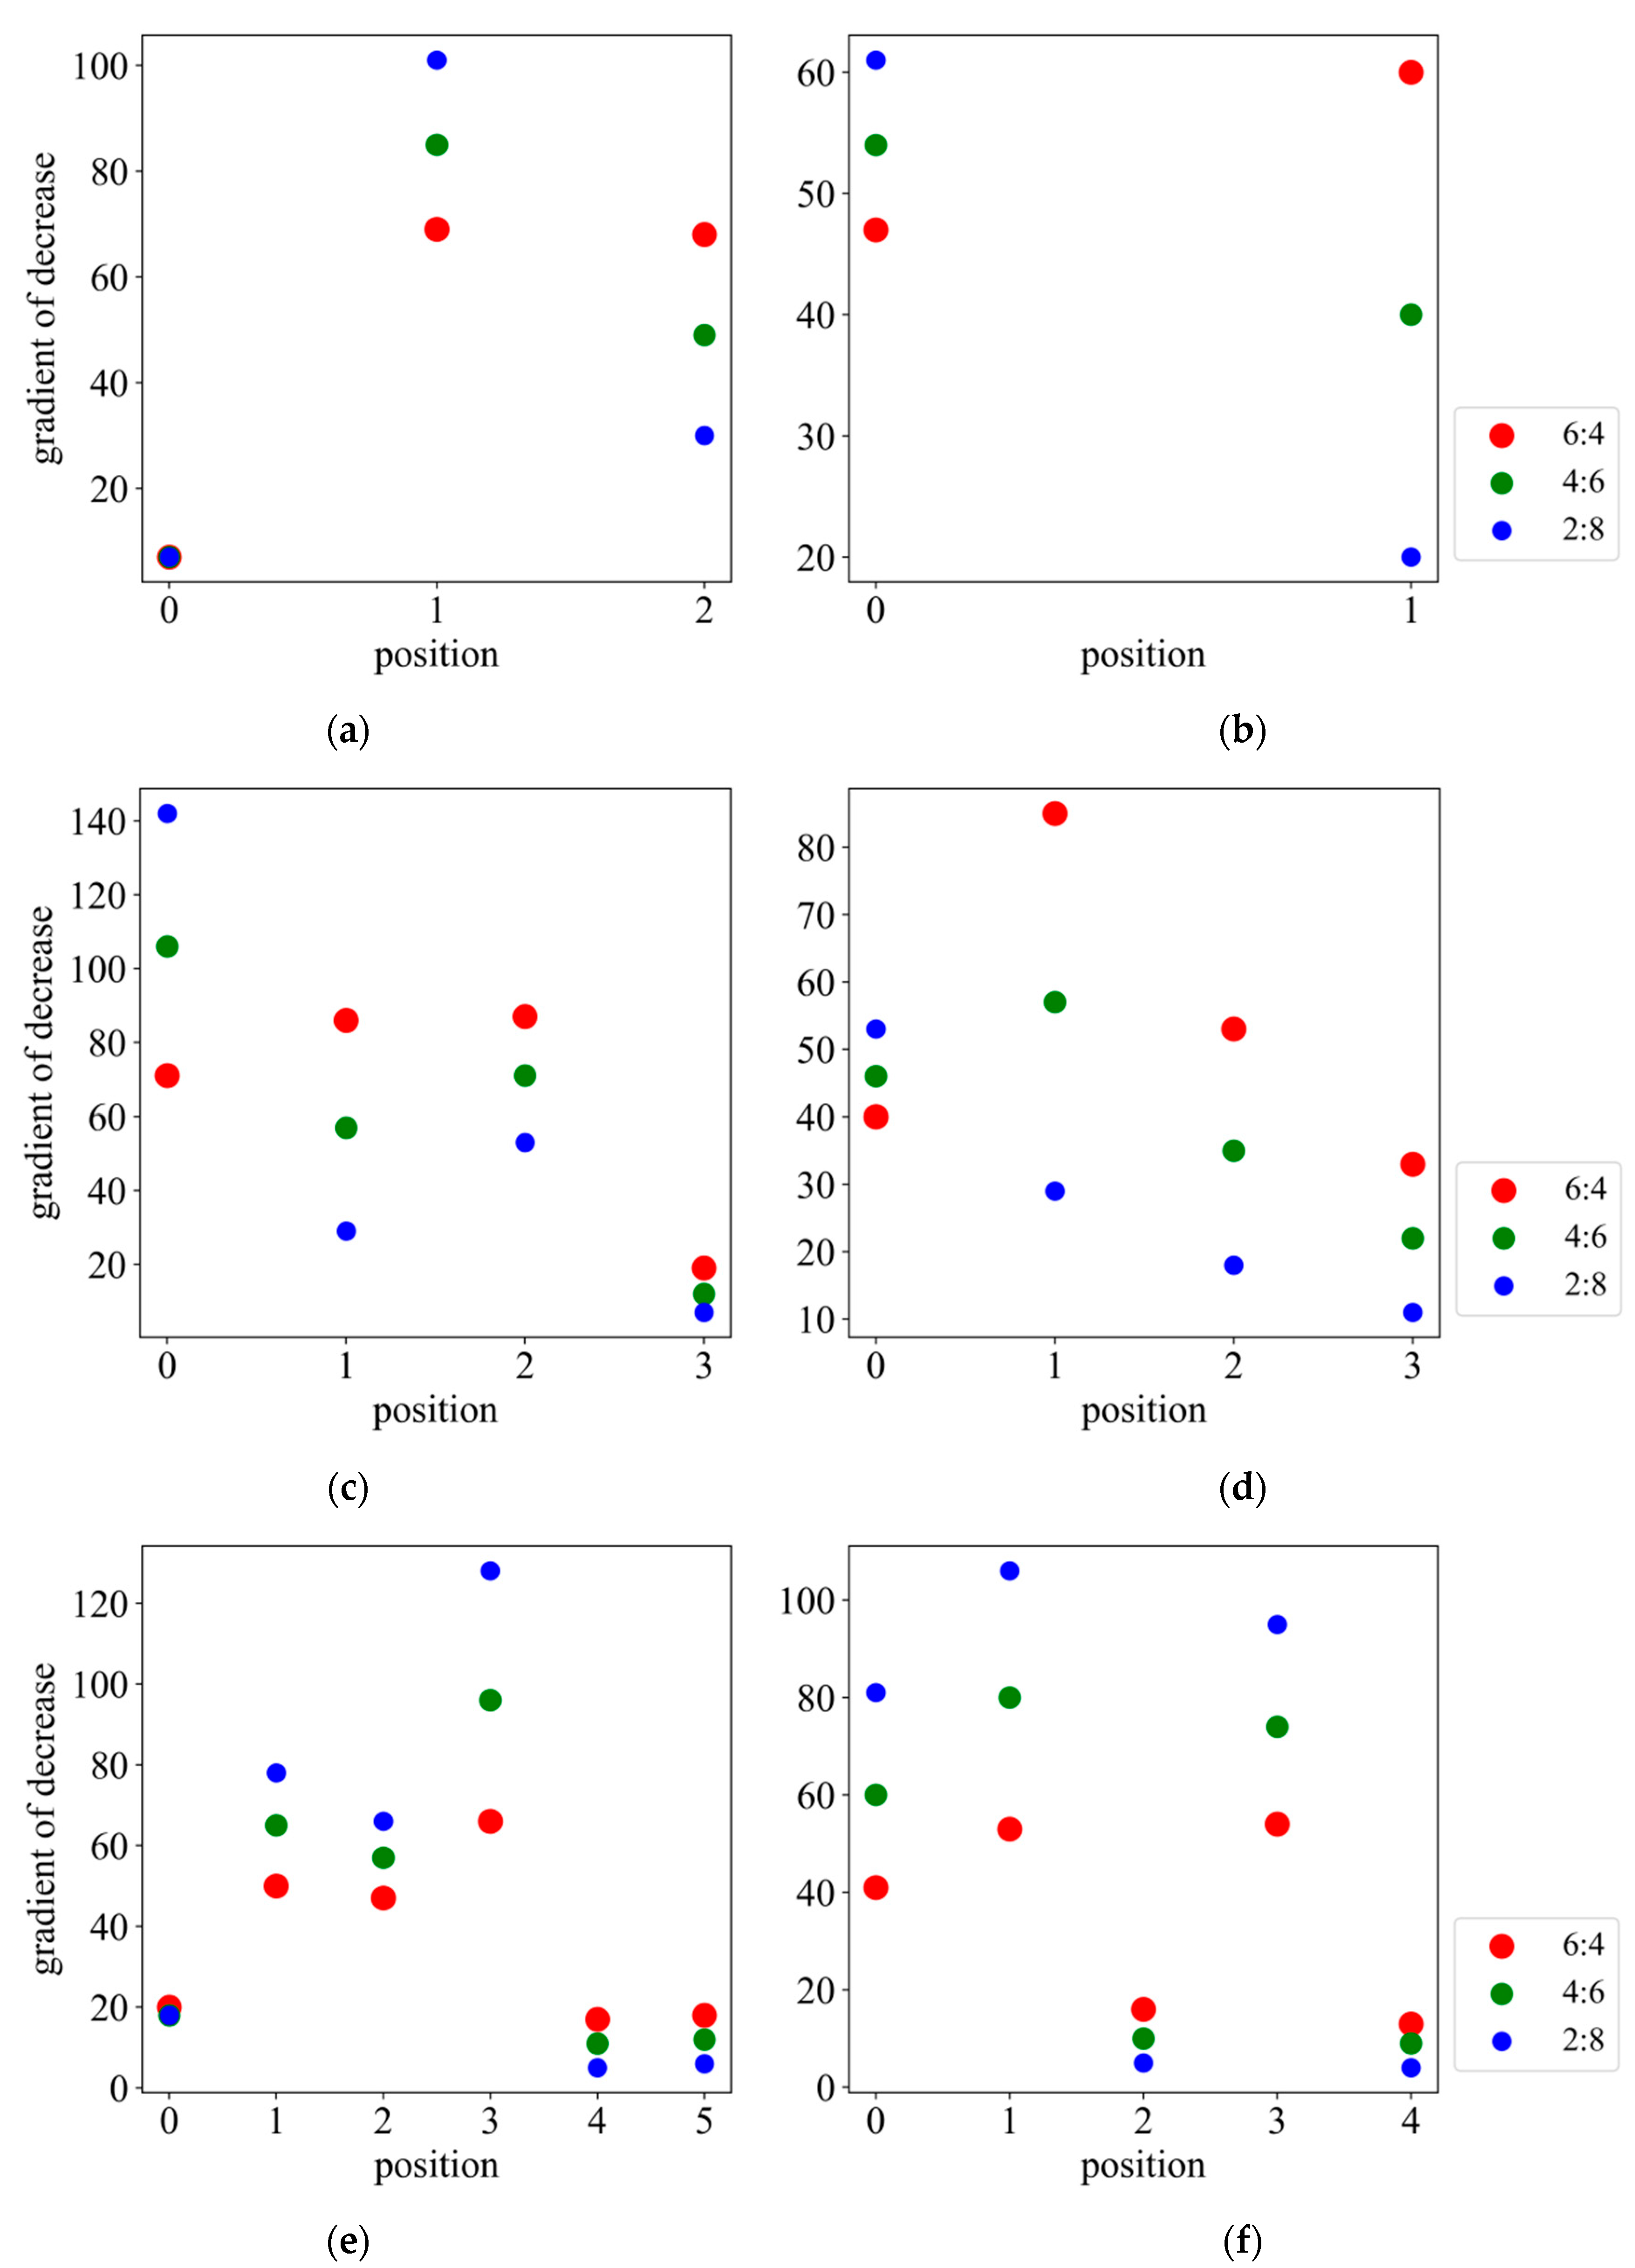
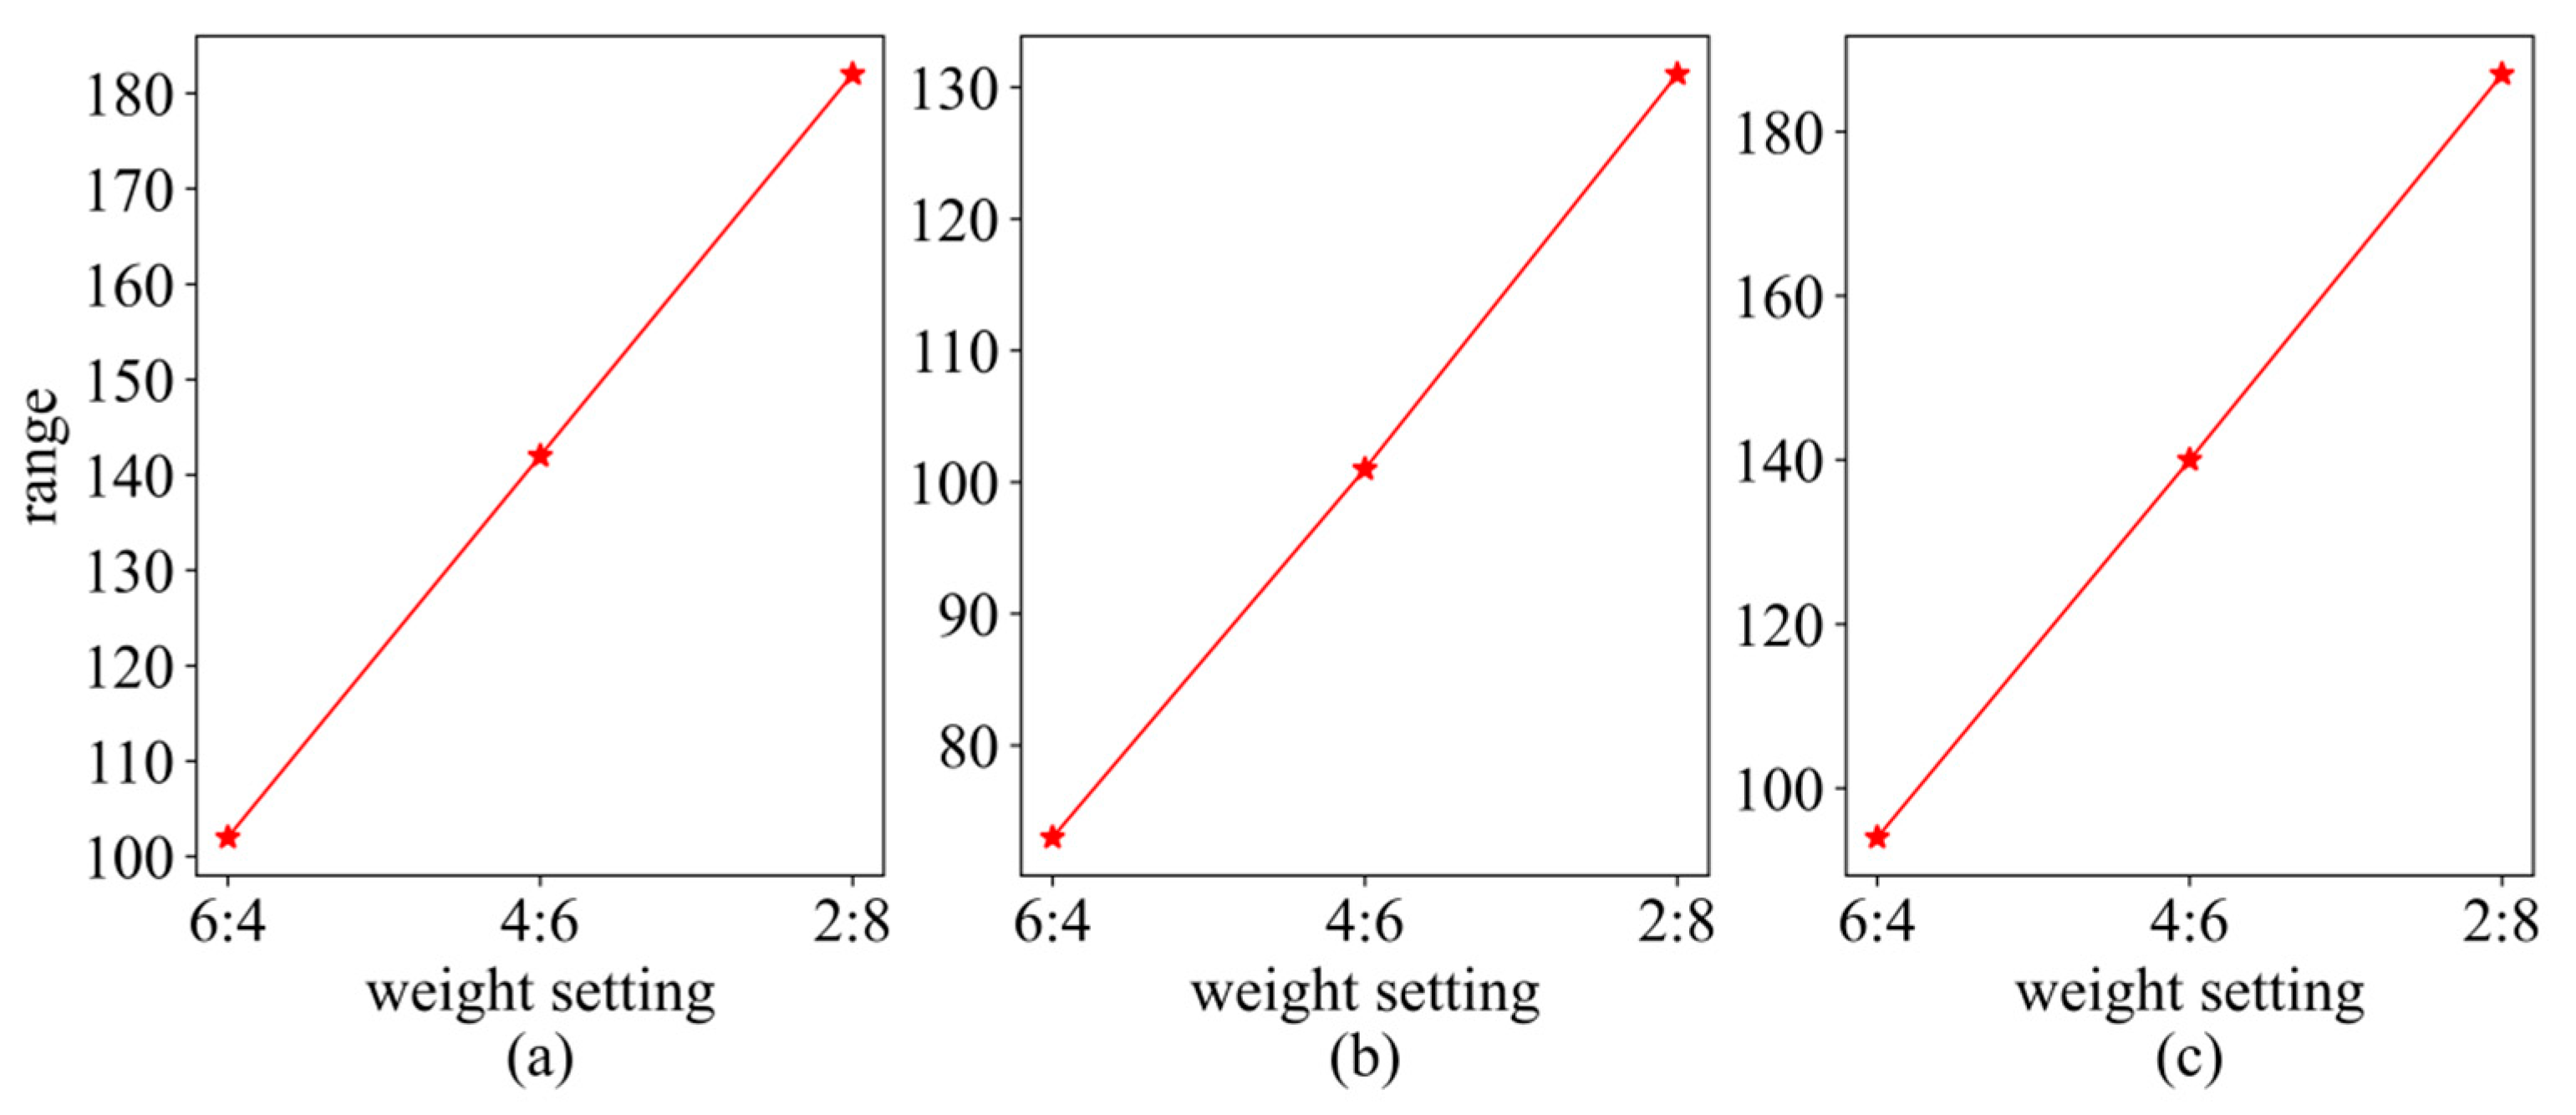
2.3.3. Weight of Image Merging
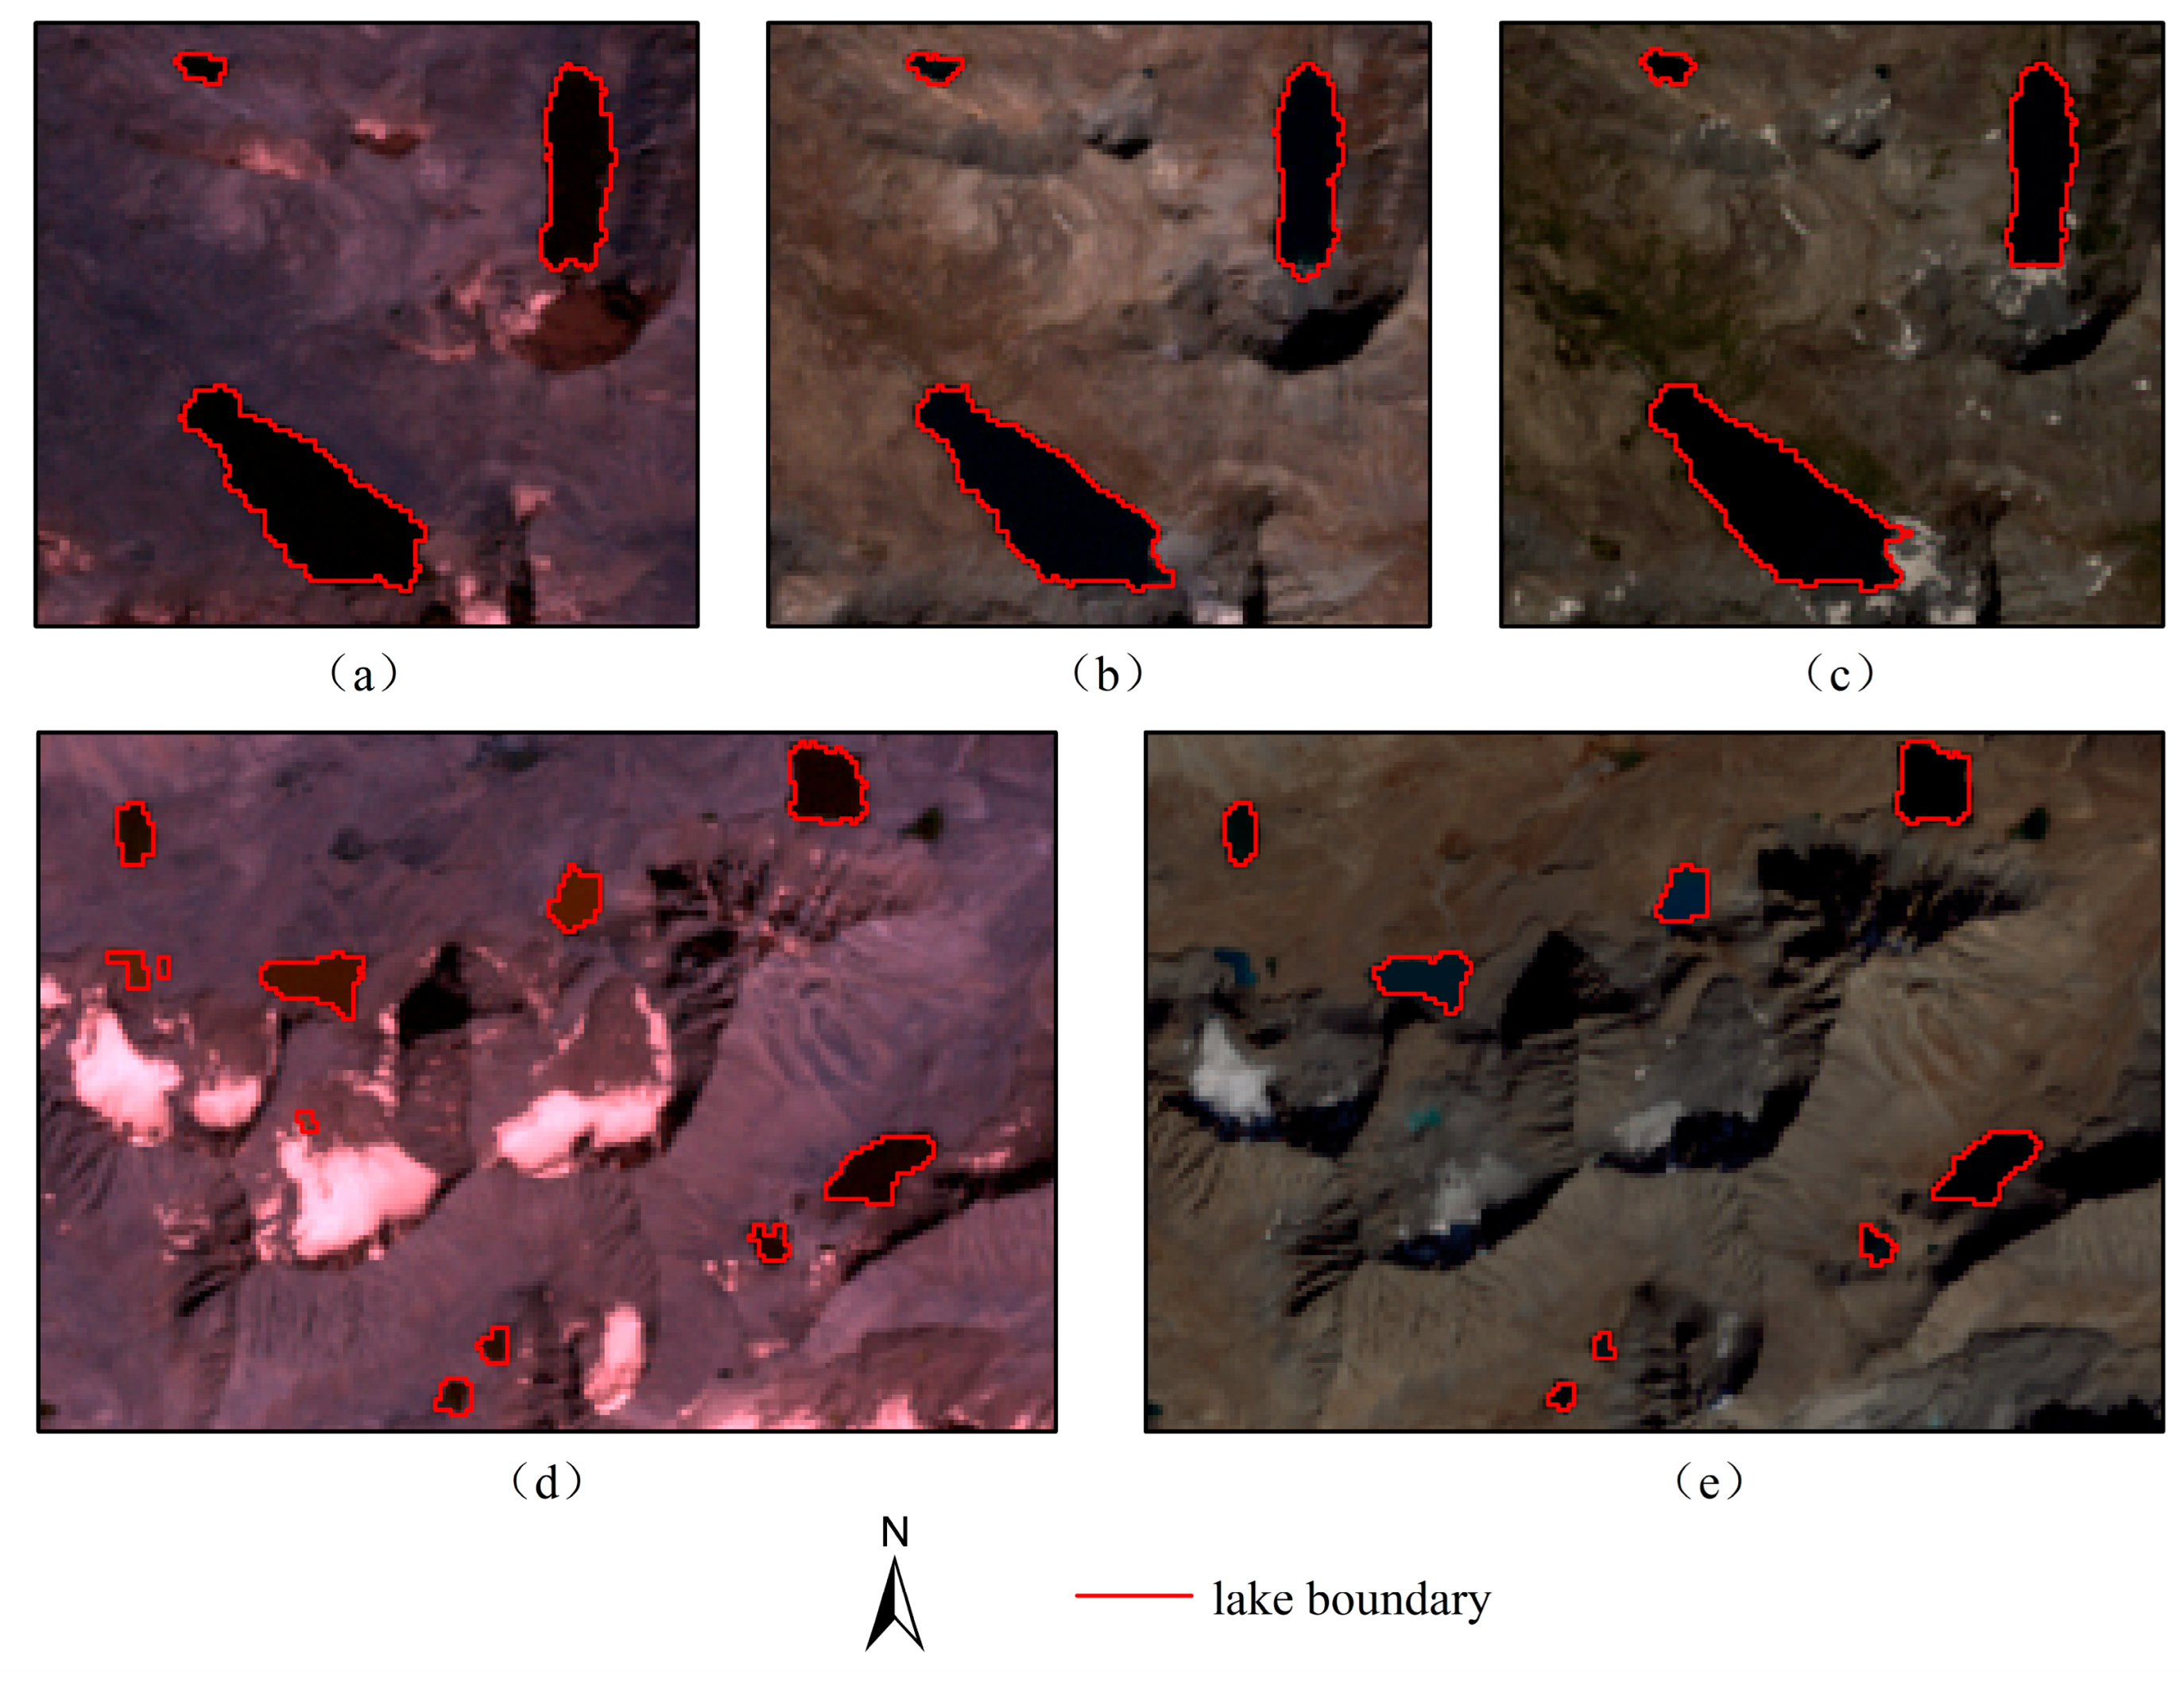
3. Results
4. Discussion
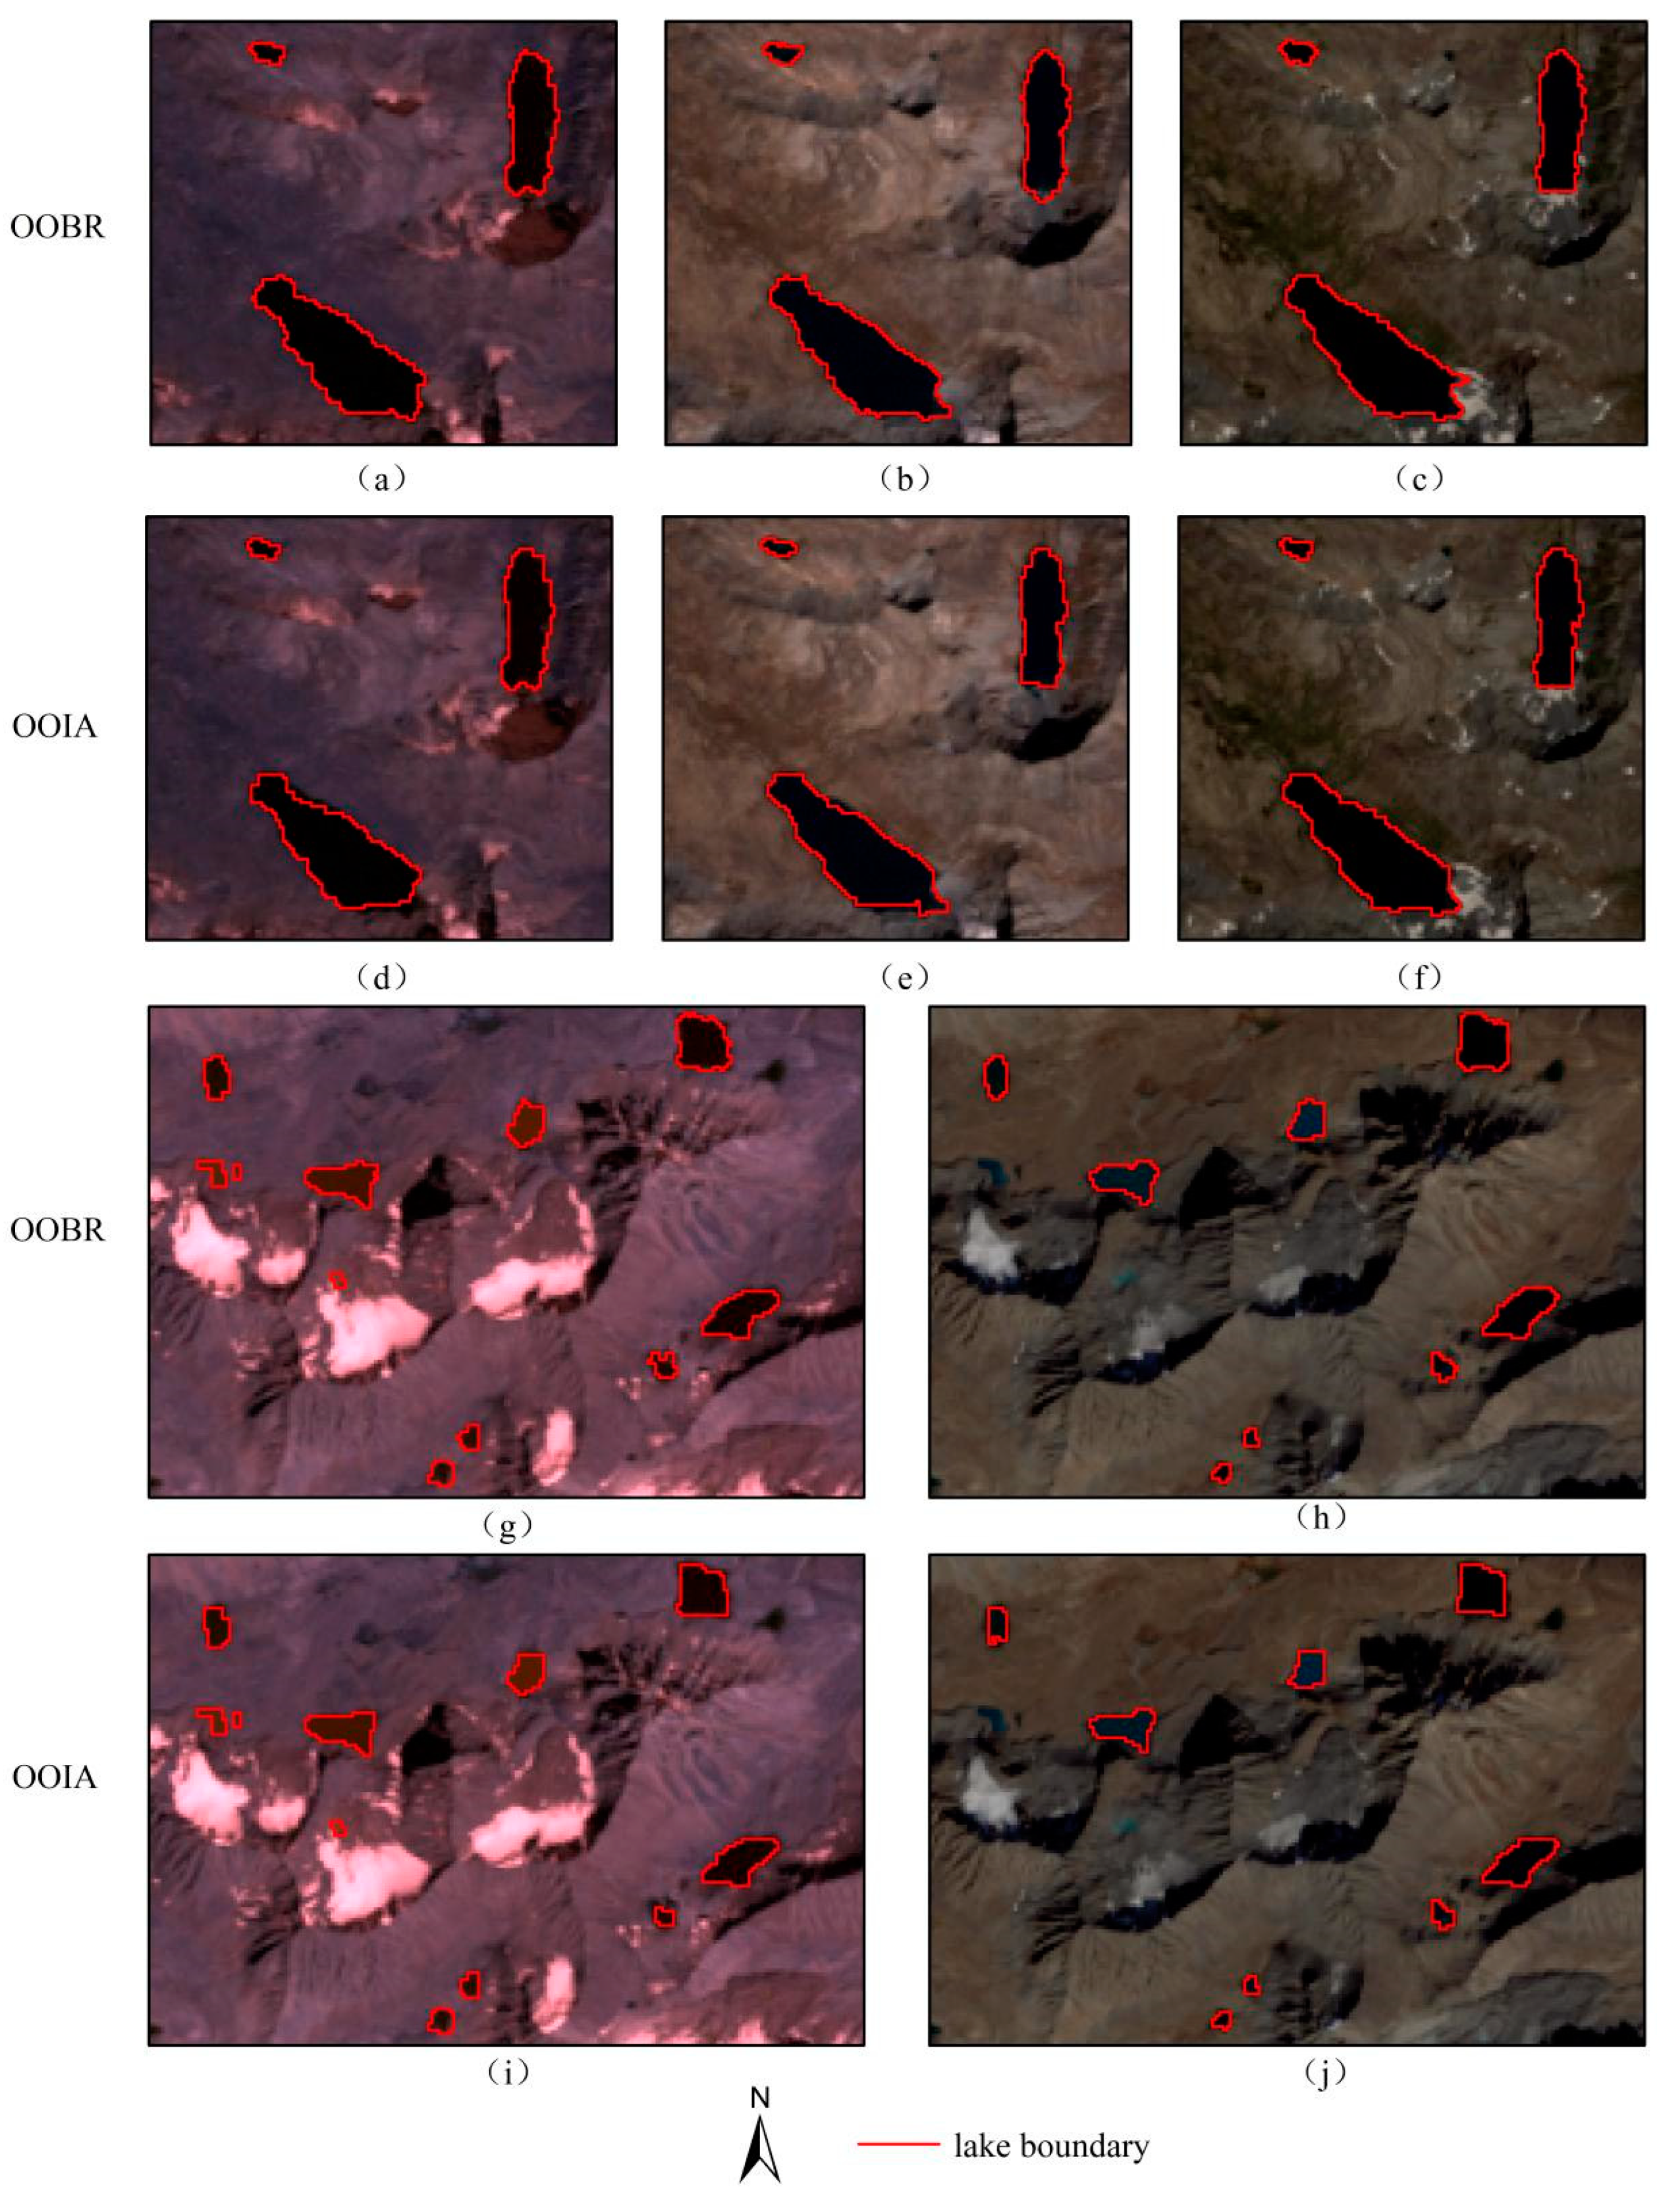
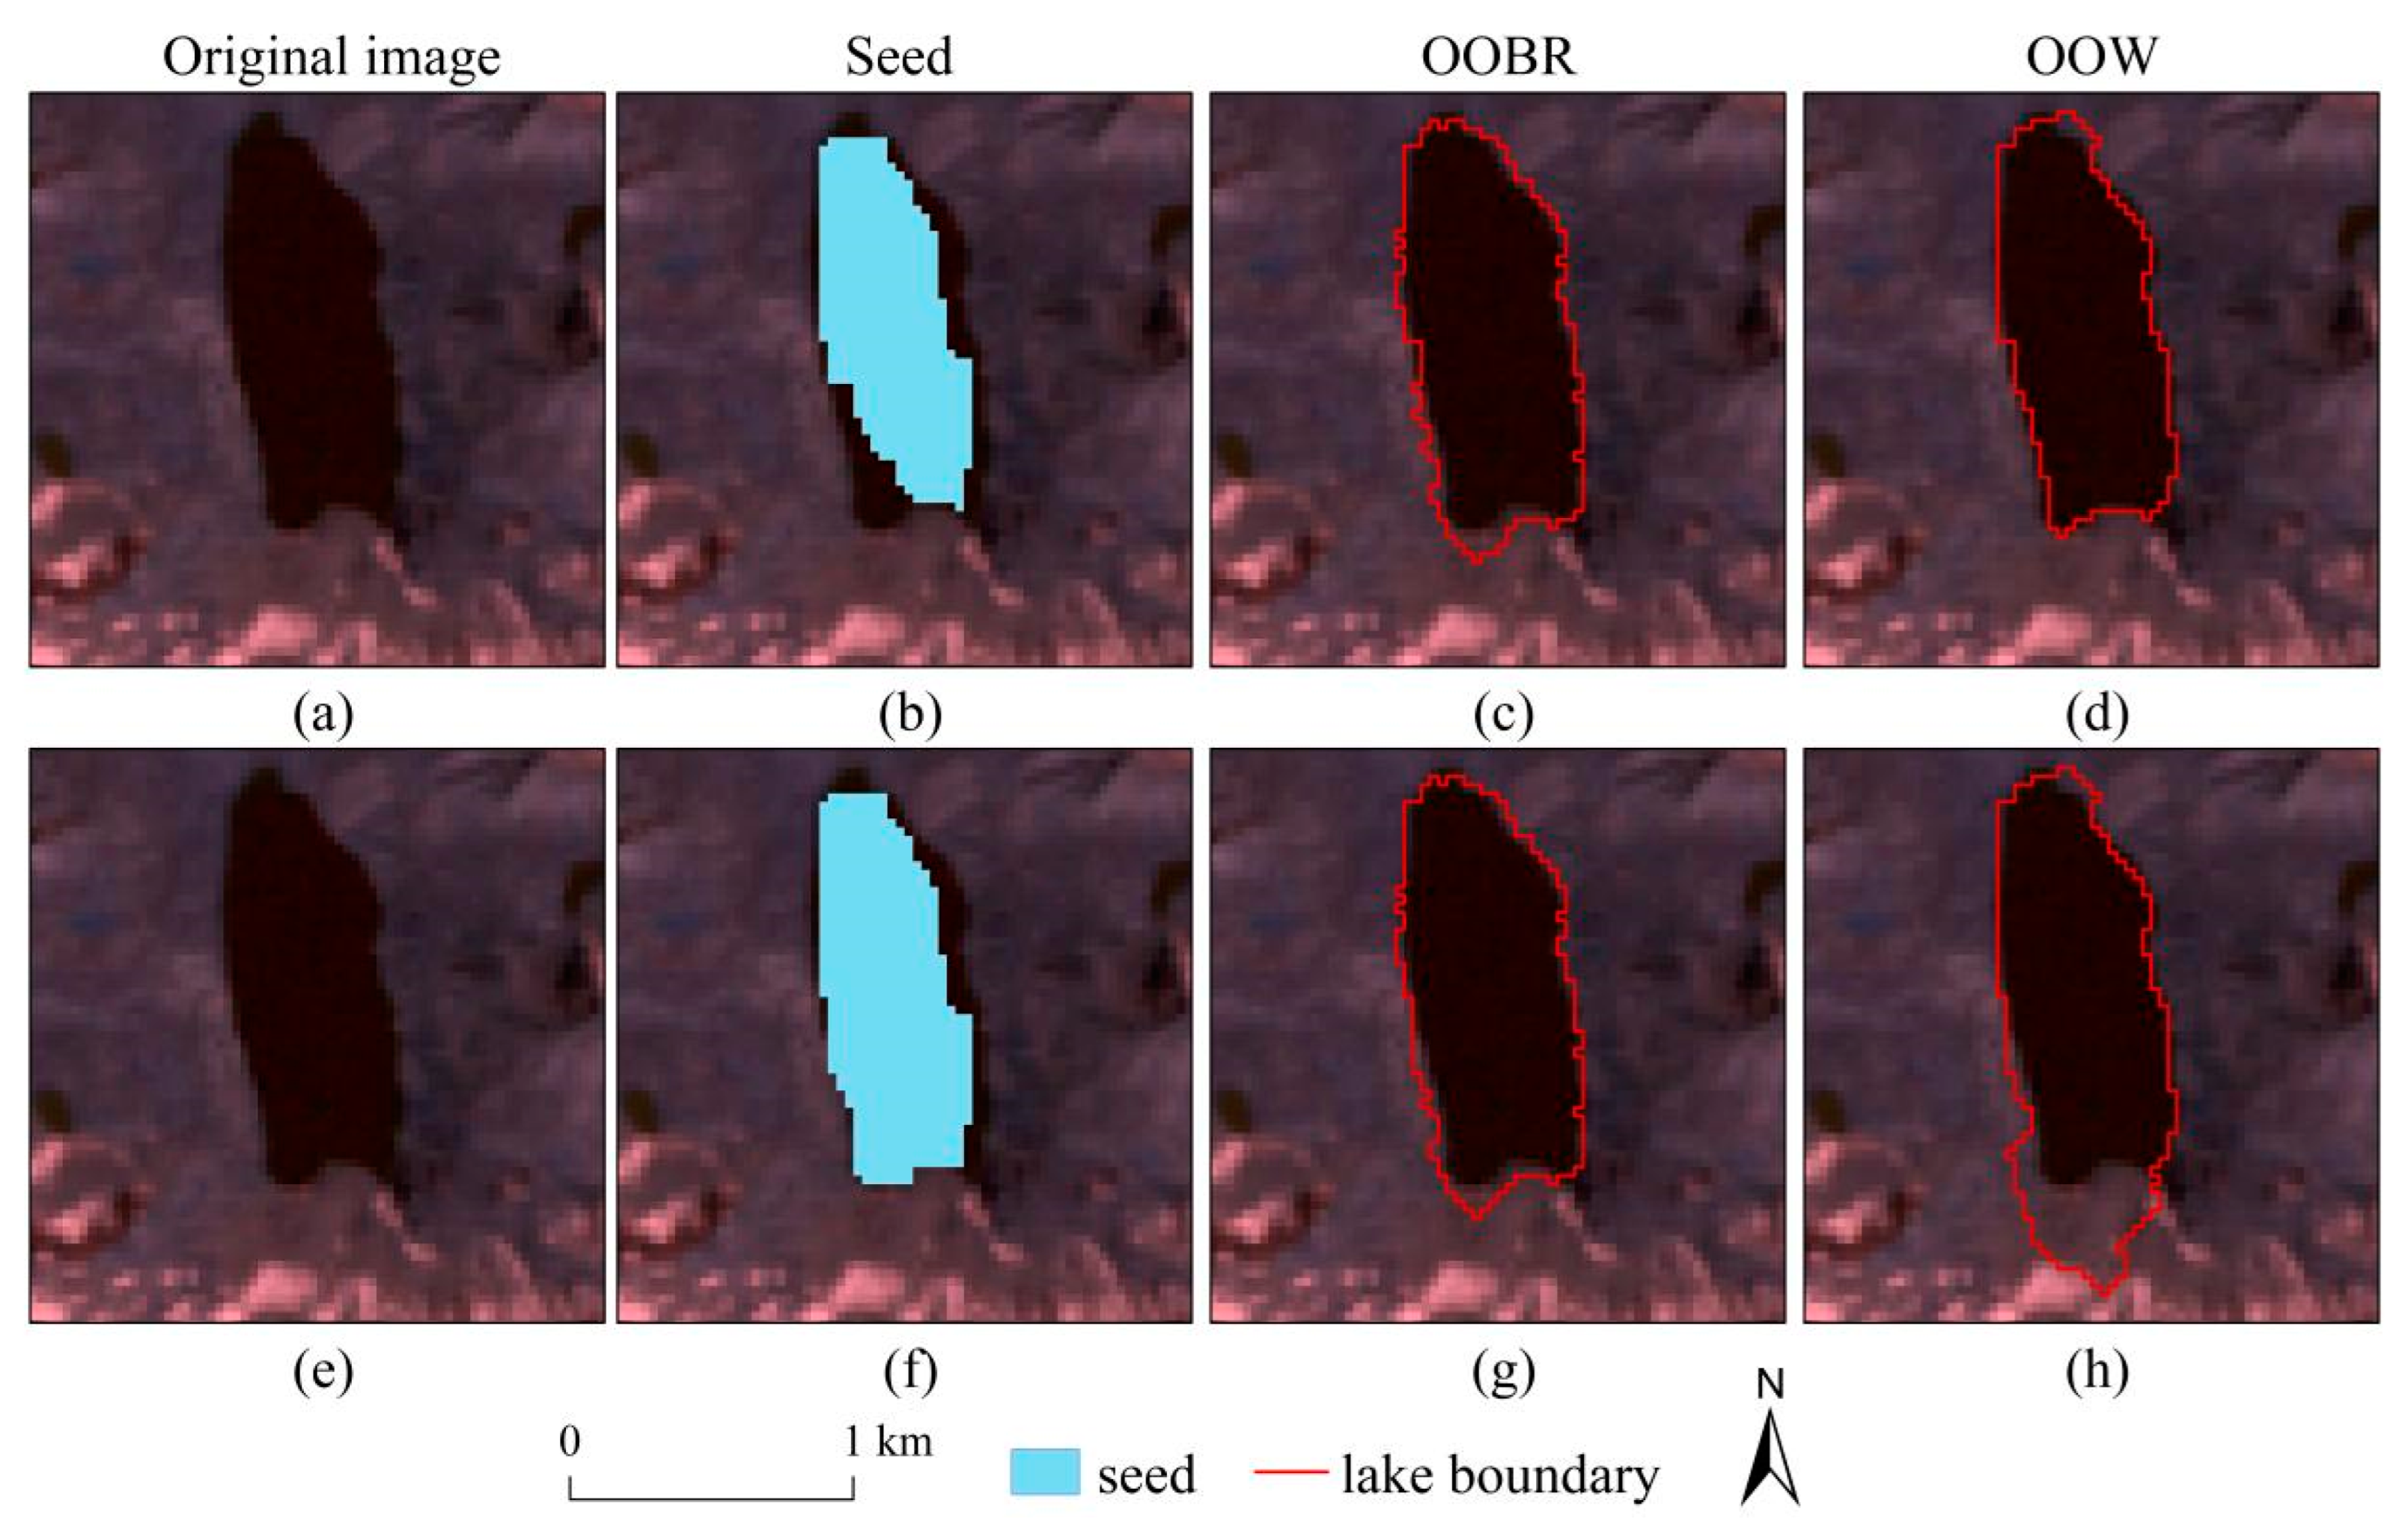
4.1. Comparison of Object-Oriented Method and the Proposed Method
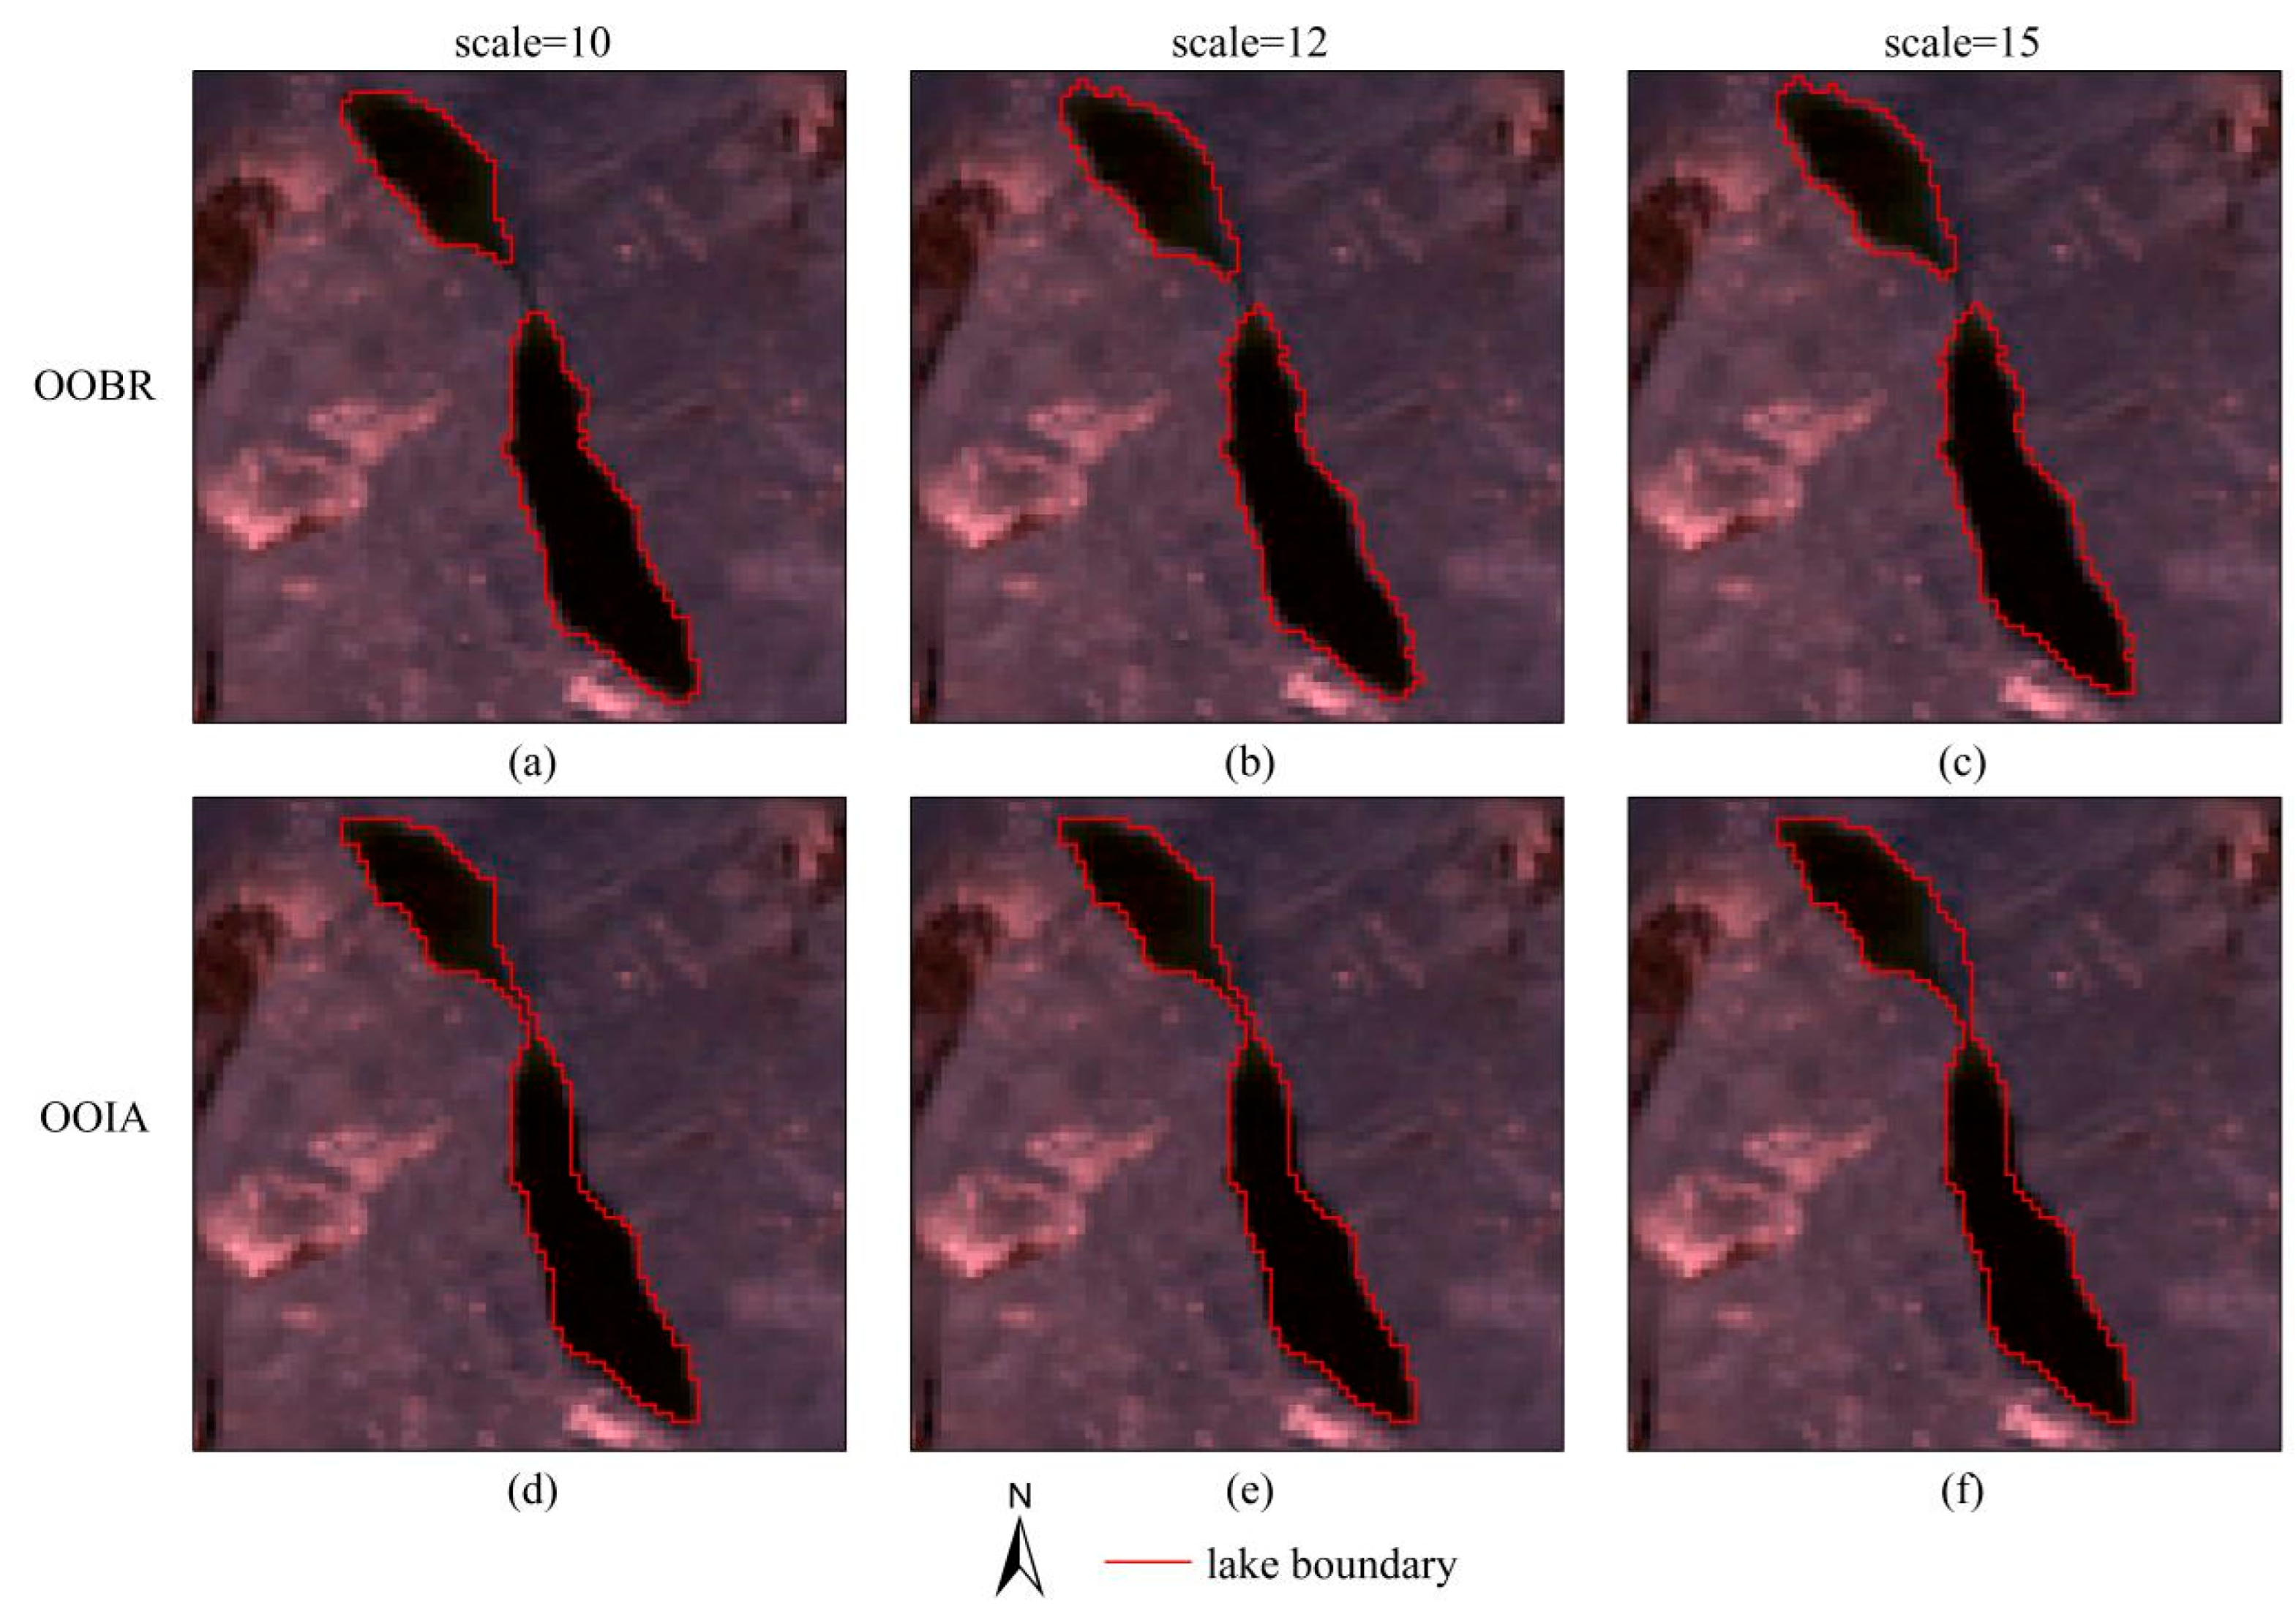
4.2. Influence of Segmentation Scale
4.3. Comparison of Results with the Watershed Algorithm and the Proposed Method of Correction
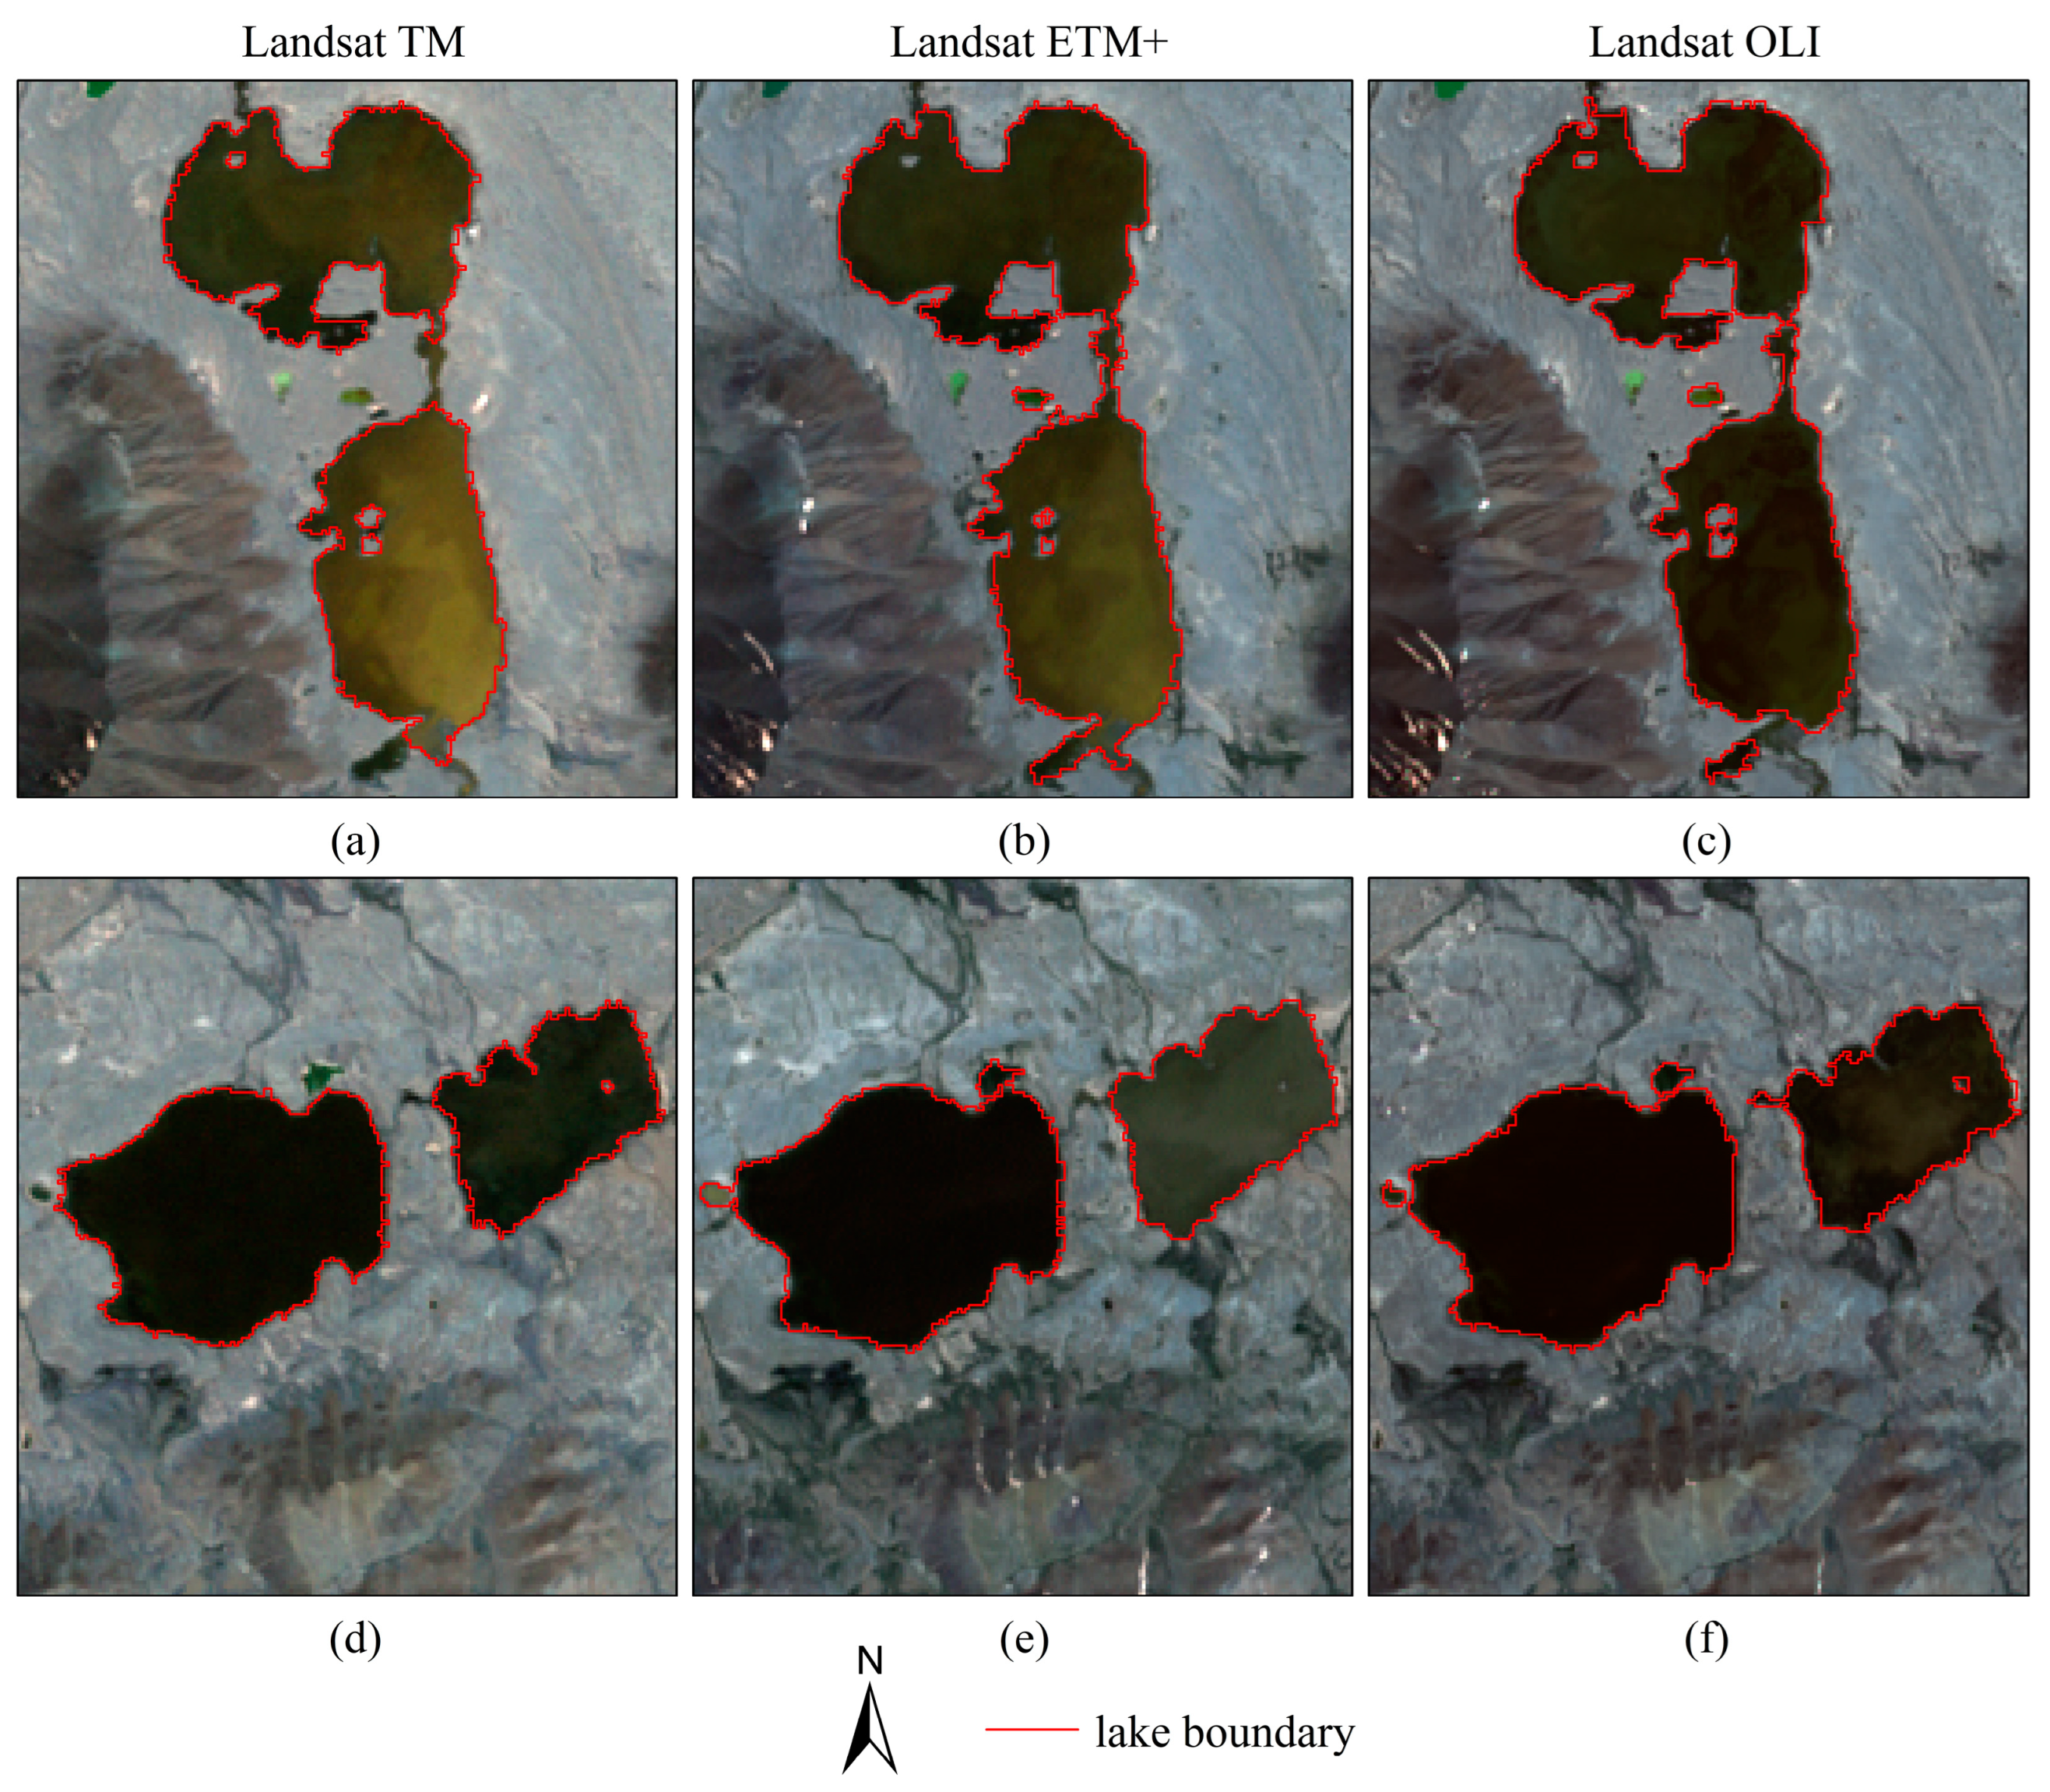
4.4. Verification of the Universality of Proposed Method
5. Conclusions
- (1)
- The proposed method can reduce the omission error of the results by the object-oriented method, and the highest overall accuracy of the proposed method is 98.5%.
- (2)
- The overall accuracy of the proposed method is always higher than that of the object-oriented method with a reasonable change of segmentation scale, and its overall accuracy remains above 90% in the experiments.
- (3)
- Compared with the method combining the object-oriented method with the watershed algorithm, the proposed method is more robust to the preliminary extraction result (seed).
- (1)
- The time complexity of the lake boundary recognition in the symmetrical area can be further optimized.
- (2)
- In the method of determining the weights, we assumed that the two weights are both integers and their sum is 10. We selected the relatively optimal weights through “trail and test” experiments, so the results may not be as good as the analytical solution obtained by some optimization algorithms.
- (3)
- The generalization of the thresholds of the lake boundary recognition is limited, which may be optimized by considering the adaptive threshold method.
- (4)
- The process of lake boundary correction may cause the commission error in some extent, which can be improved by considering the topological relationship between the pixels that satisfy the thresholds of recognition and the preliminary extraction.
Author Contributions
Funding
Data Availability Statement
Conflicts of Interest
References
- Nie, Y.; Sheng, Y.; Liu, Q.; Liu, L.; Liu, S.; Zhang, Y.; Song, C. A regional-scale assessment of Himalayan glacial lake changes using satellite observations from 1990 to 2015. Remote Sens. Environ. 2017, 189, 1–13. [Google Scholar] [CrossRef]
- Li, D.; Shangguan, D.; Anjum, M.N. Glacial Lake Inventory Derived from Landsat 8 OLI in 2016-2018 in China-Pakistan Economic Corridor. ISPRS Int. J. Geo-Inf. 2020, 9, 294. [Google Scholar] [CrossRef]
- Wang, W.; Xiang, Y.; Gao, Y.; Lu, A.; Yao, T. Rapid expansion of glacial lakes caused by climate and glacier retreat in the Central Himalayas. Hydrol. Process. 2015, 29, 859–874. [Google Scholar] [CrossRef]
- Ren, Y.; Zhang, Y.; Kang, J. A dataset of glacier and glacial lake distribution in key areas of the China-Pakistan Economic Corridor during 2013–2017. China Sci. Data 2019, 4, 18–31. [Google Scholar]
- Liu, Q.; Nie, Y.; Wang, X.; Shangguan, D. An inventory dataset of glacier and glacial lake related hazards(events) along the China-Pakistan Economic Corridor. China Sci. Data 2021, 6, 172–181. [Google Scholar]
- Zhong, L.; Hu, L.; Zhou, H. Deep learning based multi-temporal crop classification. Remote Sens. Environ. 2019, 221, 430–443. [Google Scholar] [CrossRef]
- Marmanis, D.; Datcu, M.; Esch, T.; Stilla, U. Deep learning earth observation classification using ImageNet pretrained networks. IEEE Geosci. Remote Sens. Lett. 2016, 13, 105–109. [Google Scholar] [CrossRef]
- Li, S.; Song, W.; Fang, L.; Chen, Y.; Ghamisi, P.; Benediktsson, J.A. Deep learning for hyperspectral image classification: An overview. IEEE Trans. Geosci. Remote Sens. 2019, 57, 6690–6709. [Google Scholar] [CrossRef]
- Chen, Y.; Lin, Z.; Zhao, X.; Wang, G.; Gu, Y. Deep learning-based classification of hyperspectral data. IEEE J. Sel. Top. Appl. Earth Observ. Remote Sens. 2014, 7, 2094–2107. [Google Scholar] [CrossRef]
- Song, W.; Li, S.; Fang, L.; Lu, T. Hyperspectral image classification with deep feature fusion network. IEEE Trans. Geosci. Remote Sens. 2018, 56, 3173–3184. [Google Scholar] [CrossRef]
- Zhang, Z.; Liu, Q.; Wang, Y. Road extraction by deep residual U-net. IEEE Geosci. Remote Sens. Lett. 2018, 15, 749–753. [Google Scholar] [CrossRef]
- Romero, A.; Gatta, C.; Camps-Valls, G. Unsupervised deep feature extraction for remote sensing image classification. IEEE Trans. Geosci. Remote Sensing. 2016, 54, 1349–1362. [Google Scholar] [CrossRef]
- Rishikeshan, C.A.; Ramesh, H. An automated mathematical morphology driven algorithm for water body extraction from remotely sensed images. ISPRS J. Photogramm. Remote Sens. 2018, 146, 11–21. [Google Scholar] [CrossRef]
- Hu, J.; Dong, Z.; Yang, X. Object-oriented high-resolution remote sensing image information extract method. Geo-Spat. Inf. 2021, 19, 53–61. [Google Scholar]
- Zhou, W.; Troy, A. An object-oriented approach for analysing and characterizing urban landscape at the parcel level. Int. J. Remote Sens. 2008, 29, 3119–3135. [Google Scholar] [CrossRef]
- Mathieu, R.; Freeman, C.; Aryal, J. Mapping private gardens in urban areas using object-oriented techniques and very high-resolution satellite imagery. Landsc. Urban Plan. 2007, 81, 179–192. [Google Scholar] [CrossRef]
- Xia, J.; Wang, Y.; Dong, P.; He, S.; Zhao, F.; Luan, G. Object-oriented canopy gap extraction from UAV images based on edge enhancement. Remote Sens. 2022, 14, 4762. [Google Scholar] [CrossRef]
- Shen, J.; Yang, L.; Chen, X.; Li, J.; Peng, Q.; Hu, J. A method of object-oriented automatic extraction of lakes in the mountain area from remote sensing image. Remote Sens. Land. Resour. 2012, 3, 84–91. [Google Scholar]
- Duan, R.; Li, Q.; Li, Y. Summary of image edge detection. Opt. Technol. 2005, 31, 415–419. [Google Scholar]
- Balabantaray, B.K.; Sahu, O.P.; Mishra, N.; Biswal, B.B. A quantitative performance analysis of edge detectors with hybrid edge detector. J. Comput. 2017, 12, 165–173. [Google Scholar] [CrossRef]
- Chen, S.C.; Chiu, C.C. Texture construction edge detection algorithm. Appl. Sci. 2019, 9, 897. [Google Scholar] [CrossRef]
- Arbelaez, P.; Maire, M.; Fowlkes, C.; Malik, J. Contour detection and hierarchical image segmentation. IEEE Trans. Pattern Anal. Mach. Intell. 2011, 33, 898–916. [Google Scholar] [CrossRef]
- Wu, T.; Cheng, X. Image edge detection. Comput. CD Softw. Appl. 2013, 13, 46–48. [Google Scholar]
- Li, D.; Qian, J.; Lu, N.; Zhou, J.; Tian, W. Improving of image edge detection technique. Comput. Eng. Appl. 2010, 46, 164–166. [Google Scholar]
- Tang, X.; Wang, X.; Hou, J.; Wu, H.; Liu, D. An improved Sobel face gray image edge detection algorithm. In Proceedings of the 39th Chinese Control Conference, Shenyang, China, 27–29 July 2020. [Google Scholar]
- Yuan, C.; Xiong, Z.; Zhou, X.; Peng, X. Study of infrared image edge detection based on Sobel operator. Laser. Infrared 2009, 39, 85–87. [Google Scholar]
- Kang, M.; Xu, Q.; Wang, B. A roberts’ adaptive edge detection method. J. Xi’an Jiaotong Univ. 2008, 42, 1240–1244. [Google Scholar]
- Han, J.; Wang, X.; Zhang, W. An improved algorithm for edge detection of color remote sensing images. Comput. Sim. 2021, 38, 383–388. [Google Scholar]
- Yuan, L.; Xu, X. Adaptive image edge detection algorithm based on Canny operator. In Proceedings of the 4th International Conference on Advanced Information Technology and Sensor Application(AITS), Harbin University of Science and Technology, Harbin, China, 21–23 August 2015. [Google Scholar]
- Li, J.; Chen, G.; Ding, X. Research on image edge detection method based on improved Canny algorithm. Comput. Sim. 2021, 38, 371–375. [Google Scholar]
- Wang, Z.; He, S. An adaptive edge-detection method based on Canny algorithm. J. Image Graph. 2004, 9, 957–962. [Google Scholar]
- Manzi, M.S.D.; Cooper, G.R.J.; Malehmir, A.; Durrheim, R.J. Improved structural interpretation of legacy 3D seismic data from Karee platinum mine (South Africa) through the application of novel seismic attributes. Geophys. Prospect. 2020, 68, 145–163. [Google Scholar] [CrossRef]
- Adams, R.; Bischof, L. Seeded region growing. IEEE Trans. Pattern Anal. Mach. Intell. 1994, 16, 641–647. [Google Scholar] [CrossRef]
- Biswas, H.; Zhang, K.; Ross, M.S.; Gann, D. Delineation of tree patches in a mangrove-marsh transition zone by watershed segmentation of aerial photographs. Remote Sens. 2020, 12, 2086. [Google Scholar] [CrossRef]
- Tarabalka, Y.; Chanussot, J.; Benediktsson, J.A. Segmentation and classification of hyperspectral images using watershed transformation. Pattern Recogn. 2010, 43, 2367–2379. [Google Scholar] [CrossRef]
- Dai, Y.; Meng, L.; Wang, S.; Sun, F. A marker-controlled watershed algorithm for the intelligent picking of long jujubes in trees. Forests 2022, 13, 1063. [Google Scholar] [CrossRef]
- Lv, K.; Wang, W.; Zhou, Z.; Wang, X. An improved watershed algorithm on multi-directional edge detection for road extraction in remote images. Int. J. Innov. Comput. Inf. Control. 2022, 18, 851–866. [Google Scholar]
- Li, W.; Wang, W.; Gao, X.; Wu, Y.; Wang, X.; Liu, Q. A lake extraction method in mountainous regions based on the integration of object-oriented approach and watershed algorithm. J. Geo-Inf. Sci. 2021, 23, 1272–1285. [Google Scholar]
- Geospatial Data Cloud. Available online: https://www.gscloud.cn/ (accessed on 22 October 2022).
- EarthExplorer. Available online: https://earthexplorer.usgs.gov/ (accessed on 22 October 2022).
- Frohn, R.C.; Autrey, B.C.; Lane, C.R.; Reif, M. Segmentation and object-oriented classification of wetlands in a karst Florida landscape using multi-season Landsat-7 ETM+ imagery. Int. J. Remote Sens. 2011, 32, 1471–1489. [Google Scholar] [CrossRef]
- McFeeters, S.K. The use of the Normalized Difference Water Index (NDWI) in the delineation of open water features. Int. J. Remote Sens. 1996, 17, 1425–1432. [Google Scholar] [CrossRef]
- Xu, H.Q. A study on information extraction of water body with the modified normalized difference water index(MNDWI). J. Remote Sens. 2005, 9, 589–595. [Google Scholar]

| Image | Path/Row | Date | Cloud Cover/% | Sensor |
|---|---|---|---|---|
| LE7_4 | 150/34 | 15 August 1999 | 3.00 | ETM+ |
| LE7_1 | 150/35 | 16 September 1999 | 1.00 | ETM+ |
| LT5_2 | 148/36 | 27 August 2000 | 2.00 | TM |
| LE7_3 | 149/34 | 30 September 2001 | 1.00 | ETM+ |
| LT5_1 | 150/35 | 2 October 2008 | 1.00 | TM |
| LT5_3 | 149/34 | 27 August 2009 | 2.00 | TM |
| LT5_4 | 150/34 | 24 August 2011 | 1.00 | TM |
| LC8_1 | 150/35 | 19 August 2015 | 1.42 | OLI |
| LC8_2 | 148/36 | 21 October 2020 | 0.71 | OLI |
| LC8_4 | 150/34 | 4 September 2021 | 1.83 | OLI |
| Image | Coefficient of Variation (CV) | |
|---|---|---|
| NDWI | MNDWI | |
| Landsat TM | 1.076 | 1.374 |
| Landsat ETM+ | 1.029 | 1.099 |
| Landsat OLI | 1.910 | 2.452 |
| Image | UA/% | PA/% | OA1/% | CE/% | OE/% |
|---|---|---|---|---|---|
| LT5_1 | 99.00 | 99.49 | 98.50 | 1.00 | 0.51 |
| LE7_1 | 98.78 | 99.48 | 98.27 | 1.22 | 0.52 |
| LC8_1 | 99.68 | 98.47 | 98.16 | 0.32 | 1.53 |
| LT5_2 | 98.78 | 99.04 | 97.84 | 1.22 | 0.96 |
| LC8_2 | 97.95 | 98.23 | 96.25 | 2.05 | 1.77 |
| Method | Image | UA/% | PA/% | OA1/% | CE/% | OE/% |
|---|---|---|---|---|---|---|
| OOBR | LT5_1 | 99.00 | 99.49 | 98.50 | 1.00 | 0.51 |
| LE7_1 | 98.78 | 99.48 | 98.27 | 1.22 | 0.52 | |
| LC8_1 | 99.68 | 98.47 | 98.16 | 0.32 | 1.53 | |
| LT5_2 | 98.78 | 99.04 | 97.84 | 1.22 | 0.96 | |
| LC8_2 | 97.95 | 98.23 | 96.25 | 2.05 | 1.77 | |
| OOIA | LT5_1 | 99.08 | 93.48 | 92.68 | 0.92 | 6.52 |
| LE7_1 | 99.25 | 90.08 | 89.47 | 0.75 | 9.92 | |
| LC8_1 | 98.79 | 89.81 | 88.84 | 1.21 | 10.19 | |
| LT5_2 | 98.71 | 93.42 | 92.29 | 1.29 | 6.58 | |
| LC8_2 | 99.31 | 87.31 | 86.78 | 0.69 | 12.69 |
| Method | Scale | UA/% | PA/% | OA1/% | CE/% | OE/% |
|---|---|---|---|---|---|---|
| OOBR | 10 | 99.12 | 95.65 | 94.84 | 0.88 | 4.35 |
| 12 | 92.33 | 98.94 | 91.42 | 7.67 | 1.06 | |
| 15 | 92.44 | 97.24 | 90.07 | 7.56 | 2.76 | |
| OOIA | 10 | 98.92 | 92.36 | 91.44 | 1.08 | 7.64 |
| 12 | 98.80 | 92.10 | 91.08 | 1.20 | 7.90 | |
| 15 | 97.03 | 91.88 | 89.37 | 2.97 | 8.12 |
| Image | UA/% | PA/% | OA1/% | CE/% | OE/% |
|---|---|---|---|---|---|
| Landsat TM | 97.52 | 99.46 | 97.01 | 2.48 | 0.54 |
| Landsat ETM+ | 99.73 | 99.33 | 99.06 | 0.27 | 0.67 |
| Landsat OLI | 98.21 | 98.66 | 96.92 | 1.79 | 1.34 |
Disclaimer/Publisher’s Note: The statements, opinions and data contained in all publications are solely those of the individual author(s) and contributor(s) and not of MDPI and/or the editor(s). MDPI and/or the editor(s) disclaim responsibility for any injury to people or property resulting from any ideas, methods, instructions or products referred to in the content. |
© 2023 by the authors. Licensee MDPI, Basel, Switzerland. This article is an open access article distributed under the terms and conditions of the Creative Commons Attribution (CC BY) license (https://creativecommons.org/licenses/by/4.0/).
Share and Cite
Liu, B.; Wang, W.; Li, W. A Lake Extraction Method Combining the Object-Oriented Method with Boundary Recognition. Land 2023, 12, 545. https://doi.org/10.3390/land12030545
Liu B, Wang W, Li W. A Lake Extraction Method Combining the Object-Oriented Method with Boundary Recognition. Land. 2023; 12(3):545. https://doi.org/10.3390/land12030545
Chicago/Turabian StyleLiu, Bingxue, Wei Wang, and Wenping Li. 2023. "A Lake Extraction Method Combining the Object-Oriented Method with Boundary Recognition" Land 12, no. 3: 545. https://doi.org/10.3390/land12030545
APA StyleLiu, B., Wang, W., & Li, W. (2023). A Lake Extraction Method Combining the Object-Oriented Method with Boundary Recognition. Land, 12(3), 545. https://doi.org/10.3390/land12030545


