Article

The Main Drivers of Wetland Evolution in the Beijing-Tianjin-Hebei Plain

1
College of Tourism and Urban-Rural Planning, Chengdu University of Technology, Chengdu 610059, China
2
College of Information, Shanghai Ocean University, Shanghai 201306, China
3
Wyoming Geographic Information Science Center, University of Wyoming, Laramie, WY 82070, USA
4
College of Information Engineering, Zhengzhou Institute of Science and Technology, Zhengzhou 450064, China
*
Authors to whom correspondence should be addressed.
Land 2023, 12(2), 480; https://doi.org/10.3390/land12020480
Submission received: 27 January 2023 / Revised: 12 February 2023 / Accepted: 14 February 2023 / Published: 15 February 2023
(This article belongs to the Section Land–Climate Interactions)

Abstract

:
Analysis of the driving mechanism of wetland change can help identify the spatial differences in the mechanisms of different elements in order to better scientifically prevent and utilize wetlands. The Beijing-Tianjin-Hebei Plain (BTHP) was selected as the study area, and the dynamic degree model and change intensity index were utilized to examine the spatial and temporal changes of wetlands based on four periods of land use data. After establishing a wetland change evaluation system that included topography, geology, meteorological, and human activities, we utilized a random forest model to study the driving mechanism of wetland change from 1990–2020. Based on the developed zoning map, we then offered specific protection policies. We have four major findings: (1) the wetlands reduced significantly in the BTHP and underwent a change process from decreasing to increasing, and reservoirs and rivers, particularly along the Bohai Rim, were the primary determinants of wetland changes; (2) the impact of topographic factors such as elevation showed a significant gradient effect, the impact of geological factors such as hydrogeological division was low and indirect, the impact of meteorological factors was nonlinear, and the impact of anthropic factors was most significant and showed clear spatial directivity; (3) the urban expansion and agricultural reclamation had significant dominant effects, coupled with the topographical effects of elevation and slope, the geological environmental effects of surface subsidence and hydrogeological division, and the cumulative effects of temperature and precipitation, which resulted in the spatial change of wetlands; and (4) protecting wetland integrity, dynamic monitoring, restricting human activities, and establishing wetland buffer zones should be applied to the general area, natural factors area, anthropic factors area, and significant comprehensive area, respectively.

1. Introduction

The wetland ecosystem, known as the kidney of the earth, offers humans with a variety of ecosystem services, such as flood regulation, water conservation, and mitigation of the greenhouse effect [1], and is crucial to ensuring sustainable development. Wetlands, which account for 4–6% of the worldwide land surface, are one of the world’s greatest carbon reservoirs, storing more than 30% of the world’s carbon and playing an essential role in both global and regional carbon cycles [2]. With the intensification of human resource utilization over the past century, the interaction between human activities and natural elements has driven the evolution of the surface ecological environment, exacerbated the human–land conflict, and led to a reduction of nearly 50% of the world’s wetland resources [3]. The reduction and destruction of wetland resources have seriously degraded their functions and impeded the coupling development of the man–land system [4]. In order to achieve sustainable development, research on wetlands has steadily increased.
Time series variations in wetland area, quantity, geographic distribution, and landscape pattern are the primary focus of the study on wetland change [5]. The early evaluation of regional wetlands relies heavily on field data, which is time-consuming and geographically and temporally limited [6]. The advent of remote sensing (RS) technologies and geographic information systems (GIS) has facilitated and streamlined large-scale and long-term wetland change studies [7]. Landsat [8], QuickBird [9], SPOT [10], and other remote sensing images have been successfully utilized in wetland-related studies. In addition, model-based quantitative analysis such as the dynamic degree model [11], transfer matrix model [12], and landscape metrics [13] have gradually replaced simple comparative analysis. Current research on the spatiotemporal change of wetlands can be summarized as follows: first, by interpreting remote sensing images or using existing land use data to extract pertinent information such as the type, quantity, and distribution of wetlands; second, by using RS, GIS technology, and quantitative statistics software to develop specific models [14] or originality indices [15], we can reveal the spatiotemporal evolution of wetlands.
Frequently, the transformation of wetlands is the consequence of the cumulative effects of many variables [16]. Generally, natural elements such as temperature, precipitation, and evaporation are regarded as internal driving forces [17]; however, human activities have gradually become the most influential component in wetland evolution [18]. Meanwhile, anthropic factors such as urban expansion, agricultural reclamation, and road construction have distinct spatial ranges of influence [19]. To reflect the comprehensiveness of factor selection, it is necessary to develop distinct factors defining various human activities.
Both qualitative and quantitative methodologies are utilized in the study on the driving force of wetland change. The qualitative method is to determine and discuss the main impact factors of wetland change according to the time-series change characteristics of wetlands [20]. Although this method is simple and easy to implement, it mainly relies on expert experience, which is highly subjective and has shortcomings. Quantitative methods rely on different mathematical models to reveal the influence of different factors by quantifying the correlation between impact factors and wetlands. Early quantitative methods are based on statistical methods—such as traditional canonical correlation analysis [21] or principal component analysis [22], as well as geographically weighted regression [23] and the Moran index [24] to account for spatial characteristics—to describe the relationship between wetland changes and impact factors, which can be less subjective. With the development of computer technology, many data mining methods such as machine learning are gradually being applied in the field of wetlands, which helps researchers break through the limitations of traditional statistical methods. Random forest (RF) overcomes problems associated with complicated modeling processes and weak interpretative ability [25], and has a more stable model performance [26]. However, the application of this algorithm mainly focuses on wetland or land use classification and rarely on regression missions [27]. Some studies only obtained the importance ranking of all factors affecting wetland distribution, but failed to reveal the sensitive range or sensitive category of each factor [28]. Some studies quantified the influence of factors on the expansion of a certain land type, but failed to directly reflect the spatial heterogeneity of impact factors [29].
To achieve regional high-quality development, numerous studies on the driving forces of wetland change in the Beijing-Tianjin-Hebei (BTH) region have been conducted. However, previous studies mostly focused on the entire BTH or its cities. Some studies combined the evolution of wetlands with the changes of impact factors and drew qualitative conclusions, which were relatively shallow and subjective [30]. Some studies used correlation coefficients to quantify the influence of individual factors, but overlooked the interaction between factors [31]. Some studies employed administrative divisions as units, established regression models based on statistics of wetlands and impact factors—which were easily affected by data distribution features—and disregarded the nonlinear link between wetland changes and impact factors [32]. Some studies addressed the nonlinear problem, but the employed model was insufficiently explanatory [33].

2. Materials and Methods
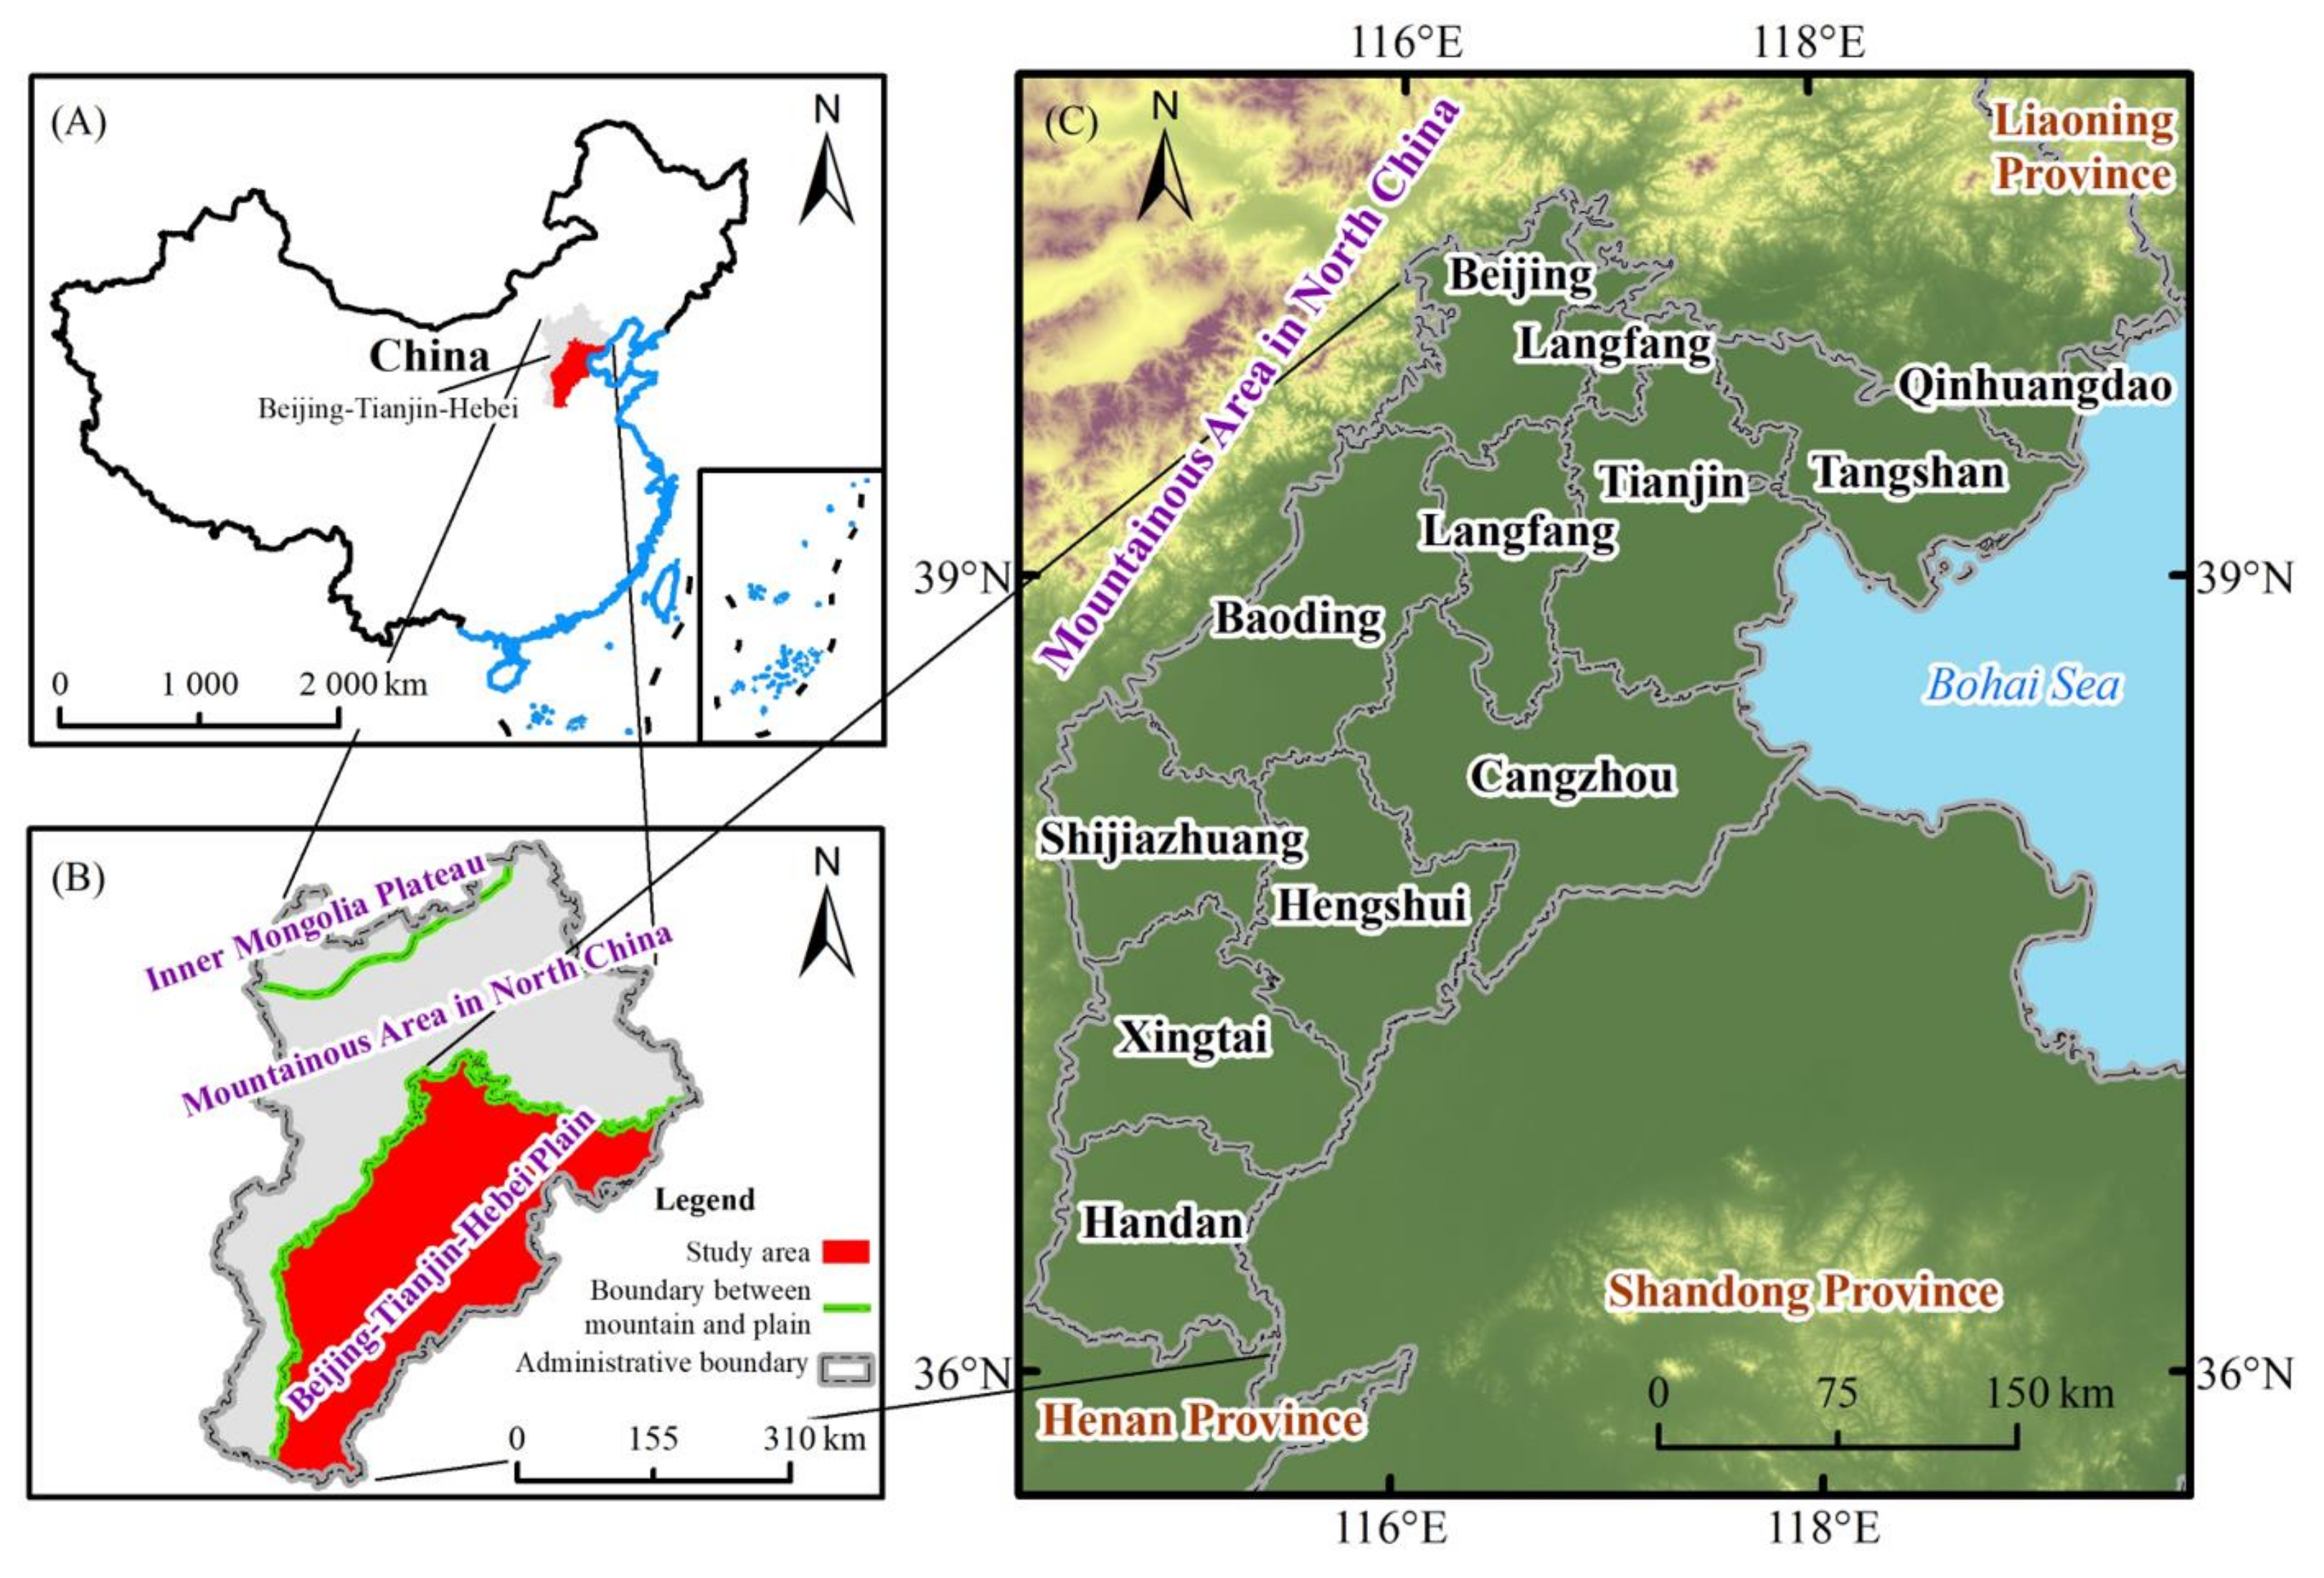
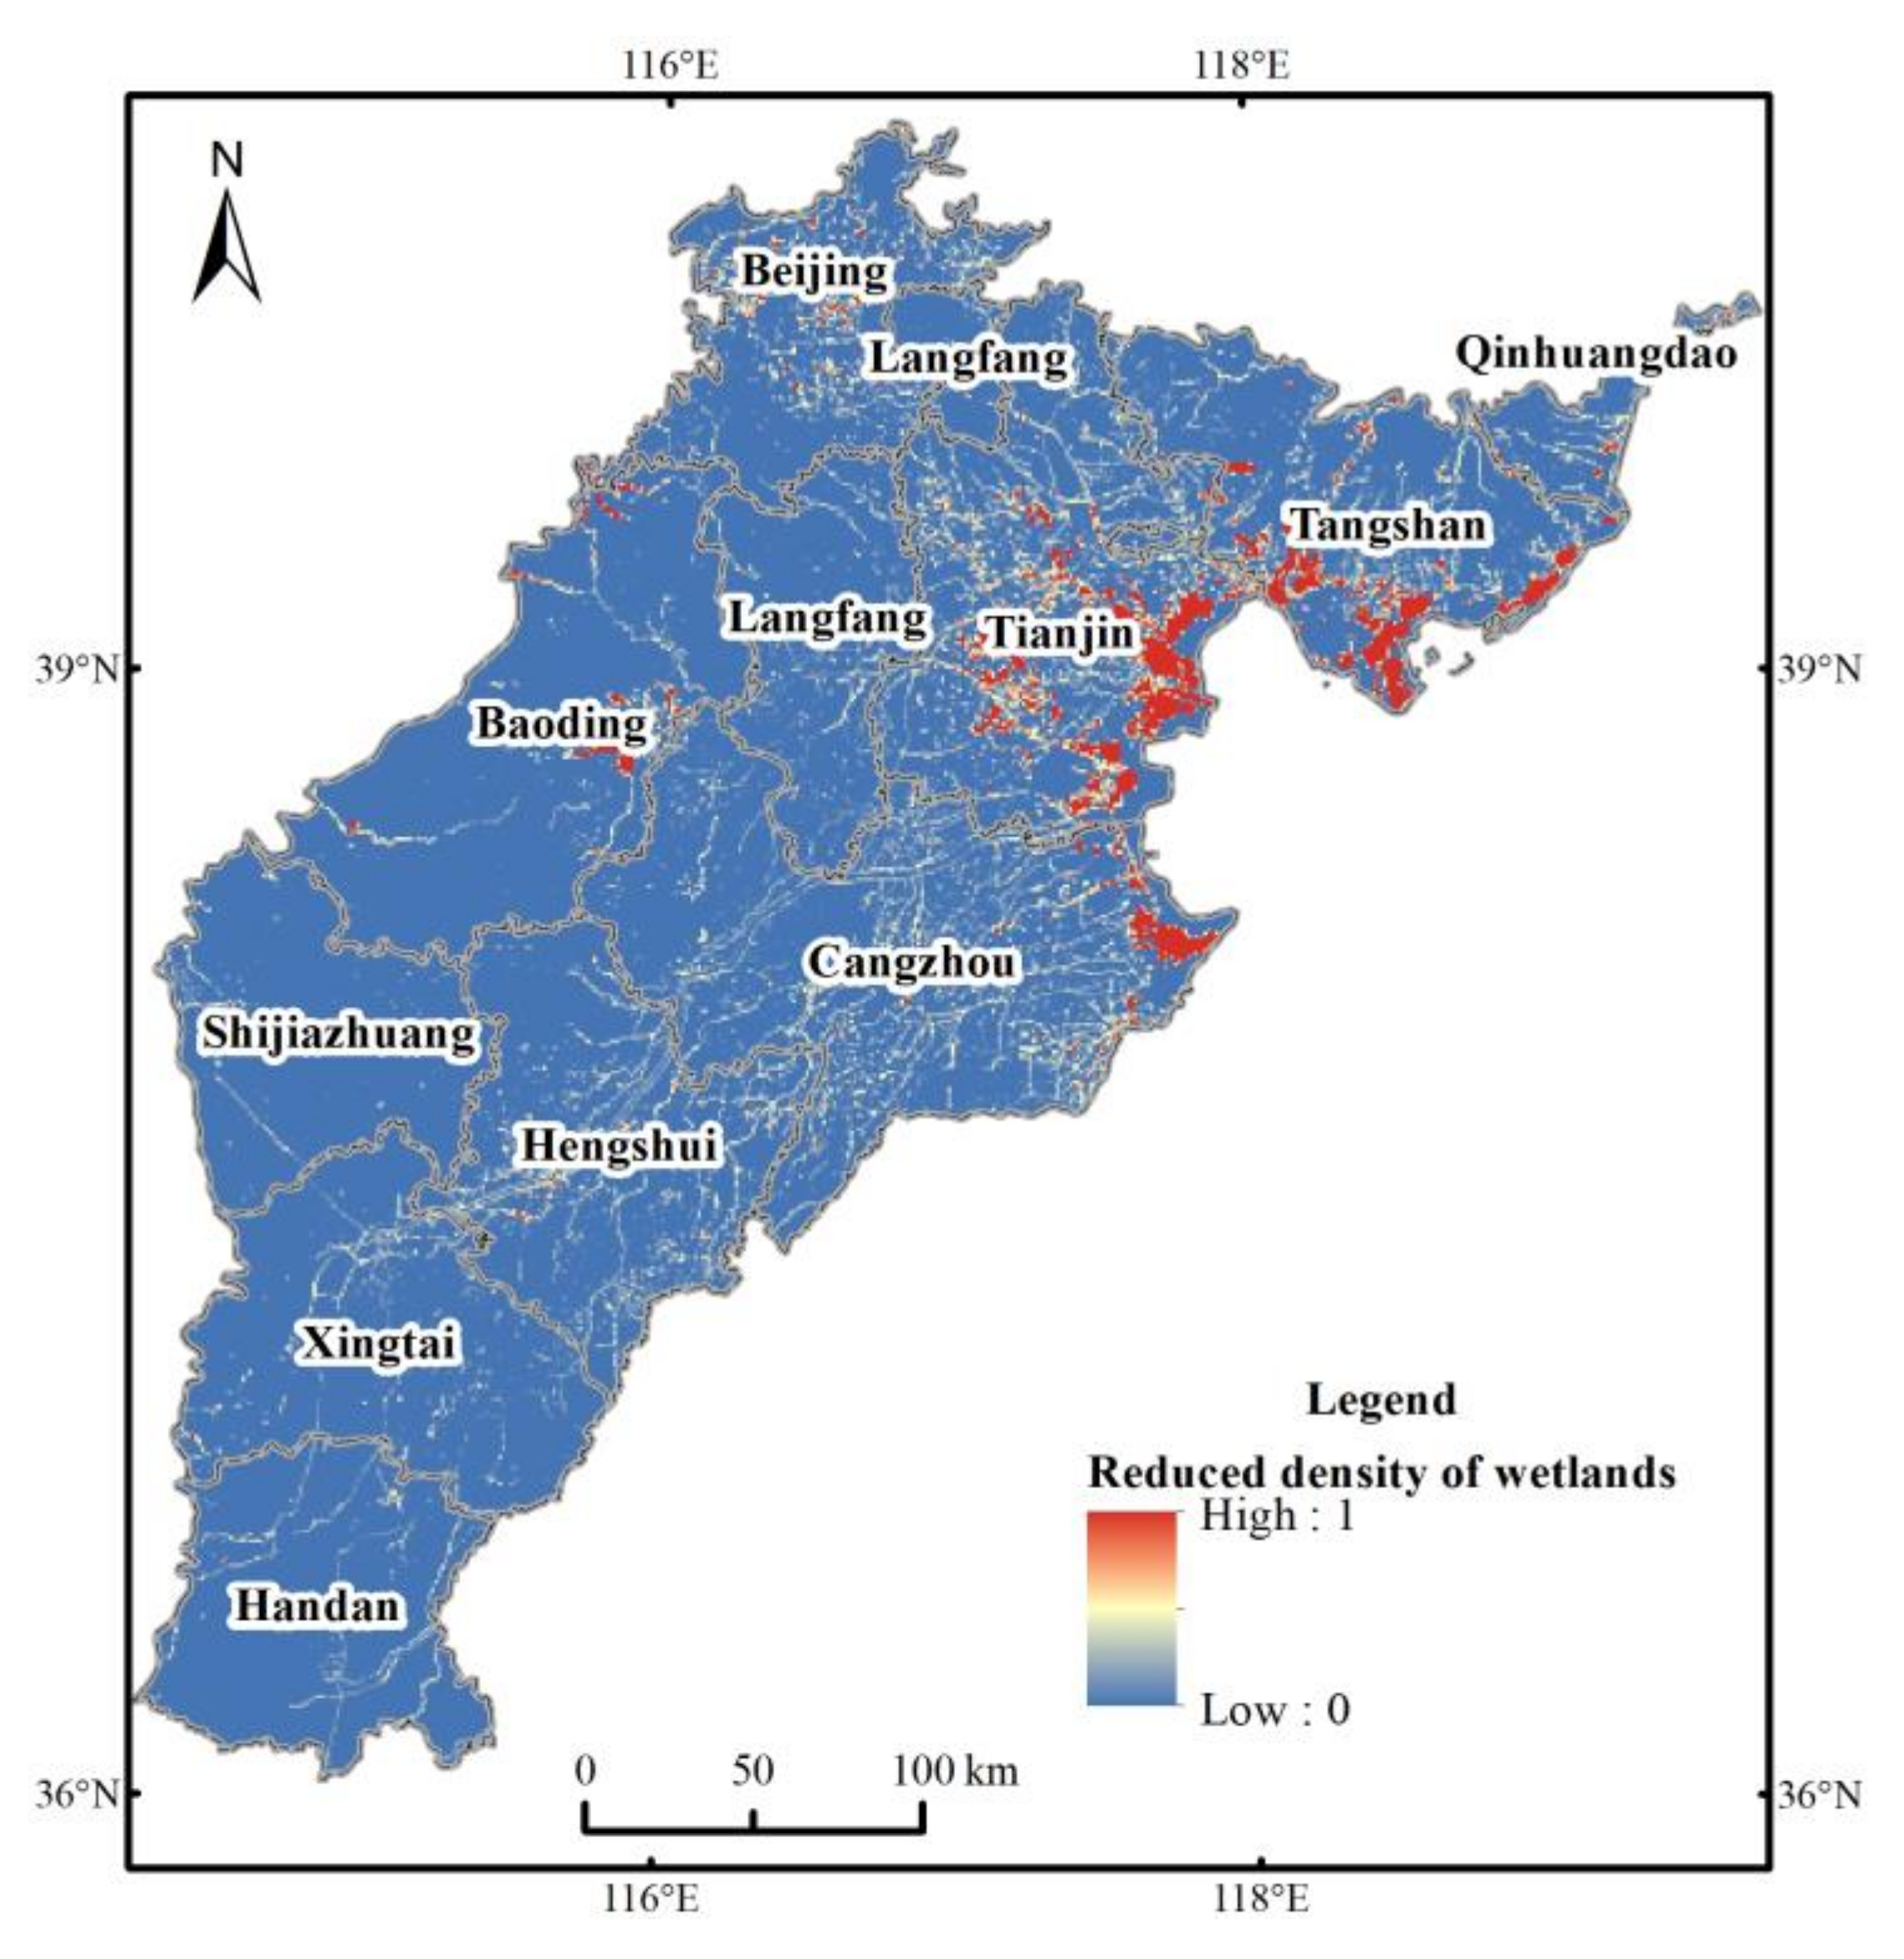
2.1. Study Area

The study area is located in the northern portion of the North China Plain, which is the plain part of the BTH, with the Taihang Mountains in the west, the Yanshan Mountains in the north and southeast, and the Bohai Sea in the east (114°19′–117°22′ E, 36°05′–41°36′ N; Figure 1). It includes two municipalities directly under the Central Government, Beijing and Tianjin, and Tangshan and 8 other cities, with a total area of about 9 × 10⁴ km2 [34]. The elevation ranges from 0–400 m, with a ladder shape from north, west, and southwest to east. The exposed stratum in the study area is mostly derived from Quaternary period, and the lithology is mainly siltstone, fine sandstone, and sandstone. The vegetation types in the study area are mainly artificial vegetation and cropland; the former is conducive to the survival of wetland resources and the latter can directly restrict the number of natural wetlands [35]. It is characterized by a temperate continental monsoon climate, with an average annual precipitation of 505.89 mm and an average annual temperature of 13.26 °C (Figure 2). The fluctuating precipitation and the rising temperature seriously affect the total amount of wetland resources in the BTHP.
The wetland types in the study area can be roughly summarized as natural wetlands and artificial wetlands; the former mainly includes rivers, lakes, and marshlands, while the latter mainly includes reservoirs. Haihe River, Luanhe River, and other rivers are mainly spread as fan-shaped, and marshlands are scattered around lakes. There are several wetland natural preservation zones at or above the provincial level in the study area, including Baiyangdian Wetland and Hanshiqiao Wetland at the national level and Haixing Wetland and Nandagang Wetland at the provincial level. In recent years, the wetland resources in the BTHP have undergone fundamental changes due to intensive development activities [36]. To protect the wetland ecological space, Beijing, Tianjin, and Hebei Province have successively issued a series of regulations and plans, including the Tianjin Wetland Protection Regulations (2016), the Hebei Wetland Protection Regulations (2017), and the Beijing Wetland Protection and Development Plan (2021–2035) (draft), to achieve man–land coupling and sustainable development in the BTHP.
The implementation of regulations and planning has effectively restored some important wetland resources in the study area. The wetland area of BTHP was approximately 4923.70 km2 in 2020, accounting for 5.51% of the study area and about 1.20% of the total national wetland resources. However, conflicting human–land relationships and lagging protection policies have long posed a threat to the healthy development of wetlands. The National Wetland Protection Plan (2022–2030) mentioned that by 2030, China should have established a new pattern of high-quality development of wetlands, considerably improved the functions of wetland ecosystems, and enhanced the comprehensive service functions of wetland ecosystems. Meanwhile, as one of the three national strategies, the coordinated development of Beijing, Tianjin, and Hebei demands a high-quality ecological environment. To preserve the safety of wetland ecosystems in the BTH and to achieve regional sustainable development, it is essential to comprehend the driving mechanism of wetland changes in the BTHP.
The urban area and population of the study area have increased continuously since 1990. By 2020, the urban area of 11 cities had reached about 4071 km2, and the permanent population had reached about 103 million. The continuous population growth and the constant urban expansion had directly occupied a large number of wetland resources [37]. The BTHP is one of the regions with the strongest industrial base in China. In 2020, the total gross domestic product (GDP) of the study area rose to 6.73 times that of 1990, and the economic scale and growth rate of Beijing and Tianjin were much higher than those of other cities. To achieve sustainable high-quality development, the industrial structure had been continuously optimized [38]. The average proportion of the tertiary industry was adjusted from 34.02% in 1990 to 56.47% in 2020. In particular, the proportion of tertiary industry in Beijing even reached 83.87% in 2020, while Tianjin, the largest industrial city in northern China, also accounted for more than 60% in 2020. With the continuous expansion of the economic scale and the persistent adjustment of industrial structure, it is bound to increase the demand for land and change the original land use structure.

2.2. Data

2.2.1. Wetland Data

The land use data was provided by the Institute of Geographic Science and Resources, Chinese Academy of Sciences, including the four years of 1990, 2000, 2010, and 2020, with a spatial resolution of 30 m and a classification accuracy of over 85% (Figure 3). Each period of land use data included six primary land categories: wetland, forest, grassland, cropland, artificial surface, and other. Combined with the definition of wetlands in the Convention on Wetlands and the characteristics of land use data, four types of wetlands including rivers, marshlands, lakes, and reservoirs were considered as the research scope. Among them, rivers, marshlands, and lakes were natural wetlands, and reservoirs (including artificial salt marshes, shrimp ponds, and crab ponds) were artificial wetlands. Then, the data of wetlands from 1990, 2000, 2010, and 2020 were extracted by using ArcGIS 10.2 software.

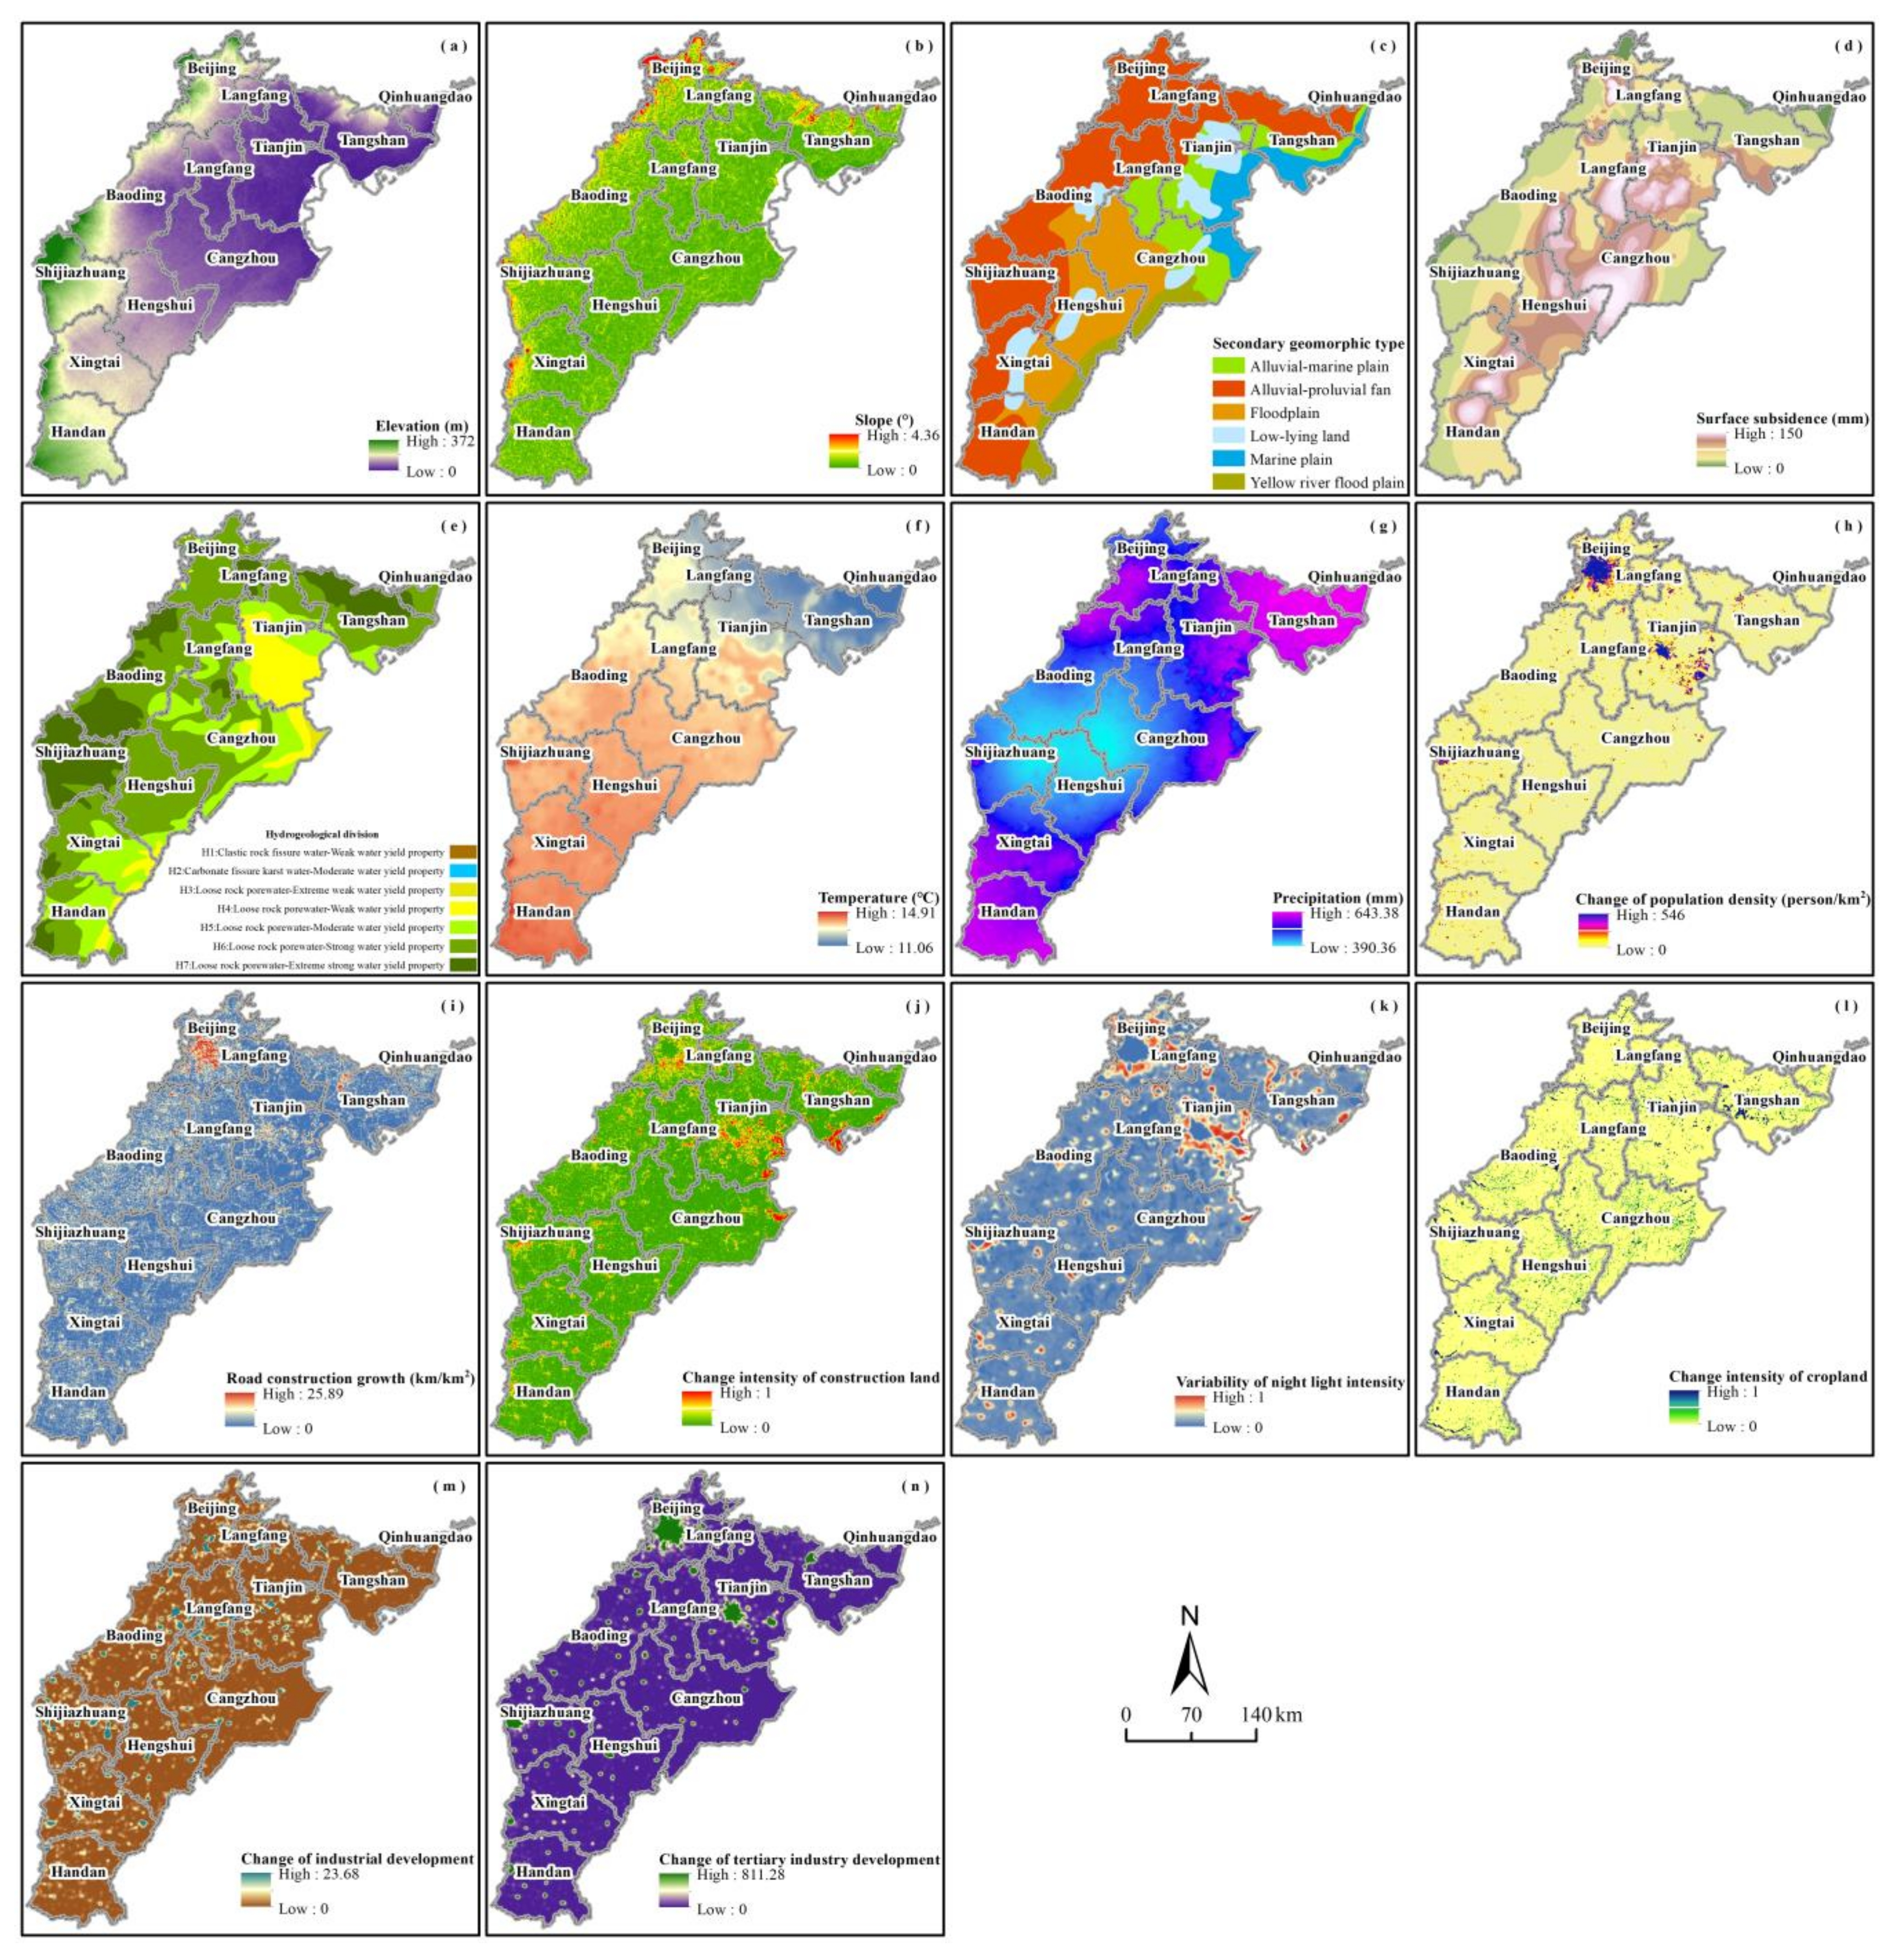
2.2.2. Impact Factor of Wetland Change
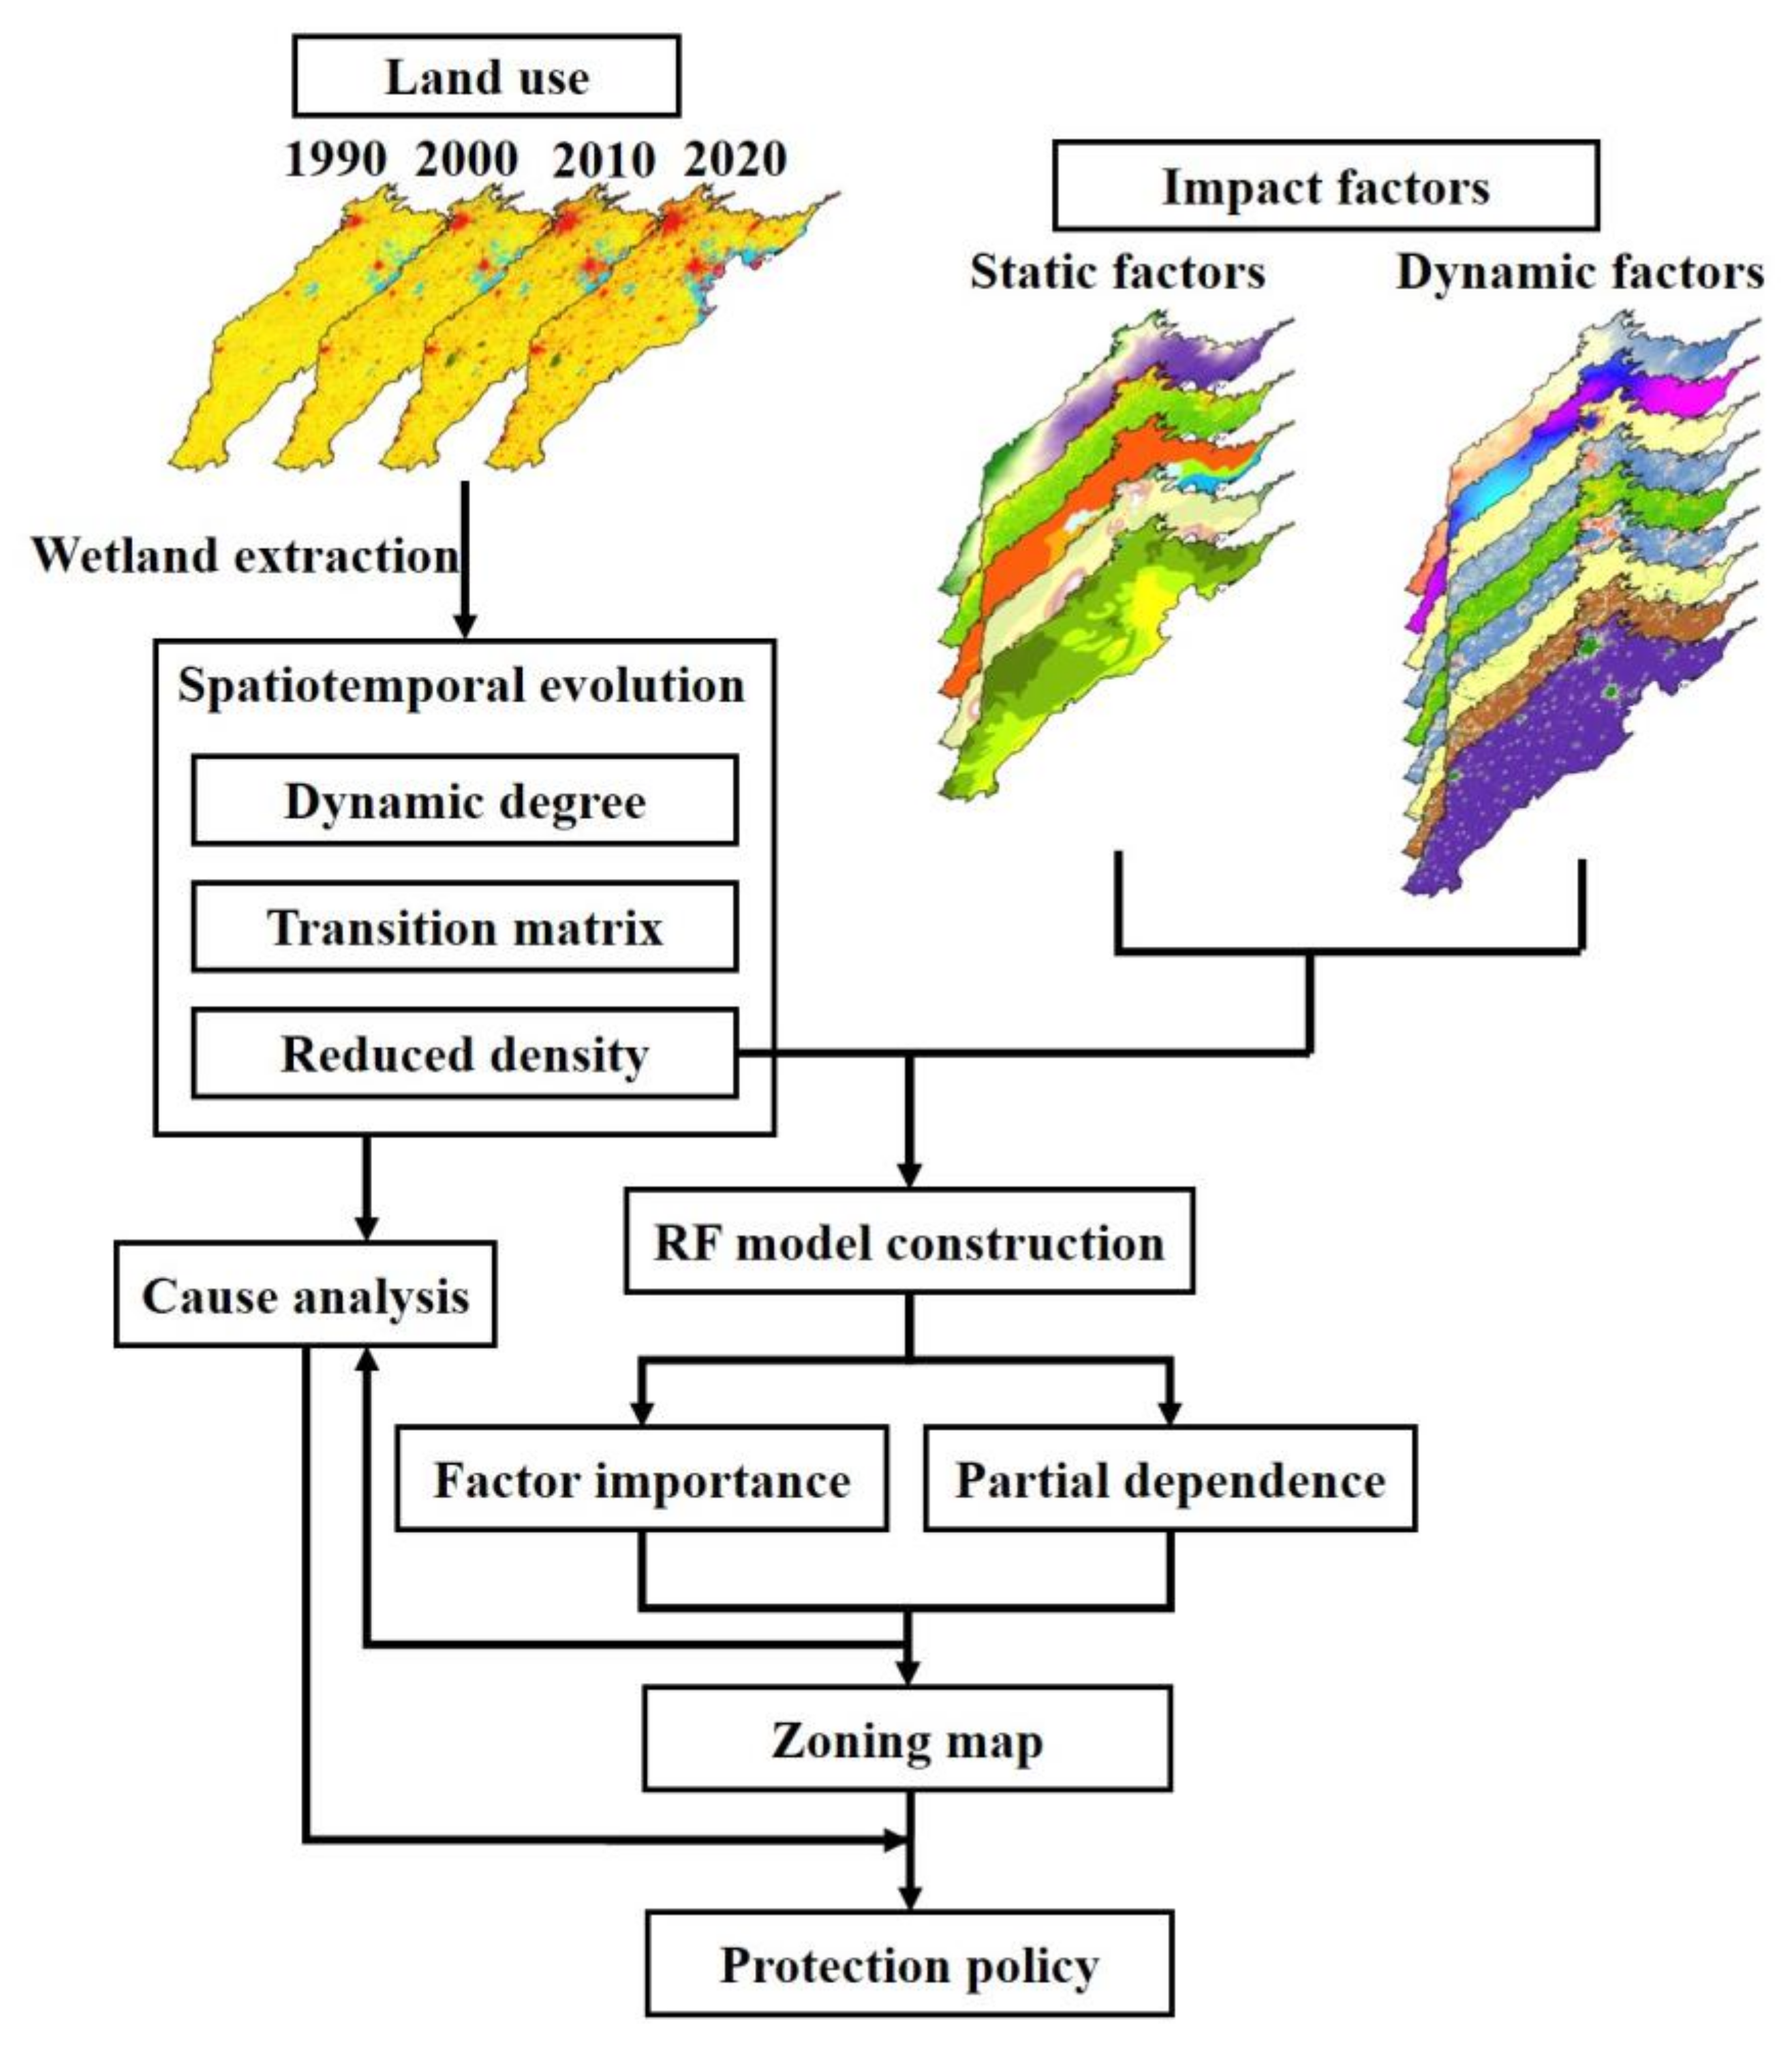
The change of wetlands is often the result of the combined effects of natural and anthropic factors [39]. In our study, based on full consideration of geomorphology and geological condition of the study area, we selected 14 factors of four types, including topography, geology, meteorology, and anthropology, to construct an index evaluation system of wetland change by combining the distribution characteristics of wetlands with previous research [40,41,42,43,44]. The data sources of all factors are shown in Table 1, which are consistent with the wetland data in time and space. In particular, the precipitation data and temperature data include 1990 to 2020, the population density data and night light data include the two years of 1990 and 2020, the road data includes the two years of 2007 and 2020, and the POI (point of interest) data includes the two years of 2012 and 2020. Their processing is described below.
The topographic factor is the key to controlling the distribution of wetlands, which consists of elevation (Figure 4a), slope (Figure 4b), and secondary geomorphic type (SGT) (Figure 4c). Elevation is associated with the flow direction of surface water, and the recharge of groundwater to surface water, which can affect the spatial distribution of wetlands [45]. Slope is also an important factor of wetland distribution, as a steeper slope often represents a higher velocity and lower proportion of surface water [46]. The geomorphic type is the product of the combined action of exogenic force and endogenetic force, which determines the regional natural conditions and further affects the use of land and the distribution of wetlands [47]. Elevation and slope were determined using a digital elevation model (DEM).
The geological factor determines the physicochemical properties of rock stratum and further affects the burial depth and distribution of groundwater, which includes surface subsidence (Figure 4d) and hydrogeological division (Figure 4e). The surface subsidence in the study area is mainly caused by pumping a large amount of groundwater, which can indirectly affect the supply of surface water [48]. Different hydrogeological divisions provide different geological environments for groundwater, thus resulting in differences in water production capacity [49]. The surface subsidence was transformed into continuous data by setting the contour spacing according to the original data, and the hydrogeological division was characterized by the combination of rock group and water-bearing property.
The meteorological factor affects the processing of the wetland ecosystem by restricting the soil temperature and hydrologic rhythm, and directly changes the distribution and quantity of wetlands, which includes temperature (Figure 4f) and precipitation (Figure 4g). Temperature is the most fundamental dynamic factor to control the change of wetlands, which affects the actual vapor flux under the comprehensive effect of climate, soil, and vegetation, and has a certain negative correlation with wetland area [50]. Precipitation provides important water supply for wetlands, has an obvious impact on the hydrological characteristics of wetlands, and directly restricts the number of wetlands [51]. Temperature and precipitation were represented by the annual average value from 1990 to 2020.
The anthropic factor is a key exogenous force that affects the structure of land use, and is represented by change of population density (CPD) (Figure 4h), road construction growth (RCG) (Figure 4i), change intensity of construction land (CICL) (Figure 4j), variability of night light intensity (VNLI) (Figure 4k), change intensity of cropland (CIC) (Figure 4l), change of industrial development (CID) (Figure 4m), and change of tertiary industry development (CTID) (Figure 4n). Population growth not only directly affects urban expansion but also promotes the development of different types of industries, and comprehensively leads to the change of land structure [52]. Road construction encroaches on wetlands and destroys the integrity of wetlands, and further leads to wetland reduction [53]. The urban expansion also encroaches on or divides wetlands, and has more significant irreversibility [54]. Different types of economic activities have different direct or indirect impacts on wetland changes according to their own characteristics [55]. Therefore, it is necessary to use different factors to describe different economic activities. CPD was generated by calculating the difference between 2000 and 2020 and was used to characterize population growth. RCG was created using Formula (3) to calculate the difference between 2007 and 2020, and was used to characterize road construction. CICL and CIC were created by using Formula (3) to calculate the difference between 1990 and 2020, and were used to characterize urban expansion and cropland expansion, respectively. VNLI was generated by calculating the difference between 1990 and 2020 and was used to characterize overall economic activity. POI are geographical entities closely related to human life, such as factories, catering services, scenic spots, and life services, which contain information such as name, category, and coordinates. Based on previous studies, POI were used and split to reveal different types of industrial activities [56]. The higher the POI kernel density, the more concentrated human activities in a region. CID was created by calculating the difference in the kernel density of the corresponding POI category between 2012 and 2020, while CTID was generated by calculating the superposition difference among 11 POI categories such as catering services, scenic spots, and life services between 2012 and 2020, and both were used to characterize the change in the development of secondary industry and tertiary industry, respectively [57]. All of the aforementioned anthropic factors, as calculated by using Formula (3), were represented by the difference between the two years, usually the latter year subtracted by the previous year.
To maintain the consistency of research data, all impact factors were converted into a 1 km × 1 km raster, and a geospatial database was established by combining the data of wetlands. In addition, the coding method of category factors, such as secondary geomorphic type and hydrogeological division was to assign integer values starting from 1 to different categories. In addition, all impact factors were generated and created using ArcGIS 10.2 software, and CICL, VNLI, and CIC were standardized in order to show the rate of change.

2.3. Method

In this study, we used multiple statistical methods and an RF model to examine the wetland changes and its driving forces in the BTHP from 1990 to 2020. We substituted grids for administrative divisions as the fundamental unit, overcame the limitations of prior research on the driving mechanism of wetland change with panel data, and conducted the dimensional equivalence between wetland change and impact factors. Our research mainly consisted of the following four steps (Figure 5). First, we extracted the wetland data and analyzed the temporal and spatial changes of wetlands in the BTHP. Second, we quantified and visualized the change of wetlands and all impact factors. To improve the accuracy of the results, we performed secondary processing, such as continuity normalization and grading, on some impact factors. Third, we constructed an RF regression model based on the data and the logical relationship between them, output the importance and partial dependence of the factors, determined the leading role of anthropic factors, and identified the main action area of different impact factors. Finally, we developed a zoning map and proposed corresponding protection countermeasures based on cause analysis results. We used ArcGIS 10.2 (Environmental Systems Research Institute, Inc., RedLands, CA, USA), R Studio 3.6 (R Studio, Boston, MA, USA), and other software for data calculation and analysis.

2.3.1. Statistical Method

The dynamic degree model is a common method to examine wetland time-series changes and can calculate the dynamic degree of single land use and synthesis land use, respectively [58]. The dynamic degree of single land use is mainly used to study the rate and magnitude of change of a particular land category in the region, which may directly reflect the interannual change rate of the land category. The calculation formula is as follows:
K = U b U a U a × 1 T × 100 %
where K is the dynamic degree of single land use, U a and U b are the proportions of a land category in two different years, and T is the year of the interval.
The dynamic degree of synthesis land use can reflect the interannual change of the overall land category in the region, which is often used to measure the severity of land use change. The calculation formula is as follows.
L C = i = 1 m Δ L U i j i = 1 m L U i × 1 T × 100 %
where LC is the dynamic degree of synthesis land use, L U i is the proportion of land category i, Δ L U i j is the proportion of land category i converted to other land categories in a certain year, and T is the year of the interval.
In addition, the change density of the land category was used to represent the change proportion of particular land categories in the study area, which was also used as the dependent variable in this study. Then, the calculation result was visualized by using the inverse distance weighting method in ArcGIS 10.2 software. The calculation formula is as follows:
R D = W n F n × 100 %
where RD is the change density, W n is the change area of certain land categories on the fishing net polygon n, F n is the fishing net polygon n with an area of 1 square kilometer.

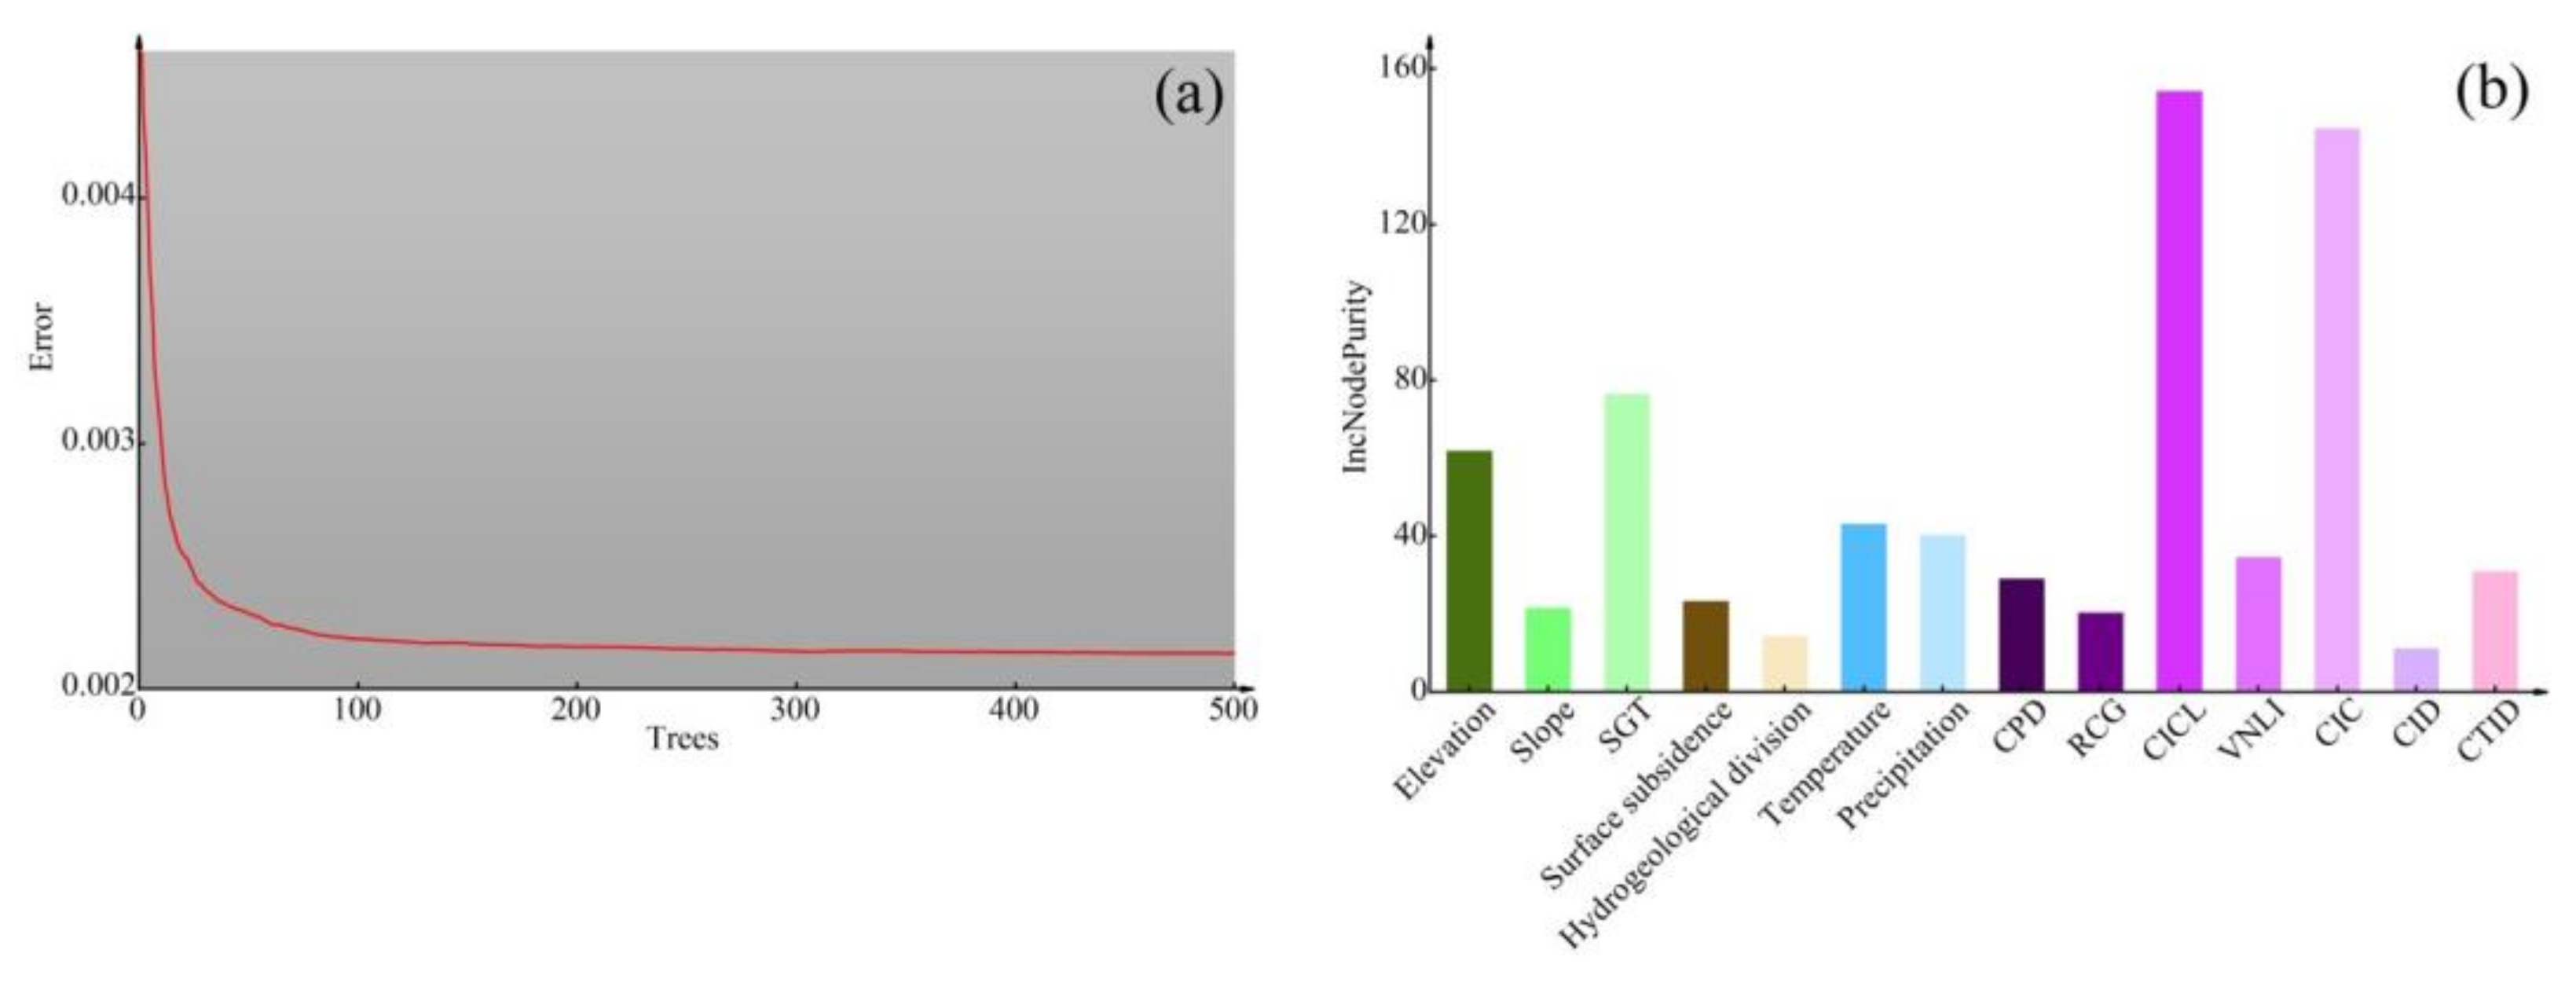
2.3.2. Random Forest (RF)

Multicollinearity refers to the high correlation between independent variables in the regression model, which makes the model estimation inaccurate and is always tested before the construction of the regression model. Tolerance and variance inflation factor (VIF) are usually used to estimate whether there is multicollinearity between independent variables [59]. Usually, the independent variable with a tolerance less than 0.1 or VIF greater than 7 is redundant and needs to be replaced or removed, while the independent variable with a tolerance greater than 0.1 and VIF less than 7 can be added to the model for calculation. The multicollinearity test was completed in SPSS 20 software.
Random forest (RF) is an integrated algorithm proposed by Breiman to construct multiple decision trees from different data subsets [60]. The basic idea of RF is that several independent decision trees make judgments or predictions on the introduced samples and features, then vote on the judgment results of multiple decision trees, and the class that wins the most votes is the model output [61]. RF breaks through the limitations of the traditional linear regression model, can reflect the nonlinear relationship between characteristic variables and the target, and ignores the normal distribution and independence of data, which is widely used in classification and regression tasks [62].
The mtry and ntree are two primary hyperparameters in RF; the former is the number of factors in each decision tree and the latter is the number of decision trees in the model [63]. Usually, when dealing with regression tasks, the mtry is set to 1/3 of the number of factors, and the ntree is set to 500 to ensure model diversity [64]. As the output of the model, IncNodePurity is usually used to evaluate the importance of impact factors [65]. A larger IncNodePurity indicates that the impact factor has a greater influence. The RF model for this study was implemented by calling the randomForest package in R Studio 3.6 software. In the RF model, the default parameter was set as 10-fold cross-validation (to prevent overfitting), and ntree and mtry were set as 500 and 6, respectively, to calculate IncNodePurity.

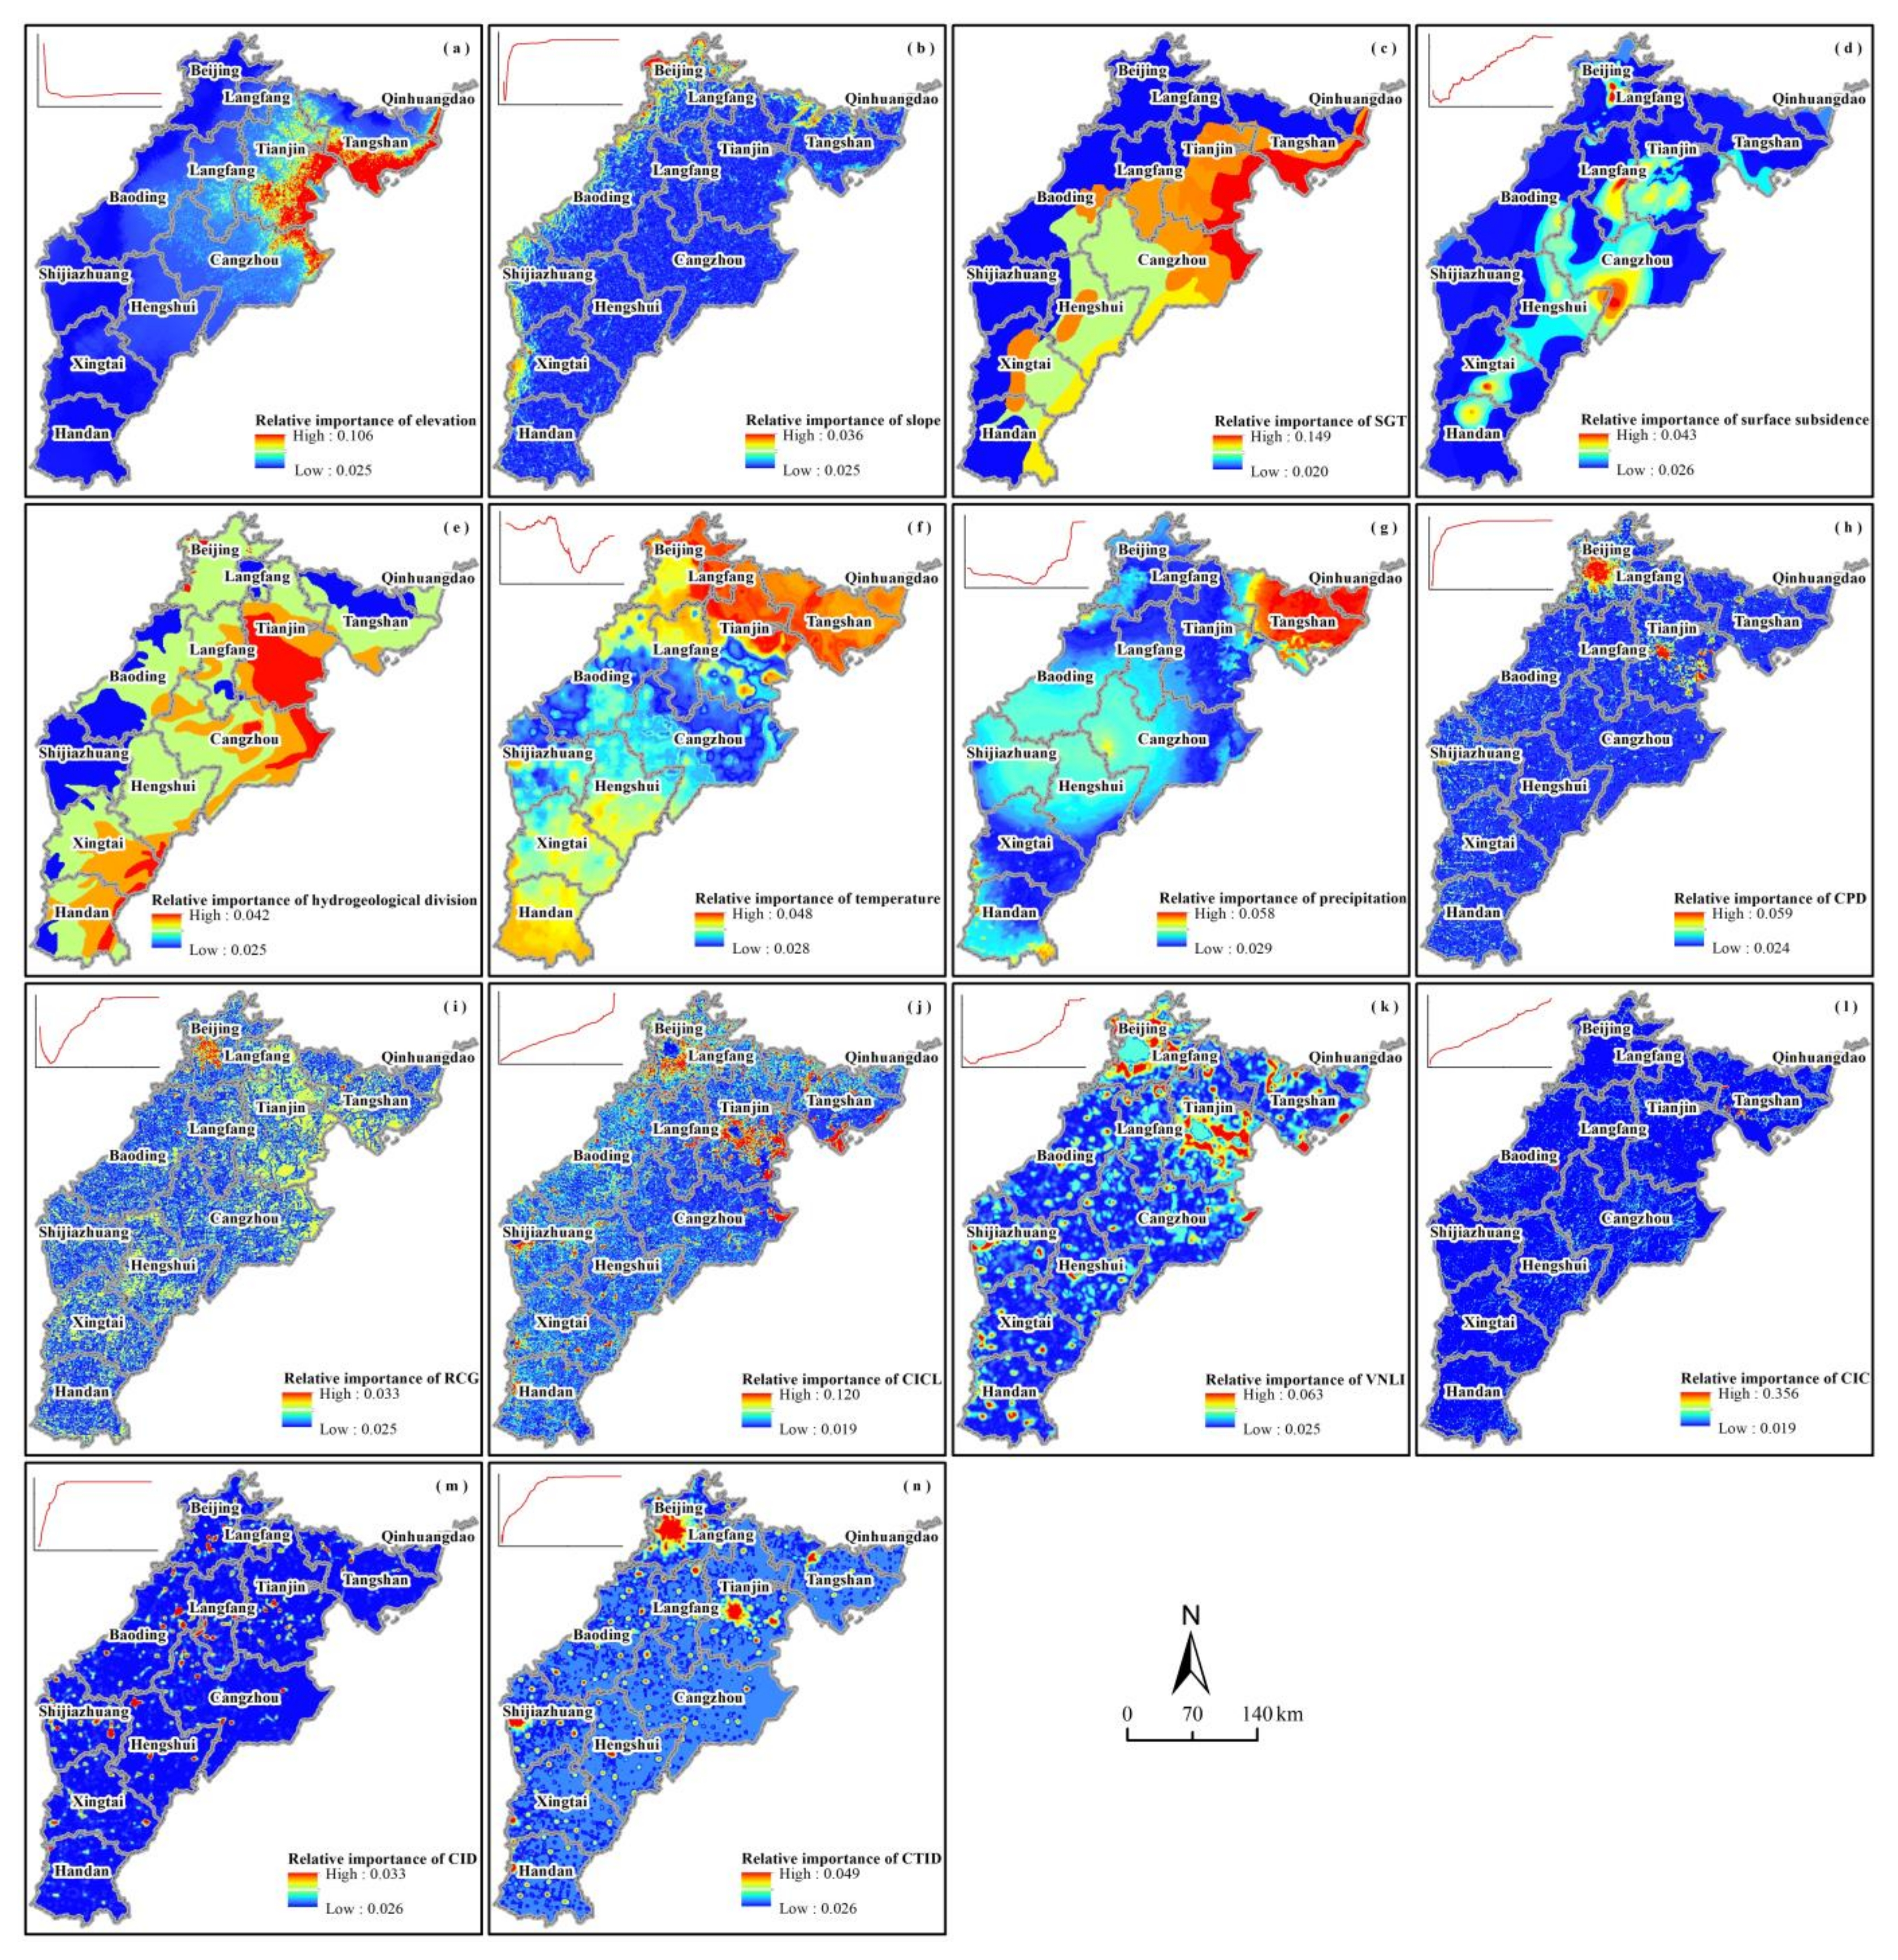
2.3.3. Partial Dependence Analysis

Partial dependence analysis is based on the machine learning model itself, and can reveal the relative importance of a certain feature or region of the factor to the target [66]. Different features or regions in a factor have different partial effects, and a higher value of effect indicates that the relative importance of the feature or region is greater [67]. The partial dependence plot in this study was implemented by calling the pdp package in R Studio 3.6 software, and then the partial dependence was visualized by using ArcGIS 10.2 software.

3. Results

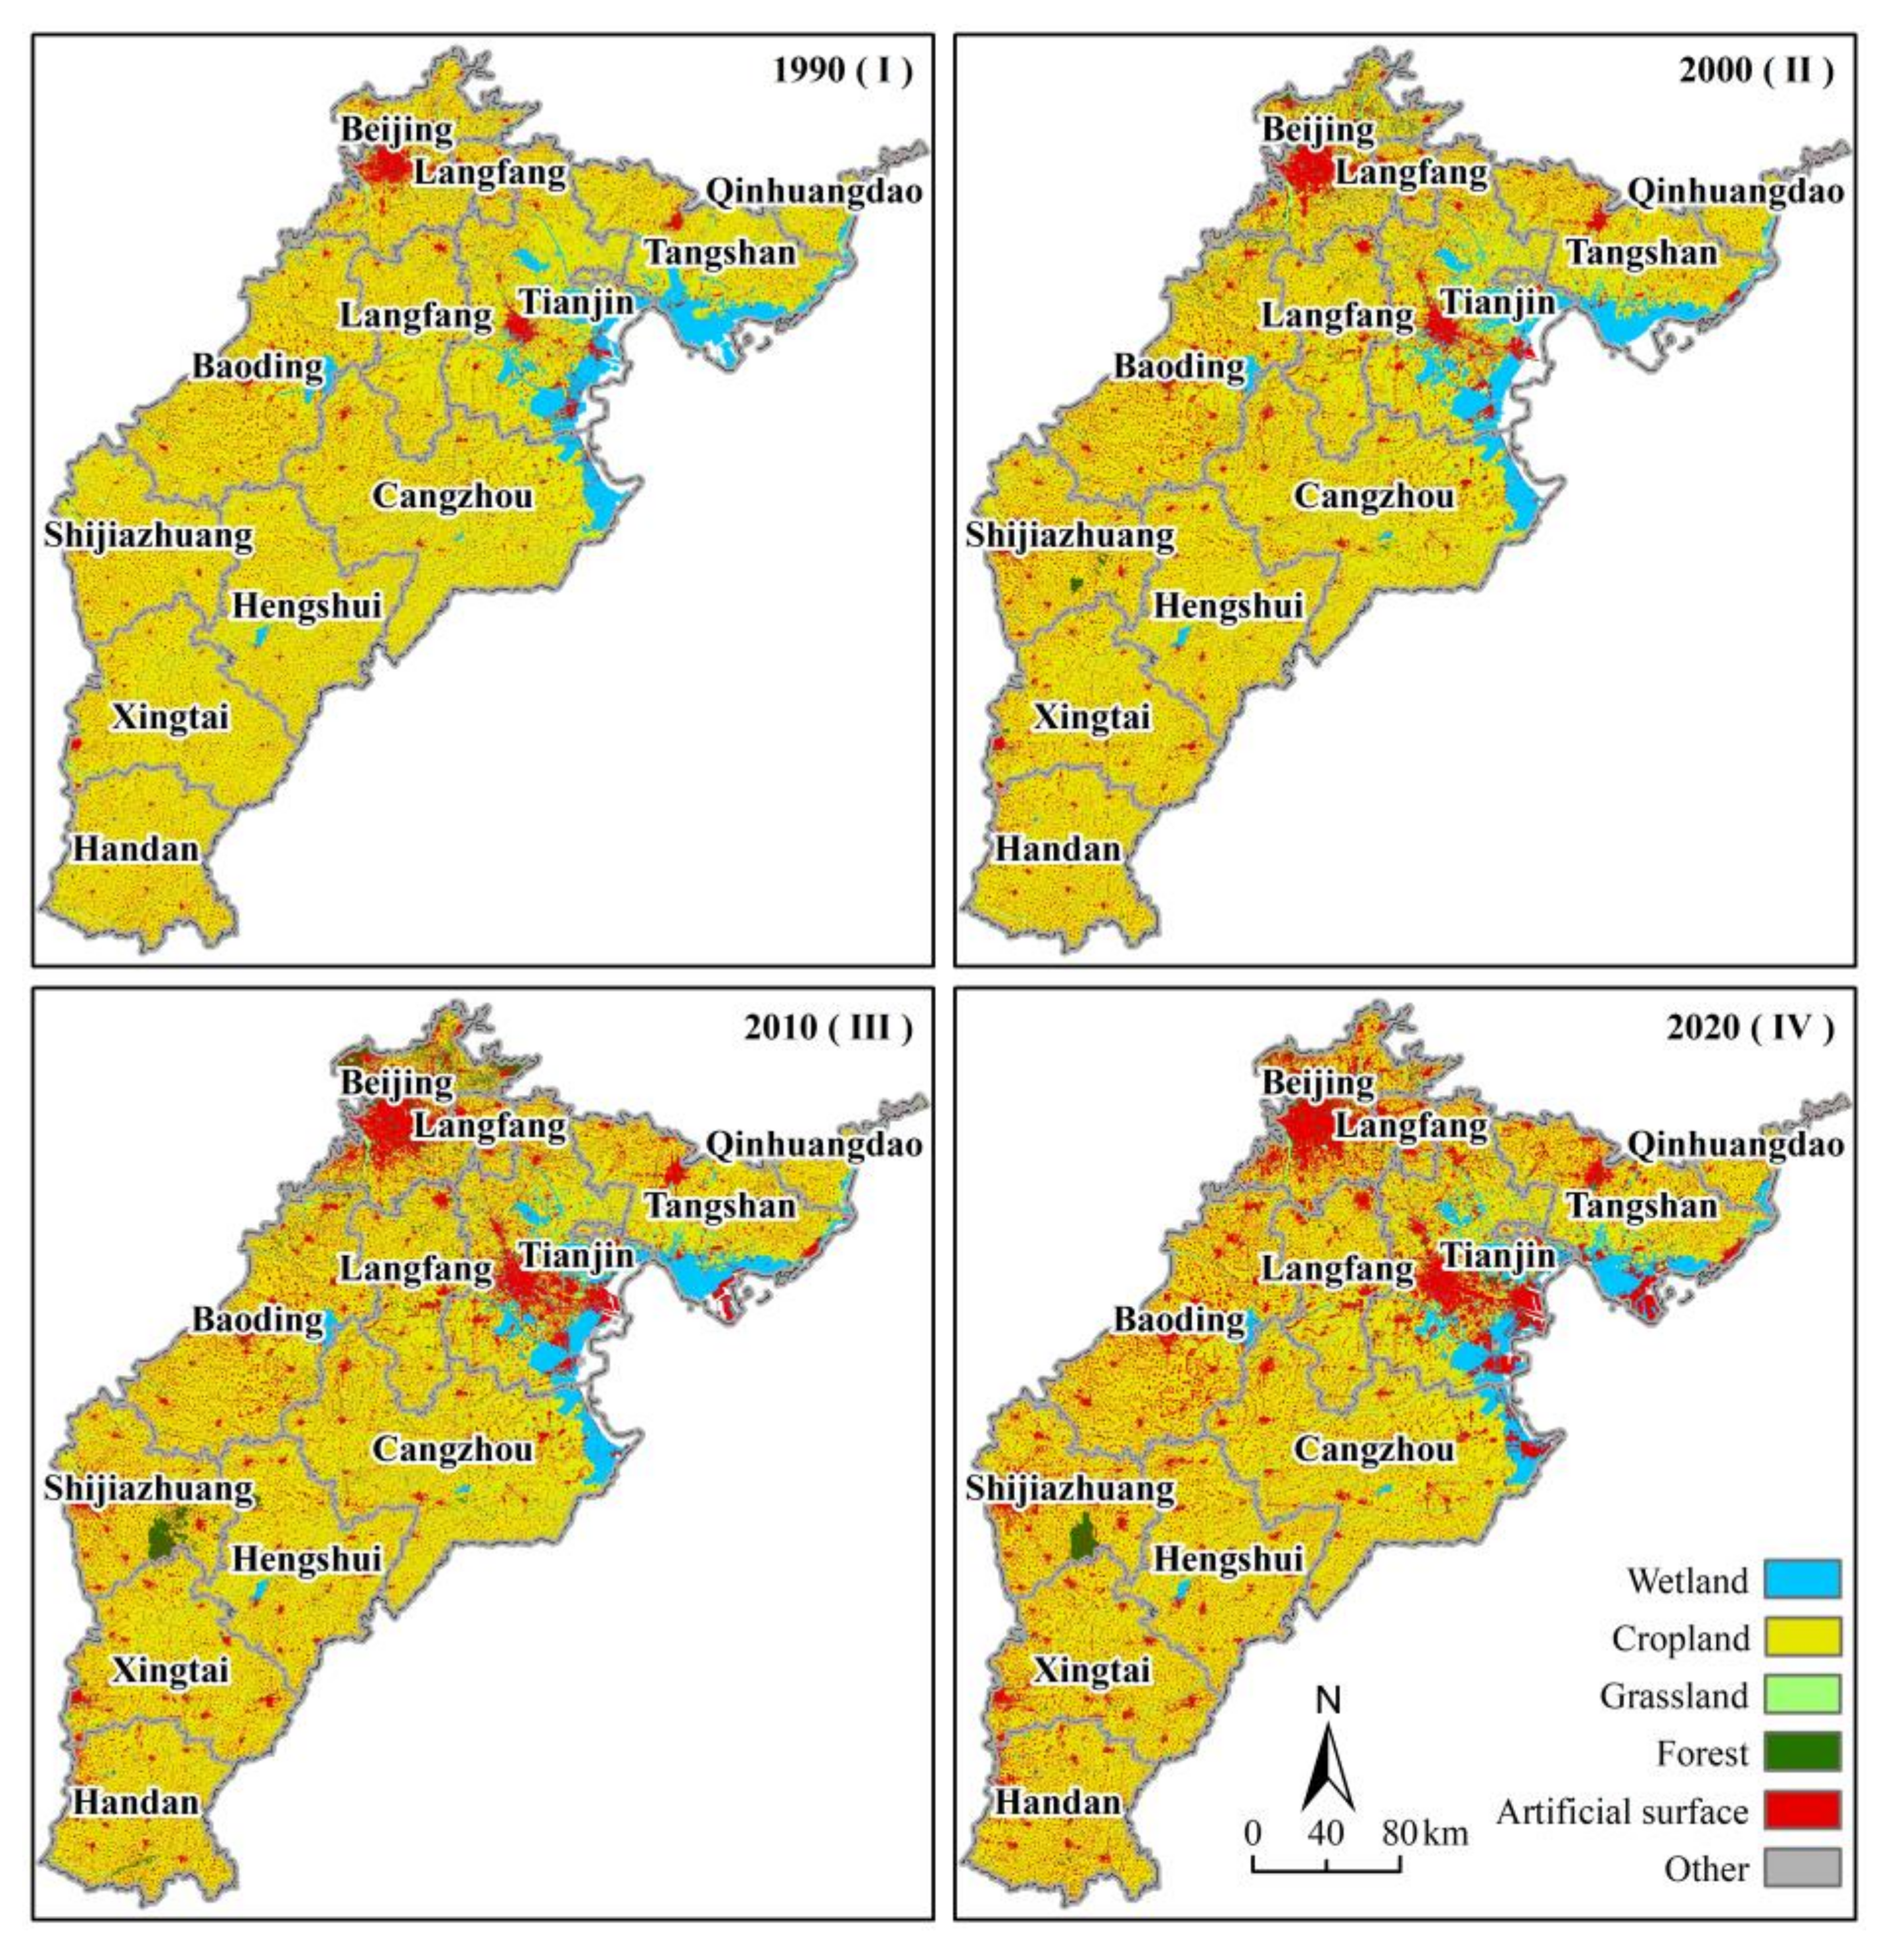
3.1. Spatial–Temporal Change Characteristics of Wetlands

The wetlands experienced a change process from a continuous decrease to a slight increase from 1990 to 2020 (Table 2). In 1990–2000, the wetlands were in a significant decrease period with a total reduction of 677.07 km2, and the extensive degradation of rivers and reservoirs was the main reason for the significant decrease in this period. Lakes and rivers showed the most significant degradation rate with the Si of −2.94 and −2.56, respectively, followed by marshland and reservoir. In 2000–2010, the wetlands decreased at a slower rate with a total reduction of about 240.97 km2, and the reduction of reservoirs was the main reason for the decrease in this period. Lakes still showed the most significant degradation rate with the Si of −2.02, reservoirs showed a slightly slower degradation rate, and rivers and marshlands showed significantly declined degradation rates with the Si of −0.19 and −0.15, respectively. In 2010–2020, the wetlands were in a slight increase period with a total increment of 177.01 km2, and the expansion of rivers was the main reason for the increase in this period. The area of the lake and river increased significantly, with the Si rising by 6.44 and 4.56, respectively; the area of marshland further decreased, with the Si rising by about 0.67; the reservoir showed a slowdown trend of reduction with the Si decreasing by about 0.25. The Sy gradually decreased from 0.94 in 1990 to 0.77 in 2020, indicating that under the comprehensive impact of natural and anthropic factors, the change of land types in the study area gradually tended to be stable, which had a positive role in limiting the change or reduction of wetlands.
The reduced density of wetlands was shown to reveal the spatial distribution of wetland reduction in the study area from 1990 to 2020, and was also utilized as the dependent variable of this study (Figure 6). This data was calculated by using Formula (3) and consisted of 86,395 grids with the value ranging from 0 to 1 and the size of 1 km × 1 km. There were 24,798 grids with values greater than 0 and 23,939 grids with values between 0 and 0.5. Particularly, 859 grids had a value larger than 0.5 and were concentrated in the southern region of Tangshan, the eastern region of Tianjin and Cangzhou, and Baiyang Lake in the east of Baoding. The map revealed that, from 1990 to 2020, the deterioration of wetland areas along the Bohai Rim was the most severe; the degradation of wetland areas in other regions did not have a notable areal distribution, and primarily exhibited linear expansion.

3.2. Factor Importance and Partial Dependence
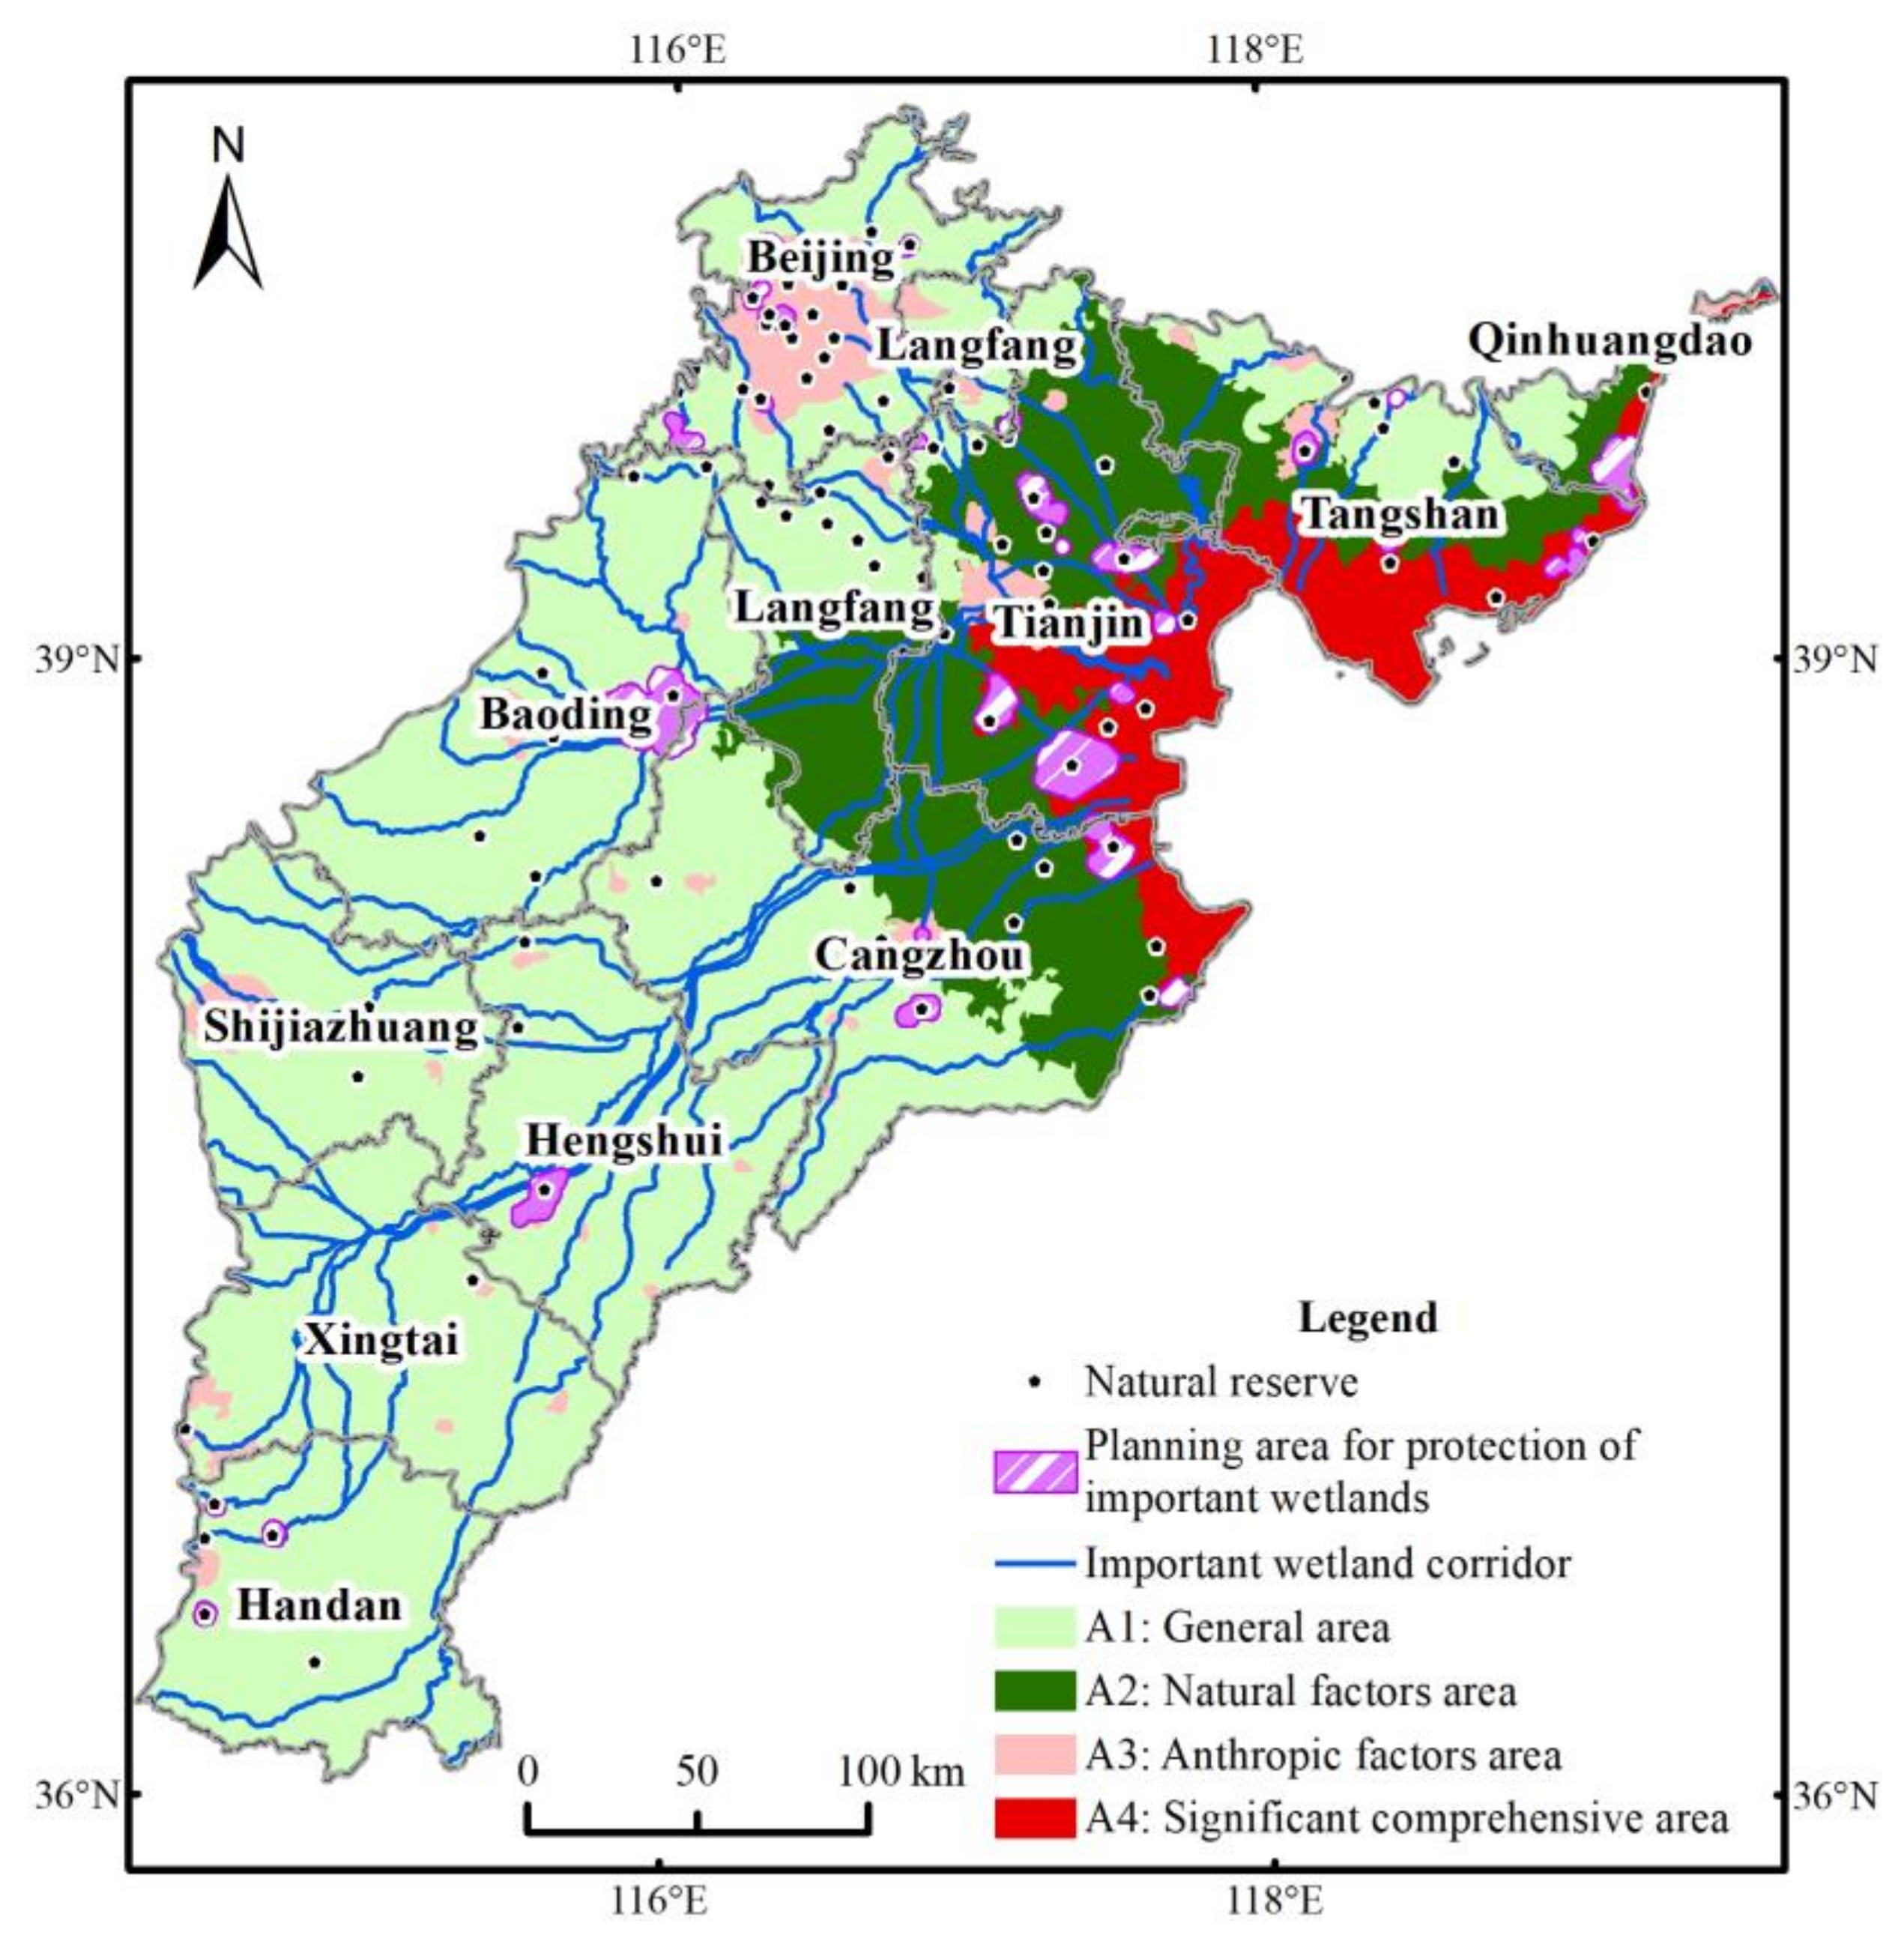
All impact factors passed the multicollinearity test (Table 3). Each factor had a tolerance greater than 0.1 and a VIF less than 7, indicating that the collinearity between different factors was not significant. Then, all 14 impact factors that passed the multicollinearity test were used as independent variables to construct a random forest regression model.
The random forest regression model was constructed based on the generated dependent variable and 14 independent variables, and the optimal parameters were obtained after the error became stable (Figure 7a). Specifically, 86,395 samples participated in the construction of the regression model, the value of mtry was 5, the number of trees was 500, and the overall goodness of fit of the model (%Var explained) reached 80.79%.
As an essential model output parameter, the RF model estimated the importance of factors by the IncNodePurity (Figure 7b). According to the value of IncNodePurity, the ranking of importance was: CICL, CIC, SGT, elevation, temperature, precipitation, VNLI, CTID, CPD, surface subsidence, slope, RCG, hydrogeological division, and CID. In summary, the anthropic factor played an essential role in wetland change and the CICL and CIC ranked first and second in importance, respectively. The impact of the topographic factor was next, and the ranking of importance of SGT and elevation was obviously higher than that of the slope. The impact of meteorological factors on wetland change was greater than that of the geological factor, and the ranking of importance of temperature and precipitation was higher than that of surface subsidence and hydrogeological division.
The partial dependence indicated the overall trend and sensitivity range of the continuous factors, as well as the effect difference and sensitivity category of category factors (Figure 8). The relative importance of elevation continued to decline after reaching the highest value at 0 m and then gradually stabilized after 5 m, mainly acting on the Bohai Rim area. The relative importance of the slope rose first between 0–0.18° then maintained a stable high level between 0.18–4.36°, and mainly acted on the mountain–plain boundary in the northwest of the study area. The relative importance of SGT was highest in the eastern marine plain, second in low-lying land where important protected wetlands such as Baiyangdian were located, and lowest in the western alluvial–proluvial fan. The relative importance of surface subsidence decreased and then increased between 10–150 mm, reached the highest value at 150 mm, and mainly acted on the middle of Beijing and the south of Cangzhou. Among hydrogeological divisions, H1 had the highest relative importance and H7 had the lowest relative importance. The relative importance of temperature first rose between 11.06–12.67 °C, decreased between 12.76–13.71 °C, then rose again between 13.71–14.91 °C, and mainly acted on the north of Beijing, Langfang, and Tianjin. The relative importance of precipitation first decreased slowly between 390.36–535.13 mm, then increased between 535.13–617.27 mm, maintained a stable high level after reaching the greatest value at 617.27 mm, and mainly acted on Tangshan and Qinhuangdao.
The relative importance of CPD first increased between 0–157, maintained a stable high level between 157–546, and mainly acted on the middle of Beijing and Tianjin. The relative importance of RCG first decreased between 0–2.36, then increased between 2.36–13.41, maintained a stable high level between 13.41–25.89, and mainly acted on Beijing and Tangshan. The relative importance of CICL rose continuously between 0–1 and reached the greatest value at 1, and mainly acted on the periphery of the built-up area and the Bohai Rim. The relative importance of VNLI rose continuously between 0–0.95 and maintained a stable high level between 0.95–1, and mainly acted on the urban expansion area. The relative importance of CIC rose continuously between 0–1 and reached the greatest value at 1, and mainly acted on the west of Tangshan and Shijiazhuang, the middle of Baoding, and Tianjin. The relative importance of CID first increased between 0–3.77, then maintained a stable high level between 3.77–23.68, and mainly acted on Shijiazhuang, Tianjin, the east of Baoding, the south of Beijing and Langfang, and the west of Cangzhou. The relative importance of CTID first increased between 0–309.72, then maintained a stable high level between 309.72–811.28, and mainly acted on the built-up area such as Beijing, Tianjin, Shijiazhuang, and other cities.

3.3. Planning Map

The results of partial dependence revealed that the spatial effects of different impact factors varied significantly. In order to effectively address the degradation and reduction of wetland resources and to actualize the man–land coupling and the sustainable development social economy, functional subareas were required and should have been divided. Different protection strategies were then able to be devised scientifically and rationally based on the functional subarea.
The zoning map of wetland protection and restoration was created by combining the established ecological network in the study area and the main driving mechanism of wetland changes in different regions (Figure 9) [68]. Natural wetlands such as marshlands and lakes have multiple values such as ecology and economy, and as important ecological corridors, rivers can provide water supplies for them. The whole study area was divided into four subareas: general area (A1), natural factors area (A2), anthropic factors area (A3), and significant comprehensive area (A4). The general area had the natural value (the average value of the relative importance of all natural factors) of 0.197 and the anthropic value (the average value of the relative importance of all anthropic factors) of 0.199, covered multiple main rivers such as Luanhe River, multiple secondary rivers such as Fuyang River and Zhanghe River, and Baiyang Lake, Hanshiqiao Wetland, and other important nature reserves. The natural factors area had the natural value of 0.251 and the anthropic value of 0.199, covered multiple main rivers such as Nanyun River, multiple secondary rivers such as Jiyun River and Qinglongwan River, and Qilihai Wetland, Nandagang Wetland, Tuanbo Bird Wetland, and other important wetlands and nature reserves. The anthropic factors area had the natural value of 0.205 and the anthropic value of 0.231, covered multiple main rivers such as Ziya River and Beiyun River, multiple secondary rivers such as Wenyu River and Douhe River, and Hengshui Lake, and many important natural wetlands. The significant comprehensive area had the natural value of 0.359 and the anthropic value of 0.211, covered multiple main rivers such as Yongding River, multiple secondary rivers such as Daqing River and Douhe River, and Tanghe Wetland, Changli Gold Coast, and other important wetlands and nature reserves.

4. Discussion

4.1. Analysis of Spatial–Temporal Change Characteristics of Wetlands

In the past 30 years, there has been a gradual shift from a severe decline to a slight increase in the wetland area of the BTHP, while the wetland area as a whole has decreased significantly. The characteristics of this time series shift were consistent with those of the BTH’s wetlands [41]. The significant loss of wetlands was more or less an unavoidable consequence of rising global urbanization, especially in China and other developing nations [69,70]. Consistent with prior studies, 2010 was the point at which the wetlands in the study area shifted from a decline to an increase [71]. Wetland resources were gradually given more consideration as economic development shifted from high-speed to high-quality. The gradually stable land alteration mirrored the changeover of the economic growth stage in the study area, which had a beneficial influence on preventing wetland loss. The changes of rivers and reservoirs were the predominant forms of wetland changes over time and had the greatest impact, which represented the influence of human activities such as farming, fishing, and dredging on regional wetland resources [72]. In addition to the BTHP, the high vulnerability of coastal wetlands was widespread in the Laizhou Bay Coast [73], the Yangtze River Delta Estuary [74], and other parts of the world such as the central coast of Chile [75] and the Atlantic coast of the U.S. [76]. Although a huge number of wetlands had been drastically reduced, the spatial distribution characteristics was not altered considerably, and the Bohai Rim remained highly concentrated in the distribution of wetland resources.

4.2. Cause Analysis of the Spatial–Temporal Variation of Wetlands

Combining the importance ranking of the factors (Figure 7) and partial dependence (Figure 8), our study comprehensively analyzed the causes of wetlands evolution.

4.2.1. Topographic Factors

Topographic factors determine the spatial distribution characteristics of wetlands, which further affects the possibility of wetland reduction. The study area belongs to a part of the North China Plain, the overall elevation range is between 0–400 m, the slope is below 5°, and the terrain is high in the west, low in the east, and relatively flat. As one of the main control factors of wetland distribution, elevation had a significant impact on the Bohai Rim and was related to human activities. The gradually descending elevation from west to east determined the large distribution of wetland resources in the Bohai Rim [77]; in contrast, economic activities such as oil-field development, port construction, fish farming, and salt field production in this area caused the substantial reduction of wetland resources [78]. As another main control factor, slope plays a decisive role in controlling surface water runoff. The high slope along the mountain–plain boundary led to fast surface water runoff and more water loss, which was not conducive to the formation and development of wetlands [79]. In contrast, the remaining low-slope areas provided better water accumulation conditions for the formation of wetlands [80]. In addition, the restriction of slope on human development activities also had an indirect impact on the distribution of wetland resources [81]. The marine plain in the study area was mainly the regressive land after the mid-Holocene high sea level and was the most obvious secondary geomorphic type of wetland degradation [82]. The flat surface in this area provided profitable topographic conditions for the formation of wetlands, while the well-organized sediment and alkaline soil in this area offered favorable conditions for regional aquaculture and salt pan production, and led to the occupation of a large number of wetland resources [83].

4.2.2. Geological Factors

Geological factors are important basic conditions for the formation of wetlands and control the development and distribution of wetland resources. As the main type of geohazard in the study area, surface subsidence promoted the reduction and degradation of wetlands [84]. Since the 1970s, overexploitation of groundwater has led to large-scale surface subsidence and groundwater depression in Cangzhou, Beijing, Tianjin, and other cities [85]. The compression and deformation of the soil layer caused by surface subsidence changed the relevant hydrogeological parameters of the soil layer, destroyed the original pore structure, reduced the soil porosity, permeability, and water storage coefficient, weakened the water supply and storage capacity of the aquifer, limited the recharge of groundwater to surface water, and further restricted the survival of wetlands [86]. In addition, the impact of surface subsidence on the chemical composition of groundwater deteriorated the water quality and reduced the quality of wetland resources [87]. The impacts of different hydrogeological divisions on the formation and persistence of wetlands were significantly different. H1 was distributed in the northwest of Beijing, with an aquifer composed of clastic rocks such as sandstone and conglomerate, unevenly distributed groundwater in rock fissures, heterogeneous and anisotropic permeability, poor hydraulic connection, very weak water-rich and water-yielding capacity, and very limited excretory replenishment for surface water, thus having the greatest impact [88]. H7 was distributed in the north and west of the study area, with the aquifers composed of alluvial and proluvial sediments such as sands and pebbles and separated by clay sand, good bedding permeability and hydraulic connection, extremely strong water-rich and water-yielding capacity; it was conducive to the survival of wetland resources and thus had the least impact [89].

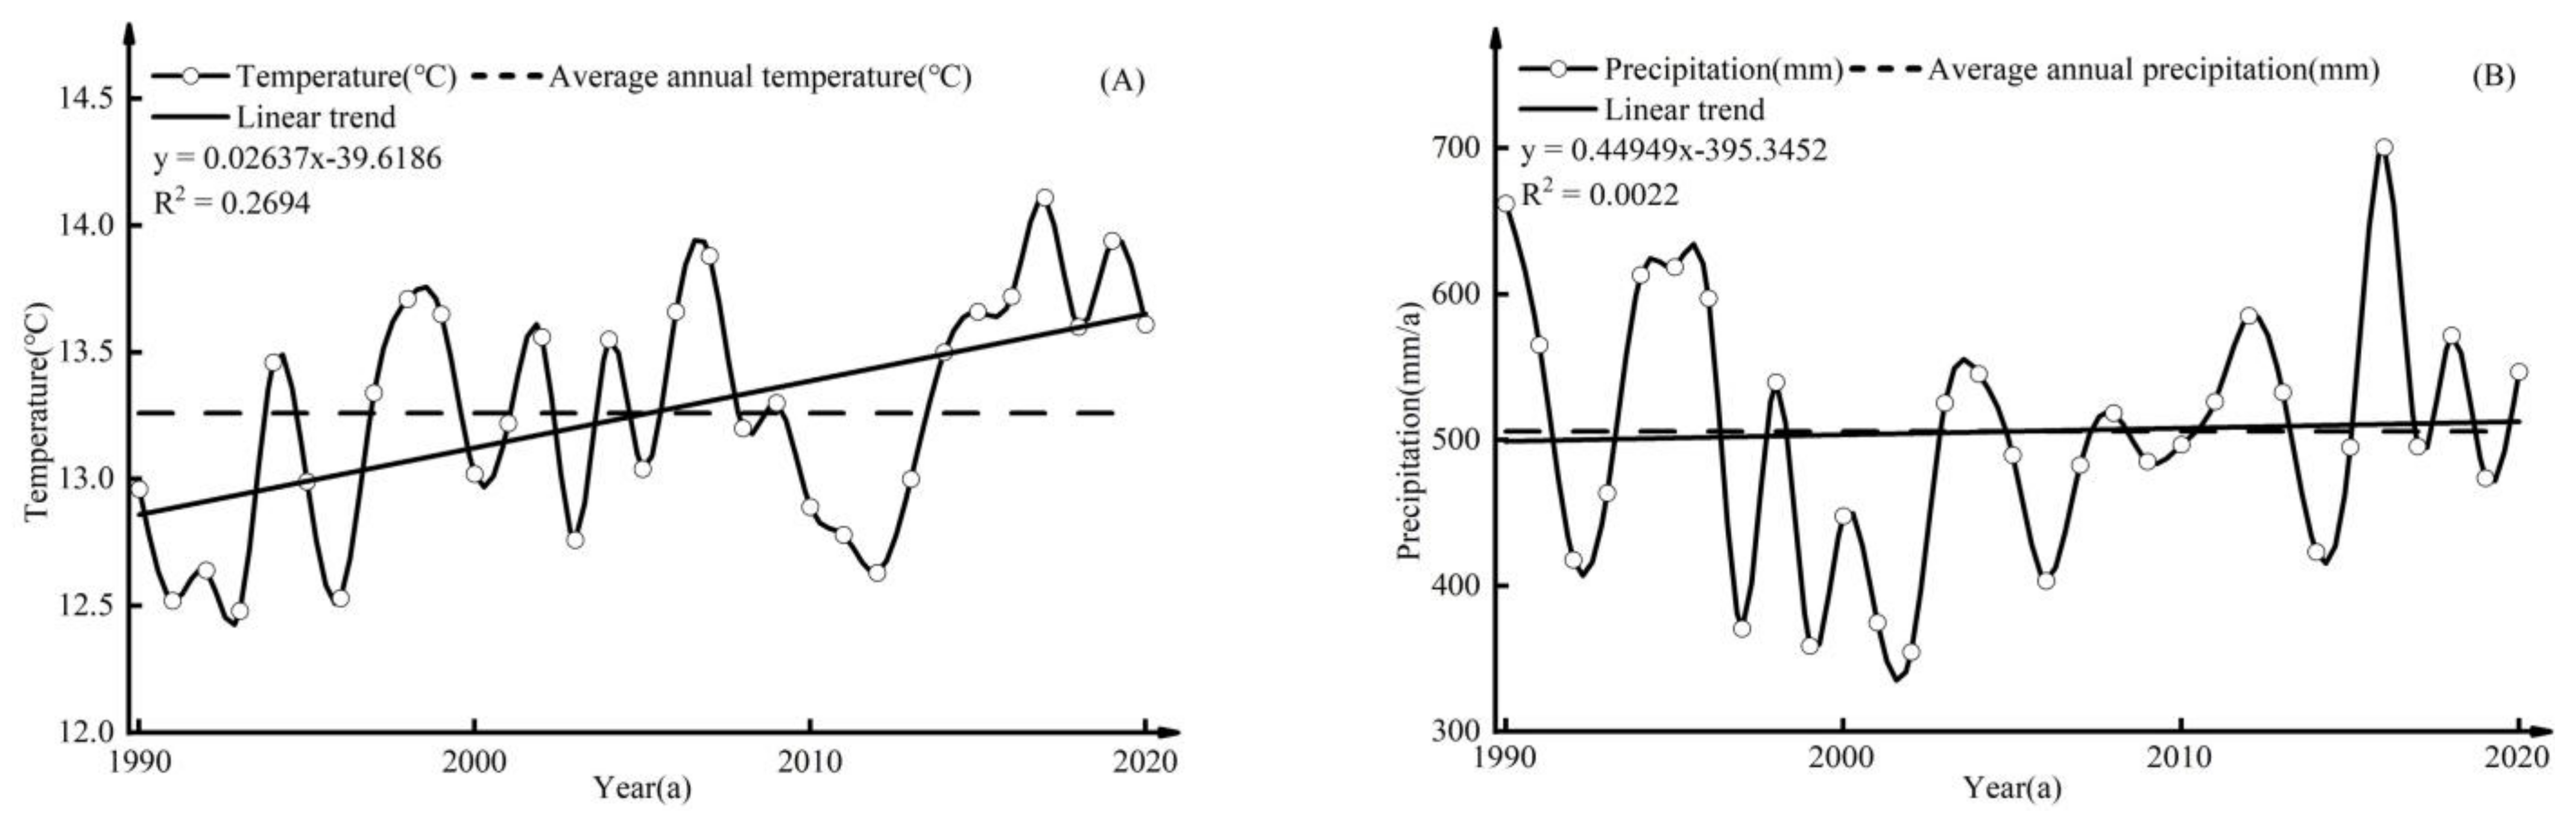
4.2.3. Meteorological Factors

Affected by the cumulative effect, the impact of meteorological factors shows a nonlinear characteristic, which also illustrates the comprehensiveness of the driving mechanism of wetland change. The relative importance of temperature generally decreased from south and north to the middle and showed an N-shaped change characteristic with the rise of temperature, while the relative importance of precipitation decreased first and then rose from the middle to the surroundings and showed a U-shaped change characteristic with the rise of precipitation. A reasonable explanation is that the superposition of multi-year data only reflected the multi-year average value, weakened the interannual fluctuation and spatial difference of meteorological factors, and failed to reveal the time series characteristics of meteorological factors [90]. Therefore, it was necessary to combine the time-series variation characteristics of meteorological factors to supplement their impact on wetland change. From 1990 to 2020, the temperature showed a significant upward trend (Figure 2). The rise in temperature increased evaporation and water loss, caused regional drought under the condition of constant or reduced precipitation, then brought the gradual decline of some wetlands that were strongly dependent on water resources due to the decrease in water content, and eventually led to the reduction of the wetland area [91]. Precipitation had significant interannual fluctuations from 1990 to 2020 (Figure 2). The fluctuating precipitation, especially the precipitation difference between dry years or wet years and normal years, directly affected the water supply of wetlands. The increase in precipitation was conducive to the increase of river runoff and the growth of wetland vegetation, while the decrease in precipitation directly led to insufficient water for wetlands and affected the moisture content of vegetation and soil in wetlands, and eventually restricted the number of wetlands [92].

4.2.4. Anthropic Factors

As the main driving forces, anthropic factors dominate the degradation of wetland resources through different forms in different regions. CPD mainly affected Beijing and Tianjin, and showed a positive correlation with wetland reduction. The population of the 11 cities increased by about 53.64 million from 1990 to 2020 and exceeded 102 million in 2020. In the cities, the growth of population density required more dwellings, infrastructure, and water consumption. The increase in land use was intensive and the utilization of wetlands inevitably caused the reduction or damage of urban wetlands [93]. In suburban and non-urban areas, with the ever-increasing demand for food and the pursuit of quality of life, people reclaimed a large amount of high-quality land to develop agriculture, animal husbandry, and aquaculture, destroyed the structure and hydrological process of wetlands, and affected the survival of wetlands [94]. RCG mainly affected Beijing and Tangshan, and also showed a positive correlation with wetland reduction. According to statistics, since 2007, the roads of different grades in the study area had increased by about 156,400 km, and the roads in Beijing and Tangshan had increased by about 22,100 and 12,600 km, respectively. In addition to directly encroaching on wetlands, road construction, especially road network construction, destroyed the wetland landscape structure, limited the development space of wetlands, and further caused the isolation and degradation of wetland resources [95]. In addition, physical pollution such as noise and light, and chemical pollution such as melted salt, petroleum substances, and heavy metal ions caused by the construction and later operation of expressways and roads that changed the physicochemical conditions along the road, led to soil and water loss and soil erosion, subsequently affecting the quality of wetlands [96]. As one of the main drivers of wetland change, CICL showed a significant negative correlation with wetland change. The necessity of urban expansion and limited land resources led to the conflict between construction land and wetlands [75]. From 1990 to 2020, the transformation area of wetlands to artificial surfaces in the study area was about 1218.15 km2, and the most significant ones were in Beijing and Tianjin. The construction of urban facilities in the periphery of built-up areas and the construction of docks, fishing grounds, and saltworks in the Bohai Rim affected wetlands to varying degrees, leading to the disappearance and degradation of wetlands [97]. In addition, spoils and rocks generated during the construction process also destroyed the structural integrity of the wetlands to a certain extent [98].
The impact factors that represent different types of industries or economic activities have different spatial action areas and are negatively correlated with wetland changes. VNLI mainly acted on the urban expansion area. With the expansion of the city scale, the gradually intensive economic activities in these areas inevitably threatened the wetland resources. In addition, VNLI also showed a high level in many villages and towns. The wetland resources in and around these areas were at higher risk because farming or other economic activities in these areas were based on the principle of proximity to residences rather than planning [99]. CIC was one of the dominant factors leading to wetland change. The good geographical conditions and large population led to the large-scale development of agriculture, and the wetlands became the main target of agricultural expansion because of their good productivity and water storage capacity [100]. From 1990 to 2020, about 1046.21 km2 of wetlands were transformed into cropland. Moreover, trenching during farming changed the hydrological conditions required for wetland maintenance, the construction of reservoirs cut off the hydraulic connection from upper reaches, the massive and unreasonable exploitation of groundwater dropped surface and groundwater levels, and chemical fertilizers and pesticides discharged into the runoff led to the eutrophication of wetlands [101].
The impact of CID showed clear directivity. The BTHP shows strong strength in basic industries and a complete range of industrial systems, especially the petroleum industry, metallurgical industry, and marine industry, and is the largest industrial concentration area in northern China [102]. From 1990 to 2020, the proportions of the secondary industry in Shijiazhuang, Tianjin, Baoding, and Langfang were stable at about 45%. The development of industry inevitably increased the demand for land and water, changed the original land use structure, and the wetlands, as a vulnerable link in the land use structure, became the most obvious type of land use change. Meanwhile, in order to build supporting facilities, the area occupied by the factory was much larger, and the reversibility of transformation between the factory and the wetland was extremely low [103]. In addition, pollutants such as waste gas and wastewater discharged during industrial production not only led to wetland eutrophication, but also destroyed wetland biodiversity [104]. The impact of CTID showed significant spatial differences. Affected by the industrial characteristics and market, the tertiary industry was mostly concentrated in cities. Meanwhile, the difference in urbanization level and economic volume limited the scale of the tertiary industry, and led to significant differences in the impact of the tertiary industry in different cities [105]. As the leader of economic development, the output value of the tertiary industry in Beijing and Tianjin exceeded 60% in 2020 and continued to rise. With the gradual increase of land and water consumption for catering, shopping, accommodation, and other tertiary industries, the integrity of wetlands was bound to be threatened [106].

4.3. Cause-Based Policy Advice

Wetland resources provide considerable ecosystem service functions and are an important guarantee for the implementation of human–land coupling development, which necessitate a high level of care and protection [107]. In the meantime, the primary driving factors of wetland change in different sections of the study area varied significantly (Figure 9). Therefore, distinct levels and scales of protection policies should be created based on the zoning and action intensity of particular impact factors.
Overall, protection policies with different focuses should be formulated in distinct subareas according to the zoning (Figure 9). In the general area, we should focus on protecting the integrity of internal wetland resources, rely on the self-regulation function of the regional ecosystem to achieve wetland development, strengthen the construction and protection of important wetlands such as Baiyang Lake and Hanshiqiao Wetland, and improve the protection of major rivers such as Luanhe River, Fuyang River, and Zhanghe River and their tributaries. In the natural factors area, we should focus on dynamic monitoring, carry out the dynamic monitoring of wetlands, organisms, and real-time climate change in the area, ensure the integrity of wetland ecosystems in Qilihai Wetland, Tuanbo Bird Wetland, and other natural reserves, and strengthen the protection of important wetland corridors such as Nanyun River, Jiyun River, and Qinglongwan River and the ecological restoration of key sections. In the anthropic factors area, we should focus on limiting human activities, ensure the scientific development of social and economic activities, prevent the encroachment and destruction of wetland resources, strengthen the construction and protection of urban wetlands and transit rivers such as Ziya River, Beiyun River, and Wenyu River. In the significant comprehensive area, we should achieve the survival of coastal wetland resources from the two aspects of protection and restoration, use 3S technology to conduct real-time monitoring of the water quality, water volume, biomass, and utilization of wetlands, observe the structure, seasonal change and other features of natural wetlands, build or expand wetland buffer zones to effectively protect the core area of wetlands, optimize the overall development pattern of land-sea integration of the coastal zone, strengthen the construction and protection of nature reserves such as Changli Gold Coast, Tanghe Wetland, and other natural reserves, and reasonably carry out the restoration of damaged wetlands.
Additionally, more tailored protection policies should be developed in different cities. Beijing should limit the construction of urban infrastructure, conduct diverse social and economic activities rationally, and ensure the integrity of urban wetlands. For peripheral areas of Beijing, the ecological compensation mechanism for wetland resources, as well as the utilization of rainwater and wastewater, should be further improved concurrently with economic activities. The protection policies of Tianjin can be expanded based on Beijing. Changes in land type should be rigorously evaluated, and models for intensive and sustainable aquaculture should be actively developed. This proposal is applicable to other Bohai Rim cities as well. Around industrial parks and economic zones in cities such as Baoding, Langfang, and Cangzhou, artificial wetlands should be constructed to filter industrial sewage and improve the local environment. For cities such as Tangshan and Shijiazhuang, the unreasonable agricultural structure must be adjusted comprehensively, water-saving irrigation and pollution abatement technology should be vigorously promoted, the net loss of wetlands caused by agricultural development should be eliminated, and wetlands should be replaced, adjusted, and restored so as to maintain the dynamic balance of the total wetland area.

5. Conclusions

The study on the driving force of wetland change can support wetland prevention efforts in different scenarios and aid in the execution of precise regional wetland prevention and management. Here, we utilized multiple varieties of data to investigate the spatiotemporal change of wetlands and its driving mechanism in the BTHP. Our approach provided a new perspective for the study of the driving forces of wetland change, and our data processing method served as a benchmark for the study of large-scale areas.
We had four major findings. First, the trajectory of wetland loss had steadily halted over the previous three decades, which was mostly influenced by rivers and reservoirs and centered along the Bohai Rim.
Second, topographic and geological factors regulated the spatial distribution of wetlands, whereas meteorological and anthropic factors governed the dynamic changes of wetlands.
Third, the impact of elevation, slope, and land subsidence was linear, the impact of SGT and hydrogeological division reached the highest in the northeast, the impact of temperature and precipitation was nonlinear, and the impact of CPD, RCG, and other anthropic factors displayed clear spatial directivity and was positively correlated with wetland changes.
Fourth, to effectively protect wetlands, the general area should rely on the self-regulating function of the regional ecosystem, while the natural factors area, anthropic factors area, and significant comprehensive area should focus on dynamic monitoring, the restriction of human activities, and the establishment of buffer zones, respectively.
There were some limitations or inadequacies in our study. Our study provided a restricted description of the evolutionary mechanism of wetland ecosystems; therefore, the selection of impact factors may not be comprehensive. The type and scale of wetlands were not specifically considered in this study. In addition, the limited number of samples might hinder the RF model’s ability to recognize categorical factors. All impact factors had two types of continuous data and categorical data, and had differences in data accuracy and data integrity, which might have affected our results. Machine learning algorithms, such as random forest, are more tolerant to continuous data than categorical data, which does not affect the regression results but impacts the factor importance. Due to the geographical scale and differentiation effect, the RF model regressions in some factors might be weakened. A more refined study can be carried out in the future according to the type and scale of wetlands and combine other models or algorithms to synthesize the changes and differences of action intensity of impact factors on wetland change in different periods.

Author Contributions

Conceptualization, S.L. and H.M.; software, S.L., H.M. and H.L.; validation, S.L. and D.Y.; data curation, S.L. and W.H.; writing—original draft preparation, S.L., H.M. and D.Y.; writing—review and editing, S.L., H.M., D.Y., W.H. and H.L.; visualization, S.L. and H.M.; supervision, H.M. and D.Y. All authors have read and agreed to the published version of the manuscript.

Funding

This research received no external funding.

Data Availability Statement

Some data are not publicly available due to ethical, legal, or privacy issues.

Conflicts of Interest

The authors declare no conflict of interest.

References

  1. Liu, G.; Zhang, L.; Zhang, Q.; Musyimi, Z.; Jiang, Q. Spatio–Temporal Dynamics of Wetland Landscape Patterns Based on Remote Sensing in Yellow River Delta, China. Wetlands 2014, 34, 787–801. [Google Scholar] [CrossRef]
  2. Xiao, D.; Deng, L.; Kim, D.-G.; Huang, C.; Tian, K. Carbon budgets of wetland ecosystems in China. Glob. Chang. Biol. 2019, 25, 2061–2076. [Google Scholar] [CrossRef]
  3. Zedler, J.B.; Kercher, S. WETLAND RESOURCES: Status, Trends, Ecosystem Services, and Restorability. Annu. Rev. Environ. Resour. 2005, 30, 39–74. [Google Scholar] [CrossRef] [Green Version]
  4. Tao, S.; Fang, J.; Zhao, X.; Zhao, S.; Shen, H.; Hu, H.; Tang, Z.; Wang, Z.; Guo, Q. Rapid loss of lakes on the Mongolian Plateau. Proc. Natl. Acad. Sci. USA 2015, 112, 2281–2287. [Google Scholar] [CrossRef] [Green Version]
  5. Zhu, C.; Zhang, X.; Huang, Q. Four Decades of Estuarine Wetland Changes in the Yellow River Delta Based on Landsat Observations Between 1973 and 2013. Water 2018, 10, 933. [Google Scholar] [CrossRef] [Green Version]
  6. Zheng, X.J.; Sun, P.; Zhu, W.H.; Xu, Z.; Fu, J.; Man, W.D.; Li, H.L.; Zhang, J.; Qin, L. Landscape dynamics and driving forces of wetlands in the Tumen River Basin of China over the past 50 years. Landsc. Ecol. Eng. 2017, 13, 237–250. [Google Scholar] [CrossRef]
  7. Jin, H.; Huang, C.; Lang, M.W.; Yeo, I.-Y.; Stehman, S.V. Monitoring of wetland inundation dynamics in the Delmarva Peninsula using Landsat time-series imagery from 1985 to 2011. Remote Sens. Environ. 2017, 190, 26–41. [Google Scholar] [CrossRef] [Green Version]
  8. Sica, Y.V.; Quintana, R.D.; Radeloff, V.C.; Gavier-Pizarro, G.I. Wetland loss due to land use change in the Lower Parana River Delta, Argentina. Sci. Total Environ. 2016, 568, 967–978. [Google Scholar] [CrossRef] [PubMed]
  9. Sivakumar, R.; Ghosh, S. Wetland spatial dynamics and mitigation study: An integrated remote sensing and GIS approach. Nat. Hazards 2015, 80, 975–995. [Google Scholar] [CrossRef]
  10. Maingi, J.K.; Marsh, S.E. Assessment of environmental impacts of river basin development on the riverine forests of eastern Kenya using multi-temporal satellite data. Int. J. Remote Sens. 2010, 22, 2701–2729. [Google Scholar] [CrossRef]
  11. Chen, H.; Zhang, W.; Gao, H.; Nie, N. Climate Change and Anthropogenic Impacts on Wetland and Agriculture in the Songnen and Sanjiang Plain, Northeast China. Remote Sens. 2018, 10, 356. [Google Scholar] [CrossRef] [Green Version]
  12. Li, J.; Liu, Y.; Yang, Y. Land use change and effect analysis of tideland reclamation in Hangzhou Bay. J. Mt. Sci. 2018, 15, 394–405. [Google Scholar] [CrossRef]
  13. Yuan, H.; Zhang, R. Changes in wetland landscape patterns on Yinchuan Plain, China. Int. J. Sustain. Dev. World Ecol. 2010, 17, 236–243. [Google Scholar] [CrossRef]
  14. Yan, F.; Zhang, S.; Liu, X.; Yu, L.; Chen, D.; Yang, J.; Yang, C.; Bu, K.; Chang, L. Monitoring spatiotemporal changes of marshes in the Sanjiang Plain, China. Ecol. Eng. 2017, 104, 184–194. [Google Scholar] [CrossRef]
  15. Arai, H.; Zribi, M.; Oyoshi, K.; Dassas, K.; Huc, M.; Sobue, S.; Toan, T.L. Quality Control of CyGNSS Reflectivity for Robust Spatiotemporal Detection of Tropical Wetlands. Remote Sens. 2022, 14, 5903. [Google Scholar] [CrossRef]
  16. Chun, X.; Qin, F.; Zhou, H.; Dan, D.; Xia, Y.; Ulambadrakh, K. Effects of climate variability and land use/land cover change on the Daihai wetland of central Inner Mongolia over the past decades. J. Mt. Sci. 2020, 17, 3070–3084. [Google Scholar] [CrossRef]
  17. Zhou, D.; Gong, H.; Wang, Y.; Khan, S.; Zhao, K. Driving Forces for the Marsh Wetland Degradation in the Honghe National Nature Reserve in Sanjiang Plain, Northeast China. Environ. Model. Assess. 2008, 14, 101–111. [Google Scholar] [CrossRef]
  18. Wang, H. Regional Ecological Risk Assessment with Respect to Human Disturbance in the Poyang Lake Region (PYLR) Using Production–Living–Ecology Analysis. J. Indian Soc. Remote Sens. 2020, 49, 449–460. [Google Scholar] [CrossRef]
  19. Zhang, M.; Lin, H.; Long, X.; Cai, Y. Analyzing the spatiotemporal pattern and driving factors of wetland vegetation changes using 2000-2019 time-series Landsat data. Sci. Total Environ. 2021, 780, 146615. [Google Scholar] [CrossRef]
  20. Gerakis, A.; Kiriaki, K. Agricultural Activities Affecting the Functions and Values of Ramsar Wetland Sites of Greece. Agric. Ecosyst. Environ. 1998, 70, 119–128. [Google Scholar] [CrossRef]
  21. Pan, D.; Domon, G.r.; Blois, S.d.; Bouchard, A. Temporal (1958–1993) and Spatial Patterns of Land Use Changes in Haut-Saint-Laurent (Quebec, Canada) and Their Relation to Landscape Physical Attributes. Landsc. Ecol. 1999, 14, 35–52. [Google Scholar] [CrossRef]
  22. Zhang, X.; Wang, G.; Xue, B.; Zhang, M.; Tan, Z. Dynamic landscapes and the driving forces in the Yellow River Delta wetland region in the past four decades. Sci. Total Environ. 2021, 787, 147644. [Google Scholar] [CrossRef]
  23. Wen, C.; Zhan, Q.; Zhan, D.; Zhao, H.; Yang, C. Spatiotemporal Evolution of Lakes under Rapid Urbanization: A Case Study in Wuhan, China. Water 2021, 13, 1171. [Google Scholar] [CrossRef]
  24. Garcia-Ayllon, S.; Radke, J. Diffuse Anthropization Impacts in Vulnerable Protected Areas: Comparative Analysis of the Spatial Correlation between Land Transformation and Ecological Deterioration of Three Wetlands in Spain. ISPRS Int. J. Geo-Inf. 2021, 10, 630. [Google Scholar] [CrossRef]
  25. Hong, H.; Pourghasemi, H.R.; Pourtaghi, Z.S. Landslide susceptibility assessment in Lianhua County (China): A comparison between a random forest data mining technique and bivariate and multivariate statistical models. Geomorphology 2016, 259, 105–118. [Google Scholar] [CrossRef]
  26. Pourghasemi, H.R.; Kerle, N. Random forests and evidential belief function-based landslide susceptibility assessment in Western Mazandaran Province, Iran. Environ. Earth Sci. 2016, 75, 185–202. [Google Scholar] [CrossRef]
  27. Zheng, L.; Xu, J.; Wang, X. Application of Random Forests Algorithm in Researches on Wetlands (in Chinese). Wetl. Sci. 2019, 17, 16–24. [Google Scholar] [CrossRef]
  28. Liu, H.; Bu, R.; Liu, J.; Leng, W.; Hu, Y.; Yang, L.; Liu, H. Predicting the wetland distributions under climate warming in the Great Xing’an Mountains, northeastern China. Ecol. Res. 2011, 26, 605–613. [Google Scholar] [CrossRef]
  29. Zhang, Q.; Gao, W.; Su, S.; Weng, M.; Cai, Z. Biophysical and socioeconomic determinants of tea expansion: Apportioning their relative importance for sustainable land use policy. Land Use Policy 2017, 68, 438–447. [Google Scholar] [CrossRef]
  30. Hu, Q.; Qi, Y.; Hu, Y.; Zhang, Y.; Wu, C.; Zhang, G.; Shen, Y. Changes and Driving Forces of Land Use/Cover and Landscape Patterns in Beijing-Tianjin-Hebei Region (in Chinese). Chin. J. Eco-Agric. 2011, 19, 1182–1189. [Google Scholar] [CrossRef]
  31. Zhang, H.; Tao, S.; Tang, Z.; Fang, J. Lake Area Changes in Jing-Jin-Ji Region in Recent 30 Years (in Chinese). Acta Sci. Nat. Univ. Pekin. 2020, 56, 324–330. [Google Scholar] [CrossRef]
  32. Li, H.; Gong, Z.; Zhao, W.; Gong, H. Driving Forces Analysis of Reservoir Wetland Evolution in Beijing Based on Logistic Regression Model (in Chinese). Acta Geogr. Sin. 2012, 67, 357–367. [Google Scholar]
  33. Zhang, L.; Zhen, Q.; Cheng, M.; Ouyang, Z. The Main Drivers of Wetland Changes in the Beijing-Tianjin-Hebei Region. Int. J. Environ. Res. Public Health 2019, 16, 2619. [Google Scholar] [CrossRef] [Green Version]
  34. Luo, J.; Shen, Y.; Qi, Y.; Zhang, Y.; Xiao, D. Evaluating water conservation effects due to cropping system optimization on the Beijing-Tianjin-Hebei plain, China. Agric. Syst. 2018, 159, 32–41. [Google Scholar] [CrossRef]
  35. Xie, H.; He, Y.; Xie, X. Exploring the factors influencing ecological land change for China’s Beijing–Tianjin–Hebei Region using big data. J. Clean. Prod. 2017, 142, 677–687. [Google Scholar] [CrossRef]
  36. Yang, Y.; Bao, W.; Li, Y.; Wang, Y.; Chen, Z. Land Use Transition and Its Eco-Environmental Effects in the Beijing–Tianjin–Hebei Urban Agglomeration: A Production–Living–Ecological Perspective. Land 2020, 9, 285. [Google Scholar] [CrossRef]
  37. Haas, J.; Ban, Y. Urban growth and environmental impacts in Jing-Jin-Ji, the Yangtze, River Delta and the Pearl River Delta. Int. J. Appl. Earth Obs. Geoinf. 2014, 30, 42–55. [Google Scholar] [CrossRef]
  38. Ma, S.; Li, L.; Ke, H.; Zheng, Y. Environmental Protection, Industrial Structure and Urbanization: Spatiotemporal Evidence from Beijing–Tianjin–Hebei, China. Sustainability 2022, 14, 795. [Google Scholar] [CrossRef]
  39. Nicholls, R.J. Coastal flooding and wetland loss in the 21st century: Changes under the SRES climate and socio-economic scenarios. Glob. Environ. Change 2004, 14, 69–86. [Google Scholar] [CrossRef]
  40. Creed, I.F.; Sanford, S.E.; Beall, F.D.; Molot, L.A.; Dillon, P.J. Cryptic wetlands: Integrating hidden wetlands in regression models of the export of dissolved organic carbon from forested landscapes. Hydrol. Process. 2003, 17, 3629–3648. [Google Scholar] [CrossRef]
  41. Lu, J.; Jiang, W.; Wang, W.; Chen, K.; Deng, Y.; Chen, Z.; Li, Z. Wetland Landscape Pattern Change and its Driving Forces in Beijing-Tianjin-Hebei Region in Recent 30 Years (In Chinese). Acta Ecol. Sin. 2018, 38, 4492–4503. [Google Scholar] [CrossRef]
  42. Zheng, Z.; Zheng, R.; Xu, J.; Wang, J. Identification of Urban Functional Regions Based on POI Data and Place2vec Model (In Chinese). Geogr. Geo-Inf. Sci. 2020, 36, 48–56. [Google Scholar] [CrossRef]
  43. Liu, H.; Yuan, H.; Wang, S.; Zheng, L.; Liao, M. Spatiotemporal Dynamics of Water Body Changes and Their Influencing Factors in the Seasonal Lakes of the Poyang Lake Region (in Chinese). Water 2021, 13, 1539. [Google Scholar] [CrossRef]
  44. Zhao, Y.; Chen, L.; Sun, R.; Ni, Z.; Pu, M.; Zhou, G.; Luo, Y. Regionalization of Environmental Geological Sensitivity in Beijing⁃Tianjin⁃Hebei Region Based on Resource Utilization and Disaster Risk (In Chinese). Acta Ecol. Sin. 2022, 42, 2251–2264. [Google Scholar]
  45. Liu, J.; Ma, C.; Liu, Y.; Sheng, L. Quantitative Study on the Driving Factors of Marsh Change based in Geographical Detector (in Chinese). J. Northeast Norm. Univ. Nat. Sci. Ed. 2017, 49, 127–135. [Google Scholar]
  46. Xu, L.; Wan, Y.; Sheng, S.; Wen, T.; Xu, C.; An, S. Characteristics, Hotspots and Influencing Factors of Wetland Change in Huaihe River Basin (in Chinese). J. Nat. Resour. 2013, 28, 1383–1394. [Google Scholar] [CrossRef]
  47. Ye, Q. Landform System of the Great Plain of North China and its Tendency of Environmental Evolution (in Chinese). Geogr. Res. 1989, 8, 10–20. [Google Scholar]
  48. Zhou, C.; Gong, H.; Chen, B.; Gao, M.; Cao, Q.; Cao, J.; Duan, L.; Zuo, J.; Shi, M. Land Subsidence Response to Different Land Use Types and Water Resource Utilization in Beijing-Tianjin-Hebei, China. Remote Sens. 2020, 12, 457. [Google Scholar] [CrossRef] [Green Version]
  49. Göbel, P.; Stubbe, H.; Weinert, M.; Zimmermann, J.; Fach, S.; Dierkes, C.; Kories, H.; Messer, J.; Mertsch, V.; Geiger, W.F.; et al. Near-natural stormwater management and its effects on the water budget and groundwater surface in urban areas taking account of the hydrogeological conditions. J. Hydrol. 2004, 299, 267–283. [Google Scholar] [CrossRef]
  50. Xiao, S.; Xiao, H.; Peng, X.; Song, X. Hydroclimate-driven changes in the landscape structure of the terminal lakes and wetlands of the China’s Heihe River Basin. Environ. Monit. Assess. 2015, 187, 4091. [Google Scholar] [CrossRef]
  51. Irdemez, S.; Eymirli, E.B. Determination of spatiotemporal changes in Erzurum plain wetland system using remote sensing techniques. Env. Monit. Assess. 2021, 193, 265–278. [Google Scholar] [CrossRef] [PubMed]
  52. Ning, J.; Zhang, S.; Li, Y.; Wang, L. Analysis on Wetland Shrinking Characteristics and Its Cause in Heilongjiang Province for the Last 50 Years (in Chinese). J. Nat. Resour. 2008, 23, 79–86. [Google Scholar]
  53. Mondal, B.; Dolui, G.; Pramanik, M.; Maity, S.; Biswas, S.S.; Pal, R. Urban expansion and wetland shrinkage estimation using a GIS-based model in the East Kolkata Wetland, India. Ecol. Indic. 2017, 83, 62–73. [Google Scholar] [CrossRef]
  54. Liu, J.; Kuang, W.; Zhang, Z.; Xu, X.; Qin, Y.; Ning, J.; Zhou, W.; Zhang, S.; Li, R.; Yan, C.; et al. Spatiotemporal characteristics, patterns, and causes of land-use changes in China since the late 1980s. J. Geogr. Sci. 2014, 24, 195–210. [Google Scholar] [CrossRef]
  55. Li, Q.; Yu, X.; Li, J. Analysis on Wetland Use Change in Zhangdu Watershed Hubei Province (in Chinese). Resour. Environ. Yangtze Basin 2005, 14, 600–604. [Google Scholar]
  56. Xue, B.; Zhao, B.; Xiao, X.; Li, J.; Xie, X.; Ren, W. A POI Data-Based Study on Urban Functional Areas of the Resources-Based City: A Case Study of Benxi, Liaoning (in Chinese). Hum. Geogr. 2020, 11, 81–90. [Google Scholar] [CrossRef]
  57. Liu, J.; Zhang, J.; Jia, K. Boundary Identification and Spatial Pattern Optimization of Central Urban Areas Based on POI Data: Taking Gaotang County for Example (in Chinese). Urban Dev. Stud. 2021, 28, 74–83. [Google Scholar]
  58. Wang, S.; Liu, J.; Ma, T. Dynamics and changes in spatial patterns of land use in Yellow River Basin, China. Land Use Policy 2010, 27, 313–323. [Google Scholar] [CrossRef]
  59. Thompson, C.G.; Kim, R.S.; Aloe, A.M.; Becker, B.J. Extracting the Variance Inflation Factor and Other Multicollinearity Diagnostics from Typical Regression Results. Basic Appl. Soc. Psychol. 2017, 39, 81–90. [Google Scholar] [CrossRef]
  60. Hong, H.; Tsangaratos, P.; Ilia, I.; Liu, J.; Zhu, A.; Chen, W. Application of fuzzy weight of evidence and data mining techniques in construction of flood susceptibility map of Poyang County, China. Sci. Total Environ. 2018, 625, 575–588. [Google Scholar] [CrossRef]
  61. Arabameri, A.; Pradhan, B.; Rezaei, K. Gully erosion zonation mapping using integrated geographically weighted regression with certainty factor and random forest models in GIS. J. Environ. Manag. 2019, 232, 928–942. [Google Scholar] [CrossRef] [PubMed]
  62. Knudby, A.; Brenning, A.; LeDrew, E. New approaches to modelling fish–habitat relationships. Ecol. Model. 2010, 221, 503–511. [Google Scholar] [CrossRef]
  63. Goetz, J.N.; Brenning, A.; Petschko, H.; Leopold, P. Evaluating machine learning and statistical prediction techniques for landslide susceptibility modeling. Comput. Geosci. 2015, 81, 1–11. [Google Scholar] [CrossRef]
  64. Fang, K.; Wu, J.; Zhao, Y.; Zhu, J.; Xie, B. A Review of Technologies on Random Forests (in Chinese). Stat. Inf. Forum 2011, 26, 32–38. [Google Scholar]
  65. Zhao, T.; Yang, D.; Cai, X.; Cao, Y. Predict Seasonal Low Flows in the Upper Yangtze River Using Random Forests Model (in Chinese). J. Hydroelectr. Eng. 2012, 31, 18–24. [Google Scholar]
  66. Friedman, J.H. Greedy function approximation: A gradient boosting machine. Ann. Stat. 2001, 29, 1189–1232. [Google Scholar] [CrossRef]
  67. Li, S.; Ni, Z.; Zhao, Y.; Hu, W.; Long, Z.; Ma, H.; Zhou, G.; Luo, Y.; Geng, C. Susceptibility Analysis of Geohazards in the Longmen Mountain Region after the Wenchuan Earthquake. Int. J. Environ. Res. Public Health 2022, 19, 3229. [Google Scholar] [CrossRef] [PubMed]
  68. Hu, B.; Wang, D.; Wang, Z.; Wang, F.; Liu, J.; Sun, Z.; Chen, J. Development and Optimization of the Ecological Network in the Beijing-Tianjin-Hebei Metropolitan region. Acta Ecol. Sin. 2018, 38, 4383–4392. [Google Scholar] [CrossRef]
  69. Wu, W.; Zhao, S.; Zhu, C.; Jiang, J. A comparative study of urban expansion in Beijing, Tianjin and Shijiazhuang over the past three decades. Landsc. Urban Plan. 2015, 134, 93–106. [Google Scholar] [CrossRef]
  70. Habiba, U.; Haider, F.; Ishtiaque, A.; Mahmud, M.S.; Masrur, A. Remote Sensing & GIS Based Spatio-Temporal Change Analysis of Wetland in Dhaka City, Bangladesh. J. Water Resour. Prot. 2011, 3, 781–787. [Google Scholar] [CrossRef] [Green Version]
  71. Zhu, J.; Zhou, Y.; Wang, S.; Wang, L.; Liu, W.; Li, H.; Mei, J. Analysis of changes of Baiyangdian wetland from 1975 to 2018 based on remote sensing (in Chinese). J. Remote Sens. 2019, 23, 971–986. [Google Scholar] [CrossRef]
  72. Gao, J.; Wang, Z. Analysis on Variation Characteristics of Tianjin Wetland Area and Its Main Controlling Factors During 1976-2009 (in Chinese). J. Tianjin Norm. Univ. Nat. Sci. Ed. 2013, 33, 32–38. [Google Scholar]
  73. Yang, F.; Li, J.; Wang, J.; Huang, J.; Qi, T.; Liu, Y.; Fu, T.; Yu, S.; Zhao, L. Spatiotemporal characteristics of human activity on coastal landscape of Laizhou Bay. Wetl. Ecol. Manag. 2021, 29, 789–808. [Google Scholar] [CrossRef]
  74. Zhang, L.; Wu, B.; Yin, K.; Li, X.; Kia, K.; Zhu, L. Impacts of human activities on the evolution of estuarine wetland in the Yangtze Delta from 2000 to 2010. Environ. Earth Sci. 2014, 73, 435–447. [Google Scholar] [CrossRef]
  75. Rojas, C.; Munizaga, J.; Rojas, O.; Martínez, C.; Pino, J. Urban development versus wetland loss in a coastal Latin American city: Lessons for sustainable land use planning. Land Use Policy 2019, 80, 47–56. [Google Scholar] [CrossRef]
  76. Koneff, M.D.; Royle, J.A. Modeling wetland change along the United States Atlantic Coast. Ecol. Model. 2004, 177, 41–59. [Google Scholar] [CrossRef]
  77. Liu, J.; Gao, J.; Dong, C. Regional Differentiation and Factors Influencing Changes in Swamps in the Sanjiang Plain from 1954 to 2015 (in Chinese). Acta Ecol. Sin. 2019, 39, 4821–4831. [Google Scholar] [CrossRef]
  78. Gong, N.; Niu, Z.; Qi, W.; Zhang, H. Driving Forces of Wetland Change in China (in Chinese). J. Remote Sens. 2016, 20, 172–183. [Google Scholar] [CrossRef]
  79. Wu, C.; Yang, C.; Lin, N.; Feng, Y. Characteristics of Wetland Dynamic Variations in Western Liaohe River Basin and Their Influenced Factors (in Chinese). Glob. Geol. 2016, 35, 902–908. [Google Scholar] [CrossRef]
  80. Zhang, Y.; Yan, J.; Cheng, X.; He, X. Wetland Changes and Their Relation to Climate Change in the Pumqu Basin, Tibetan Plateau. Int. J. Environ. Res. Public Health 2021, 18, 2682. [Google Scholar] [CrossRef]
  81. Song, K.; Wang, Z.; Li, L.; Tedesco, L.; Li, F.; Jin, C.; Du, J. Wetlands shrinkage, fragmentation and their links to agriculture in the Muleng-Xingkai Plain, China. J. Environ. Manag. 2012, 111, 120–132. [Google Scholar] [CrossRef]
  82. Liu, F.; Cui, J.; Chen, L.; Zhao, Y.; Qin, Y.; Wu, C. A View on Geomorphologic Zonalization of North China Plain (in Chinese). Geogr. Geo-Inf. Sci. 2009, 25, 100–103. [Google Scholar]
  83. Xiao, Q.; Wei, Y.; Wang, Y.; Zhong, J.; Yang, Y.; Yu, D.; Zeng, F.; Zheng, X.; Sun, Y.; Zhou, B. Driving Factors of Coastal Wetland Degradation in Binhai New Area of Tianjin (in Chinese). Acta Sci. Circumst. 2012, 32, 480–488. [Google Scholar] [CrossRef]
  84. Qiao, G.; Sun, M.; Wang, B. Analysis of Cause of Sharp Decrease of Wetlands in Hebei Plain (in Chinese). Water Resour. Prot. 2010, 26, 33–37. [Google Scholar]
  85. Zhu, J.; Guo, H.; Li, W.; Tian, X. Relationship Between Land Subsidence and Deep Groundwater Yield in the North China Plain (in Chinese). South-North Water Transf. Water Sci. Technol. 2014, 12, 165–169. [Google Scholar] [CrossRef]
  86. Liang, X.; Liu, Y.; Jin, M.; Lu, X.; Zhang, R. Direct observation of complex Tóthian groundwater flow systems in the laboratory. Hydrol. Process. 2010, 24, 3568–3573. [Google Scholar] [CrossRef]
  87. Shi, J.; Li, G.; Liang, X.; Chen, Z.; Shao, J.; Song, X. Evolution Mechanism and Control of Groundwater in the North China Plain (in Chinese). Acta Geosci. Sin. 2014, 35, 527–534. [Google Scholar] [CrossRef]
  88. Cao, G.; Zheng, C.; Scanlon, B.R.; Liu, J.; Li, W. Use of flow modeling to assess sustainability of groundwater resources in the North China Plain. Water Resour. Res. 2013, 49, 159–175. [Google Scholar] [CrossRef]
  89. Foster, S.; Garduno, H.; Evans, R.; Olson, D.; Tian, Y.; Zhang, W.; Han, Z. Quaternary Aquifer of the North China Plain?assessing and achieving groundwater resource sustainability. Hydrogeol. J. 2004, 12, 81–93. [Google Scholar] [CrossRef]
  90. Niu, Z.; Zhang, H.; Wang, X.; Yao, W.; Zhou, D.; Zhao, K.; Zhao, H.; Li, N.; Huang, H.; Li, C.; et al. Mapping wetland changes in China between 1978 and 2008. Chin. Sci. Bull. 2012, 57, 2813–2823. [Google Scholar] [CrossRef] [Green Version]
  91. Poiani, K.A.; Johnson, W.C. Potential Effects of Climate Change on a Semi-Permanent Prairie Wetland. Clim. Chang. 1993, 24, 213–232. [Google Scholar] [CrossRef]
  92. Liu, J.; Du, B.; Sheng, L.; Tian, X. Dynamic Patterns of Change in Marshes in the Sanjiang Plain and Their Influential Factors (in Chinese). Adv. Water Sci. 2017, 28, 22–31. [Google Scholar]
  93. Deng, Y.; Jiang, W.; Peng, K. Identification of Wetland Damage Degree and Analysis of Its Driving Forces in Wuhan Urban Agglomeration (in Chinese). J. Nat. Resour. 2019, 34, 1694–1707. [Google Scholar] [CrossRef]
  94. Aktas, N.K.; Donmez, N.Y. Effects of Urbanisation and human activities on Basin ecosystem: Sapanca Lake Basin. J. Environ. Prot. Ecol. 2019, 20, 102–112. [Google Scholar]
  95. Zou, Y.; He, Y.; Wang, X.; Yu, J.; Li, Y.; Yang, J.; Zhou, D.; Ning, K.; Du, C.; Wang, S. Effects of Roads on Natural Landscape Connectivity of the Estuary Wetland in the Yellow River Delta (in Chinese). J. Ludong Univ. Nat. Sci. Ed. 2022, 38, 9–17. [Google Scholar]
  96. Zhu, Z.; Gao, M.; Hu, H.; Ma, D.; Zhang, F. Effects of Expressway Construction and Operation On the Soil Properties of Adjacent Wetland (in Chinese). J. Cent. South Univ. For. Technol. 2009, 29, 123–127. [Google Scholar]
  97. Chi, Y.; Liu, D.; Wang, J.; Wang, E. Human negative, positive, and net influences on an estuarine area with intensive human activity based on land covers and ecological indices: An empirical study in Chongming Island, China. Land Use Policy 2020, 99, 104846. [Google Scholar] [CrossRef]
  98. Meng, W.; Mo, X.; Li, H.; He, M. An Analysis on Multivariate Corelations Betwen Wetland Degradation Characteristics and Its Driving Factors in Tianjin City (in Chinese). Bull. Soil Water Conserv. 2016, 26, 326–332. [Google Scholar] [CrossRef]
  99. Mao, D.; Luo, L.; Wang, Z.; Wilson, M.C.; Zeng, Y.; Wu, B.; Wu, J. Conversions between natural wetlands and farmland in China: A multiscale geospatial analysis. Sci. Total Environ. 2018, 634, 550–560. [Google Scholar] [CrossRef]
  100. Mo, X.; Hu, S.; Lin, Z.; Liu, S.; Xia, J. Impacts of climate change on agricultural water resources and adaptation on the North China Plain. Adv. Clim. Chang. Res. 2017, 8, 93–98. [Google Scholar] [CrossRef]
  101. Wang, H.; Ma, M. Impacts of Climate Change and Anthropogenic Activities on the Ecological Restoration of Wetlands in the Arid Regions of China. Energies 2016, 9, 166. [Google Scholar] [CrossRef] [Green Version]
  102. Wang, Z.; Yang, L. Delinking indicators on regional industry development and carbon emissions: Beijing–Tianjin–Hebei economic band case. Ecol. Indic. 2015, 48, 41–48. [Google Scholar] [CrossRef]
  103. Zhou, L.; Tian, L.; Cao, Y.; Yang, L. Industrial land supply at different technological intensities and its contribution to economic growth in China: A case study of the Beijing-Tianjin-Hebei region. Land Use Policy 2021, 101, 105087. [Google Scholar] [CrossRef]
  104. Ma, J. Climate Change Effects of Industrial Structure Adjustments and Technical Improvements (in Chinese). J. Cap. Univ. Econ. Bus. 2016, 18, 123–128. [Google Scholar]
  105. Fan, J.; Cao, Z.; Zhang, X.; Wang, J.; Zhang, M. Comparative study on the influence of final use structure on carbon emissions in the Beijing-Tianjin-Hebei region. Sci. Total Environ. 2019, 668, 271–282. [Google Scholar] [CrossRef] [PubMed]
  106. Wang, Z.; Liang, L.; Sun, Z.; Wang, X. Spatiotemporal differentiation and the factors influencing urbanization and ecological environment synergistic effects within the Beijing-Tianjin-Hebei urban agglomeration. J. Environ. Manag. 2019, 243, 227–239. [Google Scholar] [CrossRef]
  107. Chen, W.; Cao, C.; Liu, D.; Tian, R.; Wu, C.; Wang, Y.; Qian, Y.; Ma, G.; Bao, D. An evaluating system for wetland ecological health: Case study on nineteen major wetlands in Beijing-Tianjin-Hebei region, China. Sci. Total Environ. 2019, 666, 1080–1088. [Google Scholar] [CrossRef]
Figure 1. Map of the study area: (A) location of Beijing-Tianjin-Hebei; (B) geomorphic division of Beijing-Tianjin-Hebei; (C) location and administrative division of the study area.
Land 12 00480 g001
Figure 2. Linear fitting of temperature and precipitation in 1990–2020: (A) annual value and linear trend of temperature; (B) annual value and linear trend of precipitation.
Land 12 00480 g002
Figure 3. Land use data in four periods: 1990 (I); 2000 (II); 2010 (III); 2020 (IV).
Land 12 00480 g003
Figure 4. Thematic maps of impact factors: (a) elevation; (b) slope; (c) secondary geomorphic type; (d) surface subsidence; (e) hydrogeological division; (f) temperature; (g) precipitation; (h) change of population density; (i) road construction growth; (j) change intensity of construction land; (k) variability of night light intensity; (l) change intensity of cropland; (m) change of industrial development; and (n) change of tertiary industry development.
Land 12 00480 g004
Figure 5. Study flow chart.
Land 12 00480 g005
Figure 6. Map of reduced density of wetlands.
Land 12 00480 g006
Figure 7. Results of the model output: (a) error trend chart and (b) importance of impact factors, with a sequence of elevation, slope, SGT, surface subsidence, hydrogeological division, temperature, precipitation, CPD, RCG, CICL, VNLI, CIC, CID, and CTID from left to right.
Land 12 00480 g007
Figure 8. Linear chart and spatial distribution graph of partial dependence: (a) elevation; (b) slope; (c) SGT; (d) surface subsidence; (e) hydrogeological division; (f) temperature; (g) precipitation; (h) CPD; (i) RCG; (j) CICL; (k) VNLI; (l) CIC; (m) CID; and (n) CTID.
Land 12 00480 g008
Figure 9. Zoning map of wetland protection and restoration.
Land 12 00480 g009
Table 1. Data and data sources.
TypeData NameData SourcesSpatial Resolution
Topographic factorElevationGeospatial Data Cloud (https://www.gscloud.cn/; accessed on 1 May 2022)90 m × 90 m
SlopeGeospatial Data Cloud (https://www.gscloud.cn/; accessed on 1 May 2022)90 m × 90 m
Secondary geomorphic typeChina Geological Survey (https://www.cgs.gov.cn/; accessed on 1 May 2022)Vector Data
Geological factorSurface subsidenceChina Geological Survey (https://www.cgs.gov.cn/; accessed on 1 May 2022)Vector Data
Hydrogeological divisionChina Geological Survey (https://www.cgs.gov.cn/; accessed on 1 May 2022)Vector Data
Meteorological factorTemperatureNational Tibetan Plateau Data Center (http://data.tpdc.ac.cn/; accessed on 2 May 2022)1000 m × 1000 m
Precipitation
Anthropic factorPopulation densityWorldPop (https://www.worldpop.org/; accessed on 5 May 2022)1000 m × 1000 m
RoadNAVINFO (https://www.navinfo.com/; accessed on 5 May 2022); OpenStreetMap (https://www.openstreetmap.org/; accessed on 5 May 2022)Vector Data
Night lightNational Tibetan Plateau Data Center (http://data.tpdc.ac.cn/; accessed on 10 May 2022)1000 m × 1000 m
POIGaode Open Platform (https://lbs.amap.com/ accessed on 11 May 2022)Vector Data
Table 2. Dynamic degree of wetlands in different periods.
Type1990–20002000–20102010–20201990–2020
Area Change (km2)Si
(%)
Area Change (km2)Si
(%)
Area Change (km2)Si(%)Area Change (km2)Si(%)
River−286.22−2.56−14.88−0.19+342.994.37+41.89+0.133
Marshland−102.30−1.22−10.50−0.15−58.29−0.82−171.09−0.73
Lake−2.15−2.94−1.00−2.02+1.704.42−1.45−0.70
Reservoir−286.40−0.67−214.59−0.54−109.39−0.29−610.38−0.51
Overall−677.07−1.09−240.97−0.44+177.010.34−741.03−0.42
Sy (%)0.940.870.770.77
The Si was the dynamic degree of single land use, and the Sy was the dynamic degree of synthesis land use.
Table 3. Tolerance and VIF of impact factors.
Factor NameToleranceVIFFactor NameToleranceVIF
Elevation0.3562.811CPD0.6131.631
Slope0.7461.341RCG0.7071.415
SGT0.5371.861CICL0. 7121.405
Surface subsidence0.7511.331VNLI0.7631.311
Hydrogeological division0.5761.736CIC0.9721.029
Temperature0.3972.520CID0.8941.119
Precipitation0.5621.781CTID0.5361.864
The significance (p-value) of CTID and precipitation was 0.567 and 0.018, respectively, and the significance (p-value) of the other 12 factors was less than 0.001.
Disclaimer/Publisher’s Note: The statements, opinions and data contained in all publications are solely those of the individual author(s) and contributor(s) and not of MDPI and/or the editor(s). MDPI and/or the editor(s) disclaim responsibility for any injury to people or property resulting from any ideas, methods, instructions or products referred to in the content.

