Abstract
Urban parks have significant cooling effects, which can both mitigate the urban heat is-land effect and are crucial to the sustainable development of the human habitat. Although studies have been conducted to explore the influence of urban park morphology on the cooling effect of parks, they are not sufficiently in depth. Therefore, this paper took 117 urban parks in the central city of Chengdu as the research objects based on the perspective of the quantitative classification of urban park morphology. Then, remote sensing interpretation, spatial statistics, and regression analysis were used, and the four indicators of cooling intensity, cooling distance, cooling area, and cooling efficiency of urban parks were integrated to explore the cooling effect of the different morphological types of urban parks. The results show that (1) urban parks in Chengdu could be divided into five categories, among which the cooling effect of round parks was the best, and the cooling efficiency was 0.7. (2) In terms of park cooling area, urban parks’ area and perimeter thresholds were 30 ha and 4000 m, respectively. (3) When the area and perimeter of urban parks reached 70 ha and 3000 m, respectively, the increase in the cooling distance slowed down. (4) The cooling efficiency of the park was best when the shape index (indicating the complexity of the park boundaries) of the urban park was 2.8. The results of the study provide theoretical support for the intensive use of urban park green space and help the construction and promotion of a beautiful and livable park city in Chengdu.
1. Introduction
In recent years, the urban heat island effect has become an important theme in global climate change and sustainable urban development [1]. The global urban heat island effect is increasing due to the fact of unplanned urban sprawl and densification [2,3] and increasing industrial operations and construction activities [4]. The urban heat island effect not only causes increased energy consumption and excessive greenhouse gas emissions in summer [5] but also damages urban residents’ health and quality of life [6]. Long-term residents of urban heat island centers are even more likely to develop digestive and neurological disorders [7]. Therefore, mitigating the urban heat island effect is an urgent issue.
Green urban space makes a positive contribution in this regard. It consists of various open spaces and natural areas, including urban parks, green roofs, street trees, and vertical greening systems [8]. In hot or cold regions, green roofs and courtyards are widely used. This is because they can improve the energy efficiency of buildings and, thus, reduce air pollution and urban heat island effects [9,10]. Urban forests reduce temperatures in urban microclimates through the conversion of sensible heat into latent heat by trees, and the cooling level of trees is mainly determined by differences in canopy size and leaf volume, etc. [11]. As one of the key infrastructures in green space, urban parks are multifunctional and profoundly impact social, health, economic, and environmental development [12]. Studies have confirmed that urban parks are an effective way to mitigate the urban heat island effect, and a reasonable layout of parkland can help regulate urban climate [13,14,15]. Therefore, this study focuses on the cooling effect of urban parks and seeks new solutions to the urban heat island effect.
The cooling effect of urban parks has been documented in many studies. In summer, urban parks with dense tree canopies can cool temperatures by up to 3.8 °C compared to bare urban squares and streets [16]. The average daytime cooling in small parks within 2–53 ha is 1.2–2.4 °C, and the cooling effect is approximately 2–4 times its width [17]. The average cooling in large urban parks is 3.28 °C, and the average cooling distance is 2500 m, which is equivalent to the width of the park [18].
In terms of influencing factors, previous studies have mostly explored the role of park spatial structure and patch morphology on the cooling effect of urban parks, where a patch is a relatively homogeneous and nonlinear area that differs from the surrounding context [19]; in this study, a single urban park is treated as an independent patch. For the spatial structure, a number of scholars conducted relevant studies. Some studies have been devoted to comparing the cooling effects of different vegetation types, with trees having the strongest cooling effect [20]. In addition, green areas, water bodies, and impervious surface aggregation are important indicators for calculation. The cooling effect is better when the vegetation cover is larger, i.e., when the proportion of park green space is larger [21]. Water bodies, on the other hand, have a high specific heat capacity [22], and their cooling effect is more than twice that of vegetation [23]. The greater the proportion of water bodies in the park, the greater the cooling rate; while when the proportion of impervious surface area is less than 50%, the cooling rate of the park decreases as the proportion of the impervious surface increases [24]. It can be seen that the landscape composition of urban parks has an influential role in the cooling effect, which needs to be taken into account in the study.
For the patchy morphology of urban parks, it is not only a natural, functional, and cultural expression in the landscape perspective but also an important consideration in urban park design [25]. Area, perimeter, and shape index are the most important morphological characteristics of urban parks [26]. The length of the urban park perimeter is negatively correlated with the temperature inside the park [27], and urban park area is also significantly negatively correlated with surrounding temperature [27,28]. The complexity of the boundary also has an effect on its cooling effect, with surface temperature decreasing as the shape index increases [29]. On the other hand, Han [30] showed that the shape index was only a parameter to measure morphological changes and had a strong positive correlation with the average temperature inside the park but not with the cooling range. In urban centers, the actual area available for urban park construction is limited. Therefore, it is important to design the morphology and layout of urban parks rationally.
However, studies on morphology quantification have focused on architecture, urban morphology, and traditional rural settlements. Michael [31] proposed geometric metrics for architecture and urban morphology and considered morphological classification as a prerequisite for analysis. Pu [32] studied quantitative methods for the overall morphology of traditional rural settlements in two-dimensional planes in rural areas. Studies have found that urban park patch morphology significantly affects the cooling effect [20,33], and some scholars gradually coupled morphology with the thermal environment for analysis [34,35]. Related studies usually quantify morphology as simply circular and square using the landscape shape index (LSI) [36]. Ideally, the LSI of the circle is equal to 1, and the LSI of the square is equal to 1.13, while it will increase with the irregularity of the landscape shape [37]. Although the above studies quantified the morphologies of urban parks more scientifically, the classification was crude and only divided them into two categories, circular and square, ignoring the diversity of other forms. Moreover, the LSI uses circles as the basis of fitting for classification, and it is difficult to accurately fit urban parks with complex or long and narrow morphologies. Therefore, this study further deepened the morphological classification method based on the previous work.
With the development of remote sensing technology, a large number of studies have been conducted to obtain the land surface temperature (LST) based on satellite remote sensing images [38,39,40] and used LST to measure the cooling effect of urban parks [41,42,43]. However, the cooling mechanism in urban parks is reflected more in the air temperature, and there is a certain difference between LST and air temperature [44,45]. However, various studies combined LST and air temperature data [46,47,48] and found that LST was correlated with air temperature, and the correlation decreased as the area covered by individual pixels of LST increased [49]. At the same time, LST has significant advantages in describing the overall urban thermal environment, while traditional meteorological stations are fewer in number [50], unevenly distributed, and weaker in reflecting the overall urban temperature. These all provide theoretical support for using LST to characterize the cooling effect of urban parks to a certain extent.
Based on LST measurements, to quantify the cooling effect of the park, previous studies have proposed various types of cooling indicators, such as cold island intensity, maximum cooling distance, and maximum cooling area [36,51,52]. However, the cooling effect is nonlinear in space, so it needs to be evaluated comprehensively from two perspectives, i.e., considering the spatial continuity of the park cooling effect [53]. In addition, due to the characteristics of nonlinearity, there are thresholds for the cooling effect of urban parks [36,54,55], i.e., the cooling effect of urban parks will gradually decrease when a certain boundary point is reached. This is crucial in urban planning and management and has become an urgent topic [56]. However, the thresholds vary across studies due to the presence of various factors such as climate [55,57].
In summary, this study can draw on the two-dimensional morphological quantification criteria of traditional rural settlements to optimize the fitting formula of urban parks to construct a scientific and systematic quantification method. In addition, the multidimensional assessment system of the cooling effect (cooling intensity, cooling distance, cooling area, and cooling efficiency) proposed by previous authors still needs more practice for empirical evidence. The thresholds of the cooling effect in park cities have a certain in situ nature, and a set of threshold data adapted to the construction of urban parks in Chengdu still needs to be explored.
Therefore, this study took 117 urban parks in the central city of Chengdu as the research object and focused on the cooling effect of various types of morphological parks through a multidimensional assessment system of the cooling effect, aiming to:
- Propose a park form classification method to delineate the major parks in Chengdu;
- Evaluate the cooling effect of different morphological types of parks;
- Analyze the relationship between the park cooling effect and morphological characteristics to determine the optimal cooling park form;
- Propose urban park planning and design optimization strategies to provide theoretical guidance basis for the construction and promotion of park cities.
2. Materials and Methods
2.1. Study Area and Objective
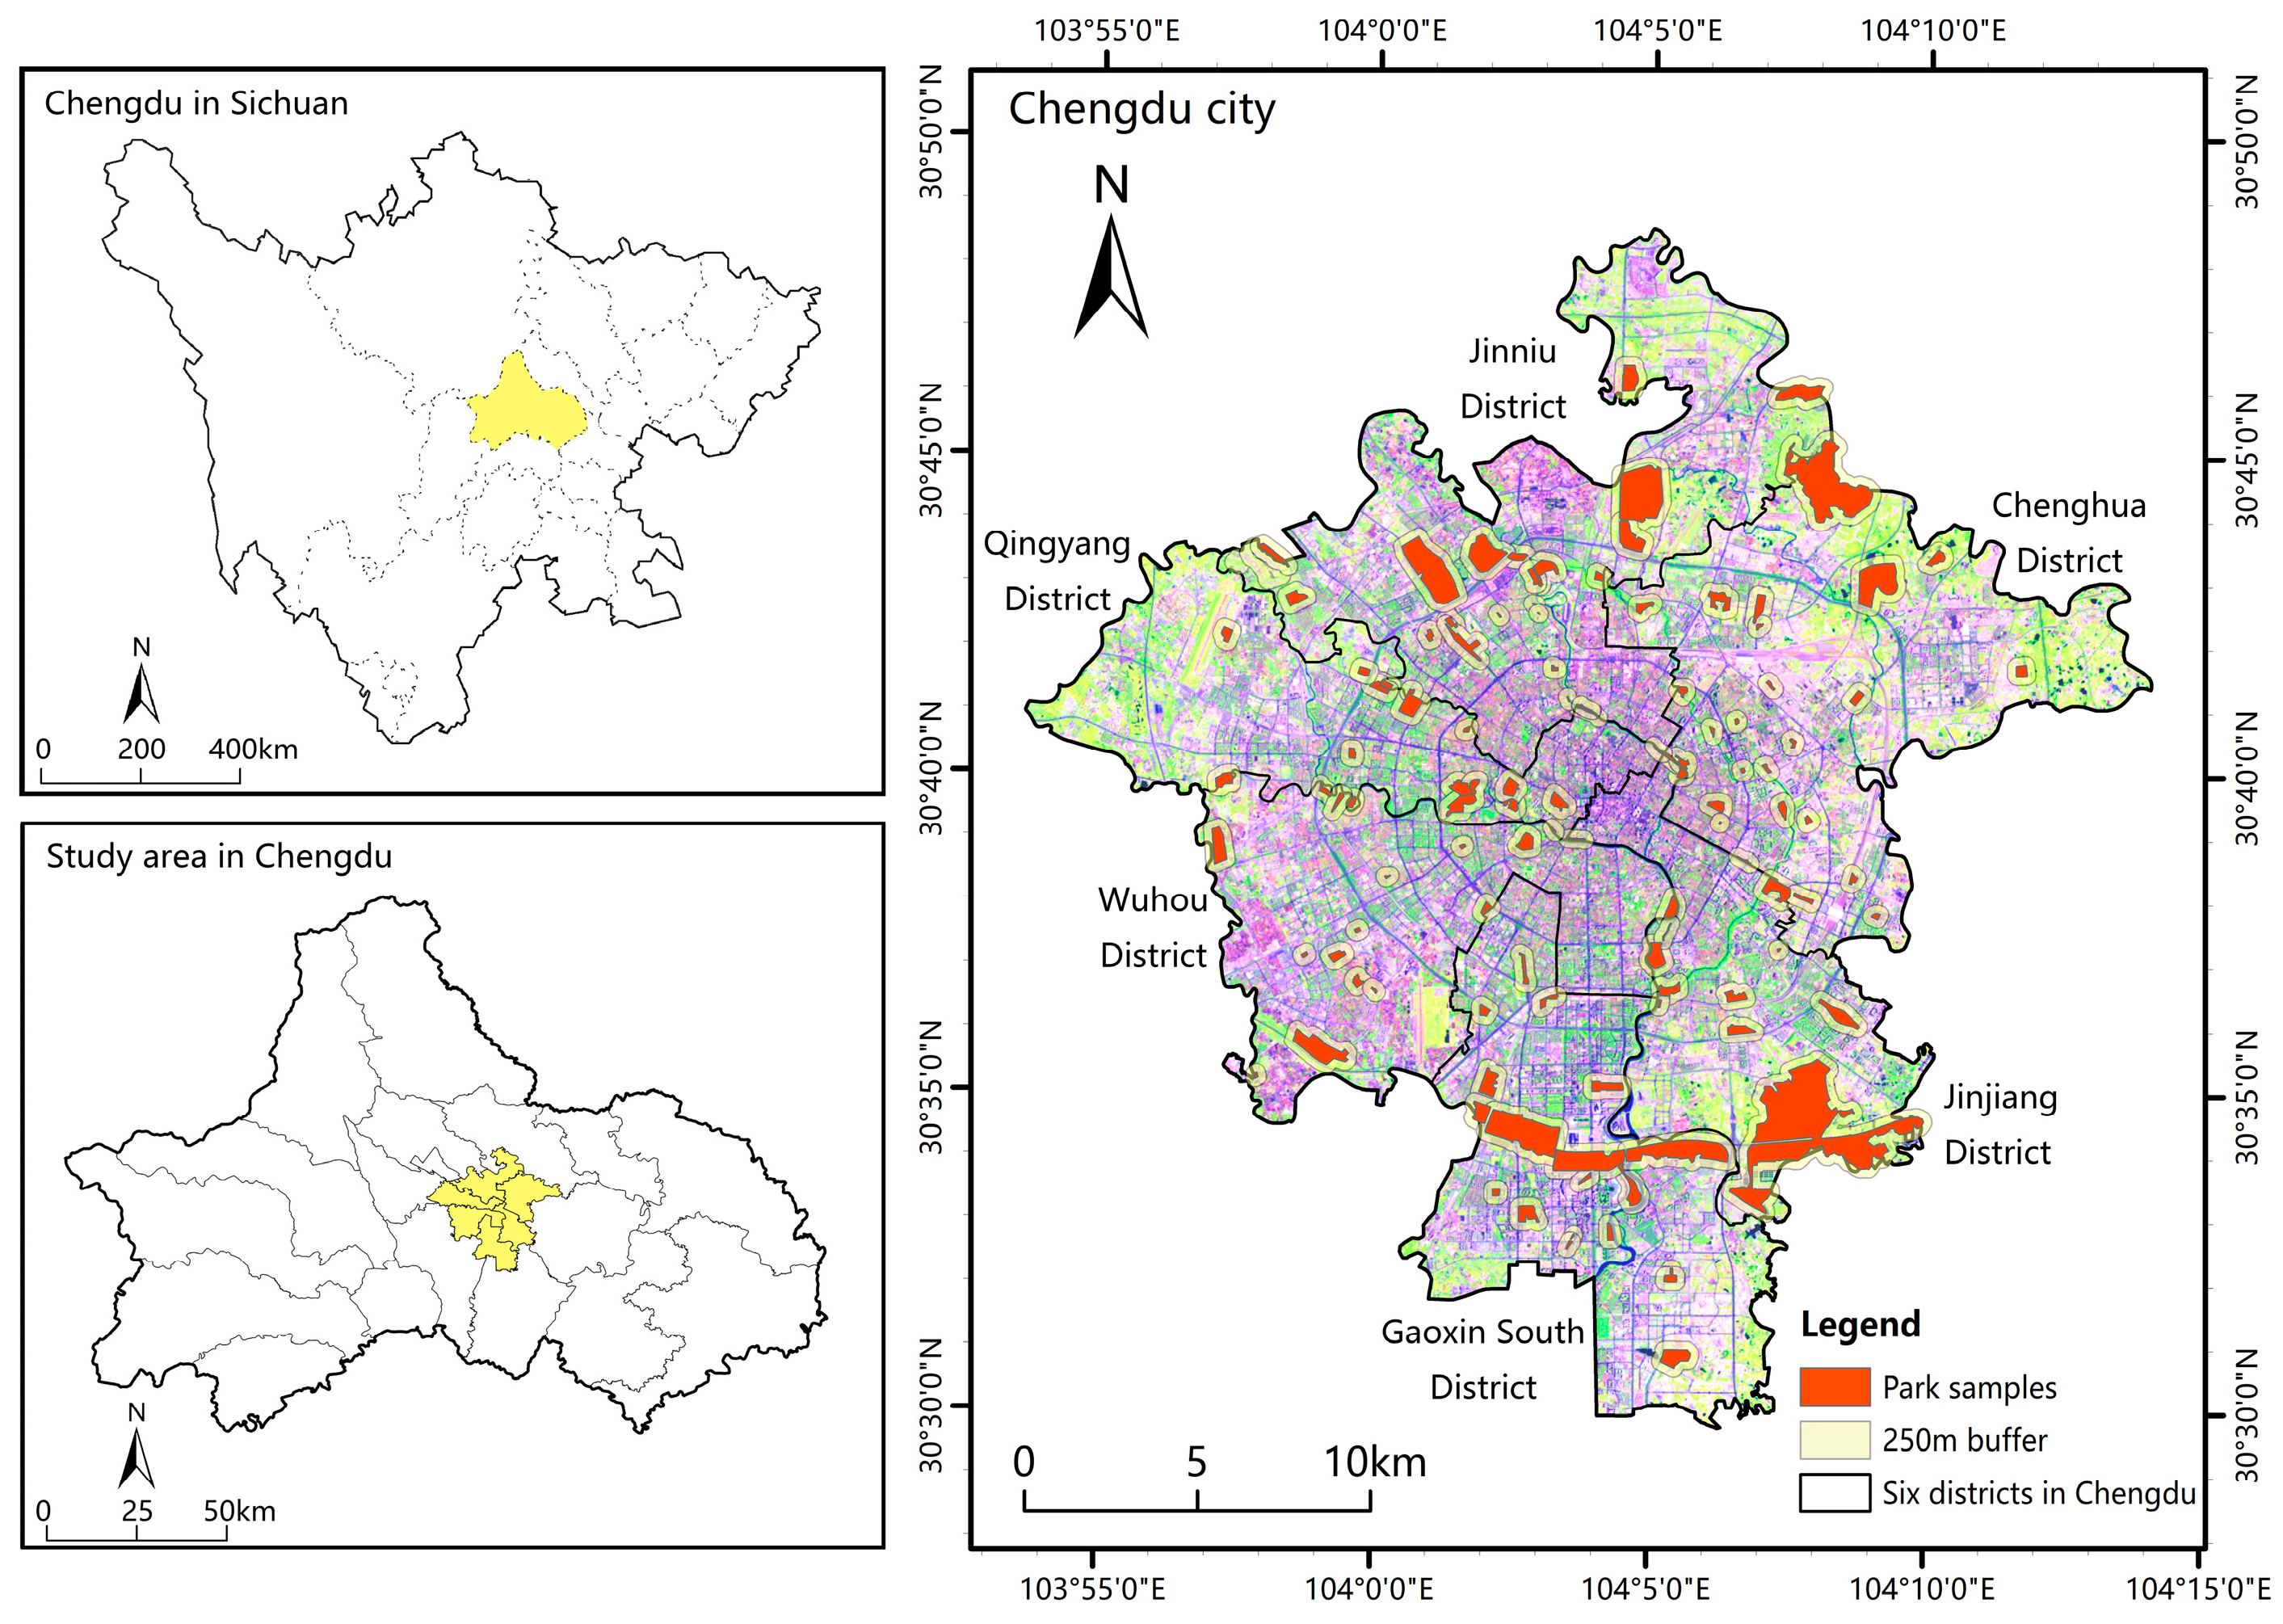
Chengdu (30°05′–31°26′ N, 102°54′–104°53′ E) is the capital city of Sichuan Province in the hinterland of Southwest China, located in the plain region of the central basin of Sichuan Province (Figure 1). Chengdu is a subtropical monsoon climate, the annual average temperature is 15.7–17.7 °C, the total precipitation is 798.3–1541.0 mm, and the average sunshine duration is 685.5–1002.9 h. Since 2018, Chengdu has continued to promote the construction of all-wide urban parks, 5327 km of greenways at all levels and 86 new urban parks of various types have been built, and the green coverage rate of built-up areas has increased from 41.6 percent to 45.1 percent.
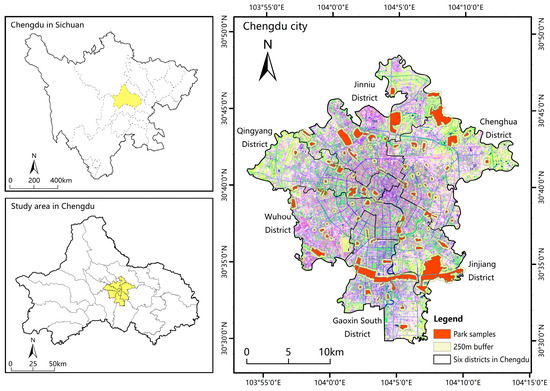
Figure 1.
Location of Chengdu in Sichuan Province and the 117 park samples in the study area.
The study area includes six main urban areas of Chengdu: Jinjiang District, Qingyang District, Jinniu District, Wuhou District, Chenghua District, and Gaoxin South District. The population density of the study area is high, and the heat island effect is obvious in the built-up area. In this paper, our study objectives were 117 urban parks, which are included in the urban park catalog published by the Chengdu Landscape Park Bureau (Figure 1). The boundary data of the administrative divisions in the figure above were derived from the open platform of the National Catalogue Service System for Geographic Information “http://www.webmap.cn/ (accessed on 12 May 2022)”.
2.2. Park Extraction and Classification
Following the guiding principles of urban park planning and design, six indicators of urban park morphological characteristics were selected from two aspects: landscape composition and morphology (Table 1). In terms of landscape composition, the percentage of the water body and the percentage of the green body were selected as internal element indicators [58,59]. In terms of morphology, urban park boundaries are complex and fragmented, with fractal geometry, which is similar to the characteristics of traditional rural settlements. Therefore, the fractal theory was used to classify the morphology of urban parks [32], which was based on the quantification method of the two-dimensional morphology of traditional rural settlements. At the same time, the area, circumference, and shape index of the greenbelt patch can affect the cooling degree of the greenbelt to the surrounding environment [27]. Ultimately, four morphological indicators were selected, namely, the park perimeter, area, shape index, and minimum external rectangle length–width ratio. Among them, the minimum outer rectangle length–width ratio can reflect the intensity of the park’s strip feature, while the shape index can reflect the fullness and complexity of the park’s boundary. In order to make the research results more accurate, the shape index formula was modified using the ellipse as the reference figure.

Table 1.
Urban park patch indicators used in this study.
In this paper, the Planning Cloud “http://www.guihuayun.cn/ (accessed on 16 May 2022)” and AMap “http://www.amap.com (accessed on 16 May 2022)” were used to obtain the urban park areas of interest data (AOIs). AOI is mainly used to express area-like geographical entities in maps and contains six basic pieces of information: name, address, category, latitude, longitude coordinates, area, and area outer contour. For this study, it was suitable for extracting the basic feature information of the morphologies of urban parks. The AOI information extracted from QGIS was used to calculate the morphological feature indicators of 117 urban parks and compare them in a comprehensive manner, as well as to quantitatively define the minimum outer rectangle and shape index. A shape index (S) of 2 was used as the defining value for the star-shaped feature, and then the length–width ratio (λ) value was used to distinguish between round, strip, and round park with a strip tendency. The results of the quantitative classification of urban park morphology are summarized and tabulated (Table 2).
Table 2.
Quantitative classification results of the spatial morphology of 117 urban parks.
2.3. Surface Temperature Inversion
This paper used remote sensing image data from Landsat-8 TIRS on 11 August 2019, observed at 11:33 (UTC + 8). The data were sourced from the Geospatial Data Cloud “http://www.gscloud.cn/ (accessed on 12 May 2022)”, with a path/row of 129/39. The image had a cloudiness of 0.89, no banding, and good image quality. Preprocessing operations, such as radiometric calibration, atmospheric correction, and image cropping, were performed on the data in ENVI5.3.
Landsat-8 TIRS has two thermal infrared bands, B10 and B11, and since the parameter settings of the 11th band are still unstable and the inversion of the surface temperature using radiative transfer equation (RTE) method for the 10th band of Landsat-8 satellite has high accuracy [60]. Therefore, this study chose to obtain accurate surface temperature data using the RTE method for the 10th band. Since the upfront calculation requires the use of bands 4 and 5, both of which have a spatial resolution of 30 m, the final resolution of surface temperature inversion is 30 m.
The main principle of the RTE method is to evaluate the atmospheric influence on the surface thermal radiation and to remove this atmospheric influence from the total thermal radiation observed by satellites to obtain the true surface radiation intensity, which is then transformed into the surface temperature [61,62]. The radiative brightness B(TS) of the blackbody is obtained according to the radiative transfer equation.
The transmittance τ in Equation (1), the atmospheric upward radiant brightness (W·m−2·sr−1·μm−1), and the atmospheric downward radiant brightness (W·m−2·sr−1·μm−1) are available through the NASA official website “http://atmcorr.gsfc.nasa.gov/ (accessed on 12 May 2022)”. After estimating the radiant brightness (TS) of the blackbody, the ground truth temperature is derived according to the inverse function of Planck’s law. The formula is as follows.
and are constants in Equation (2), and for Landsat-8 TIRS band 10, = 774.89 and = 1321.08.
2.4. Park Cooling Effect Assessment
Studies have proposed to use the temperature difference between the inner and outer environments of urban parks to define the cooling effect of parks [63,64]. Based on this, in order to obtain the cooling effect of a large number of parks more conveniently, SU [65] found that the temperature difference between the park’s peripheral temperature and the park boundary point temperature and the distance from the park boundary can be approximated as a cubic polynomial over the origin and verified its high reliability based on a large number of actual park measurement samples.
In this paper, the cooling effect of an urban park was measured by its external ambient LST. A multiring buffer with equal distance variation was established from the edge of the park, and the distance of the overall buffer was 1.5 times the width of the park. Since the resolution of the Landsat-8 remote sensing image is 30 m, the width of each ring buffer was set to 30 m. The relationship between the temperature difference inside and outside the park and the distance was established using a cubic polynomial with the following equation:
In practice, there is no temperature difference when the distance is 0 m, i.e., T is always 0 °C when L = 0 m in the cubic polynomial. Therefore, the curve fitting process was corrected for the resulting cubic polynomial, and the final equation obtained is as follows:
In Equations (3) and (4), T is the difference between the average LST within each ring buffer and the average temperature inside the park, L denotes the distance from each ring buffer to the park boundary, and a, b, and c are the coefficients of each of the cubic polynomials obtained from the fit.
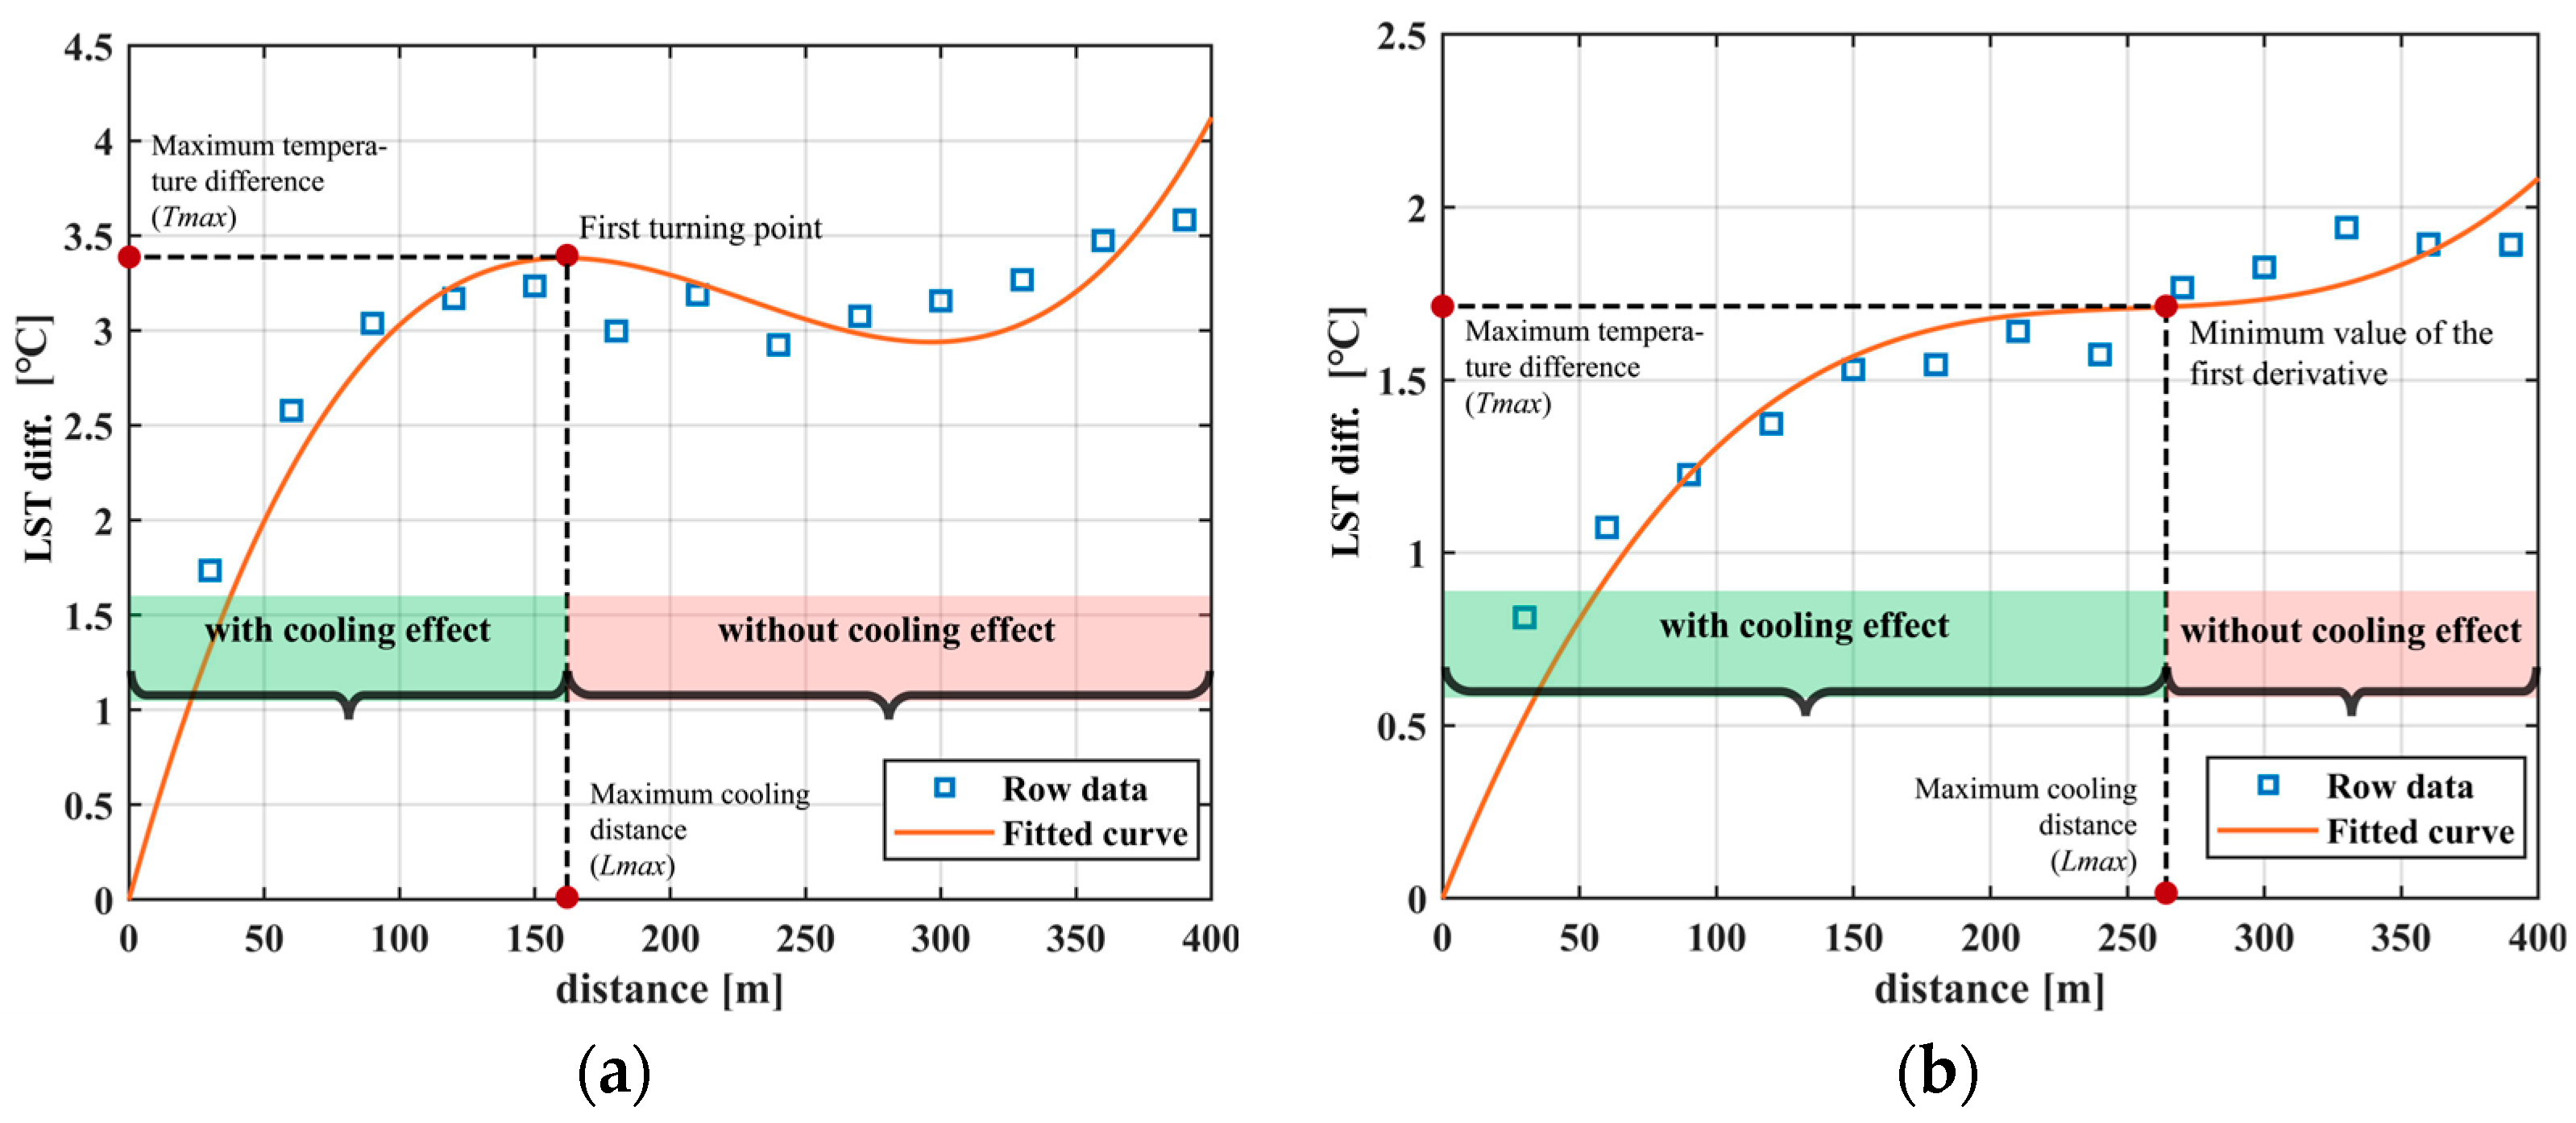
The change curve depicted by the modified cubic polynomial is shown in Figure 2. From the figure, it can be seen that the value of the first-order derivative function of the relational function T(L) gradually decreases with increasing distance. When its value tends to 0, this indicates that the park loses the cooling effect on the external environment. Therefore, this paper selected the point when the value of the first-order derivative function is 0 for the first time and calls it the first turning point [53,64]. The first turning point is the maximum limit of the park’s cooling effect, and if the curve does not have a first turning point, it is replaced by the point with the smallest positive value of the first-order derivative. By finding the first turning point data, a further quantitative description of the park cooling effect can be achieved.
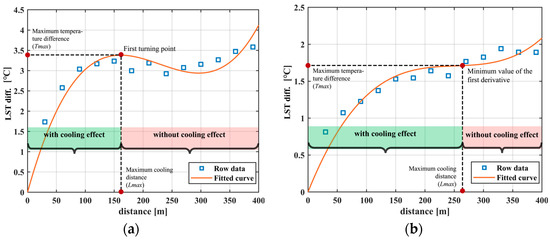
Figure 2.
Illustration of two types of LST change curves of park cooling process: (a) LST change curves of the park cooling process with a real first turning point; (b) LST change curves of the park cooling process without a real first turning point.
The research measured and compared the cooling effect of the park in two dimensions: spatial characteristics and degree characteristics. The details are as follows:
- Park cooling distance (PCD), which is defined as the furthest distance from the edge of an urban park that can be affected by the park cooling effect (Lmax), is an index used to measure the magnitude of the park cooling effect in the horizontal direction. It has been demonstrated that the root means square of the Lmax error derived from the fitted equation is basically between 1.0 and 4.5 m [65].
- Park cooling area (PCA), which is defined as the area of the largest peripheral buffer zone (Smax) affected by the cooling effect of the park [52]. The spatial distribution of the park cooling effect is closely related to the size and external morphology of the park itself. A single park cooling distance (PCD) cannot capture the variation in spatial characteristics and requires the use of the park cooling area (PCA) for additional description.
- Park cooling intensity (PCI), which is defined as the maximum difference between the LST(Te) in the maximum cooling range outside the park and the average LST(Tpark) inside the park. The larger the PCI, the greater the cooling magnitude of the exterior area of the urban park and the greater the cooling effect of the park on the peripheral area, regardless of the size and shape of the park. It has been demonstrated that the root mean square error of the PCI derived from the fitted equations remains essentially in the range of 0.1–0.37 K [65].
- Park cooling efficiency (PCE), which is defined as the ratio of the maximum cooling area of an urban park (Smax) to the park area (Spark) [52]. This index reflects the external cooling area per unit area of the park. As can be seen in Equation (7), PCE is a typical mathematical expression of efficiency in the form of the ratio of the number of effective outputs (“product”) to the number of total inputs (“cost”) (R = P/C). Here, the area of park construction is considered as input (“cost”), and the effective cooling area is considered as effective output (“product”), which can realize the measurement of economic efficiency of urban park construction in terms of the thermal environment.
3. Results
3.1. Classification of Park Planar Morphology
The classification results of 117 parks in the study area of Chengdu are shown in Figure 3a. Among them, there were 60 strip parks with the largest number. However, the number of star-shaped parks without a clear tendency and star-shaped parks with a strip tendency was the least, only one or two. Therefore, the cooling effect of these two types of urban parks cannot be scientifically discussed. Round parks were evenly distributed throughout the city center, and the larger round parks were located in the eastern region (Figure 3b). Large strip parks were found mainly in the south and southwest. However, there were fewer round parks with a strip tendency in the southwest corner.
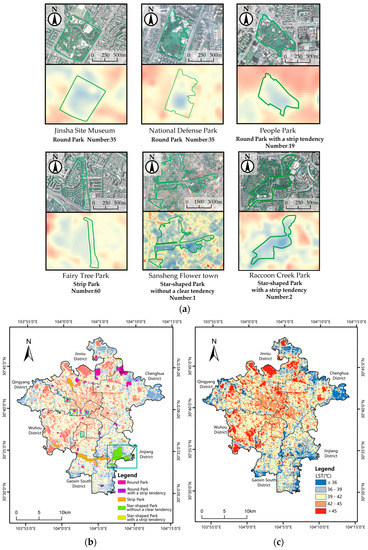
Figure 3.
(a) Six samples of park forms; (b) classification of 117 park forms; (c) temperature pattern in Chengdu on 11 August 2019.
As shown in the temperature inversion result of a satellite image of Chengdu city on 11 August 2019 (Figure 3c), the average surface temperature of the study area on that day was 40.49 °C, which was higher than the average surface temperature of the urban park of 39.14 °C. As a whole, the temperature gradually decreased from north to south. We could find that the number of large urban parks in the northwestern part of the study area was low, and the surface temperature was high. Large parks such as Sansheng Huaxiang Park were located in the south of the study area, and the cold air generated had a large penetration distance, resulting in the southern area becoming a low-temperature zone. The average surface temperature in Jinjiang District, where it was located, was the lowest at 39.1 °C. Small- and medium-sized parks tended to be distributed inside densely built-up areas, forming local low-temperature centers. Taking People’s Park as an example, its internal surface temperature was 4.27 °C lower compared to the surrounding residential areas.
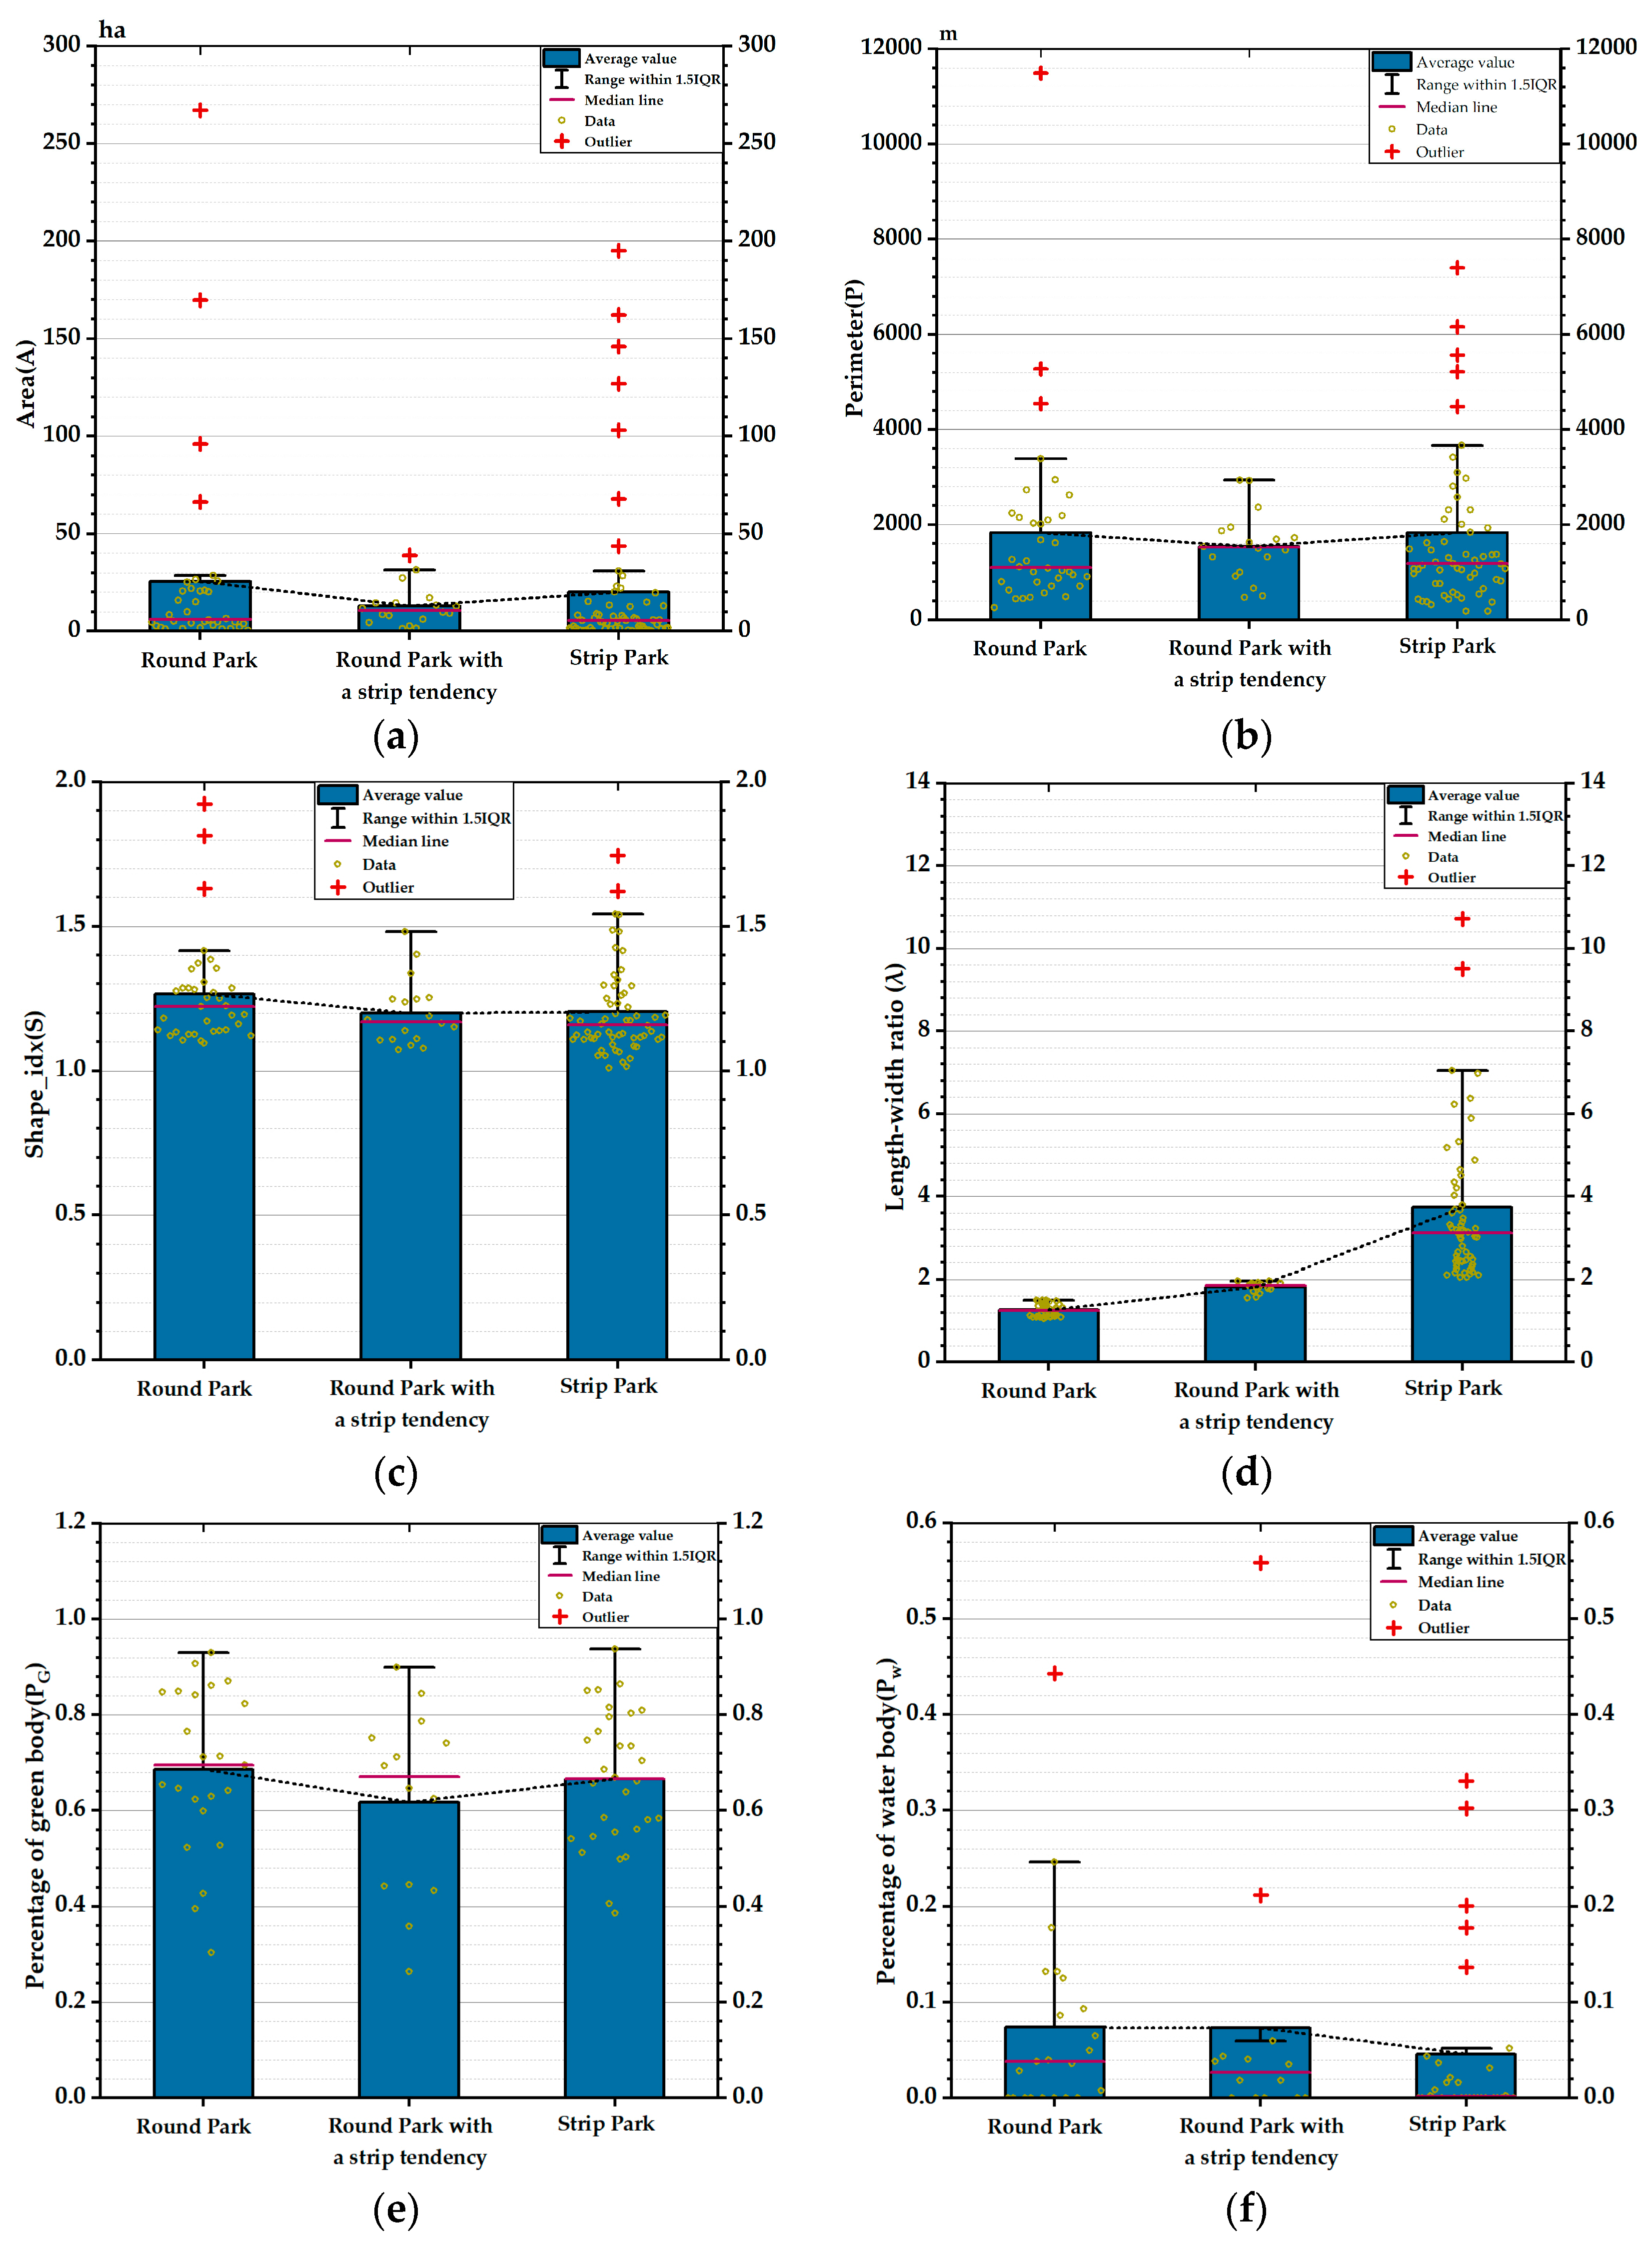
Six characteristic indicators of all urban parks were calculated (Figure 4). The average area of round parks and strip parks was 25.5 and 20.0 ha, respectively, and there was no significant difference in the values. The average perimeter was 1826.8 and 1830.3 m, respectively, and there was no significant difference. However, the average area of round parks with a strip tendency was only 50.7% of that of the round parks, and the average perimeter was approximately 290 m smaller than that of the other two types of parks. The length–width ratio fluctuated greatly in the three types of urban parks. The length–width ratio of the round parks was the smallest, only 1.26, which was 0.55 smaller than that of the round park with a strip tendency. Compared with strip parks, it was 66.3% smaller. In terms of the shape index, the values of these three indexes were almost the same. The percentage of green body in urban parks was in the range of 0.5–0.7, while the percentage of water body was below 0.1.
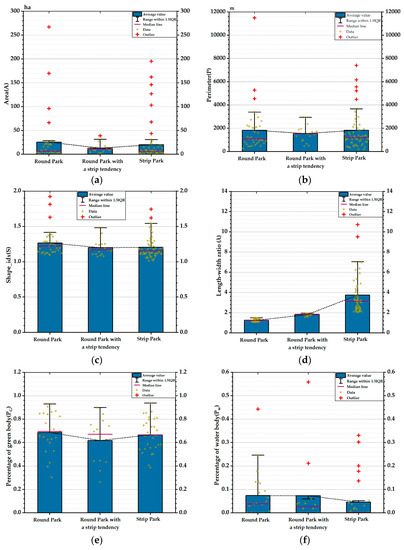
Figure 4.
Morphological indexes of the 117 urban parks: (a) area; (b) perimeter; (c) minimum length–width ratio of an external rectangle; (d) shape index; (e) percentage of water body; (f) percentage of green body.
3.2. Comparison of Park Cooling Indexes
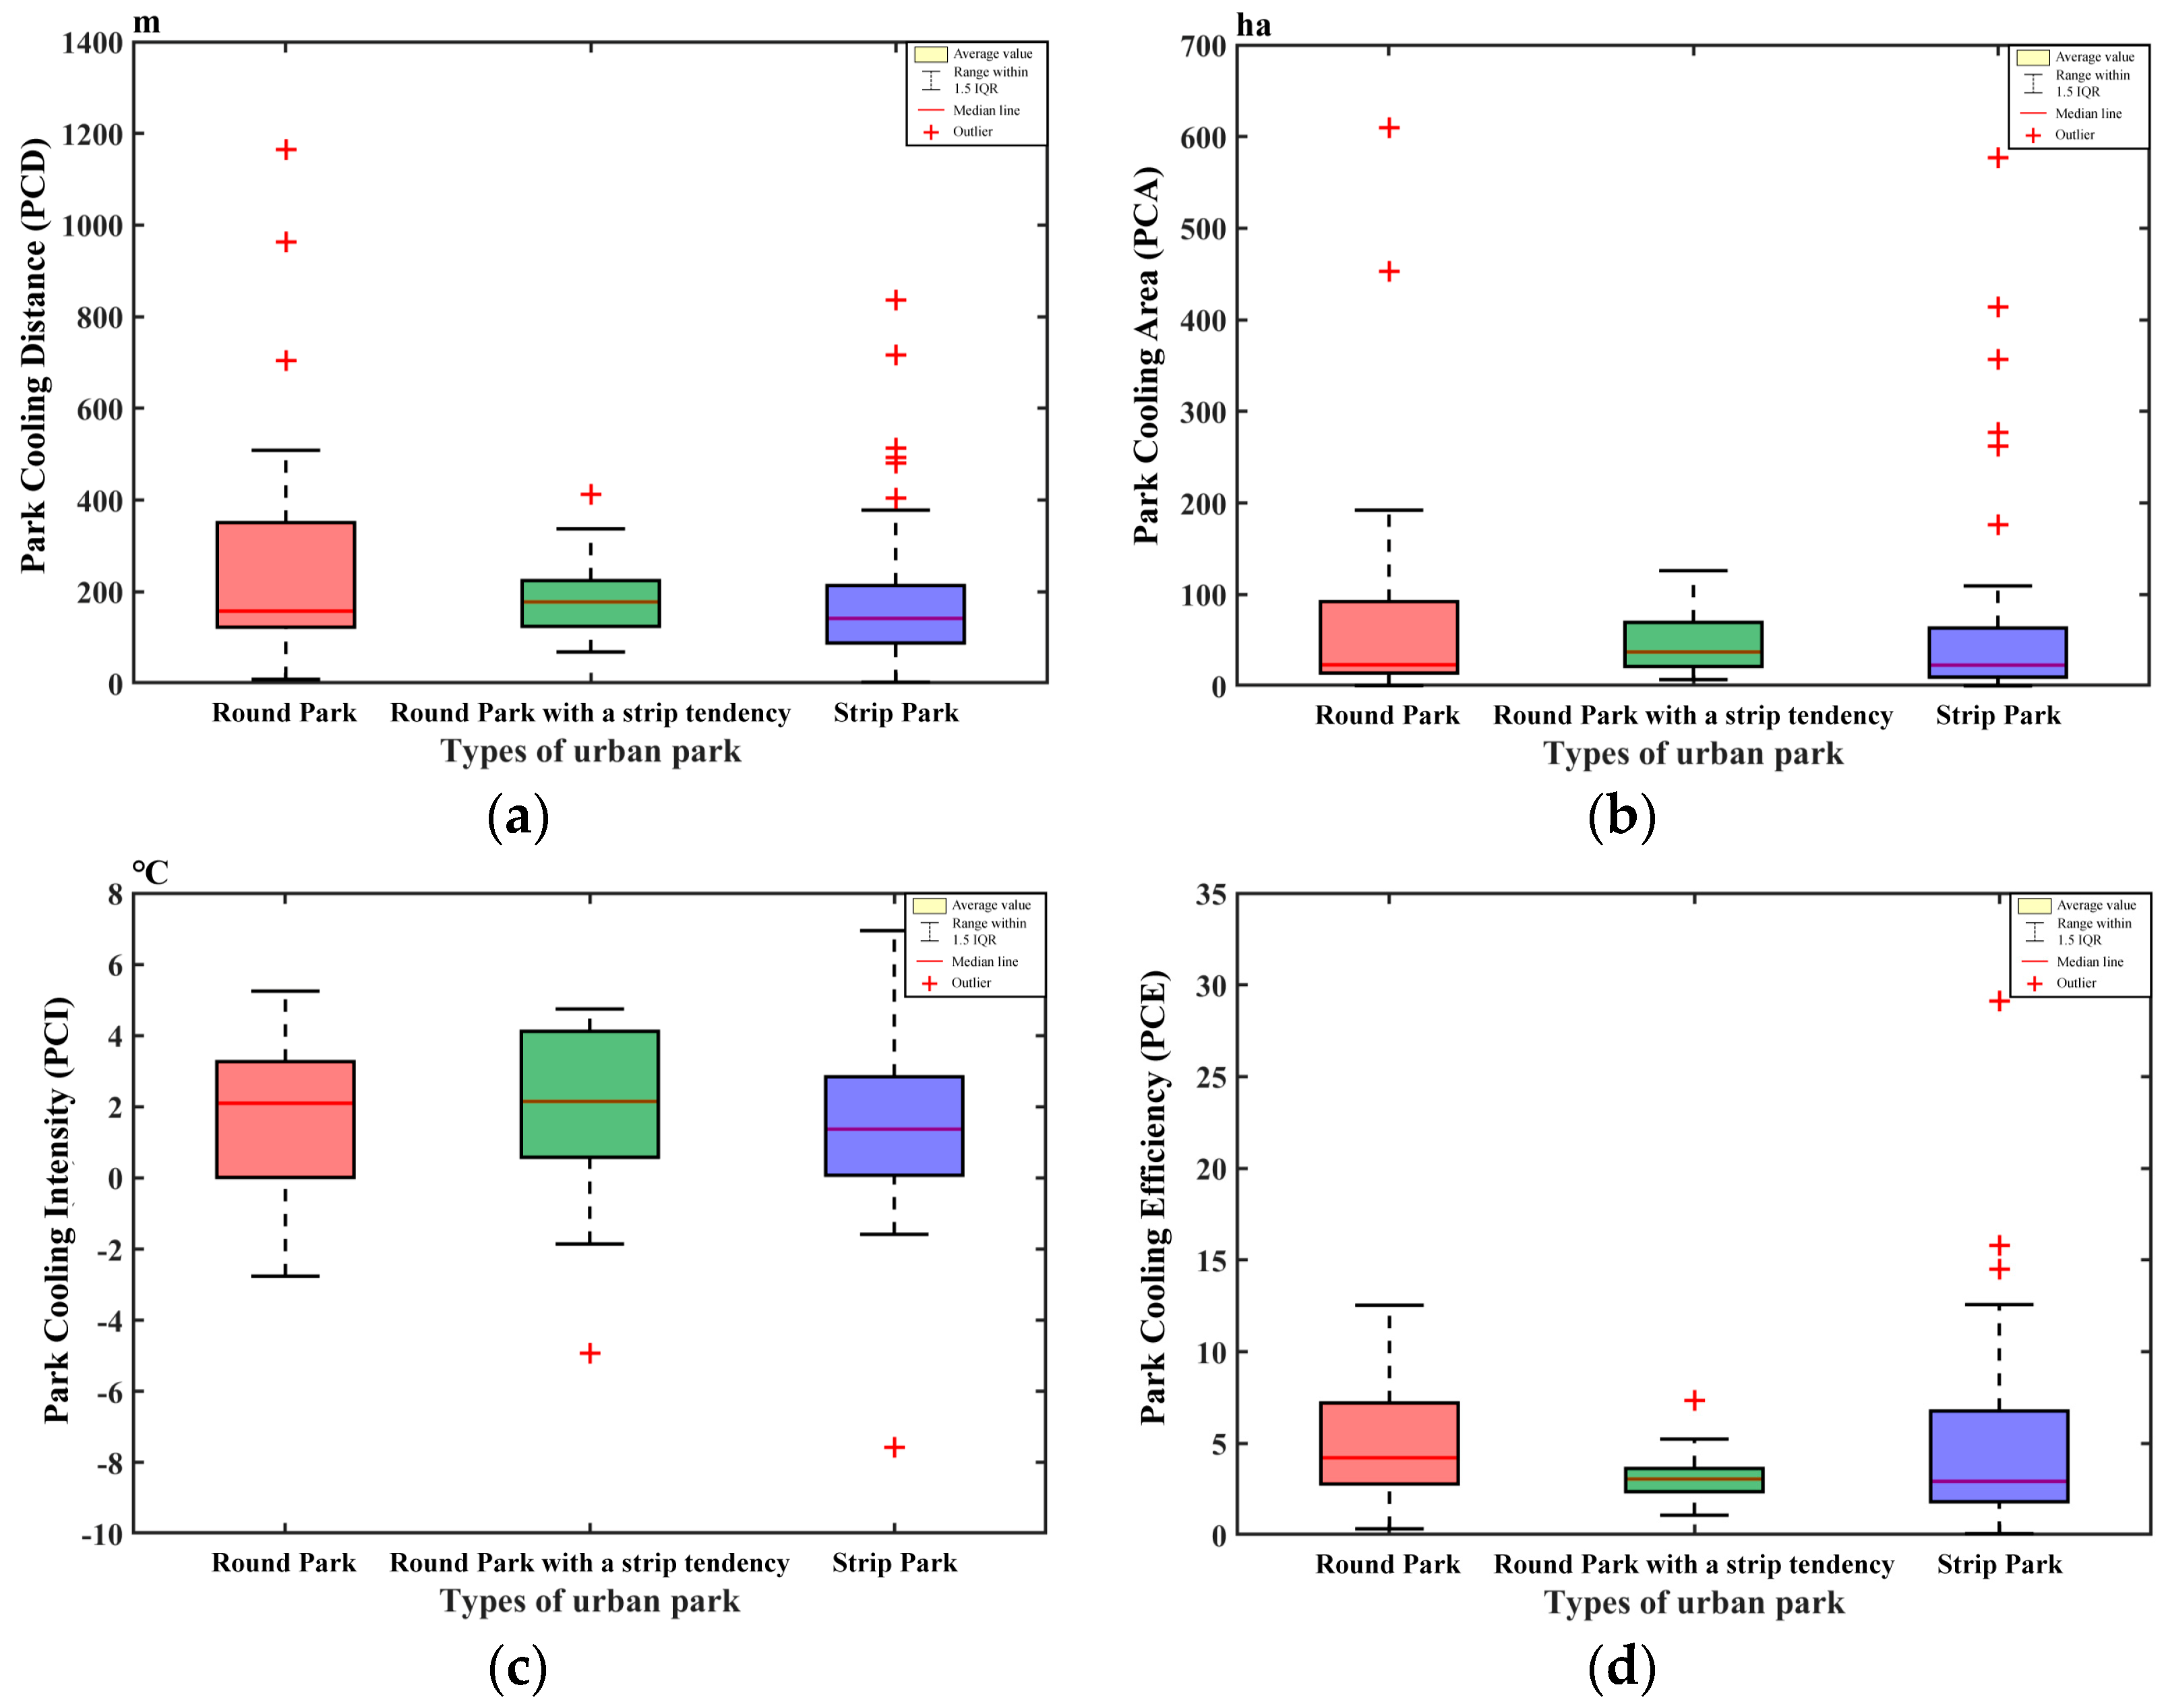
After excluding the ineligible urban parks from the cubic polynomial fitting process, the four cooling indices for the remaining 67 urban parks were calculated separately (Figure 5). Some of the urban parks were excluded for the following reasons: (1) the amount of data needed for the cubic polynomial curve fitting was not less than four groups, so some of the urban parks with too small an area could not meet the fitting conditions because the radius of the buffer zone was too small; (2) some of the urban parks had no cooling effect due to the fact of their special internal conditions or the influence of the external environment. The round parks exhibited relatively high PCA, PCD, and PCE values, and the fluctuations of all indices were large. The maximum value of PCA in round parks was 192.0 ha, which was 86.2 ha higher than the maximum value in the strip park. However, there were many anomalies with high values in the strip park, indicating that a small number of large urban parks in the strip form have been built in Chengdu. The maximum value of PCE in the round park, on the other hand, was 9.3 larger than the mean value of PCI in the round park with a strip tendency. As shown in Figure 5, the PCI of urban parks was mostly positive, indicating that the LST of urban parks was significantly lower than that of the surrounding environment. Although there was a maximum PCI in the strip park, the mean values of both the round park and the round park with a strip tendency were greater than it, 0.16 and 0.22 °C higher, respectively, and the PCI values of the round park with a strip tendency were generally larger.
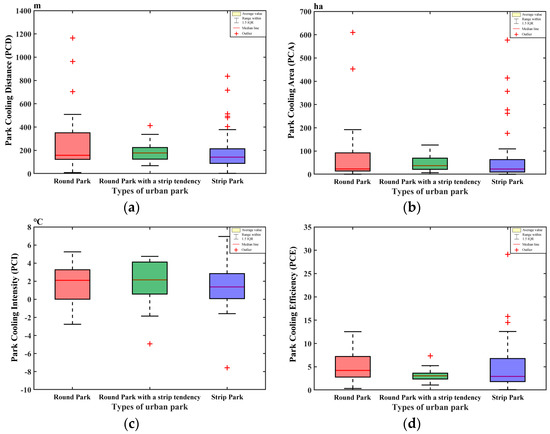
Figure 5.
Cooling indexes of the 67 urban parks: (a) park cooling distance; (b) park cooling area; (c) park cooling intensity; (d) park cooling efficiency.
3.3. Cooling Effect of Various Morphologies of Urban Parks
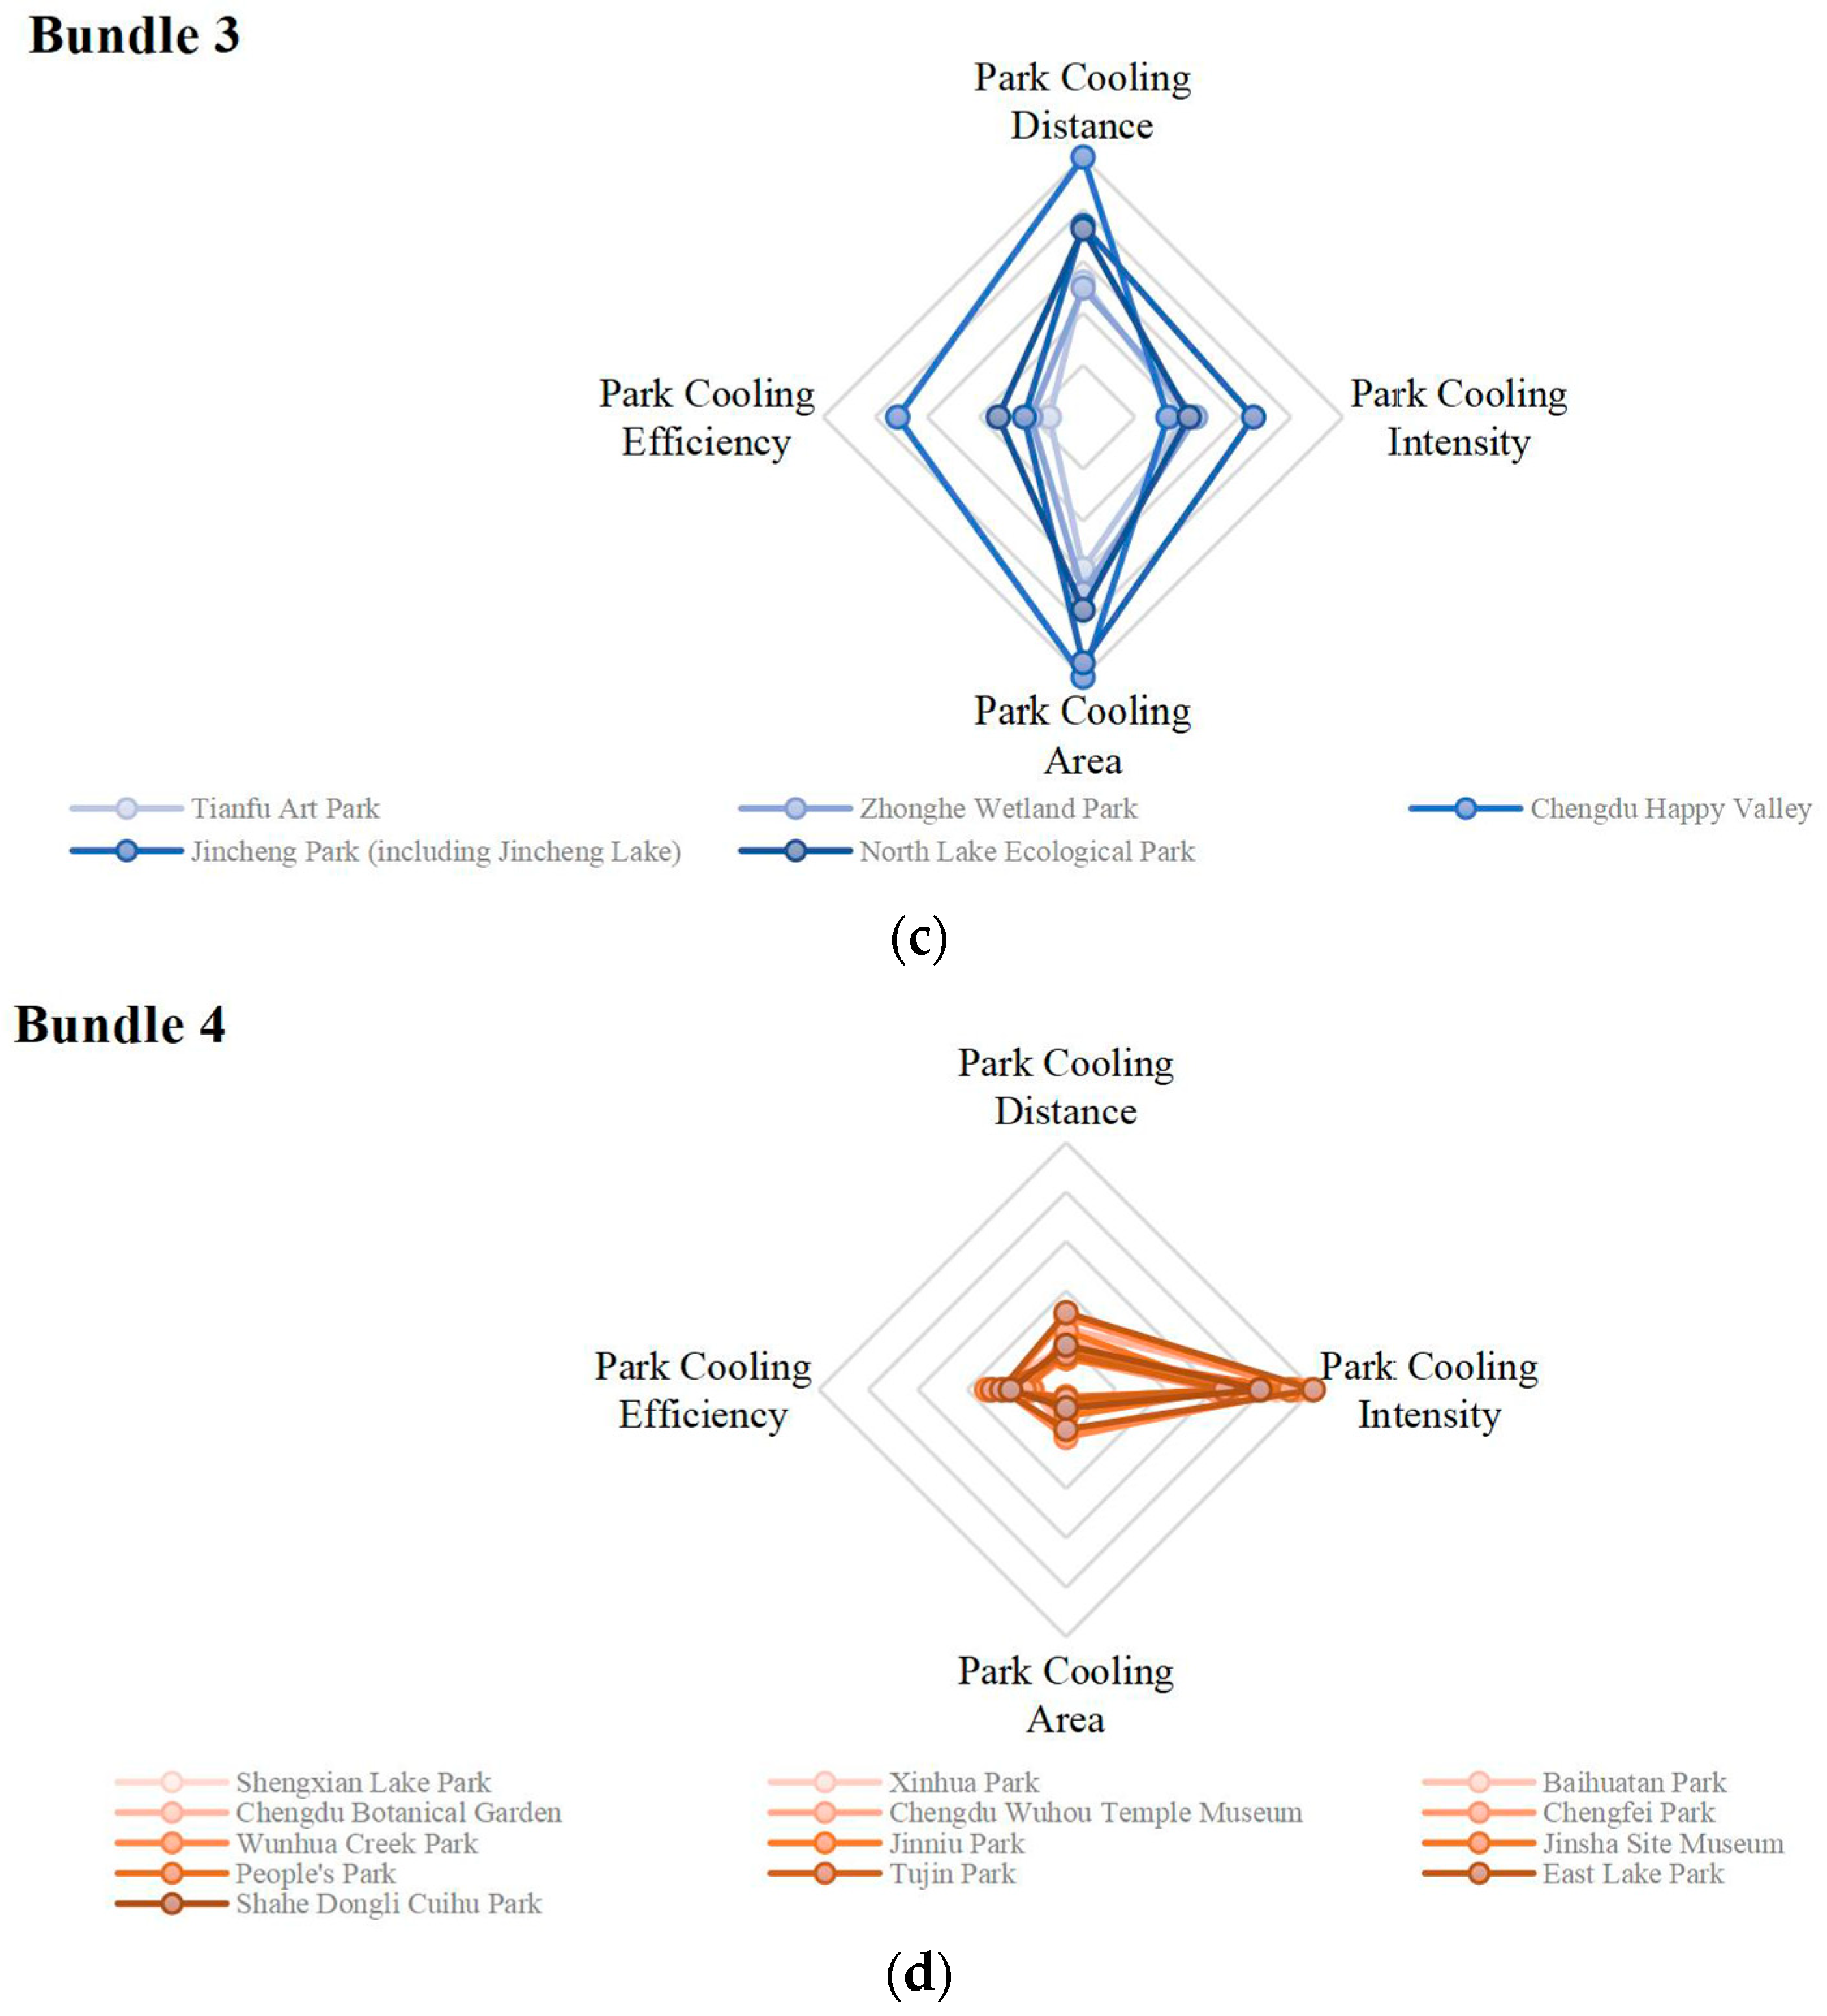
To further explore the cooling effect of the different morphologies of urban parks, all indicators were normalized and stratified using the ward clustering method in this paper. After removing the outliers, the remaining 63 urban parks were divided into four types, corresponding to Bundle 1, Bundle 2, Bundle 3, and Bundle 4 (Table 3).
Table 3.
Classification of 63 different forms of park cooling effect.
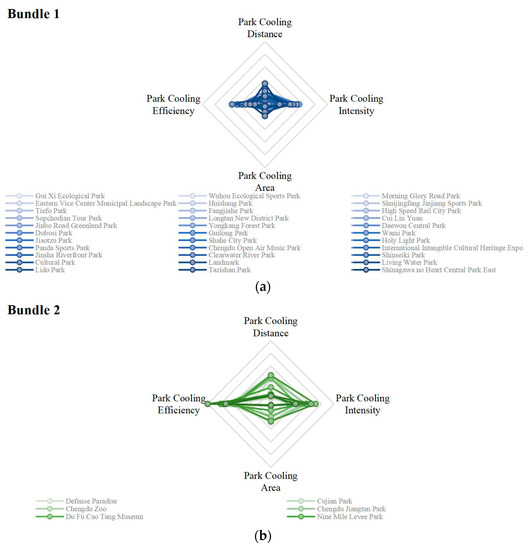

Figure 6.
Radar plots of the urban parks’ cooling effect: (a) urban park cooling effect bundle 1; (b) urban park cooling effect bundle 2; (c) urban park cooling effect bundle 3; (d) urban park cooling effect bundle 4.
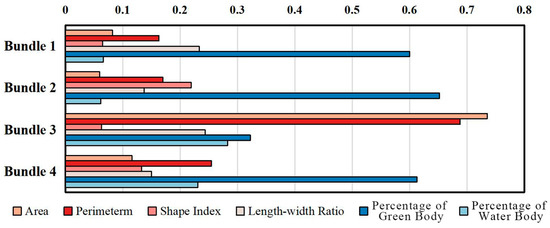
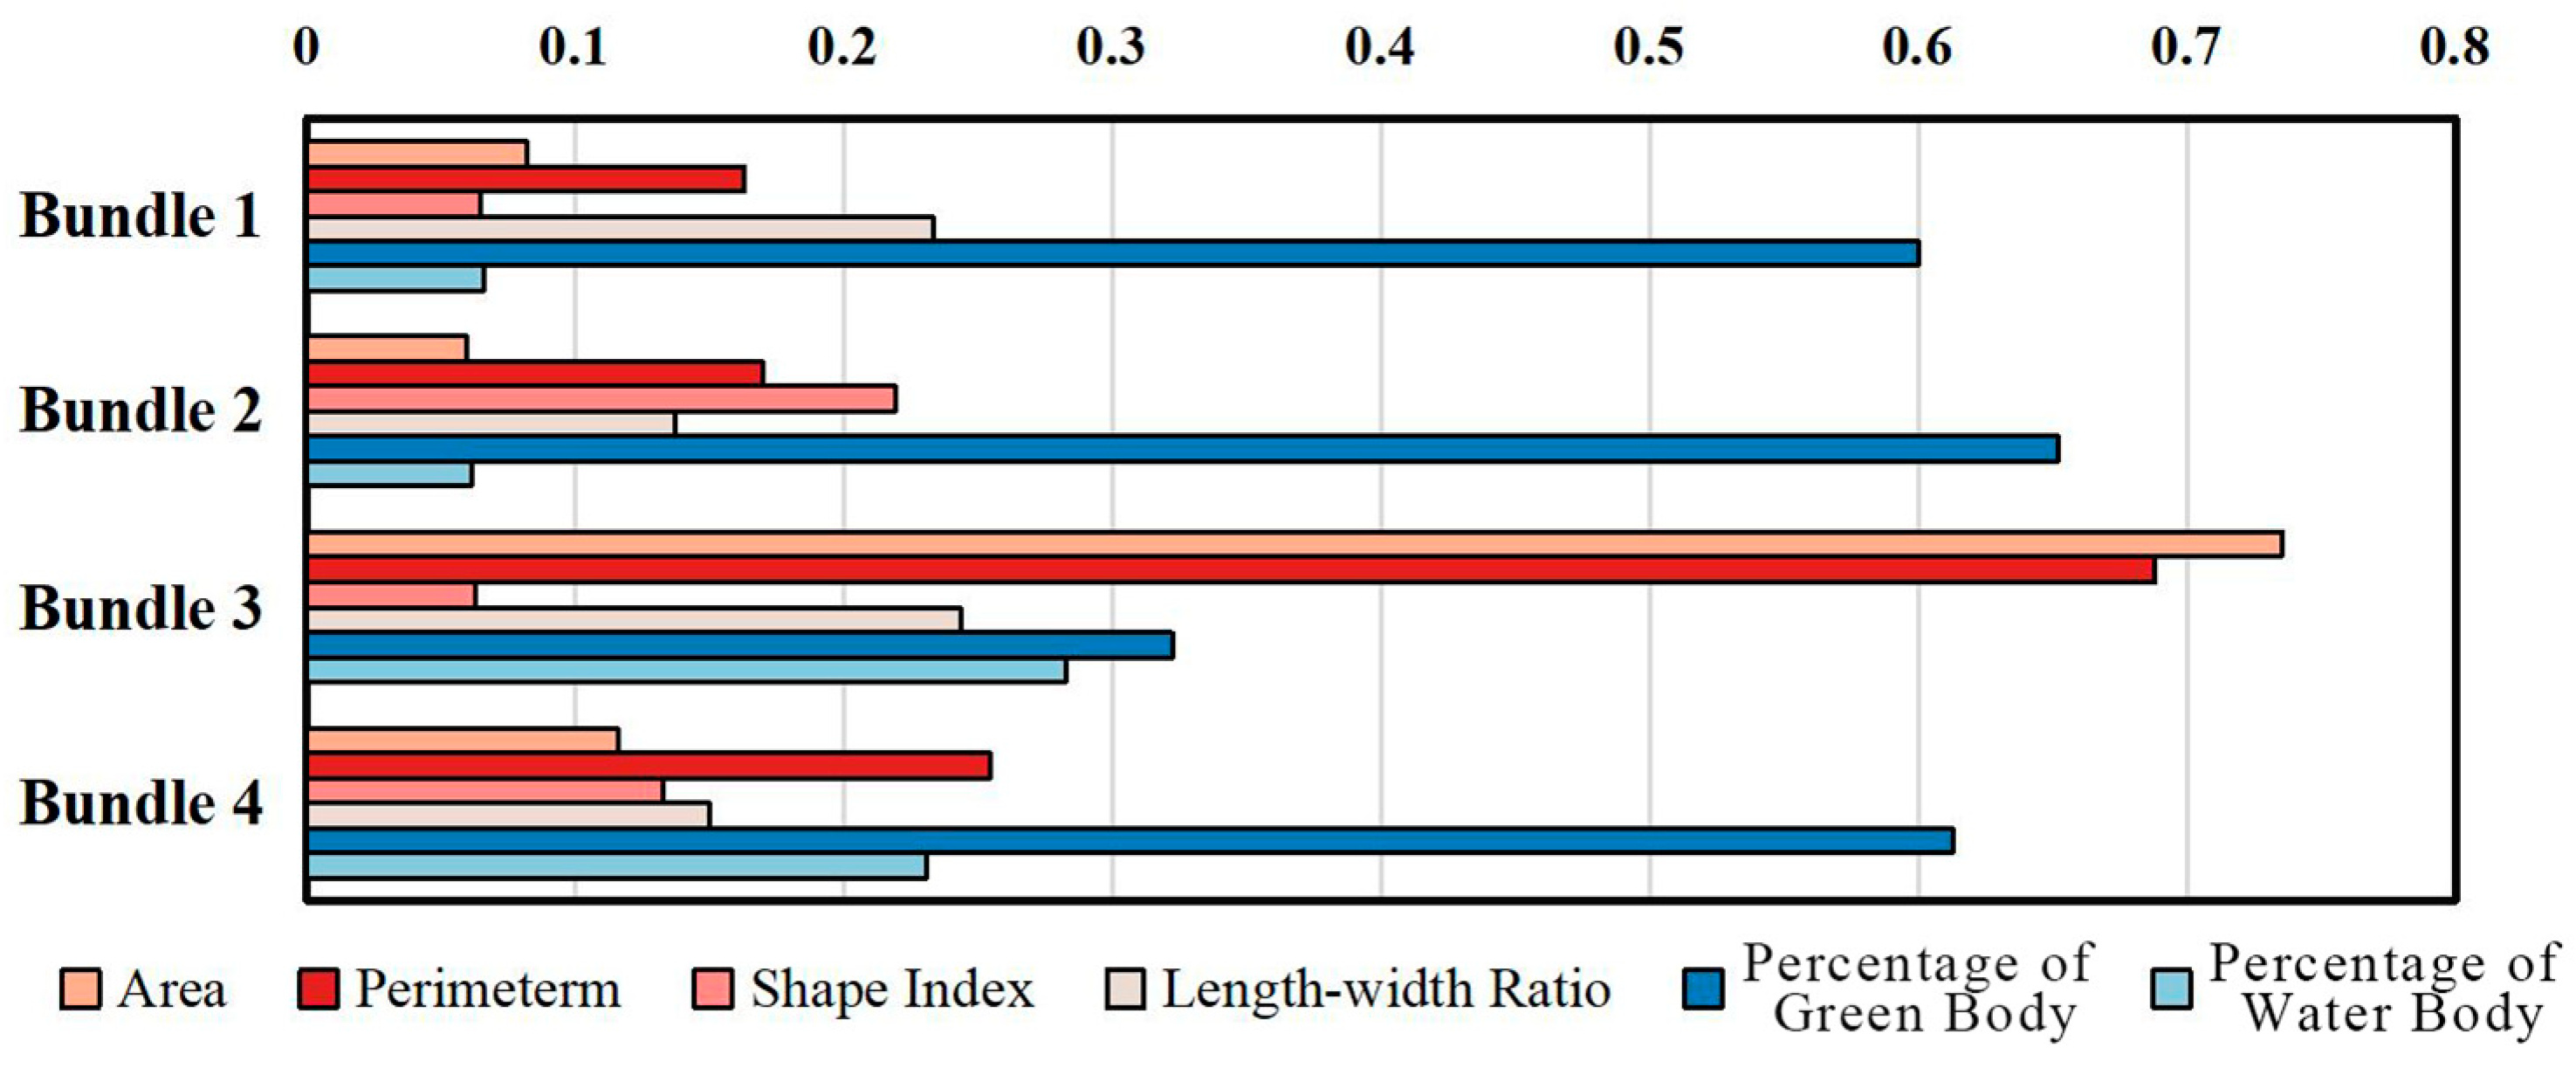
Figure 7.
Comparison of the mean values of the urban park characteristic indexes according to the classification of the four cooling effect bundles.
- Bundle 1 (Figure 6a): All four cooling indicators were low. Their PCD, PCA, PCE, and PCI were less than 82.9%, 52.4%, 93.7%, and 73.2% of the maximum value, respectively. This type of urban park had the weakest cooling effect. Most of them were narrow strip parks.
- Bundle 2 (Figure 6b): Most of these urban parks focusing on cooling efficiency were round parks with an average PCE of 0.7. Compared with the PCE of Bundle 3 and Bundle 4, the average cooling efficiency of this type was 53.9% and 64.2% higher, respectively. Its average shape index was the largest at 0.2, which was 71.5% higher than the smallest value. While the average park area to water body area ratio was the smallest. The PCE characterizes the effectiveness or economy of the park cooling process, and the larger the PCE, the greater the economic efficiency of the urban park. Therefore, considering the input and output of urban park construction, the round park had certain economic benefits in terms of the cooling effect.
- Bundle 3 (Figure 6c): These parks were dominated by cooling area and cooling distance. The cooling effect of this type on the surrounding environment was stronger, with a PCA and PCD generally higher than 84.6% and 70.5%. It is mainly a large area strip park, the average area and perimeter of which are 0.7 and 0.7, respectively, which were higher than 88.4% and 71.6% of the urban parks in Bundle 2. Park area and perimeter are important factors influencing PCA and PCD, but they are also limited by other conditions. For example, the largest PCA and PCD in Bundle 3 was Chengdu Happy Valley, and its PCE was also higher, yet the park area and perimeter were much smaller than Jincheng Park (the largest area).
- Bundle 4 (Figure 6d): The cooling effect of such parks is mainly based on the cooling intensity. PCI was significantly higher at 0.8, while PCA, PCE, and PCG were lower. Their PCI average was 0.3 higher than the PCI of Bundle 2 and Bundle 3. This type of park was mainly the round park with a strip tendency and the round park, with a higher vegetation area and lower average perimeter and area.
In summary, the different morphologies of urban parks have different cooling effects. Overall, round parks had the strongest cooling effect and higher cooling efficiency and intensity, whereas round parks with larger shape indexes had good economic and ecological benefits. The cooling effect of the strip parks was weaker, but the large strip parks could significantly increase the cooling area and cooling distance. In addition, round parks with a strip tendency excel in cooling intensity.
3.4. Influencing Factors of Urban Park Cooling Effects
The four indicators of the urban park cooling effect were correlated with the four indicators of park morphological characteristics using Pearson coefficients in SPSS25.0. As shown in Table 4, the PCA and the PCD had a significant positive correlation with the park area and perimeter, a positive correlation with the shape index, and no correlation with the aspect ratio. The PCE was significantly correlated with the shape index, while the PCI was not correlated with any of the four park cooling effect indicators.
Table 4.
Correlation analysis.
To further explore the causes of this cooling effect strength, a variety of functions (linear, logarithmic, exponential, multiplicative power, etc.) were fitted to these indicators. The results show that the PCA was best fitted with the area and perimeter as a cubic function, with fit coefficients of 0.964 and 0.948, respectively. Similarly, the PCD was best fitted with the area and perimeter as a cubic function, with fit coefficients of 0.898 and 0.886, respectively. The PCI was best fitted with the shape index as a logarithmic function, with fit coefficients of 0.489, which is analyzed as follows.
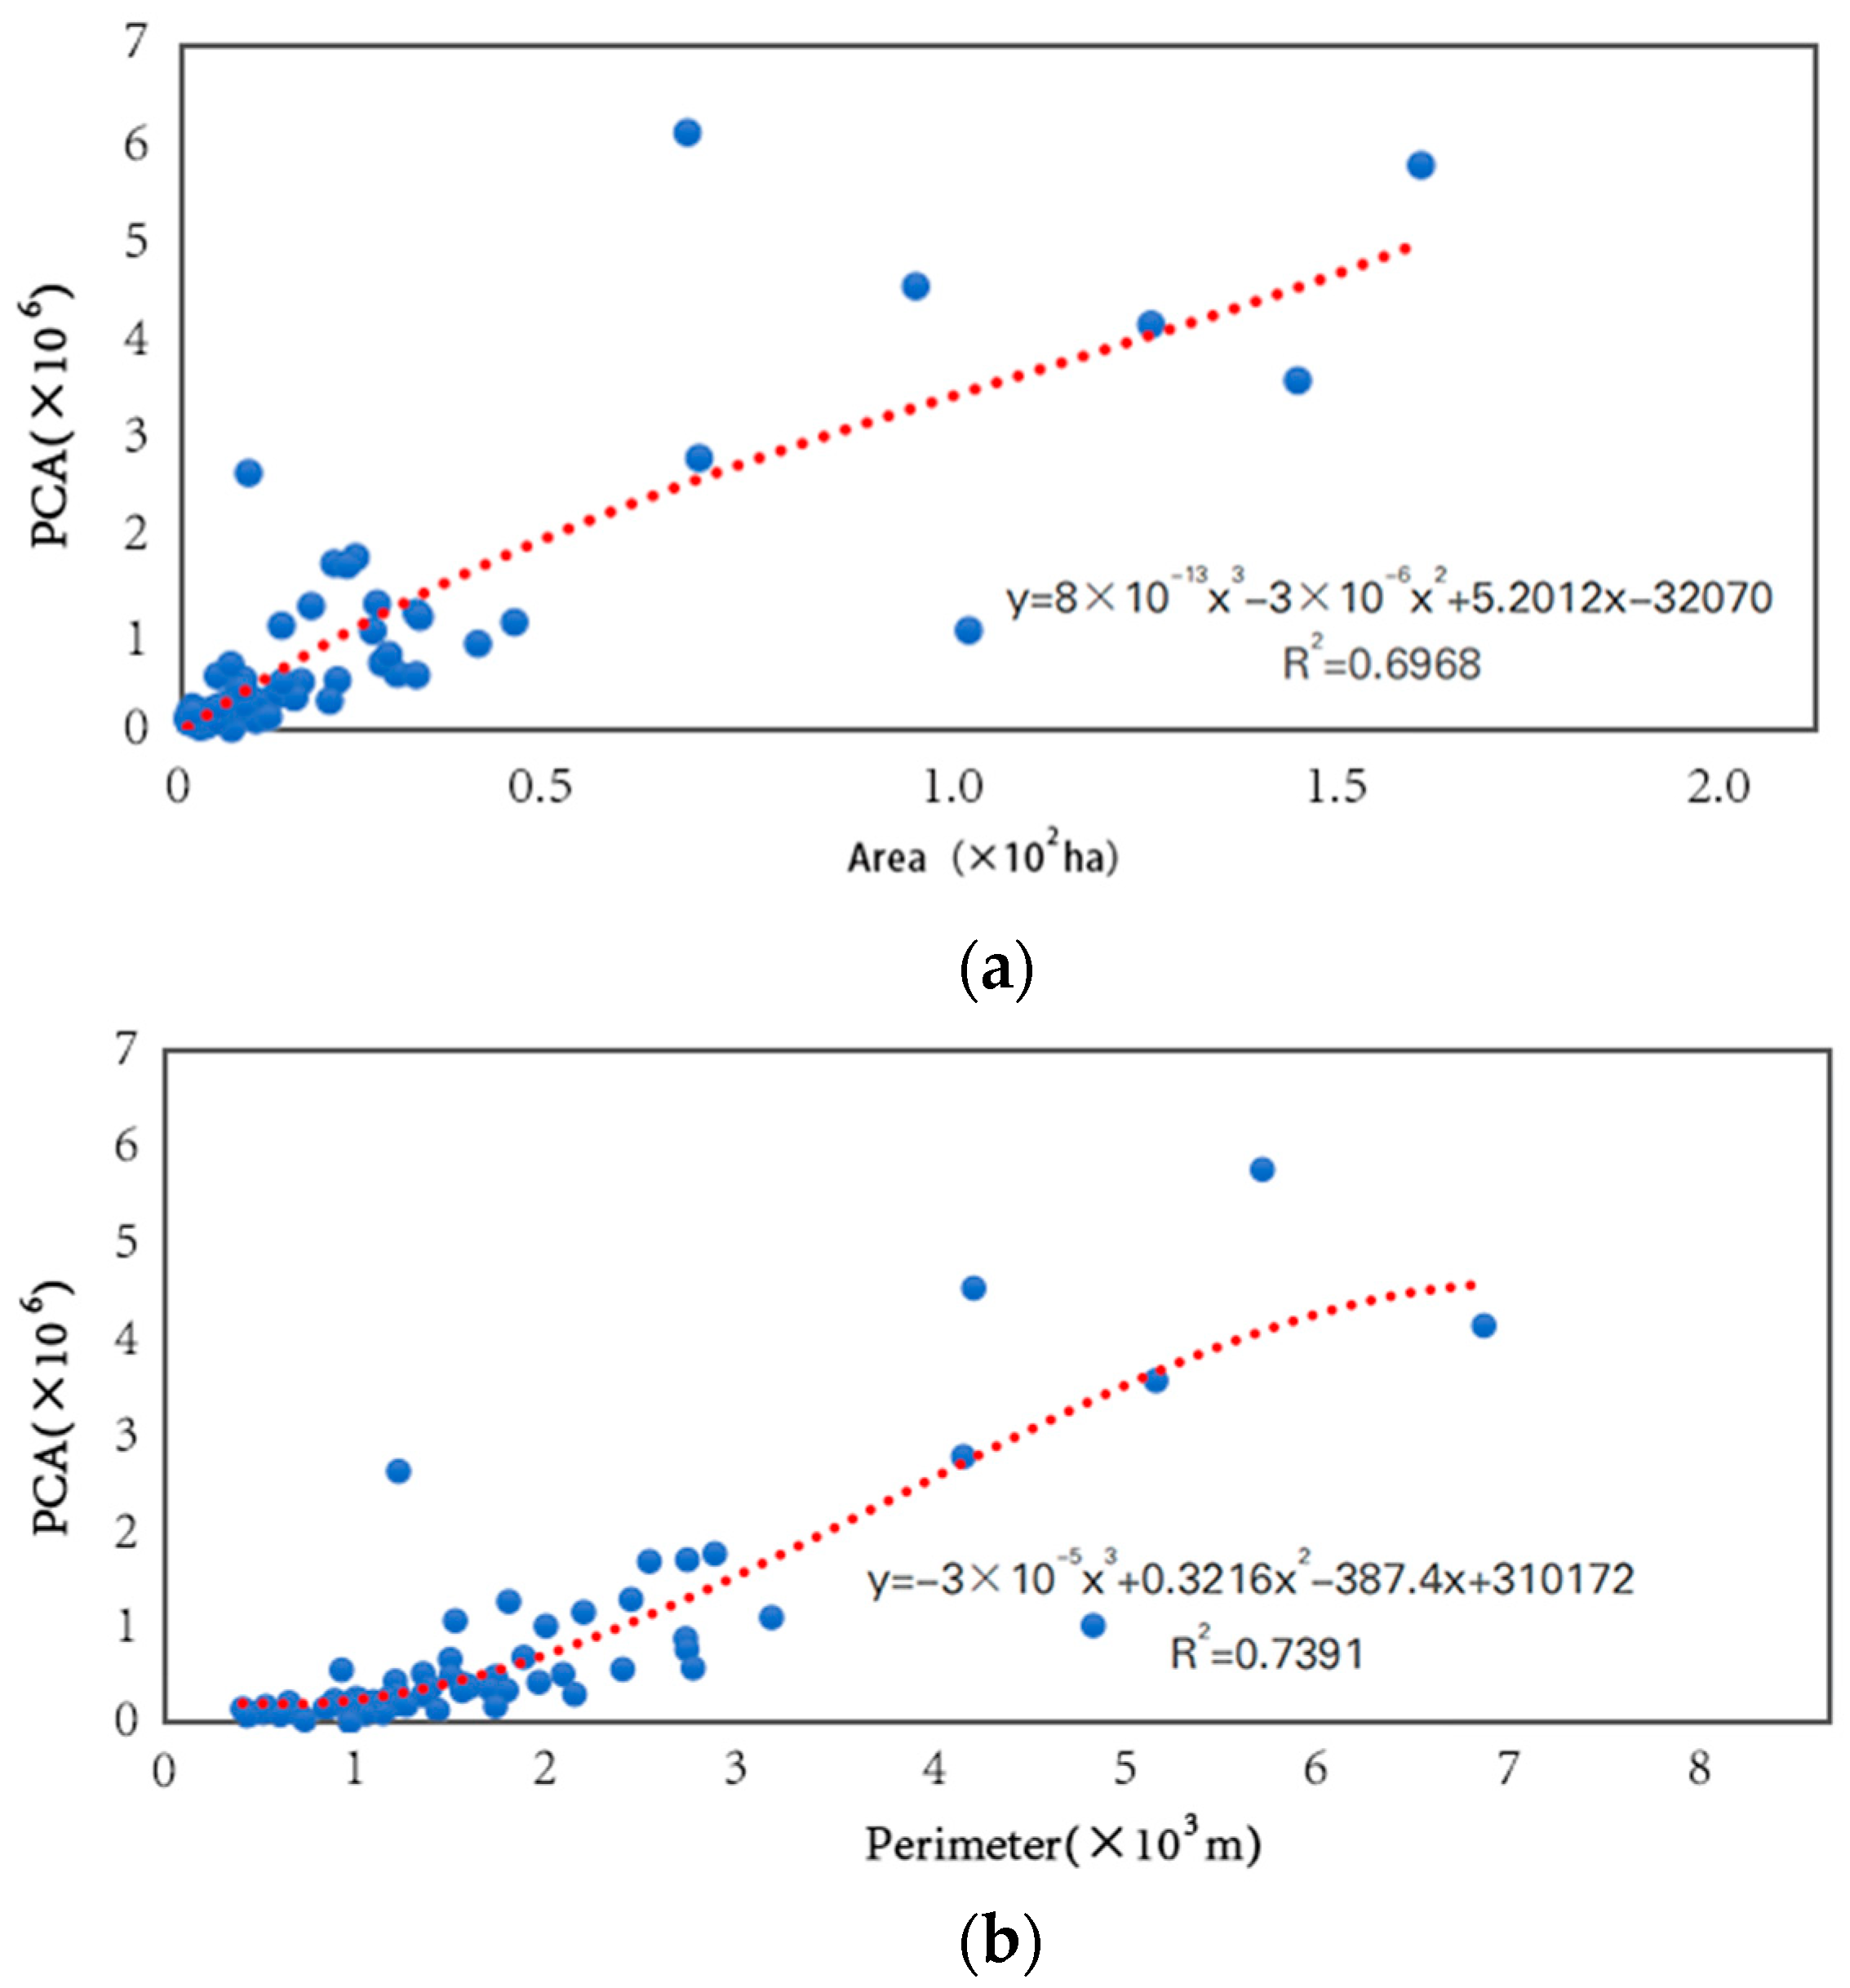
3.4.1. Correlation Analysis of Urban Park Area, Perimeter, and Cooling Area
A regression analysis of the urban park area, perimeter, and cooling area was conducted. The R2 coefficient of determination for the three fits of park area and the cooling area was 0.6968, and the correlation between them was strong (Figure 8a). The larger the park area, the larger the cooling area. When the park area was less than 30 ha, the cooling area increased by 5 ha for every 1 ha of park area, on average; when the park area was larger than 30 ha, the cooling area increased by approximately 2.5 ha for every 1 ha of park area, on average.
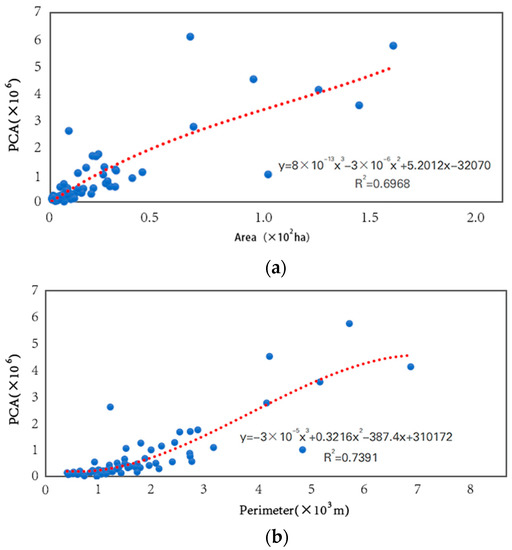
Figure 8.
(a) Fitted curve of the urban park area and park cooling area; (b) fitted curve of the urban park area and perimeter.
The R2 coefficient of determination for the three fits of perimeter length and the cooling area was 0.7391, and the correlation between the two was strong (Figure 8b). Specifically, when the perimeter of the urban park was less than 3000 m, the cooling area of the urban park increased slowly; when the perimeter was greater than 3000 m, the cooling area of the urban park increased faster.
3.4.2. Correlation Analysis of Park Area, Perimeter, and Cooling Distance
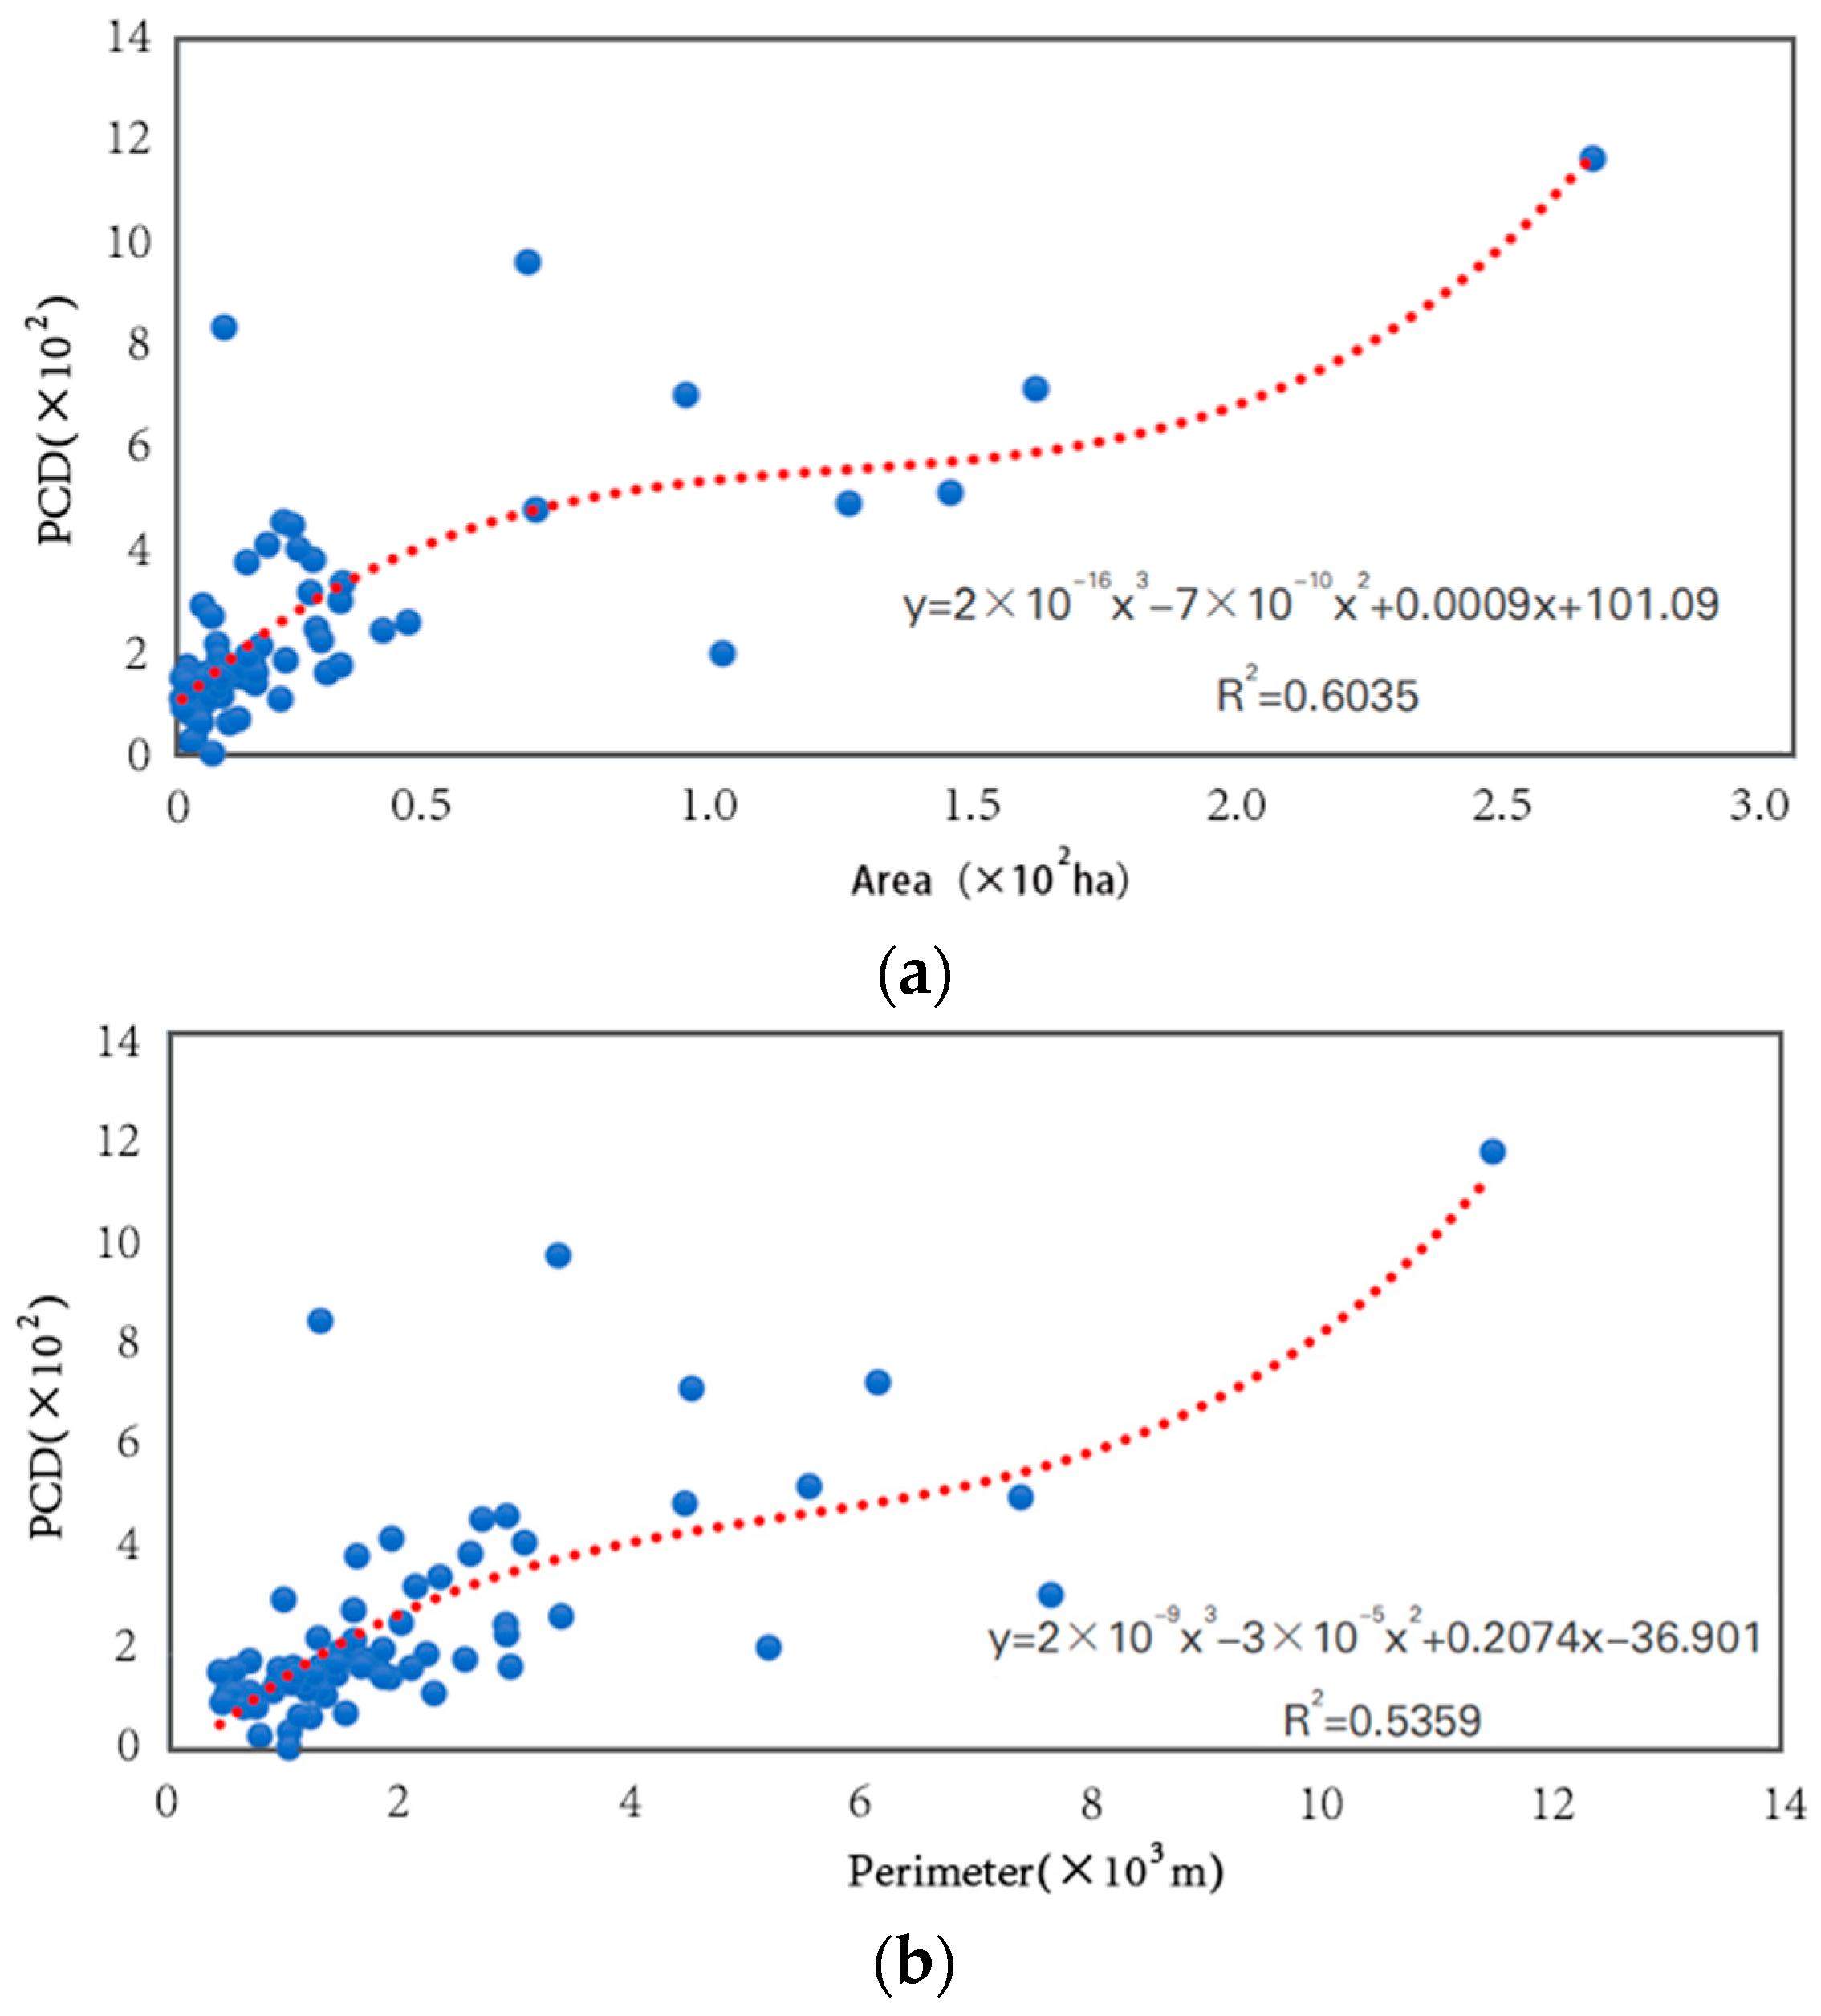
The R2 coefficient of determination for the three fits of park area and cooling distance was 0.6035, and the correlation between the two was strong (Figure 9a). Generally, the larger the urban park area, the larger the cooling range. When the urban park area was less than 70 ha, the cooling range expanded by approximately 60 m for each additional 1 ha of park area, on average; when the urban park area exceeded 70 ha, the cooling range curve of the park tended to flatten out and the cooling effect decreased. Therefore, when planning and designing urban parks in Chengdu, the optimal value of park area should be maintained within 70 ha if the park is to maximize the cooling effect on the surrounding environment.
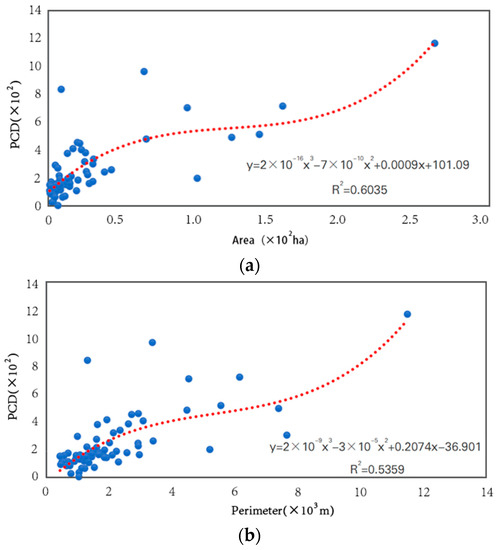
Figure 9.
(a) Fitted curve of park cooling distance and park area; (b) fitted curve of park cooling distance and perimeter.
The three-time fit between the urban park perimeter and the cooling distance was also high (Figure 9b). Specifically, when the park perimeter was less than 4000 m, the cooling distance changed significantly, and the cooling distance increased by 0.1 m for every 1 m increase in the perimeter, on average. When the perimeter of the park was greater than 4000 m, the cooling range also increased gently. However, when the perimeter exceeded 9000 m, the trend increased gradually.
3.4.3. Correlation Analysis of Shape Index and Cooling Efficiency
The analysis shows that the quadratic fit between the urban park shape index and cooling efficiency was the highest, with a significant correlation of an R2 determination coefficient of 0.4605 (Figure 10). Specifically, when the shape index was less than 2.8, the cooling efficiency showed a positive correlation trend with the increase in the shape index, and when the shape index was greater than 2.8, the cooling efficiency began to show a negative correlation trend. From the fitting trend, the curve had a certain threshold value. Therefore, from the perspective of maximizing the cooling effect of the park on the surrounding environment, the optimal value of the park shape index should be maintained at approximately 2.8.
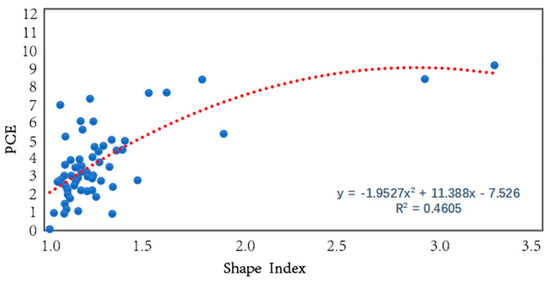
Figure 10.
Shape index and cooling efficiency fitting curve.
4. Discussion
4.1. Optimal Urban Park Cooling Effect Morphology
Our study analyzed the cooling effect and its influencing factors in 67 urban parks in Chengdu. Urban parks of different morphology types differed in different cooling indices, which is consistent with the results of existing studies [53,58,66,67]. The results in Section 3.3 show that the cooling efficiency of round parks was better than that of strip parks, which may be due to the generally larger shape index of round parks. A high shape index implies that urban parks have complex boundaries and more contact surfaces with surrounding heat sources, which are conducive to heat transfer and heat exchange [6]. Of course, this can also be caused by the area of strip parks being larger than that of round parks, causing the cool air to be spread over a larger area, thus reducing the cooling efficiency.
Larger area strip parks were mainly characterized by cooling areas and cooling distances. In general, as the park area continued to increase, the lower temperatures generated by the park were able to penetrate farther into the surrounding environment [68]. However, some strip parks were riverfront green areas or adjacent to lake water, which often resulted in smaller differences in the LST between urban parks and surrounding water bodies to show significant cooling effects [6]. However, considering urban parks and surrounding water bodies as overall patches, its presence has a stronger cooling effect. Therefore, coupling green and blue spaces for correlation is an important way to mitigate the heat island effect and enhance the cooling effect of urban parks [36,69,70].
In addition, there were some special parks in the classification results of Bundle 3. For the Chengdu Happy Valley in Bundle 3, its area, perimeter, and vegetation-to-water ratio were small, but PCA and PCD reached the maximum in Bundle 3, probably due to the low density of surrounding buildings, which is conducive to the expansion of urban park cooling flow [71]. In addition, its status as the only round park in Bundle 3 reflects, to some extent, the superior cooling effect of round parks over strip parks.
Most of the round parks with a strip tendency had relatively large vegetation areas and showed a strong PCI capacity. This is consistent with the results of Peng’s study [53]. The increase in the green vegetation coverage area will significantly improve the heat exchange capacity between urban parks and the surrounding environment; the better the vegetation growth in urban parks, the stronger the cooling process and the higher the PCI.
4.2. Correlation and Threshold of Cooling Effect in Urban Parks
Through the correlation analysis of urban park cooling effect indicators and morphological characteristics indicators, we further found that the two usually showed a nonlinear relationship, practically verifying previous studies on park cooling [58,64]. The area and extent of urban park cooling in this study were significantly and positively correlated with the area and perimeter of urban parks, and these findings are generally consistent with previous studies [41,72].
When the area and perimeter of the urban park increase to a threshold value, the influence of the surrounding environment on the park will become very weak. At this time, the cooling index of the urban park will reach the maximum value and remain stable [68]. Smaller parks have significant edge effects, unstable ecological environments, are more sensitive to changes in the surroundings, and fluctuate greatly in the cooling effect. In contrast, large parks provide a more stable ecological environment [15].
In this study, the cooling area curve tended to flatten out when the urban park area exceeded 30 ha or the perimeter was greater than 3000 m. In addition, the threshold values in different studies may vary depending on the geographic location, climate, and park samples of the study area [36,54,73]. Peng obtained a threshold perimeter length of 13,283 m and a threshold area of 429 ha [53]. In the correlation analysis between park area, perimeter, and cooling distance, there was also a nonlinear relationship between the two stages. The area and perimeter of urban parks in the second stage far exceeded those in the first stage, such as the Chengdu Research Base for Giant Panda Breeding.
In addition, the larger the shape index of the urban park, the more complex the boundary morphology, which can form a stable communication frequency with the surrounding environment. However, when the shape index was larger than 2.8, the cooling efficiency started to show a negative correlation trend. At this time, the urban park was too fragmented and was split into small patches, which cannot exert a good cooling effect. This result emphasizes the significance of large parks for building a stable regional urban ecological coupling system [73].
4.3. Limitations and Future Research Directions
There are some limitations in this study. On the one hand, although the disturbance areas around the park, such as large water bodies and green areas [65], were excluded when establishing the cooling buffer zone of the urban park, the cooling effect of the park may be related to the type of land use of the site [74] and the three-dimensional space of the surrounding buildings [75]. This has an impact on the evaluation of the cooling effect of parks and should be taken into consideration in future studies.
On the other hand, the difference between LST and air temperature due to the presence of factors such as vegetation and aerodynamic roughness leads to an overestimation of the urban heat island effect. Moreover, at the local scale, conditions such as surface evapotranspiration and topographic elevation contribute differently to this discrepancy [76]. Future urban thermal environment studies could introduce crowdsourced weather station data to further improve the practical value of urban park cooling studies.
5. Conclusions
This paper explored a method of classifying the morphologies of urban parks in the central city of Chengdu and initially investigated the cooling effect of different morphologies of urban parks in terms of their impact on the surrounding thermal environment. The main research findings are as follows:
- The cooling effects of urban parks with different morphologies on the surrounding thermal environment were different, with round parks > round parks with a strip tendency > strip parks. Among them, the round park with a complex morphological boundary had good economic and ecological benefits, and its shape index was 71.5% higher than the minimum value.
- The area of urban parks significantly affected the cooling distance and cooling area of parks, and the correlation coefficients were 0.898 and 0.964, respectively. When the area of urban parks was larger than 30 ha, the increase in the cooling effect decreased by 50.0%. For the cooling distance, the threshold value of the urban park area was 70 ha.
- The perimeter of the urban park was significantly and positively correlated with the cooling distance and cooling area of the park. When the perimeter length was greater than 3000 m, the park cooling area increased faster. When the park perimeter exceeded 4000 m, the cooling distance no longer increased significantly, and when it reached 9000 m, the increase rose steeply again.
- The shape index of urban parks was significantly and positively correlated with the cooling efficiency of parks. When the shape index was 2.8, the cooling efficiency reached the inflection point value. However, the length–width ratio of urban parks did not have a large influence on the cooling effect.
When planning and constructing urban parks, we should weigh the economic benefits and create more parks in the morphology of round and fewer parks in the morphology of strips and complicate the shape of park boundaries and enrich the internal space structure of parks so as to improve the heat exchange between parks and the surrounding environment. In addition, the construction of green space ecological corridors in Chengdu should be accelerated. Relying on the foundation of the existing road and water networks, ecological corridors communicating various scattered small-area parks are established to improve the connectivity and connectedness among the scattered small parks.
In summary, this paper provides a perspective for the study of the cooling effect of urban parks in terms of park morphology. The research results and discussion can help urban planners and stakeholders in their decision making, as well as contribute to the development of park city construction in Chengdu.
Author Contributions
Conceptualization, X.F.; methodology, X.F., T.Y. and C.X.; formal analysis, J.Y., T.Y., T.W. and H.C.; data curation, C.X.; writing—original draft preparation, X.F., J.Y., C.X., T.Y., T.W. and H.C.; writing—review and editing, L.Z., X.Z. and X.F.; visualization, J.Y., C.X., X.F., T.W. and H.C.; supervision, L.Z. and X.Z.; project administration, X.F.; funding acquisition, L.Z. All authors have read and agreed to the published version of the manuscript.
Funding
This study was supported by the Sichuan Provincial College Student Innovation Training Project (grant number: S202210626082).
Data Availability Statement
Data are available with the corresponding author and can be shared upon reasonable request.
Conflicts of Interest
The authors declare no conflict of interest.
References
- Peng, J.; Ma, J.; Liu, Q.Y.; Liu, Y.X.; Hu, Y.N.; Li, Y.R.; Yue, Y.M. Spatial-Temporal Change of Land Surface Temperature across 285 Cities in China: An Urban-Rural Contrast Perspective. Sci. Total Environ. 2018, 635, 487–497. [Google Scholar] [CrossRef]
- Arshad, S.; Ahmad, S.R.; Abbas, S.; Asharf, A.; Siddiqui, N.A.; ul Islam, Z. Quantifying the Contribution of Diminishing Green Spaces and Urban Sprawl to Urban Heat Island Effect in a Rapidly Urbanizing Metropolitan City of Pakistan. Land Use Policy 2022, 113, 105874. [Google Scholar] [CrossRef]
- Zhang, L.; Wei, D.; Hou, Y.; Du, J.; Liu, Z.; Zhang, G.; Shi, L. Outdoor Thermal Comfort of Urban Park—A Case Study. Sustainability 2020, 12, 1961. [Google Scholar] [CrossRef]
- Galodha, A.; Gupta, S.K. LAND surface temperature as an indicator of urban heat island effect: A google earth engine based Web-App. In Proceedings of the the International Archives of the Photogrammetry, Remote Sensing and Spatial Information Sciences, Virtual, 29 March–2 April 2021; Volume XLIV-M-3-2021, pp. 57–62. [Google Scholar] [CrossRef]
- Kolokotroni, M.; Ren, X.; Davies, M.; Mavrogianni, A. London’s Urban Heat Island: Impact on Current and Future Energy Consumption in Office Buildings. Energy Build. 2012, 47, 302–311. [Google Scholar] [CrossRef]
- Li, H.; Wang, G.; Tian, G.; Jombach, S. Mapping and Analyzing the Park Cooling Effect on Urban Heat Island in an Expanding City: A Case Study in Zhengzhou City, China. Land 2020, 9, 57. [Google Scholar] [CrossRef]
- de Abreu-Harbicha, L.V.; Labakia, L.C.; Matzarakis, A. Effect of Tree Planting Design and Tree Species on Human Thermal Comfort in the Tropics. Landsc. Urban Plan. 2015, 138, 99–109. [Google Scholar] [CrossRef]
- Norton, B.A.; Coutts, A.M.; Livesley, S.J.; Harris, R.J.; Hunter, A.M.; Williams, N.S.G. Planning for Cooler Cities: A Framework to Prioritise Green Infrastructure to Mitigate High Temperatures in Urban Landscapes. Landsc. Urban Plan. 2015, 134, 127–138. [Google Scholar] [CrossRef]
- Stratópoulos, L.M.F.; Duthweiler, S.; Häberle, K.-H.; Pauleit, S. Effect of Native Habitat on the Cooling Ability of Six Nursery-Grown Tree Species and Cultivars for Future Roadside Plantings. Urban For. Urban Green. 2018, 30, 37–45. [Google Scholar] [CrossRef]
- Mazzeo, D.; Matera, N.; Peri, G.; Scaccianoce, G. Forecasting Green Roofs’ Potential in Improving Building Thermal Performance and Mitigating Urban Heat Island in the Mediterranean Area: An Artificial Intelligence-Based Approach. SSRN Electron. J. 2022, 22, 119879. [Google Scholar] [CrossRef]
- Moss, J.L.; Doick, K.J.; Smith, S.; Shahrestani, M. Influence of Evaporative Cooling by Urban Forests on Cooling Demand in Cities. Urban For. Urban Green. 2019, 37, 65–73. [Google Scholar] [CrossRef]
- Narh, S.N.; Takyi, S.A.; Asibey, M.O.; Amponsah, O. Garden City without Parks: An Assessment of the Availability and Conditions of Parks in Kumasi. Urban For. Urban Green. 2020, 55, 126819. [Google Scholar] [CrossRef]
- Bernard, J.; Rodler, A.; Morille, B.; Zhang, X. How to Design a Park and Its Surrounding Urban Morphology to Optimize the Spreading of Cool Air? Climate 2018, 6, 10. [Google Scholar] [CrossRef]
- Zoulia, I.; Santamouris, M.; Dimoudi, A. Monitoring the Effect of Urban Green Areas on the Heat Island in Athens. Environ. Monit. Assess. 2009, 156, 275–292. [Google Scholar] [CrossRef]
- Li, Y.L.; Fan, S.X.; Li, K.; Zhang, Y.; Kong, L.X.; Xie, Y.F.; Dong, L. Large Urban Parks Summertime Cool and Wet Island Intensity and Its Influencing Factors in Beijing, China. Urban For. Urban Green. 2021, 65, 127375. [Google Scholar] [CrossRef]
- Cohen, P.; Potchter, O.; Matzarakis, A. Daily and Seasonal Climatic Conditions of Green Urban Open Spaces in the Mediterranean Climate and Their Impact on Human Comfort. Build. Environ. 2012, 51, 285–295. [Google Scholar] [CrossRef]
- Spronken-Smith, R.; Oke, T.R. The Thermal Regime of Urban Parks in Two Cities with Different Summer Climates. Int. J. Remote Sens. 1998, 19, 2085–2104. [Google Scholar] [CrossRef]
- Algretawee, H. The Effect of Graduated Urban Park Size on Park Cooling Island and Distance Relative to Land Surface Temperature (LST). Urban Clim. 2022, 45, 101255. [Google Scholar] [CrossRef]
- Wu, J. Landscape Ecology—Pattern, Process, Scale and Hierarchy, 2nd ed.; Higher Education Press: Beijing, China, 2007; ISBN 9787040208795. [Google Scholar]
- Kong, F.; Yin, H.; James, P.; Hutyra, L.R.; He, H.S. Effects of Spatial Pattern of Greenspace on Urban Cooling in a Large Metropolitan Area of Eastern China. Landsc. Urban Plan. 2014, 128, 35–47. [Google Scholar] [CrossRef]
- Guo, L.; Liu, R.; Men, C.; Wang, Q.; Miao, Y.; Zhang, Y. Quantifying and Simulating Landscape Composition and Pattern Impacts on Land Surface Temperature: A Decadal Study of the Rapidly Urbanizing City of Beijing, China. Sci. Total Environ. 2019, 654, 430–440. [Google Scholar] [CrossRef] [PubMed]
- Oke, T.R.; Zeuner, G.; Jauregui, E. The Surface Energy Balance in Mexico City. Atmos. Environ. Part B Urban Atmos. 1992, 26, 433–444. [Google Scholar] [CrossRef]
- Liu, D.; Li, Y.; Kong, F. Spatial Distribution of Land Surface Temperature in Central City Proper and the Cooling of Objects Effect: A Case Study of Nanjing. Remote Sens. Nat. Resour. 2013, 25, 117–122. [Google Scholar] [CrossRef]
- Xiao, J. Cooling Effect of City Parks—A Case of Shijiazhuang. J. Arid Landsc. Resour. Environ. 2015, 29, 75–79. [Google Scholar] [CrossRef]
- Han, W. Shape, 1st ed.; Southeast University Press: Nanjing, China, 2006; ISBN 9787564102715. [Google Scholar]
- Yin, J.; Wu, X.; Shen, M.; Zhang, X.; Zhu, C.; Xiang, H.; Shi, C.; Guo, Z.; Li, C. Impact of Urban Greenspace Spatial Pattern on Land Surface Temperature: A Case Study in Beijing Metropolitan Area, China. Landsc. Ecol. 2019, 34, 2949–2961. [Google Scholar] [CrossRef]
- Zhang, X.; Zhong, T.; Feng, X.; Wang, K. Estimation of the Relationship between Vegetation Patches and Urban Land Surface Temperature with Remote Sensing. Int. J. Remote Sens. 2009, 30, 2105–2118. [Google Scholar] [CrossRef]
- Nastran, M.; Kobal, M.; Eler, K. Urban Heat Islands in Relation to Green Land Use in European Cities. Urban For. Urban Green. 2019, 37, 33–41. [Google Scholar] [CrossRef]
- Zhou, W.; Huang, G.; Cadenasso, M.L. Does Spatial Configuration Matter? Understanding the Effects of Land Cover Pattern on Land Surface Temperature in Urban Landscapes. Landsc. Urban Plan. 2011, 102, 54–63. [Google Scholar] [CrossRef]
- Han, G.; Cai, Z. Impact of Mountain Urban Park Form on Cooling Effect. J. Hum. Settl. West China 2016, 31, 61–68. [Google Scholar] [CrossRef]
- Batty, M. Exploring Isovist Fields: Space and Shape in Architectural and Urban Morphology. Environ. Plan. B Plan. Des. 2001, 28, 123–150. [Google Scholar] [CrossRef]
- Pu, X. Quantitative Research on the Integrated Form of the Two-Dimension Plan to Traditional Rural Settlement. Ph.D. Thesis, Zhejiang University, Hangzhou, China, 2012. [Google Scholar]
- Hai, Y.; Fan, W.; Li, D. Influence of a Large Urban Park on the Local Urban Thermal Environment. Sci. Total Environ. 2018, 622, 882–891. [Google Scholar] [CrossRef]
- Wu, F.; Li, S.; Liu, J. Research on the Relationship between Urban Green Spaces of Different Areas and the Temperature and Humidity Benefit. Chin. Landsc. Arch. 2007, 23, 71–74. [Google Scholar]
- Du, H.; Zhou, F.; Cai, W.; Cai, Y.; Xu, Y. Thermal and Humidity Effect of Urban Green Spaces with Different Shapes: A Case Study of Shanghai, China. Int. J. Environ. Res. Public Health 2021, 18, 5941. [Google Scholar] [CrossRef] [PubMed]
- Yu, Z.; Guo, X.; Jørgensen, G.; Vejre, H. How Can Urban Green Spaces Be Planned for Climate Adaptation in Subtropical Cities? Ecol. Indic. 2017, 82, 152–162. [Google Scholar] [CrossRef]
- McGarigal, K.; Marks, B.J. FRAGSTATS: Spatial Pattern Analysis Program for Quantifying Landscape Structure; US Department of Agriculture, Forest Service, Pacific Northwest Research Station: Corvallis, OR, USA, 1995; Volume 351.
- Stewart, I.D. A Systematic Review and Scientific Critique of Methodology in Modern Urban Heat Island Literature. Int. J. Climatol. 2011, 31, 200–217. [Google Scholar] [CrossRef]
- Mohamed, A.A.; Odindi, J.; Mutanga, O. Land Surface Temperature and Emissivity Estimation for Urban Heat Island Assessment Using Medium- and Low-Resolution Space-Borne Sensors: A Review. Geocarto Int. 2017, 32, 455–470. [Google Scholar] [CrossRef]
- Yu, Z.; Guo, X.; Zeng, Y.; Koga, M.; Vejre, H. Variations in Land Surface Temperature and Cooling Efficiency of Green Space in Rapid Urbanization: The Case of Fuzhou City, China. Urban For. Urban Green. 2018, 29, 113–121. [Google Scholar] [CrossRef]
- Feyisa, G.L.; Dons, K.; Meilby, H. Efficiency of Parks in Mitigating Urban Heat Island Effect: An Example from Addis Ababa. Landsc. Urban Plan. 2014, 123, 87–95. [Google Scholar] [CrossRef]
- Pramanik, S.; Punia, M. Assessment of Green Space Cooling Effects in Dense Urban Landscape: A Case Study of Delhi, India. Model. Earth Syst. Environ. 2019, 5, 867–884. [Google Scholar] [CrossRef]
- Blachowski, J.; Hajnrych, M. Assessing the Cooling Effect of Four Urban Parks of Different Sizes in a Temperate Continental Climate Zone: Wroclaw (Poland). Forests 2021, 12, 1136. [Google Scholar] [CrossRef]
- Kawashima, S.; Ishida, T.; Minomura, M.; Miwa, T. Relations between Surface Temperature and Air Temperature on a Local Scale during Winter Nights. J. Appl. Meteorol. 2000, 39, 1570–1579. [Google Scholar] [CrossRef]
- Doick, K.J.; Peace, A.; Hutchings, T.R. The Role of One Large Greenspace in Mitigating London’s Nocturnal Urban Heat Island. Sci. Total Environ. 2014, 493, 662–671. [Google Scholar] [CrossRef]
- Hartz, D.A.; Prashad, L.; Hedquist, B.C.; Golden, J.S.; Brazel, A. Linking Satellite Images and Hand-Held Infrared Thermography to Observed Neighborhood Climate Conditions. Remote Sens. Environ. 2006, 104, 190–200. [Google Scholar] [CrossRef]
- Cueto, O.R.G.; Ostos, E.J.; Toudert, D.; Martínez, A.T. Detection of the Urban Heat Island in Mexicali, B.C., México and Its Relationship with Land Use. Atmosfera 2007, 20, 111–131. [Google Scholar]
- Lindberg, F. Modelling the Urban Climate Using a Local Governmental Geo-Database. Meteorol. Appl. 2007, 14, 263–273. [Google Scholar] [CrossRef]
- Schwarz, N.; Schlink, U.; Franck, U.; Großmann, K. Relationship of Land Surface and Air Temperatures and Its Implications for Quantifying Urban Heat Island Indicators—An Application for the City of Leipzig (Germany). Ecol. Indic. 2012, 18, 693–704. [Google Scholar] [CrossRef]
- Chow, W.T.L.; Roth, M. Temporal Dynamics of the Urban Heat Island of Singapore. Int. J. Climatol. 2006, 26, 2243–2260. [Google Scholar] [CrossRef]
- Chang, C.-R.; Li, M.-H.; Chang, S.-D. A Preliminary Study on the Local Cool-Island Intensity of Taipei City Parks. Landsc. Urban Plan. 2007, 80, 386–395. [Google Scholar] [CrossRef]
- Cheng, X.; Wei, B.; Chen, G.; Li, J.; Song, C. Influence of Park Size and Its Surrounding Urban Landscape Patterns on the Park Cooling Effect. J. Urban Plan. Dev. 2015, 141, A4014002. [Google Scholar] [CrossRef]
- Peng, J.; Dan, Y.; Qiao, R.; Liu, Y.; Dong, J.; Wu, J. How to Quantify the Cooling Effect of Urban Parks? Linking Maximum and Accumulation Perspectives. Remote Sens. Environ. 2021, 252, 112135. [Google Scholar] [CrossRef]
- Chen, X.; Su, Y.; Li, D.; Huang, G.; Chen, W.; Chen, S. Study on the Cooling Effects of Urban Parks on Surrounding Environments Using Landsat TM Data: A Case Study in Guangzhou, Southern China. Int. J. Remote Sens. 2012, 33, 5889–5914. [Google Scholar] [CrossRef]
- Fan, H.; Yu, Z.; Yang, G.; Liu, T.Y.; Liu, T.Y.; Hung, C.H.; Vejre, H. How to Cool Hot-Humid (Asian) Cities with Urban Trees? An Optimal Landscape Size Perspective. Agric. For. Meteorol. 2019, 265, 338–348. [Google Scholar] [CrossRef]
- Yu, Z.; Fryd, O.; Sun, R.; Jørgensen, G.; Yang, G.; Özdil, N.C.; Vejre, H. Where and How to Cool? An Idealized Urban Thermal Security Pattern Model. Landsc. Ecol. 2021, 36, 2165–2174. [Google Scholar] [CrossRef]
- Yu, Z.W.; Xu, S.B.; Zhang, Y.H.; Jorgensen, G.; Vejre, H. Strong Contributions of Local Background Climate to the Cooling Effect of Urban Green Vegetation. Sci. Rep. 2018, 8, 6798. [Google Scholar] [CrossRef]
- Vaz Monteiro, M.; Doick, K.J.; Handley, P.; Peace, A. The Impact of Greenspace Size on the Extent of Local Nocturnal Air Temperature Cooling in London. Urban For. Urban Green. 2016, 16, 160–169. [Google Scholar] [CrossRef]
- Gunawardena, K.R.; Wells, M.J.; Kershaw, T. Utilising Green and Bluespace to Mitigate Urban Heat Island Intensity. Sci. Total Environ. 2017, 584, 1040–1055. [Google Scholar] [CrossRef]
- Yu, X.; Guo, X.; Wu, Z. Land Surface Temperature Retrieval from Landsat 8 TIRS-Comparison between Radiative Transfer Equation-Based Method, Split Window Algorithm and Single Channel Method. Remote Sens. 2014, 6, 9829–9852. [Google Scholar] [CrossRef]
- Chandrasekhar, S. Radiative Transfer; Courier Corporation: Garden City, NY, USA, 2013; ISBN 9780486605906. [Google Scholar]
- Jiménez-Muñoz, J.C.; Sobrino, J.A.; Skoković, D.; Mattar, C.; Cristóbal, J. Land Surface Temperature Retrieval Methods From Landsat-8 Thermal Infrared Sensor Data. IEEE Geosci. Remote Sens. Lett. 2014, 11, 1840–1843. [Google Scholar] [CrossRef]
- Hamada, S.; Ohta, T. Urban Forestry & Urban Greening Seasonal Variations in the Cooling Effect of Urban Green Areas on Surrounding Urban Areas. Urban For. Urban Green. 2010, 9, 15–24. [Google Scholar] [CrossRef]
- Lin, W.; Yu, T.; Chang, X.; Wu, W.; Zhang, Y. Calculating Cooling Extents of Green Parks Using Remote Sensing: Method and Test. Landsc. Urban Plan. 2015, 134, 66–75. [Google Scholar] [CrossRef]
- Su, Y.; Huang, G.; Chen, X.; Chen, S. The Cooling Effect of Guangzhou City Parks to Surrounding Environments. Acta Ecol. Sin. 2010, 30, 4905–4918. [Google Scholar]
- Liao, W.; Cai, Z.; Feng, Y.; Gan, D.; Li, X. A Simple and Easy Method to Quantify the Cool Island Intensity of Urban Greenspace. Urban For. Urban Green. 2021, 62, 127173. [Google Scholar] [CrossRef]
- Yao, X.; Yu, K.; Zeng, X.; Lin, Y.; Ye, B.; Shen, X.; Liu, J. How Can Urban Parks Be Planned to Mitigate Urban Heat Island Effect in “Furnace Cities”? An Accumulation Perspective. J. Clean. Prod. 2022, 330, 129852. [Google Scholar] [CrossRef]
- Gao, Z.; Zaitchik, B.F.; Hou, Y.; Chen, W. Toward Park Design Optimization to Mitigate the Urban Heat Island: Assessment of the Cooling Effect in Five U.S. Cities. Sustain. Cities Soc. 2022, 81, 103870. [Google Scholar] [CrossRef]
- Asgarian, A.; Amiri, B.J.; Sakieh, Y. Assessing the Effect of Green Cover Spatial Patterns on Urban Land Surface Temperature Using Landscape Metrics Approach. Urban Ecosyst. 2015, 18, 209–222. [Google Scholar] [CrossRef]
- Raudsepp-Hearne, C.; Peterson, G.D.; Bennett, E.M. Ecosystem Service Bundles for Analyzing Tradeoffs in Diverse Landscapes. Proc. Natl. Acad. Sci. USA 2010, 107, 5242–5247. [Google Scholar] [CrossRef]
- Hamada, S.; Tanaka, T.; Ohta, T. Impacts of Land Use and Topography on the Cooling Effect of Green Areas on Surrounding Urban Areas. Urban For. Urban Green. 2013, 12, 426–434. [Google Scholar] [CrossRef]
- Yang, C.; He, X.; Yu, L.; Yang, J.; Yan, F.; Bu, K.; Chang, L.; Zhang, S. The Cooling Effect of Urban Parks and Its Monthly Variations in a Snow Climate City. Remote Sens. 2017, 9, 1066. [Google Scholar] [CrossRef]
- Yang, J.; Guo, R.; Li, D.; Wang, X.; Li, F. Interval-Thresholding Effect of Cooling and Recreational Services of Urban Parks in Metropolises. Sustain. Cities Soc. 2022, 79, 103684. [Google Scholar] [CrossRef]
- Lo, C.P.; Quattrochi, D.A.; Luvall, J.C. Application of High-Resolution Thermal Infrared Remote Sensing and GIS to Assess the Urban Heat Island Effect. Int. J. Remote Sens. 1997, 18, 287–304. [Google Scholar] [CrossRef]
- Chen, Y.; Shan, B.; Yu, X.; Zhang, Q.; Ren, Q. Urban Climate Comprehensive Effect of the Three-Dimensional Spatial Distribution Pattern of Buildings on the Urban Thermal Environment. Urban Clim. 2022, 46, 101324. [Google Scholar] [CrossRef]
- Venter, Z.S.; Chakraborty, T.; Lee, X. Crowdsourced Air Temperatures Contrast Satellite Measures of the Urban Heat Island and Its Mechanisms. Sci. Adv. 2021, 7, eabb9569. [Google Scholar] [CrossRef]


Disclaimer/Publisher’s Note: The statements, opinions and data contained in all publications are solely those of the individual author(s) and contributor(s) and not of MDPI and/or the editor(s). MDPI and/or the editor(s) disclaim responsibility for any injury to people or property resulting from any ideas, methods, instructions or products referred to in the content. |
© 2023 by the authors. Licensee MDPI, Basel, Switzerland. This article is an open access article distributed under the terms and conditions of the Creative Commons Attribution (CC BY) license (https://creativecommons.org/licenses/by/4.0/).