Abstract
The Yellow River Basin assumes an important ecological and economic function in China. The study of carbon emissions from land use in the nine provinces (regions) of the pathway is important to achieve carbon reduction. Based on the dynamic data of land use, energy, and economic changes in nine provinces (regions) for the past 30 years from 1990 to 2018, this study analyzed the spatial and temporal evolution characteristics of land-use carbon emissions by using the carbon emission coefficient method in the IPCC inventory method and evaluating the low-carbon development model of the nine provinces (regions) by land-use carbon emission intensity. Finally, the LMDI model was used to analyze the factors influencing land-use carbon emissions. The results showed that: (1) in the past 30 years, the net carbon emissions have shown a continuously increasing trend, and the difference in the spatial distribution of carbon emissions in different periods was obvious. The carbon sink effect was not significant enough to offset the carbon emissions generated. (2) The continuously decreasing carbon emission intensity values per unit of GDP indicate that the coordination between land-use and economic development was getting better. (3) The factors of population size, economic size, and land-use structure accelerated land-use carbon emissions, whereas land-use efficiency limited land-use carbon emissions. Accordingly, this paper puts forward some corresponding policy suggestions.
1. Introduction
In recent years, with the development of production technology and the continuous improvement of urbanization level, carbon emissions from industrial production and human activities are increasing. Climate warming and natural disasters frequently occur, affecting normal production and human well-being [1,2]. Constructing a development model for a low-carbon economy is imperative. Following the themes of peace and development, global environmental governance has emerged as a major challenge for human development. China’s economic and social development is currently at a bottleneck, requiring higher energy consumption to maintain economic development. In terms of increased carbon emissions since 2006 for 16 consecutive years, China is ranked first [3]; therefore, reducing China’s carbon emissions is extremely important. The land is an important factor in production, providing an important platform for human activities. Human activities produce high levels of carbon emissions during land-use change, which is one of the most important carbon sources in the world [4,5]. The study of land-use carbon emissions from the perspective of land use and its control is important in improving China’s low-carbon development model and achieving the “double carbon” goal.
At present, many scholars have studied land-use carbon emissions, mainly focusing on land-use changes [6], effects of land use on carbon emissions [7,8], land-use-induced carbon emission accounting methods [9,10], influencing factors of land-use carbon emissions [11,12], and predictions of land-use carbon emissions [13], using different methods and data. Zhang et al. used carbon emission models to measure land-use carbon emissions in some areas of the Xinjiang Uygur Autonomous Region. They explored its influence mechanism and the coupling relationship between land-use carbon emissions and urbanization level [14]. Poeplau C. found that changes in land use practices affected CO2 emissions or sequestration using long-term monitoring of data from different soils in Europe [15]. From 1990 to 2000, Liu Jiyuan used remote sensing estimation methods to calculate soil carbon and nitrogen accumulation for various land-use types in China [16]. Houghton R. A. calculated carbon fluxes from living vegetation, dead vegetation, soil, and wood products in China using a bookkeeping model [17]. Yuan Shaofeng used Landsat TM image interpretation data to combine economic contribution and ecological carrying capacity, and then used the coupling results to investigate the characteristics of land-use carbon emissions in the Yangtze River Economic Zone [18]. Michele et al. [19] examined the factors influencing land-use carbon emissions in the study area using a regression analysis model. Yang Kun et al. [20] used a Markov model to predict future land-use changes and carbon emissions in the study area based on remote sensing data from the Lhasa region for two periods in 2000 and 2010, and classified the region into six land categories: arable land, forest land, grassland, water, construction land, and unused land. Tan et al. forecasted the 2020 census using a GM (1, 1) model. The GM (1, 1) model was used to forecast Chongqing’s carbon emissions in 2020 [21]. In general, domestic and international studies have focused on accounting for land-use carbon sinks, carbon sources, and net carbon emissions and analyzing the spatial and temporal changes. These studies are relatively comprehensive but still have some limitations, e.g., the studies on the spatial and temporal distribution characteristics of the study area are less diversified and comprehensive. There is a lack of discussion of the social, economic, and ecological effects, and the impact of the land-use change on carbon emissions cannot be fully and profoundly revealed. In terms of exploring the factors affecting carbon emissions, although different principles and methods have been used, the results mostly show a positive correlation between carbon emissions and economic factors; however, the conclusions are not innovative and the methods used are rather homogeneous. From the standpoint of land use, it is practical to investigate and control the influencing factors of the Yellow River Basin land-use carbon emissions, as well as to take appropriate measures to reduce the national pressure on carbon emission reduction and to achieve green and low-carbon sustainable development. This paper uses this as a jumping off point for further discussions.
The Yellow River Basin is an important region for economic development and ecological protection and an important energy basin in China [22]. It is important for China’s economic and social development and ecological security. The development and implementation of an ecological protection and high quality development strategy for the Yellow River Basin can help to balance the economies of the north and south and support the high quality development of the northern economy. It will effectively promote the balanced and green development of China’s regions and the formation of a new pattern of coordinated regional development when combined with other regional development strategies. In this study, the data on the dynamic changes in land use, population, energy, and economy from 1990 to 2018 in nine provinces (regions) of the Yellow River Basin were used to estimate land-use carbon emissions using the carbon emission coefficient of the IPCC inventory method, combined with energy consumption data, and the low-carbon development patterns of the nine provinces (regions) were evaluated through land-use induced carbon emission intensity; finally, the LMDI model was used to analyze the factors influencing land-use carbon emissions. The current level of the low-carbon development in the Yellow River Basin is relatively low, with obvious differences between the regions, and there have been serious problems facing low-carbon development, such as the coal-leaning energy consumption structure, heavy industrial structure, and insufficient policies and mechanisms for the low-carbon economy to support the economic transition. On the basis of land-use carbon emissions, analyzing the efficiency of land-use carbon emissions in provinces and regions of the Yellow River Basin provides an important reference value for determining the degree of the differences in low-carbon development among provinces and regions of the Yellow River Basin [23]. It can also provide a basis for relevant departments to prepare relevant plans for the Yellow River Basin.
2. Overview of the Study Area and Data Sources
2.1. Overview of the Study Area
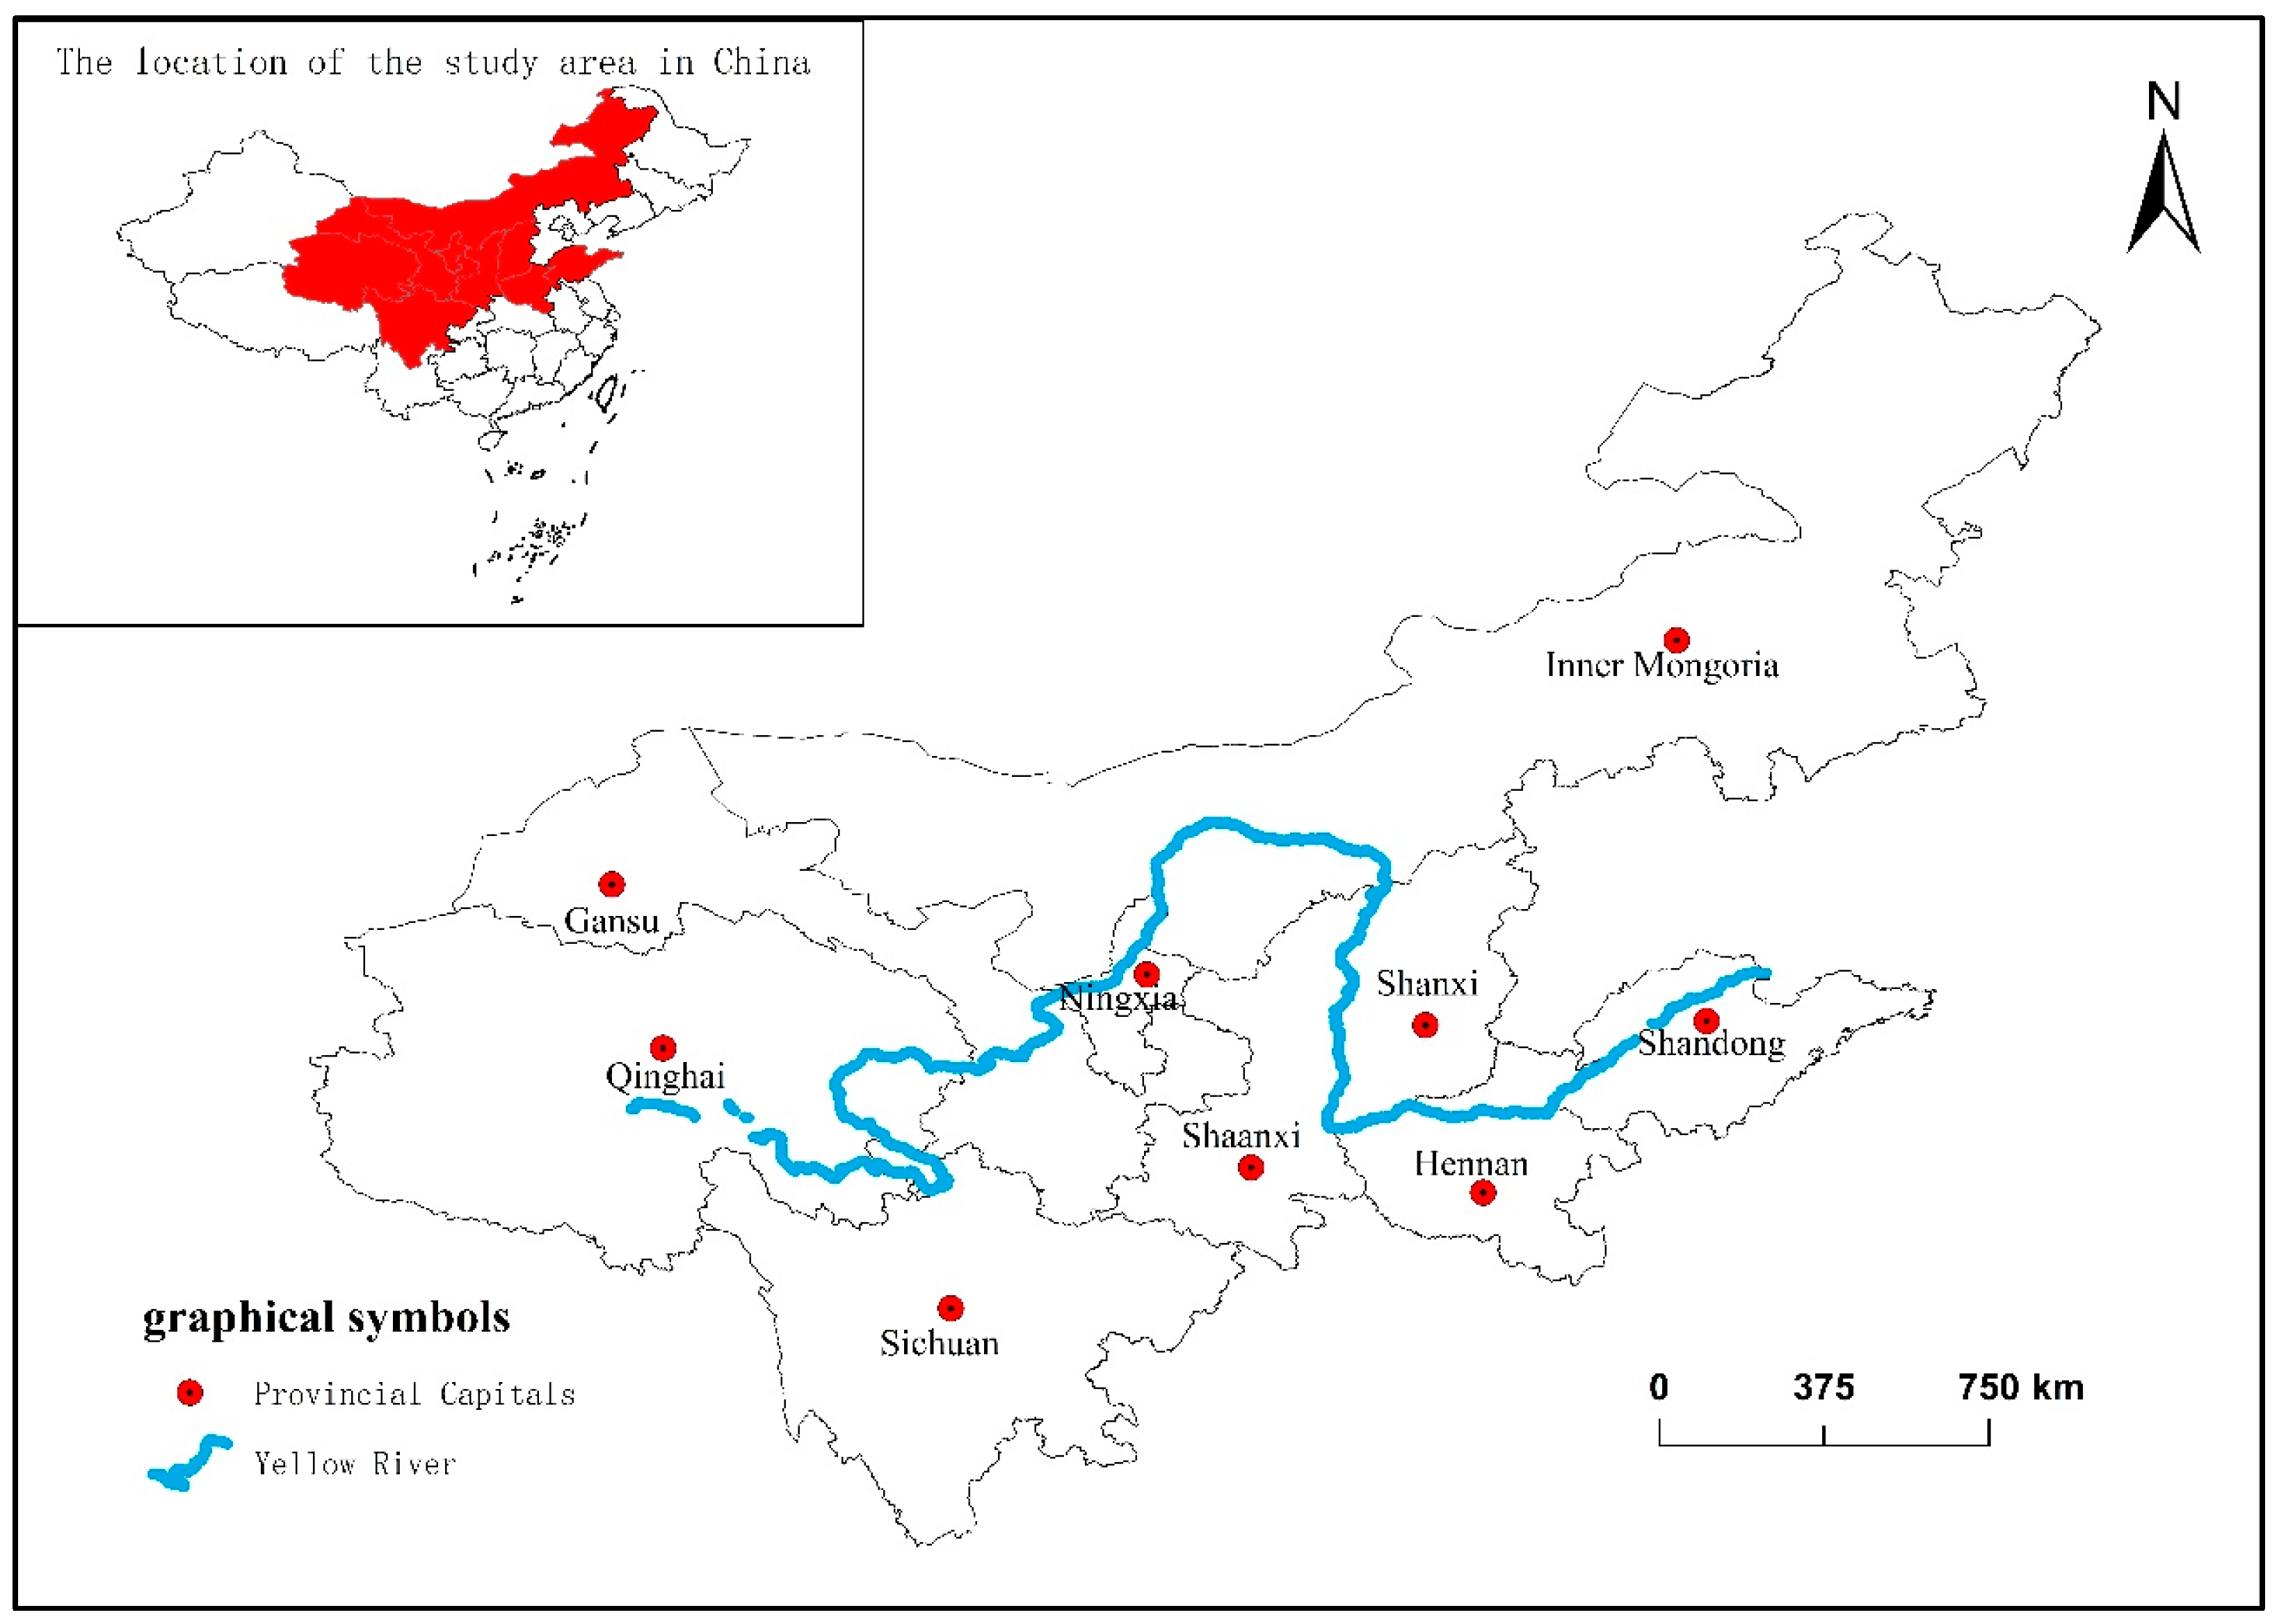
The Yellow River is known as the “mother river” of Chinese civilization and is the second longest river in China (Figure 1). Originating from the Qinghai–Tibet Plateau, it covers the eastern, central, and western parts of China and empties into the Bohai Sea near Dongying in Shandong Province. The total area of the basin is 795,000 square kilometers, dividing into the Hekou town as the upper, between Hekou and Taohuayu as the middle, and below Taohuayu as the lower reaches, with the mountainous terrain located in the upper reaches and hills and plains located in the middle and lower reaches [24]. Since the “reform and opening up”, the economic development of the Yellow River Basin has made significant progress, with the average annual growth rate of regional GDP in the region reaching 9.4% between 1978 and 2020 and the total economic value increasing by nearly 56.2 times [25]. According to the data derived from the statistical yearbook of the provinces in the study region, the total population of the study region was 421,604,100 by the end of 2020, accounting for 29.70% of the total population of the country, and the regional GDP was CNY 2,538,661 billion, accounting for 25.00% of the total national GDP. Along with the rapid economic development, carbon emissions in the Yellow River Basin remain high, and in 2018, carbon emissions in the Yellow River Basin were 1,574,994,200 tons, accounting for 12.01% of the national total carbon emissions. In this study, taking the naturally flowing area of the Yellow River as the main body and considering the economic and ecological relationships among the regions in the basin, nine provinces (regions) including Qinghai, Sichuan, Gansu, Shaanxi, Ningxia, Inner Mongolia, Shanxi, Henan, and Shandong were selected as the study area based on the accessibility and accuracy of relevant research data and the issue of data measurement scales in research.

Figure 1.
Administrative division map of the study area.
2.2. Data Sources
Land-use monitoring data from the Chinese Academy of Sciences (www.resdc.cn, accessed on 21 January 2023) were used in this study, with an accuracy of 30 m × 30 m, cropped to the administrative boundaries of the study area. Among them, the data for 2000, 2005, and 2010 were produced using Landsat TM/ETM remote sensing images from each period as the primary data source. The data for 2018 were updated based on the previous data, with the addition of Landsat 8 remote sensing images and manual analysis, yielding 90% accurate annual land-use remote sensing monitoring data. Since 2020, land-use remote sensing data are currently used less in relevant studies, and the accuracy of data use has yet to be tested, followed by the use of data from 2018. The energy consumption data and other data of the nine provinces (regions) required to measure carbon emissions from various energy sources were obtained from the China Energy Statistical Yearbook in 1991, 2001, 2011, and 2019. The data on total population, GDP, total energy consumption, and residential energy consumption from the nine provinces (regions) were obtained from the Statistical Yearbook of each province from 2011 to 2021.
3. Research Methodology
3.1. The IPCC Land-Use Carbon Emission Coefficient Method
Land-use carbon emissions are the drivers of greenhouse gases such as CO2 in the process of land-use change, and they can be divided into direct carbon emissions and indirect carbon emissions [26]. In this paper, the results of carbon emission accounting represent the difference between the carbon emission and carbon absorption of each land-use type, and the positive value of the accounting results reflects the carbon source, which generates carbon emissions. In contrast, the negative value of the accounting results reflects the carbon sink, which is the absorption of carbon emissions. The IPCC land-use carbon emission coefficient method is based on the carbon emission coefficient calculation method in the IPCC Guidelines for National Greenhouse Gas Inventories. The direct carbon emission coefficient method is used for the land-use types including cultivated land, grassland, forest land, water area, and unused land. In contrast, the indirect carbon emission coefficient method is used for construction land to estimate the net carbon emissions from land use [27,28].
3.1.1. Direct Land-Use Carbon Emission Coefficient Method
Direct land-use carbon emissions refer to the carbon emissions generated in the process of direct land-use change, as well as carbon emissions generated from the transformation of land-use types, including the transformation within each land type and between land types.
where E is the regional land-use carbon emissions; ei is the carbon emission from a certain land-use type; Si is the area of a certain land-use type; and Qi is the carbon emission coefficient of a certain land-use type. The carbon emission coefficients of land-use types [29] are shown in Table 1.

Table 1.
Carbon emission coefficient for land-use types.
3.1.2. Indirect Land-Use Carbon Emission Coefficient Method
Indirect carbon emissions from land use refer to the carbon emissions generated by human activities using land as the basic carrier of socioeconomic activities and consuming energy in the process of land-use change. The carbon emission coefficients were calculated based on the parameters given in the IPCC Guidelines for National Greenhouse Gas Inventories [30,31,32], and eight main energy sources were selected according to the energy consumption of the study area, as shown in Table 2.
where Ec is the carbon emissions from construction sites; Ei is the energy consumption; and fi is the carbon emission factor for energy.
Table 2.
Carbon emission coefficient for each type of energy.
3.1.3. Accounting for Net Land-Use Carbon Emissions
The net carbon emissions in the region are equal to the sum of the total carbon emissions from land-use types and the total carbon emissions from energy consumption in construction land, which is calculated as shown in (3).
where C is the total regional carbon emissions; E is the total carbon emissions from land-use changes; and EC is the carbon emissions from construction land.
3.2. Land-Use Carbon Emission Intensity
Carbon emission intensity refers to the amount of carbon dioxide emitted per unit of GDP in the study area. Analysis of land-use carbon emission intensity can further reveal the relationship between the land-use carbon emissions and socioeconomic factors such as population and economy and can also help assess the low-carbon development model of the region, as shown in Equation (4) [33].
where CEI is the carbon emission intensity of the study region in t/CNY 10000; C is the total carbon emission (t) of the study region; GDP is the gross domestic product of the study region in million CNY.
3.3. Decomposition of Land-Use Carbon Emission Factors Based on the LMDI Method
Currently, the most widely used factor decomposition methods include the log-averaged D-type exponential decomposition (LMDI), the Kaya constant equation, and the STIRPAT model. Among them, LMDI is the most widely used method in the decomposition of carbon emission factors. Compared with other methods, the LMDI method can not only overcome the disadvantage of the improper decomposition of residual terms from decomposition but also removes the residual terms and satisfy the reversibility condition. The LMDI model is an analytical framework for studying the characteristics of land-use change and its mechanism of action. It is run by decomposing the total index, identifying the factors that affect the total index, analyzing the degree of the influence of each factor on the total index, and finally explaining the reasons for the change in the total index [34,35,36,37]. In this study, the LMDI model was used to decompose the land-use carbon emission factors in the study area and analyze the influence of economic factors, demographic factors, factors affecting the structure of land-use change, and energy-use efficiency factors on land-use carbon emissions [31,38].
where C is the carbon emissions (million t); L is the area of regional construction land (million ha); GDP is the regional gross domestic product (billion CNY); P is the total population (ten thousand); AI is the land-use structure; BI is the energy-use efficiency; and CI denotes the level of economic development.
For Equations (5) and (6), the total carbon emissions at the beginning of the period were taken as C0 and the total time of the T-period is Ct, whose change is denoted by ∆C. Similarly, the land area at the beginning of the period is L0 and the area of the regional construction land in period T is Lt, with its change denoted by ∆L. The total population at the beginning of the period is P0, while the total population during the period T is Pt. The change in the population size is ∆P. The regional GDP at the beginning of the period is GDP0 and the regional GDP during the period T is GDPt. The regional economic development rate is ∆GDP; the land-use structure at the beginning of the period is AI0, while the land-use structure during the period T is AIt and the change in the land-use structure of the region is ∆AI. The energy-use efficiency intensity at the beginning of the period is BI0, whereas the intensity of energy-use efficiency during the period T is BIt, and the change in the regional energy-use efficiency intensity is ∆BI. Therefore, the change in carbon emissions during the study period (0-T) can be changed from Equations (5) and (6) to Equation (7) as follows [32,39]:
4. Results and Analysis
4.1. Analysis of the Spatial and Temporal Pattern Evolution of Land-Use Carbon Emissions
4.1.1. Time Series Analysis of the Characteristics of Land-Use Carbon Emissions
Based on the data on the dynamic changes in land use, energy, population, and economy of the nine provinces (regions) in the Yellow River Basin, the results of land-use carbon emissions in the study area during the past 30 years were obtained for the land-use carbon emission measurement using the IPCC method, as shown in Table 3. Within the last 30 years, the net carbon emissions of these nine provinces (regions) showed a continuous increase and also a large decrease, from 253,493,700 t in 1990 to 157,499,400 t in 2018. Among them, in four time periods from 2000 to 2010, carbon emissions underwent the largest change of 773,113,600 t, with a change rate of 220.00%, which strongly indicates that China’s economy was in a state of rapid development at that time, with a sloppy mode of development and poor awareness of environmental protections [40]. Arable land and construction land producing large amounts of carbon emissions during the utilization process were carbon sources. Woodland, grassland, water area, and unused land minimized the increase in total carbon emissions by absorbing carbon emissions generated from carbon sources and were also the main carbon sinks [41]. The results of the study showed that among the carbon sink land-use types, carbon absorption remained stable, with forest land playing the main role of carbon absorption; cropland and construction land promoted the increase in carbon emissions in the utilization process, and the amount of carbon emissions from cropland has undergone a steady 30-year change. In comparison, carbon emissions from construction land showed a sharp increase within 30 years, demonstrating that it is the most important source of carbon emissions. In terms of cross-sectional analysis, the carbon sink effect in related land types within the study area was not significant enough to offset the carbon emissions generated by the change in land use, and construction land played a decisive role in the production of net carbon emissions from land use.
Table 3.
Carbon emissions by land use types in the study area (104 t).
4.1.2. Sequencing-Based Spatial Analysis of the Characteristics of Land-Use Carbon Emissions
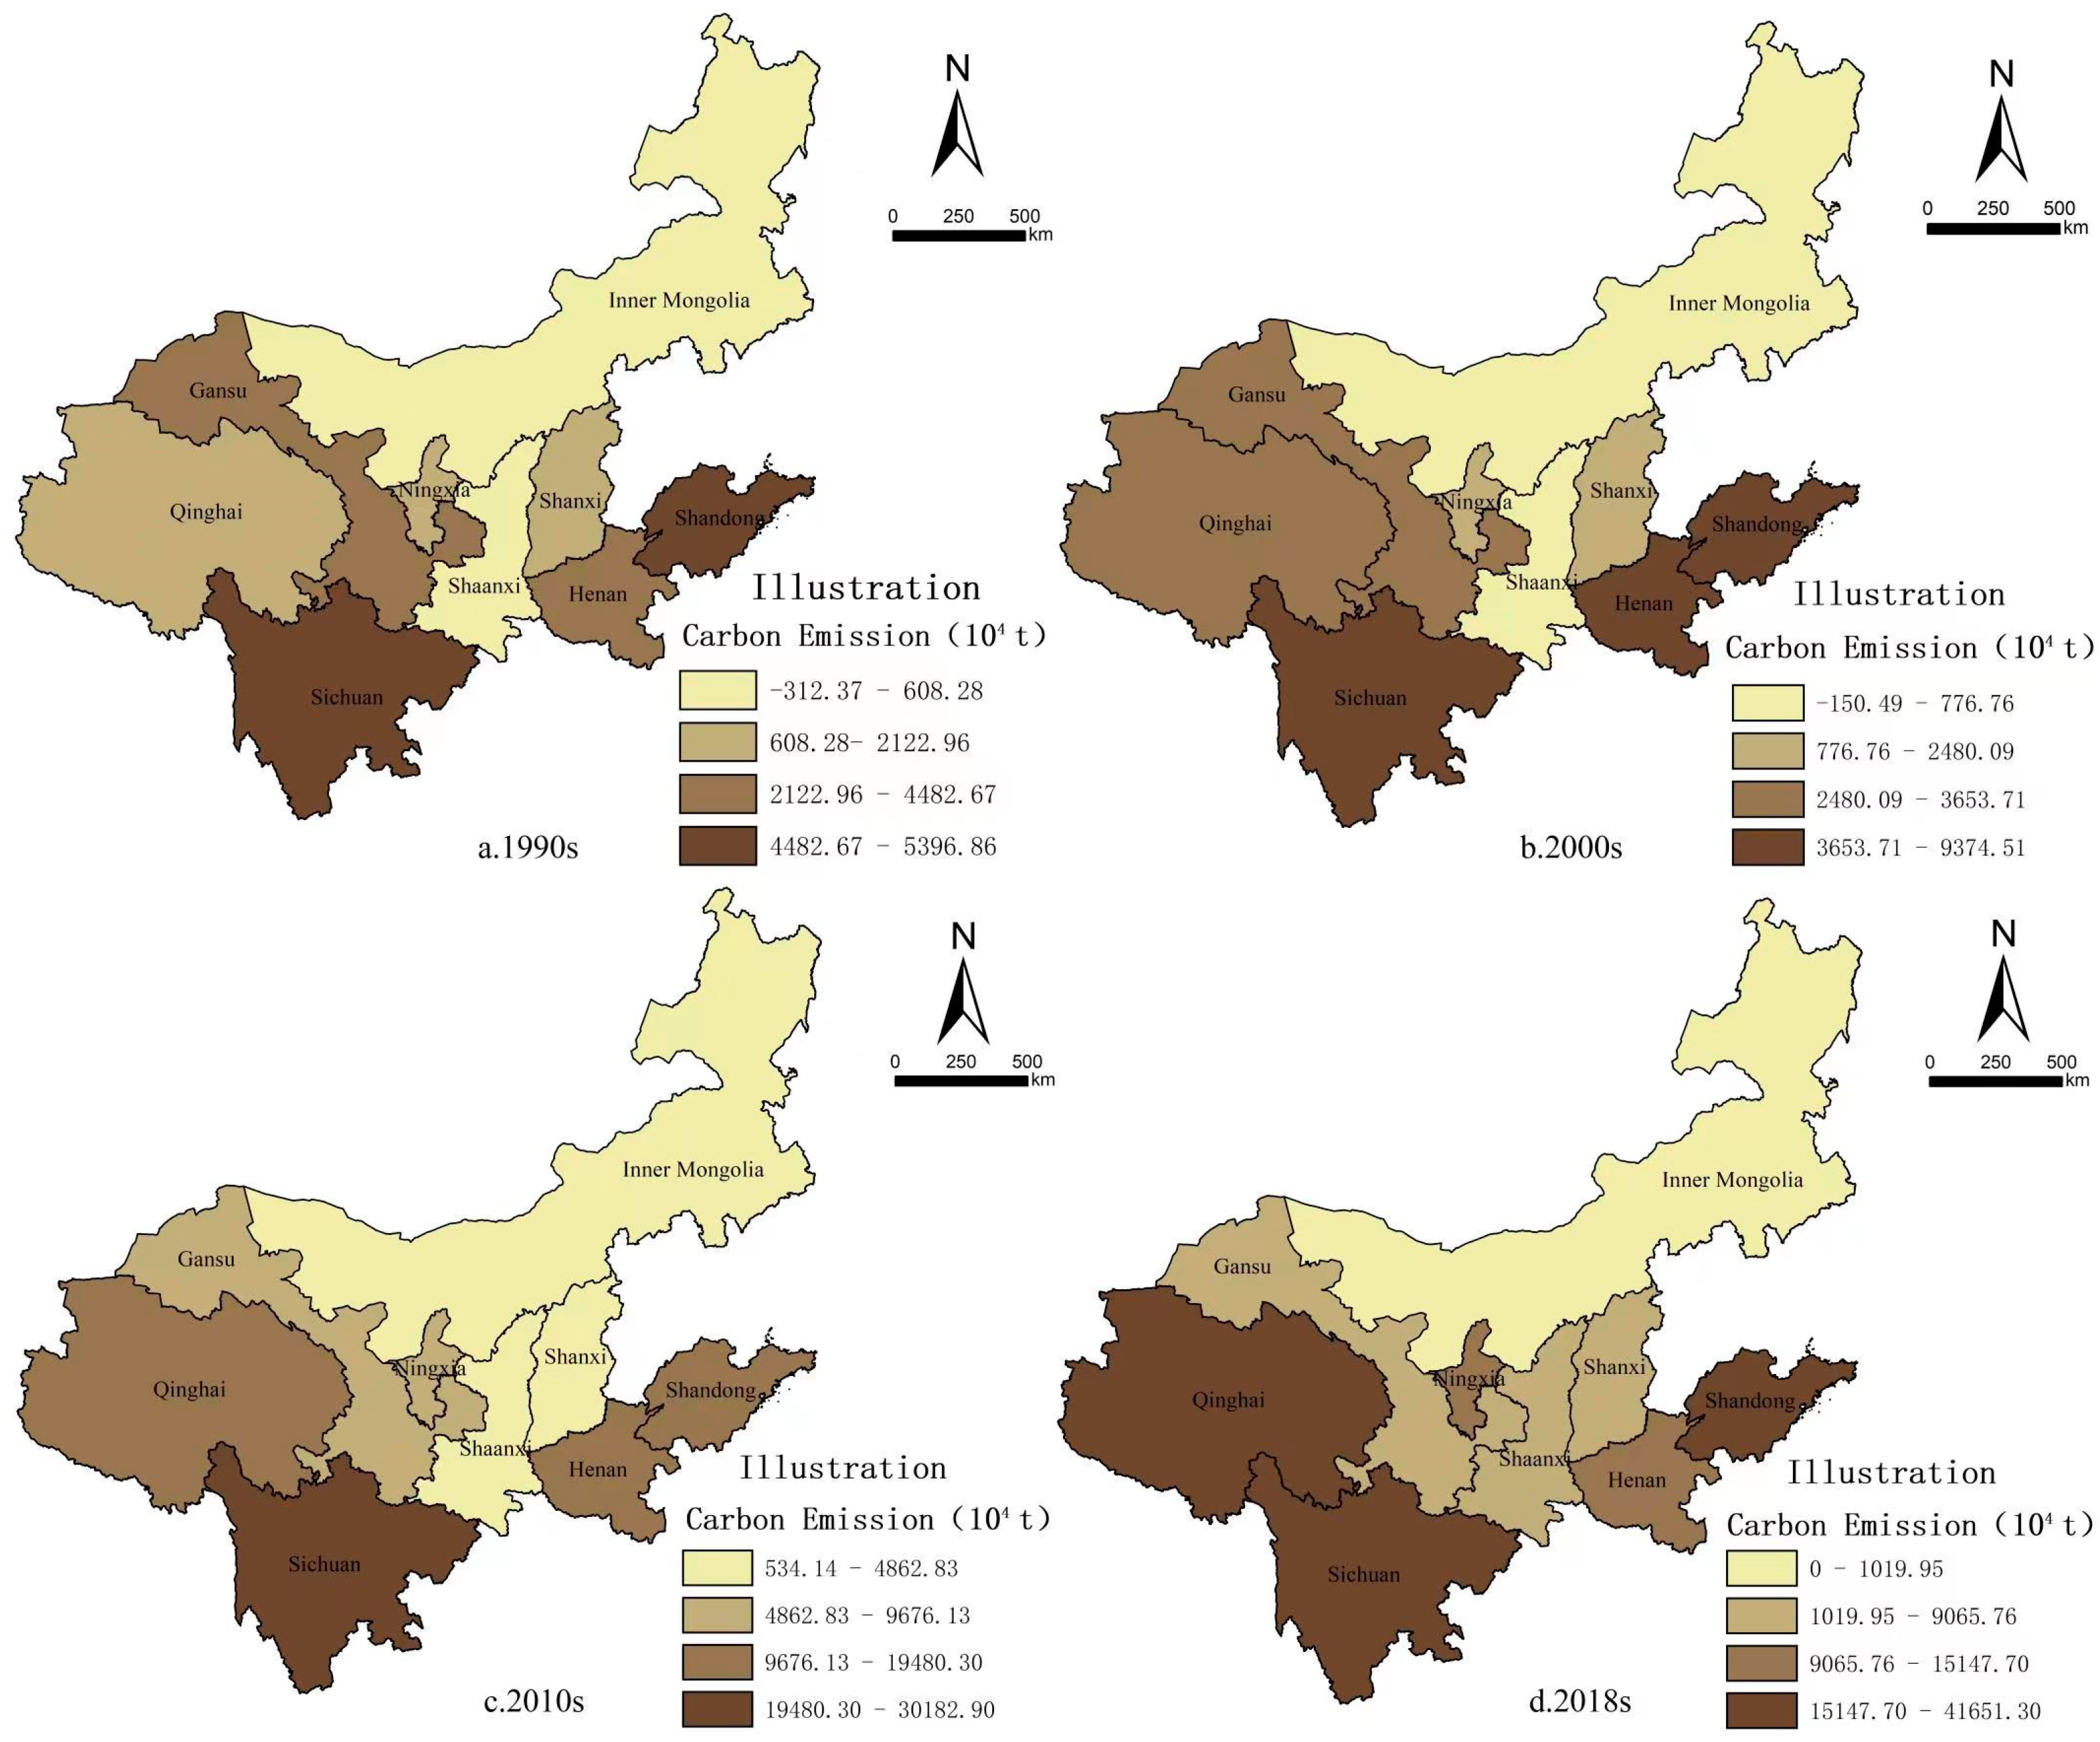
The net carbon emissions (Table 4) and spatial distribution (Figure 2) of land-use types in the nine provinces (regions) in the Yellow River Basin during 1990–2018 in different periods were calculated by the land-use carbon emission measurement method. The spatial pattern of net land-use carbon emissions was divided into four levels using the natural interval method, with level 1 being the lowest and level 4 the highest.
Table 4.
Carbon emissions from land-use types in the study area by province (104 t).
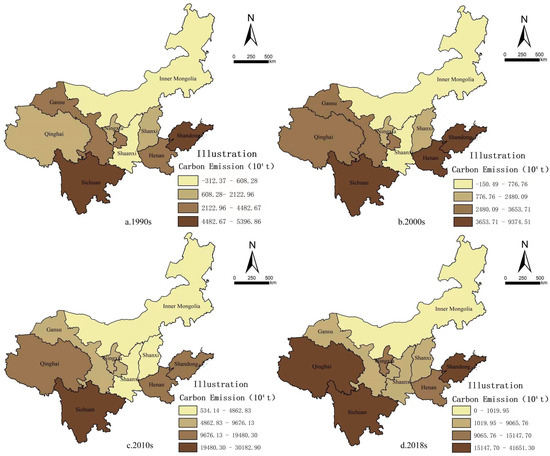
Figure 2.
Spatial distribution of net carbon emissions by province in the study area by year (104 t).
Overall, the carbon emissions in the Yellow River Basin are high. There were significant differences in carbon emissions among the nine provinces (regions) along the Yellow River, with four provinces (Shanxi, Shaanxi, Henan, and Shandong) in the middle and lower reaches of the Yellow River belonging to the high emission area, two provinces (regions) in Sichuan and Inner Mongolia in the upper reaches of the Yellow River belonging to the medium emission area, and three provinces (regions) in Qinghai, Ningxia, and Gansu belonging to the low emission area, with large differences in the spatial distribution of carbon emissions (Figure 2). In 1990, Sichuan Province and Shandong Province were the main carbon emitter areas, with a total net carbon emissions of 107,278,100 tons, accounting for 43% of the total carbon emissions of the nine provinces (regions). In 2000, the proportion of carbon emissions in Henan Province increased, which was considered the top carbon emitter area together with Sichuan Province and Shandong Province, with a total carbon emissions of 225,969,700 tons in these three provinces and regions accounting for 64% of the total net carbon emissions of the study area. The net carbon emissions in 2010 were mainly concentrated in Sichuan Province, with a total of 301,829,000 tons, accounting for 28% of the total net carbon emissions of the study region; however, the regional net carbon emissions in 2018 were mainly concentrated in Qinghai Province, Sichuan Province, and Shandong Province, with a total net carbon emissions of 1025.407 million tons, accounting for 65% of the total regional carbon emissions. Sichuan Province had the largest carbon emissions in all four periods from 1990 to 2018, whereas Inner Mongolia had the smallest carbon emissions. Overall, the low carbon emission areas were mainly distributed in the central and northern parts of the Yellow River Basin, namely, the Inner Mongolia Autonomous Region and the Shaanxi District, which are dominated by mountains and grasslands, with high forest cover areas and large carbon sinks but relatively low amounts of total carbon emissions [42]. The high carbon emission areas, however, were concentrated in the southern and eastern parts of the Yellow River Basin, which are closely related to rapid economic development, large-scale expansion of construction land, and large populations in recent years [43].
4.2. Time Series Analysis of Land-Use Carbon Emission Intensity
Carbon emissions per unit GDP can reflect the contribution of regional economic development to carbon emissions, which is considered an important indicator for the regional low-carbon development level [44]. To clarify the relationship between the economy and carbon emissions of each province, the GDP and total carbon emissions of the nine provinces (regions) in the four periods (1990, 2000, 2010, and 2018) were calculated using the carbon emission intensity formula to obtain the carbon emission intensity from land use in the nine provinces (regions) in different years.
The carbon emission intensity per unit GDP can reflect the relationship between the regional carbon emissions and economic development; the smaller the value, the more consistent, coordinated, reasonable, and sustainable the land use and the economic development is and vice versa [45]. According to Figure 3, the total carbon emission intensity per unit GDP of the nine provinces (regions) has decreased during the past 30 years, from 5.21 t/CNY in 1990 to 0.66 t/CNY in 2018, with an initial more rapid and then a slower deceleration. This indicates that the nine provinces and regions have actively responded to the call for the “double carbon” policy, continuing to promote energy conservation and emission reduction and taking a low-carbon development model, with strong coordination between land use and economic development, along with a remarkable sustainable development of the region. Among the provinces in the study area, the carbon emission intensity of Qinghai and Ningxia was significantly higher than that of the other provinces and regions, reaching 4.07 tons per million CNY, reflecting the low level of low-carbon development in these two provinces and also the need for improving their industrial efficiency, as well as the further optimization of the industrial structure. Inner Mongolia showed a continuously decreasing trend during 1990–2018, from −0.98 t/CNY in 1990 to 0.06 t/CNY in 2018, and the total amount has been at a low level, indicating that there is some variation in land use and economic development in Inner Mongolia, but in general, the economic structure is more logical.
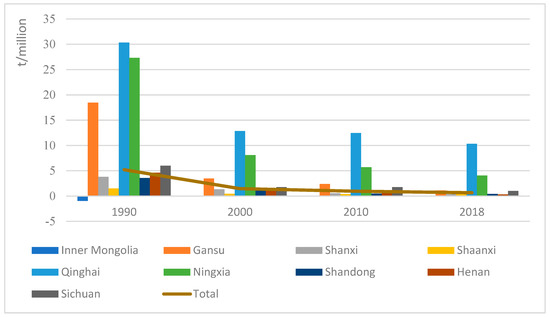
Figure 3.
Carbon emission intensity per unit of GDP by province in different years in the study region (10 thousands t/CNY).
4.3. Analysis of Factors Influencing Land-Use Carbon Emissions in Nine Provinces and Regions in the Yellow River Basin
Carbon emissions from construction land had the largest proportion of total carbon emissions from the different land-use types (Table 3), but its utilization area ranked last among all other types of land use. Therefore, using the LMDI model, we could further analyze the influencing factors of land-use carbon emissions by analyzing the factors leading to the increase or decrease in construction land combined with other related factors. According to Equation (7) and the total land-use carbon emissions in the study area from 1990 to 2018, the decomposition analysis results of land-use carbon emission factors in the study area could be obtained, as shown in Figure 4.
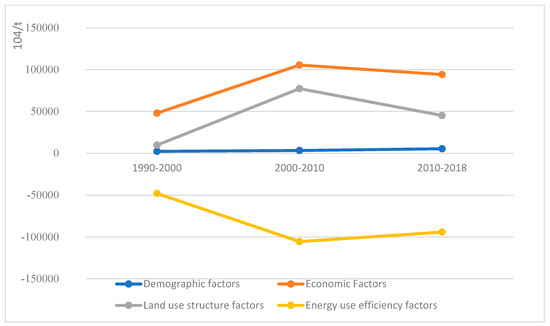
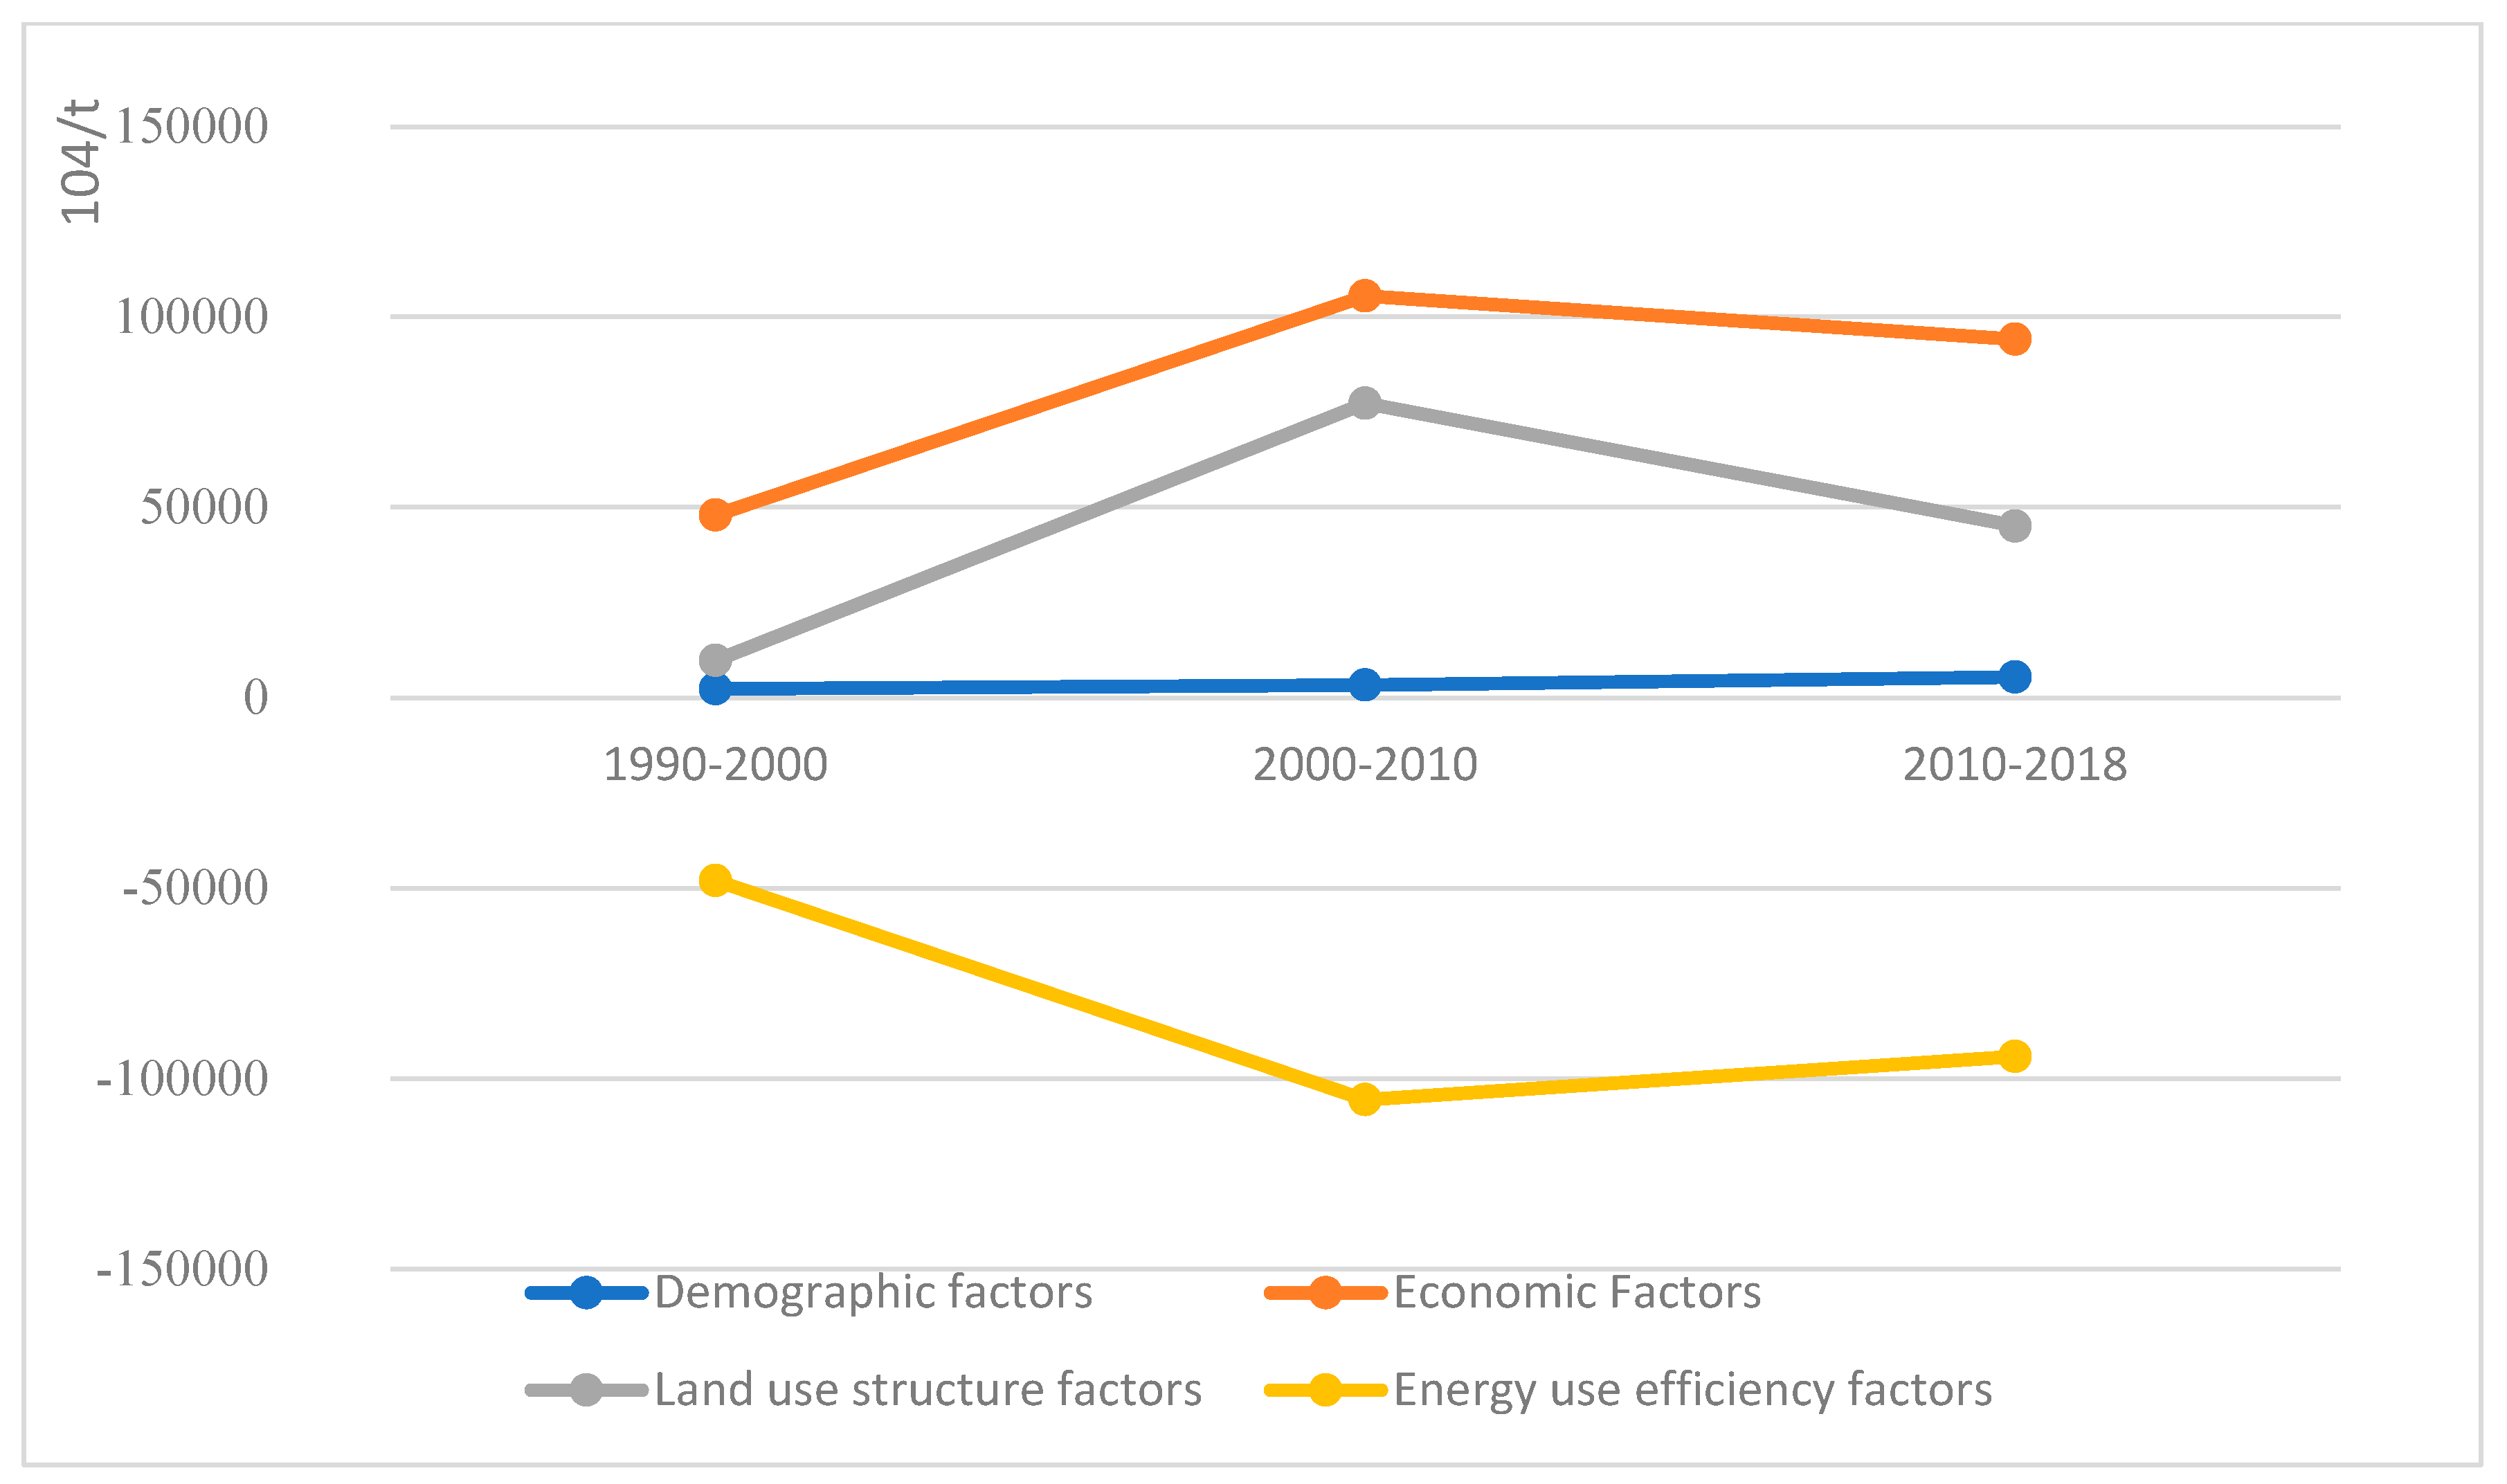
Figure 4.
Decomposition result of land-use carbon emission factors in the study area (104 t).
According to the calculation results, the population, economy, land-use structure, and energy-use efficiency all had a significant influence on land-use carbon emissions, and all underwent obvious annual changes in the different periods; however, the contribution rates of the different influencing factors differed significantly. During 1990–2018, the factor of energy-use efficiency had the greatest influence on land-use carbon emissions in the nine provinces and regions, i.e., the energy-use efficiency significantly affected carbon emissions and played a suppressive role in the increase in carbon emissions. The contribution of economic factors and energy-use efficiency factors to carbon emissions was relatively similar, and the contribution rate of demographic factors was significantly lower than that of other factors. The factor of energy-use efficiency limited carbon emissions. In contrast, other factors played a positive role in the increase in carbon emissions, and the factor of the economy greatly promoted the increase in carbon emissions.
In terms of population-related factors, the increase in the size of populations showed a positive correlation with the increase in total carbon emissions and promoted the increase in land-use carbon emissions. The contribution rate of population-related factors to carbon emissions was relatively consistent from 1990 to 2008, hovering around a low rate of 37.2 million tons. This may be due to the reduction in the contribution rate of population size by the population divergence and aging of the population in the Yellow River Basin [23]. However, the increase in carbon emissions caused by population size in the Yellow River Basin, with an early large population size, still needs to be taken seriously. Thus, a reasonable layout of population size is needed, and carbon emissions can also be reduced by reducing personal consumption.
In terms of economic factors, GDP per capita reflects the economic development of the study region, and the expansion of economic scale resulted in a significant positive contribution to the increase in carbon emissions, with an average contribution rate of about 835,488,800 tons, indicating that it is a key factor in promoting the increase in regional carbon emissions. The contribution rates of economic development and energy use efficiency could offset each other to a certain extent. Economic development was accompanied by a significant increase in energy consumption, and thus, they were combined, bringing about a rapid increase in carbon emissions. Therefore, it is necessary to change the development model, improve its quality, and strongly promote a low-carbon economic development to reduce the effects of economic factors on the increase of carbon emissions.
The land-use structure factors promoted the increase in land-use carbon emissions, with an average contribution rate of around 440,686,300 tons. During the study period, the obtained basic data on land-use structure revealed that while the cultivated land area as a carbon source is continuously slightly decreasing, construction land is increasing. The continuous expansion of construction land and rising fossil fuel consumption, as well as the small change in the area of land-use types that act as carbon sinks, cannot offset the carbon emissions produced by expanding carbon sources, making the net carbon emissions show a continuously increasing trend throughout the study period.
The analysis of energy-use efficiency and its influencing factors showed that the contribution rate of energy-use efficiency factors to carbon emissions significantly increased from −479,805,600 tons in 1990–2000 to −105,541,000 tons in 2000–2010, further clarifying that the energy-use efficiency in the Yellow River Basin has been effectively improved during this period, significantly suppressing the increase in carbon emissions. However, the suppression effect has been minimized in recent years, indicating that there may be some difficulties in the further development of clean energy [46].
5. Conclusions
This study used the carbon emission coefficient method based on the IPCC inventory method to analyze the spatial and temporal evolution characteristics of land-use carbon emissions in nine provinces (regions) and assessed the low-carbon development patterns of these provinces (regions) through land-use carbon emission intensity. Finally, the LMDI model was used to decompose the factors influencing land use carbon emissions, revealing the impact of various factors on land use carbon emissions. The main conclusions are as follows:
- In the past 30 years, the net carbon emissions of the nine provinces (regions) have shown a continuously increasing trend, from 253,493,700 tons in 1990 to 1,574,994,200 tons in 2018, with a large increase of 220% from 2000 to 2010. Construction land was the main carbon source, and the emissions from construction land increased rapidly from 256,375,600 tons in 1990 to 1,578,892,000 tons in 2018, with a growth rate of 500.15%. The difference in the spatial distribution of carbon emissions in different periods was obvious, and the carbon sink effect was not significant enough to offset the carbon emissions generated in the process of land-use change; the pressure for reductions in land-use carbon emissions was also high.
- The total carbon emission intensity values per unit of GDP of the nine provinces (regions) continuously decreased from 5.21 t/CNY in 1990 to 0.66 t/CNY in 2018, with an initial rapid and then a slow deceleration which indicates that the coordination between land use and economic development was improving in the nine provinces (regions). Moreover, the rapid economic development and the green, low-carbon development model had obvious results.
- There were differences in the degree of the contribution of influencing factors to carbon emissions, and the factors of economy and energy-use efficiency were the main factors affecting land-use carbon emissions. Among them, the factors of population size, economic size, and land-use structure accelerated land-use carbon emissions, whereas energy-use efficiency factors limited land-use carbon emissions.
The findings of this study accurately reveal the changes in land-use carbon emissions in the Yellow River Basin over the last 30 years, as well as the factors influencing land-use carbon emissions. The conclusions drawn can serve as a solid scientific foundation for relevant departments to develop economic and ecological development plans for the Yellow River Basin and plans for energy conservation, emission reduction, and green development in China.
6. Discussion and Recommendations
In this study, based on the accounting results of land use carbon emissions during the last 30 years from 1990 to 2018, the LMDI model was used to analyze the influencing factors of land-use carbon emissions, which were generally consistent with previous studies. Some previous studies suggested that increased efficiency in energy use has contributed to increased efficiency in carbon emissions and has generally curbed the increase in carbon emissions [47]. This study analyzed the influence of energy use efficiency factors on land-use carbon emissions based on previous studies and concludes that energy use efficiency factors limited land-use carbon emissions, with ample scope for innovation; however, there are still limitations as follows: (1) From the standpoint of land-use carbon emission accounting methods, this paper adopted the IPCC inventory method for land-use carbon emission accounting, which is based on energy consumption, has a fixed formula, and is easy to calculate; However, the carbon emission accounting in this paper has certain accuracy problems and does not take into account the large span of the study area. The same accounting formula and conversion factors are used for the whole study area, and the accounting results may be different from the actual carbon emission situation. (2) Different provinces have different social, economic, and natural conditions, and their carbon emissions may vary. This study takes the provinces involved in the study area as a whole and does not consider the interrelationships that exist between different provinces. Therefore, in the future, we should conduct an in-depth comparative study of the changes in carbon emissions in each province in the region and consider their inter-provincial effects, which will help to grasp the impact of land-use changes on carbon emissions in a deeper way. (3) The factor decomposition model was used to analyze the influencing factors of carbon emissions. In reality, there are many driving factors affecting carbon emissions, and this study cannot decompose all the factors, and only analyzed the main influencing factors, hoping that future studies can further analyze the influencing factors of land-use carbon emissions in depth.
Although there are shortcomings, this paper has some reference significance for reducing carbon emissions in the Yellow River Basin, and the following policy recommendations can be made based on the findings of this paper:
- Creating a basic layout of land-use structure: The carbon emissions from different land-use types have different levels. To reduce carbon emissions, we need to reasonably establish the land-use structure, increase the area that acts as a carbon sink under different land-use types, reduce the area that acts as the carbon source under different land-use types, introduce norms for the use of construction land, create a strict approval process, and determine the ratio of the area of the construction land, arable land, forest land, grassland, etc., to contribute to the low-carbon and high-quality development of the nine provinces (regions).
- Adjusting the economic structure of the industry: Carbon emissions are closely related to the speed of economic development; the faster the economic development, the higher the level of carbon emissions. Therefore, we should adjust the industrial structure, prioritize the development of the tertiary industry, promote the industrial transformation of primary and secondary industries, control the scale of high energy-consuming and high emissions industries, actively eliminate “backward production capacity”, and reduce carbon emissions in the nine provinces (regions) to ensure economic development.
- Optimizing the structure of energy use and vigorously developing clean energy: Energy use is the direct source of carbon emissions, and the use of clean energy and the efficiency of traditional energy use should be improved. The relevant policies should be formulated to create favorable conditions for developing new energy sources and raise people’s awareness of using clean energy. The improvement of energy use efficiency is the key to reducing carbon emissions, encouraging technological innovation in heavy industries and other high energy-consuming industries, and reducing and promoting low-carbon green development of industries.
Author Contributions
Conceptualization, Y.Z., Q.M. and Q.L.; Data curation, Y.Z., Q.M., Q.L. and B.L.; Formal analysis, Y.Z., Q.M. and Q.L.; Funding acquisition, Q.M. and H.W.; Investigation, Y.Z., Q.L. and B.L.; Methodology, Y.Z., Q.M. and Q.L.; Project administration, Q.M. and H.W.; Resources, Y.Z., Q.M., Q.L. and Q.L.; Software, Y.Z., Q.L. and B.L.; Supervision, Q.M.; Validation, Y.Z. and Q.M.; Visualization, Y.Z. and Q.M.; Writing—original draft, Y.Z.; Writing—review and editing, Y.Z. and Q.M. All authors have read and agreed to the published version of the manuscript.
Funding
This work was supported by the National Natural Science Foundation of China (grant number 41901259); the Research Project of Humanities and Social Sciences in Colleges and Universities of Henan Province (grant number 2021-ZZJH-157); the Philosophy and Social Science Program of Henan Province (grant number 2019CJJ078); and the Research Project of Henan Federation of Social Sciences in 2021 (grant number SKL-2021-3196).
Data Availability Statement
Not applicable.
Conflicts of Interest
The authors declare no conflict of interest.
References
- Yan, H.; Guo, X.; Zhao, S.; Yang, H. Variation of net carbon emissions from land use change in the Beijing-Tianjin-Hebei region during 1990–2020. Land 2022, 11, 997. [Google Scholar] [CrossRef]
- Houghton, R.A. Magnitude, distribution and causes of terrestrial carbon sinks and some implications for policy. Clim. Policy 2002, 2, 71–88. [Google Scholar] [CrossRef]
- Liu, X.; Li, B. Influencing factors and spatial and temporal heterogeneity of agricultural land use efficiency in China under the carbon neutrality target. J. Huazhong Agric. Univ. Soc. Sci. Ed. 2022, 163, 197–209. [Google Scholar] [CrossRef]
- Niu, Y.; Zhao, X.; Hu, Y. A study on the spatial differentiation of land use carbon emissions in counties of Chang Zhu Tan region based on NPP-VIIRS nighttime lights. J. Environ. Sci. 2021, 41, 3847–3856. [Google Scholar] [CrossRef]
- Yang, X.; Liu, X. Carbon transfer effect and prediction of land class transfer in Chang-Zhu-Tan urban cluster. Environ. Sci. 2022, 43, 5850–5860. [Google Scholar] [CrossRef]
- Qu, R.; Tong, S.; Tang, J.; Peng, H. Analysis of land use change characteristics in China based on the first and second national land survey data. Anhui Agric. Sci. 2018, 46, 3–10. [Google Scholar] [CrossRef]
- Li, Y.; Shen, Y.; Wang, S. Spatial and temporal characteristics and effects of terrestrial carbon emissions in Anhui Province based on land use change. J. Soil Water Conserv. 2022, 36, 182–188. [Google Scholar] [CrossRef]
- Li, J.; Mao, D.; Jiang, Z.; Li, K. Study on the decomposition of land use carbon emission factors and decoupling effect in Chang Zhu Tan urban cluster. Ecol. Econ. 2019, 35, 28–34. [Google Scholar]
- Stuiver, M. Atmospheric Carbon Dioxide and Carbon Reservoir Changes: Reduction in terrestrial carbon reservoirs since 1850 has resulted in atmospheric carbon dioxide increases. Science 1978, 199, 253–258. [Google Scholar] [CrossRef]
- Houghton, R.A. Releases of carbon to the atmosphere from degradation of forests in tropical Asia. Canad. J. Forest Res. 1991, 21, 132–142. [Google Scholar] [CrossRef]
- Dugu, C. Research on Carbon Emissions and Influencing Factors of China’s Agricultural Land Utilization: 1990–2016. Ecol. Econ. 2020, 36, 19–23. [Google Scholar]
- Zhang, J.; Chen, H.; Liu, D.; Shi, Q.; Geng, T. Study on the spatial and temporal variation of land use carbon emissions and the influencing factors based on county scale. J. Northw. Univ. Nat. Sci. Ed. 2022, 52, 21–31. [Google Scholar] [CrossRef]
- Ma, Y.; Liu, Z. Spatial and temporal evolution of carbon emissions from land use in the Yellow River Basin and the influencing factors. Ecol. Econ. 2021, 37, 35–43. [Google Scholar]
- Zhang, R.; Li, P.; Xu, L. Impact of urbanization on land use carbon emissions in Xinjiang and its coupling relationship. Acta Ecol. Sin. 2022, 42, 5226–5242. [Google Scholar]
- Poeplau, C.; Don, A. Sensitivity of soil organic carbon stocks and fractions to different land-use changes across Europe. Geoderma 2013, 192, 189–201. [Google Scholar] [CrossRef]
- Liu, J.; Wang, S.; Chen, J.; Liu, M.; Zhuang, D. Soil carbon and nitrogen accumulation and land use change in China from 1990 to 2000. Acta Geogr. Sin. 2004, 59, 483–496. [Google Scholar] [CrossRef]
- Houghton, R.A.; Hackler, J.L. Sources and sinks of carbon from land-use change in China. Glob. Biogeochem. Cycl. 2003, 17, 361–503. [Google Scholar] [CrossRef]
- Yuan, S.F.; Tang, Y.Y. Spatial differentiation of land use carbon emission in the Yangtze River economic belt based on low carbon perspective. Econ. Geogr. 2019, 39, 190–198. [Google Scholar] [CrossRef]
- Victoria, M.F.; Perera, S. Parametric embodied carbon prediction model for early stage estimating. Energy Build. 2018, 168, 106–119. [Google Scholar] [CrossRef]
- Yang, K.; Hu, X.; Shi, Y. Analysis of the current situation and prediction of carbon emissions from land use change based on RS and GIS. J. Chang. Acad. Sci. 2016, 33, 137–141. [Google Scholar]
- Tan, X.C.; Dong, L.L.; Chen, D.X.; Gu, B.; Zeng, Y. China’s regional CO2 emissions reduction potential: A study of Chongqing city. Appl. Energy 2015, 162, 1345–1354. [Google Scholar] [CrossRef]
- Ma, L.; Tian, H.; Kang, L. Ecological and environmental impacts and spatial control paths of mineral resources development in the Yellow River City. Resour. Sci. 2020, 42, 137–149. [Google Scholar] [CrossRef]
- Mo, H.; Wang, S. Spatial and temporal pattern evolution and spatial effect mechanism of carbon emission in Yellow River counties. Geoscience 2021, 41, 1324–1335. [Google Scholar] [CrossRef]
- Yellow River Water Conservancy Commission of Ministry of Water Resources. Yellow River Yearbook (2018); Yellow River Yearbook Society: Zhengzhou, China, 2018. [Google Scholar]
- Sui, D.; Zhang, Y. Study on the impact of urban economic agglomeration on green development efficiency in the Yellow River Basin. Gansu Soc. Sci. 2022, 260, 217–227. [Google Scholar] [CrossRef]
- Fang, J.; Guo, Z.; Piao, S.; Chen, A. Terrestrial vegetation carbon sinks in China, 1981–2000. Sci. China Ser. D 2007, 50, 1341–1350. [Google Scholar] [CrossRef]
- Chen, Y.; Lu, H.; Li, J.; Xia, J. Effects of land use cover change on carbon emissions and ecosystem services in Chengyu urban agglomeration, China. Stoch. Environ. Res. Risk Assess. 2020, 34, 1197–1215. [Google Scholar] [CrossRef]
- Fang, J.; Zhu, J.; Wang, S.; Yue, C.; Shen, H. Global warming, carbon emissions and uncertainty. Sci. China Earth Sci. 2011, 41, 1385–1395. [Google Scholar] [CrossRef]
- Yang, K. Study on the Carbon Emission Effect of Land Use Change in Hunan Province. Master Thesis, South China University, Guangzhou, China, 2021. [Google Scholar] [CrossRef]
- Yang, H.; Zheng, H.; Liu, H.; Wu, Q. NonLinear effects of environmental regulation on eco-efficiency under the constraint of land use carbon emissions: Evidence based on a Bootstrapping approach and Panel Threshold Model. Int. J. Environ. Res. Public Health 2019, 16, 1679. [Google Scholar] [CrossRef]
- Vinuya, F.; DiFurio, F.; Sandoval, E. A decomposition analysis of CO2 emissions in the United States. Appl. Econ. Lett. 2010, 17, 925–931. [Google Scholar] [CrossRef]
- Han, X.; Yu, J.; Xia, Y.; Wang, J. Spatiotemporal characteristics of carbon emissions in energy-enriched areas and the evolution of regional types. Energy Rep. 2021, 7, 7224–7237. [Google Scholar] [CrossRef]
- Li, J.; Hu, H. Analysis of spatial and temporal evolution of land use carbon emissions in Wuhan in the past 20 years. Low Carbon World 2022, 12, 4–9. [Google Scholar] [CrossRef]
- Zhu, E.; Deng, J.; Zhou, M.; Gan, M.; Jiang, R.; Wang, K.; Shahtahmassebi, A. Carbon emissions induced by land-use and land-cover change from 1970 to 2010 in Zhejiang, China. Sci. Total Environ. 2019, 646, 930–939. [Google Scholar] [CrossRef]
- Guo, R.; Zhao, Y.; Shi, Y.; Li, F.; Hu, J.; Yang, H. Low carbon development and local sustainability from a carbon balance perspective. Resourc. Conserv. Recycl. 2017, 122, 270–279. [Google Scholar] [CrossRef]
- Ang, B.W. The LMDI approach to decomposition analysis: A practical guide. Energy Policy 2005, 33, 867–871. [Google Scholar] [CrossRef]
- Ang, B.W. LMDI decomposition approach: A guide for implementation. Energy Policy 2015, 86, 233–238. [Google Scholar] [CrossRef]
- O’Mahony, T. Decomposition of Ireland’s carbon emissions from 1990 to 2010: An extended Kaya identity. Energy Policy 2013, 59, 573–581. [Google Scholar] [CrossRef]
- Fan, R.N. A Study on the Influencing Factors of Carbon Emissions in Zhejiang Province- Based on Kaya Identity. Master Thesis, Zhejiang University of Finance and Economics, Hangzhou, China, 2016. [Google Scholar]
- Liu, W. New growth targets and new development pattern in the new stage of economic development. J. Peking Univ. Philos. Soc. Sci. Ed. 2021, 58, 5–13. [Google Scholar]
- Deng, X. Study on the influencing factors of land use carbon emissions in Wuhan city--based on the extended Kaya equation and LMDI decomposition method. Agric. Technol. 2021, 41, 104–109. [Google Scholar] [CrossRef]
- Liu, Q.; Tang, X.; Wang, W. Analysis of the realization path of China’s forestry and grass carbon sink economy under the goal of “double carbon”. Jiangxi Sci. 2022, 40, 596–600. [Google Scholar] [CrossRef]
- Liu, Q.; Wang, H.; Wang, W.; Zhang, X.; Zhao, W.; Jia, Y. Establishment of environment and economic development quality assessment system and coupling coordination degree analysis in Sichuan Province. Environ. Protect. Sci. 2022, 48, 39–45. [Google Scholar] [CrossRef]
- Zheng, X.; Cheng, J. Research on carbon emission effect of Wuhu city based on land use structure. In Proceedings of the 2011 Annual Conference on Agricultural Engineering in China (CSAE 2011), Chongqing, China, 21–24 October 2011. [Google Scholar]
- Han, H.; Wang, S.; Ma, G.; Zhang, X.; Bai, Y. Study on the spatial correlation between agricultural carbon emission intensity and agricultural economy in China. Soil Water Conserv. Res. 2018, 25, 269–281. [Google Scholar] [CrossRef]
- Li, Q.; Chen, J.; He, J. Analysis of carbon emission characteristics and spatial dispersion based on inventory algorithm--Sichuan Province as an example. Environ. Poll. Prev. 2021, 43, 1513–1519. [Google Scholar] [CrossRef]
- Sun, J.; Xue, Q. Has technological innovation improved the efficiency of carbon emissions? Ecol. Econ. 2022, 38, 22–28, 34. [Google Scholar]

Disclaimer/Publisher’s Note: The statements, opinions and data contained in all publications are solely those of the individual author(s) and contributor(s) and not of MDPI and/or the editor(s). MDPI and/or the editor(s) disclaim responsibility for any injury to people or property resulting from any ideas, methods, instructions or products referred to in the content. |
© 2023 by the authors. Licensee MDPI, Basel, Switzerland. This article is an open access article distributed under the terms and conditions of the Creative Commons Attribution (CC BY) license (https://creativecommons.org/licenses/by/4.0/).