Article

Why Did the “Missing Middle” Miss the Train? An Actors-In-Systems Exploration of Barriers to Intensified Family Housing in Waterloo Region, Canada

by
Dawn Cassandra Parker
*,
Shahab Valaei Sharif
and
Kaitlin Webber
School of Planning, University of Waterloo, 200 University Ave. W., Waterloo, ON N2L 3G1, Canada
*
Author to whom correspondence should be addressed.
Land 2023, 12(2), 434; https://doi.org/10.3390/land12020434
Submission received: 6 December 2022 / Revised: 26 January 2023 / Accepted: 30 January 2023 / Published: 7 February 2023
(This article belongs to the Special Issue Urban Planning and Housing Market)

Abstract

:
(1) Background: Missing Middle (MM) housing may be critical to address decreasing housing affordability and to achieve critical density in transit-oriented neighborhoods; however, its production is in decline. We report on a case study of housing development around a new light-rail transit line in the Region of Waterloo, Canada, investigating the puzzle of how a residential building boom coincided with decreasing housing affordability. (2) Methods: Following participatory co-creation and communication of background research characterizing housing demand with stakeholder partners, we created a data narrative arguing that MM housing was desired by residents and profitable for developers and then used it to guide semi-structured interviews with planners and real estate industry stakeholders. Based on these interviews, we developed a qualitative system map and causal loop diagrams that demonstrate interactions between key actors (residents, brokers, planners, developers, and investors) as mediated by boundedly rational real estate demand expectations. (3) Results: Our interviews identify multi-faceted barriers, beyond demand perception, to MM housing development. Systems analysis illustrates how high-density, small-unit high-rise development can become locked in, concurrently locking out MM housing. (4) Conclusions: Our research identifies barriers to MM housing supply by articulating the systemic feedbacks between the planning and land/housing market realms and reveals key leverage points, empowering planners to develop policies that catalyze hoped-for housing market supply responses to increase housing affordability. Based on these findings, we suggest targeted interventions: multi-unit base residential zoning, MM site plan typologies, non-profit and co-op financing, unit-mix requirements, pre-build MM condo purchase by municipalities or non-profits, and MM demonstration projects.

1. Introduction

In 2019, the Region of Waterloo (RoW) launched the ION light-rail transit (LRT) network. The ION was implemented with two stated goals—to move people and to intensify land use. Land-use intensification goals succeeded, with CAD 3.2 billion in new building investments in the Central Transit Corridor (the CTC, the area approximately 800 m around transit stops) between 2011 and 2020, materializing primarily in the form of high-rise residential developments [1]. Recent statistics show a 41% increase in building permits from 2020 to 2021, with 70% of new residential units comprising infill development [2].
At the same time, housing in the RoW has become increasingly less affordable across all income levels. Figure 1 illustrates the steep upturns (and moderate downturns) of local housing prices over the last 10 years. Mirroring national trends, the RoW experienced a steep increase in single-family home prices from 2016 to 2018, driven mainly by migrating Toronto-area buyers [3]. The pandemic strengthened these trends, with year-over-year single-family home gains of 33% [4,5], the second highest in Canada [6], representing loan-to-income levels similar to those of London, U.K. The Kitchener–Waterloo Community Foundation also reports increasing rents, growing scarcity of affordable rentals, and housing supply lagging population growth [6].
How can a residential construction boom and housing affordability crisis co-exist? The prevalent narratives to explain the steep decline in housing affordability throughout the province of Ontario focus on population growth, coupled with insufficient housing supply to meet that growth. While some approaches arguing for supply limitations focus on estimating future households and providing each with a housing unit [7,8,9], others focus on the supply needed to restore historical levels of housing affordability [10]. All approaches to date, however, base their analyses on average household sizes and, separately, their possible dispersion into the fairly narrow housing type definitions aggregated from Census categories [11], basing their analysis only on the total number of units or by categorizing housing types into single-family, low-rise intensified (four stories or lower), or high-rise (five stories or higher). Through this lens, with steep increases in the number of housing units, housing supply should not be driving unaffordability in the RoW.
In reality, household sizes are diverse, as are the types of built forms that can house them. Generic “housing supply” may not meet the demand for suitable housing if the built form does not provide the right number of bedrooms. The Canadian Mortgage and Housing Corporation (CMHC) defines “housing suitability” in terms of the match between the number and status of household members and the number of bedrooms in a unit [12]. While concepts of suitability can be culturally mediated [13], this definition suffices given our focus on family-sized housing. Locally, the 2021 Canadian Census [14] indicates that while only 0.2% of couples without children were unsuitably housed, unsuitable housing increased for couples with children (7.2%), one-parent families (10.4%), and “other” households, a category including multi-family and roommate households (24.6%), with households in two-bedroom units most likely to fall in the “unsuitable” category. These data suggest that a scarcity of suitable housing for larger households with low-to-moderate incomes is a possible explanation for the housing price run-up, whereby households not able to find suitable housing in the marketplace are pushed into either too-small, too-far-away, or too-expensive housing, inflating housing prices in the non-MM categories. These dynamics may work against transit-oriented development (TOD) and intensification goals if a lack of suitable housing near jobs results in longer commutes [15]. Such unsuitably housed households comprise latent demand for more suitable housing forms—so-called “Missing Middle” (MM) housing.
We therefore hypothesize that the lack of supply of MM housing in the RoW is a key explanatory factor that resolves the puzzle of increasing supply and decreasing affordability. Such lack of MM housing supply is an acknowledged issue throughout North America. The term “Missing Middle” describes the medium-density housing types that are increasingly scarce in new residential construction [16,17]. This family-sized (three or more bedrooms) housing includes ownership and rental townhomes, duplexes and triplexes, and low- to mid-rise apartment buildings [17] and may also include secondary suites and dwellings such as laneway suites and tiny homes [16,18,19].
This paper reports the results of qualitative exploratory research around potential barriers and solutions to MM housing supply in the RoW, employing a complex systems lens to our analysis of planning and market contexts [20,21]. Our objective is to apply systems-thinking methods to demonstrate that complex housing market dynamics may have “locked in” “tall and sprawl” development patterns [22] and “locked out” MM housing supply, creating a supply gap in suitable housing for low-and-moderate-income family-sized households. To address this objective, our research proceeded in four stages of participatory research with stakeholder colleagues in the planning, real estate, and housing-development fields. In Stage 1, we co-developed and reported the results of qualitative and quantitative surveys and interviews with residents (renters and home buyers), developers, and realtors. In Stage 2, we collaboratively constructed a data narrative arguing that MM housing was scarce in the RoW. Stage 3 used this data narrative to guide qualitative discussions with developers and marketing stakeholders. Based on these interviews, in Stage 4, we developed and analyzed a qualitative system map and causal loop diagrams presenting our hypothesized dynamics and suggested systems interventions, which comprise the major research findings of this paper.
Section 2 of this article provides literature background on MM housing and the developers’ decision-making context. Section 3 describes the methods employed at each stage. Section 4 summarizes the information shared with stakeholders and feedback received in Stages 1–3. Section 5 presents the systems diagrams and analysis. In Section 6, we identify potential planning and fiscal policy levers that have the potential to increase local MM housing supply (Stage 4).

2. Literature Background

2.1. How and Why Is “Missing Middle” Housing Missing?

Missing Middle housing supply is in decline across North America. In the United States, MM housing production (defined as a building with 2–4 units) has been in steady decline since 1982 [23]. In Canada, the construction of MM housing types has declined significantly since the 1950s [24], when municipalities began enacting restrictive zoning by-laws favoring single-family homes [16,25,26]. In an analysis of building start data, MM supply gaps have been recently identified within Ontario’s main population center (the Greater Golden Horseshoe (GGH)) [27], although parts of the RoW were highlighted in leading MM supply throughout the GGH.
Simultaneously, increased demand for urban living among family-sized households is increasing demand for MM housing [28,29]. However, limited supply has made urban MM housing unaffordable for middle-income families [30,31], forcing a choice between a small urban apartment or a single-family detached house in the suburbs.
Despite the high demand for MM housing and many municipalities relaxing their zoning by-laws to facilitate infill and greater diversity in housing types permitted, developers are reluctant to build medium-density family housing, citing issues of limited land supply [32], planning red tape (e.g., restrictive zoning, building code, and parking requirements), and high development costs [18,33,34,35]. As a result, developers prefer to build on either side of the spectrum, creating a housing market characterized by “tall and sprawl” development [22].

2.2. Developer Decisions in a Planning and Market Context

Developers’ decisions about when, where, and how to develop lands are shaped through interactions with investors, brokers, sellers, buyers, potential and actual residents, and municipal planners [36,37,38,39,40,41,42]. Figure 2 demonstrates these complex and multi-faceted influences on developers’ decision-making. To assess where to build and what to build, potential profit for a particular development site and building design are measured through a “pro forma”. These potential profits are influenced by the planning context, including zoning constraints, the anticipated time to completion, development charges, affordability requirements, and unit size mix (the proportion of units with one, two, three, and more bedrooms). If developers’ strategic responses to planning requirements are not considered, policies might not create correct and feasible incentives [43]. For instance, when unevenly applied, inclusionary zoning rules (mandating a proportion of affordable units) can lead to a net reduction in affordable housing by diverting some of the developments to the closest unregulated alternatives [44]. In Toronto and elsewhere, requirements for two- and three-bedroom units without specifying minimum unit sizes may create units with sufficient bedrooms but insufficient living area for the household size [45].
On the cost side, profitability is further influenced by building and investment costs and constraints. Construction costs depend on the type of build, with high-rise costs per unit area being up to 2.5 times those of low-rise builds [46]. Developers, lenders, and pre-build investors (who advance purchase condos) rely on their expectations about housing demand—how many units will sell or rent at particular prices. Developer finance options include equity finance (own capital), lender finance, or a hybrid model, where lenders require matches through pre-sales to investors or future residents. Larger projects require a combination of capital sources, which require reliable partners [47,48]. Financial lenders can include banks, real estate trusts, and non-profit lenders [49]. For any lender, assessment of higher project risk or lower expected return means higher interest rates and lower loan-to-value ratios [50]. Investors who pre-purchase units also incur the risk of lower sales values or delayed sales once construction is complete [51,52]. Thus, owner–investors’ beliefs and preferences can guide or limit developers’ decisions [53]. This cost-and-finance side discussion highlights the importance of the expectations of end-user demand from not only developers but also the investors who finance builds.
While the development pro forma is a widely used tool, literature debates whether developer decision making fits economic models of expected profit maximization under the widely acknowledged risk that characterizes land and housing markets. While some authors qualitatively characterize developers as profit-seeking, risk-taking, and innovative [41,54], other studies find evidence of “boundedly rational” decision behavior, including satisficing (the tendency to select the closest satisfactory solution), loss aversion (weighing losses more than gains), and weighing relative rather than absolute wealth shifts (prospect theory) [55]. Mohamed [56] argues that this satisficing behavior is due in part to the project complexity reflected in Figure 2, potentially explaining uneven housing supply (scarcity of three-bedroom infill relative to greenfield builds) [57].

3. Methods

3.1. Historical Supporting Research

Findings from our previous case study research, reported below, have been shared with the stakeholders involved in this study through public, private, and one-on-one briefings. Numerous surveys and interviews have helped us gain an understanding of the system’s actors and their motivations—the “who” in our system. Most surveys were developed in collaboration with stakeholder partners, whose feedback cross-validated and assisted in the interpretation of quantitative and qualitative survey results. DeFields [58] conducted a hybrid mail/internet response spatially stratified random sample via postal mail of 1272 households with private yards in Kitchener–Waterloo, analyzing 206 complete responses. Pi [59] created a rental database through a web-scrape of all Kijiji rental postings (19,544) from 5 weeks in late summer 2015, invited a spatially stratified sample of 2912 residents to respond via postal mail, and analyzed a total of 290 responses. Tran [60] conducted key informant semi-structured interviews with 18 local development firms, out of 40 local development firms identified by municipal partners. Cook [61] conducted five semi-structured focus group interviews with a total of 27 local realtors, recruited using maximum variation purposeful sampling methods through the local realtor association and realtor agencies. Huang [62] conducted a mail/internet hybrid response survey of all residents identified by Canada Post as likely home buyers or sellers from June 2015 to April 2017 (5185), receiving responses from 357 home buyers (all complete survey questions and additional method details are contained in each reference).

3.2. Data Narrative

Data narratives [63], a series of descriptive statistics connected by structured arguments, are used in Ontario to support both local planning and the development of provincial policy [1,6,7,8,9,64]. Planners, developers, and policymakers also often use a single statistic to justify policies and beliefs. Such data narratives reflect the state of a dynamic system, potentially showing correlations consistent with underlying hypothesized dynamics. However, they do not demonstrate or prove causality, reflecting the “what”, but not the “why”.
Based on the widespread use and acceptance of data narratives, in order to investigate local perceptions related to MM housing scarcity, we worked with local housing economists (staff from CMHC) and the Kitchener–Waterloo Association of Realtors from Fall 2020 through to Spring 2021 to build a data narrative that presented evidence for the local scarcity of three-bedroom apartment units, especially in the core areas (downtowns) within the CTC. We argued that it was a puzzle—and potentially a market failure—that three-bedroom units were not being constructed. We presented four kinds of evidence: (1) underlying demand for MM housing; (2) income and demographic trends favoring MM housing as being the preferred and/or feasible alternative for many residents; (3) lack of current supply of MM housing; and (4) potential profitability of constructing MM housing.

3.3. Semi-Structured Interviews

We used our data narrative as a template to facilitate discussions with 7 local developers and representatives of a condominium marketing firm during the summer and fall of 2021. We employed semi-structured interviews to increase our understanding of the system under study; identify key actors and their roles; test existing hypotheses; identify potential hypotheses and research questions; understand the beliefs, perspectives, and lived experiences of actors; and develop our qualitative systems representation [65,66,67].

3.4. Systems Analysis

Dynamical systems representation and analysis is growing in popularity and application [68]. Dynamical systems link stocks and flows through hypothetical or empirical causal relationships. Stocks are entities that accumulate or deplete over time, and flows are the rates at which the stocks change. Using examples from our case study, this approach describes a system in terms of stocks (planning regulation, housing, information, and finance), flows (policy change, housing supply, demand perceptions, and housing finance and sales), and the processes that connect them (plan and policy development, housing development, information exchange and belief formation, and land and housing markets).
Forrester [69] asserts that a systems lens can “sharpen clarity of thought and provide a basis for improved communication”, “reveal the interrelatedness of physical and social systems”, and “unify knowledge” (p. 187). Ghosh [70] emphasizes that systems knowledge can aid in both understanding and intervening in systems through understanding systems interactions and complexity, including identifying and managing unintended consequences. Page [71] emphasizes the role of systems dynamics models in identifying causal dynamics, including positive and negative feedback loops. We employ systems dynamics modeling, in the form of a qualitative systems map and corresponding qualitative causal loop diagrams (Section 5), with these purposes in mind. In short, we use systems dynamics analysis to formally represent causal hypotheses, illustrating the “why”. Similar approaches have been taken by Olaya [72], Kubanza et al. [73], Macmillan et al. [74], Luna-Yeyes and Anderson [75], Guest et al. [76], Saryazdi et al. [77], and Shoar and Payan [78]. We select these methods as suitable for this study among the broad range of qualitative systems dynamics modeling methods that can be used to reason about systems and explore hypotheses, including Boolean networks [79], cross-impact balances [80], simulation modeling [81,82,83], agent-based modeling [84,85], and analytical optimization [86]. We use the results from our semi-structured interviews as evidence (Section 4.4) to identify actors and their roles, understand the flows of information, and identify causal feedbacks and sources of path-dependence in our case-study system.

4. Knowledge Exchange with Partners

4.1. Local Trends and Economic Context

Trends noted in the literature review (Section 2) are also observed in our local case study. Our previous research on local developers [60] showed that they relied primarily on their own past experience in making decisions and that many developers were taking a “wait and see” attitude towards investments in the CTC. Subsequent to that research, the success of key early builds has led to a cascade of high-rise, small-unit development applications and builds along the LRT corridor, supporting a highly risk-averse, boundedly rational decision-making model for local developers. However, MM builds remain largely absent. In the RoW, while townhome builds are tracking up in the suburbs [24], the overall gap in MM housing supply has been noted by CMHC, the realtors’ associations, and local politicians [87,88]. Our previous research finds evidence for latent demand for urban MM housing—renters and buyers who could not find affordable housing with bedrooms and greenspace they were seeking [58,59,61,89]. Evidence of this latent demand has sparked some policy changes designed to increase MM housing, including a City of Kitchener Zoning By-law Amendment increasing the number of units allowed on any residential parcel [90] and specific MM housing goals in the most recent RoW Official Plan Amendment [88].
We offer some additional context on housing demographics and basic economics concepts to fill in gaps for planning and housing market readers and give context to our data narrative. Locally, while multi-unit housing builds can be purpose-built rentals or for the condominium market, residents often move between ownership and rental at various life stages, and these transitions are mediated by housing availability and affordability. An understanding of the housing options available to various groups, and the extent to which these types are substitutable for particular resident classes, is essential in order to understand housing demand and the extent to which it is elastic (when many substitutes exist, increases in prices will cause large drops in quantity) or inelastic (when the housing is essential and substitutes are absent, a small increase in prices will cause little change in quantity) [91]. In principle, such understanding could contribute to more accurate expectations formation for end-user demand (uptake and willingness-to-pay) for developer and investor actors; however, we have not yet seen this topic addressed in the literature.
On the rental side, residents might choose a too-small rental (two bedrooms or fewer, defined as unsuitable housing) or, if available, a three-bedroom unit or small rental house, leased as a purpose-built rental or an investor-owned condo. Home purchases are available only to those with sufficient income, investment capital, and qualifying credit. On the purchase side, residents may choose to purchase a too-small condo or townhome (unsuitable housing), purchase a three-bedroom MM unit if available, purchase a larger home between two households or for a multi-generational household, or purchase a single-family home. When assessing the demand for MM rental or condo builds, developers and marketers (anecdotally) do consider other options available to their potential residents. Thus, a clear understanding of the choices available to potential residents in the market is critical to understand the elasticity of or, for better or worse, the extent of captive demand. For instance, while some potential residents may have the means to buy a two-bedroom condo if rents for a three-bedroom apartment are too high, those without the financial capacity to buy may only have a choice between relatively expensive two- and three-bedroom rentals.
A “scarce” resource in economics is generally defined as a situation where more of that resource will increase the economic payoffs to one or more actors [92,93]. In principle, that actor should be willing to pay up to the additional value added for them of another unit of the resource. For instance, if a three-bedroom apartment is scarce on the demand side, there will be at least one resident who is willing to pay more for a third bedroom. A potential profit opportunity exists for housing suppliers (i.e., developers) if the resident’s willingness to pay for that additional bedroom exceeds the developer’s costs of production for it. As MM housing is by nature multi-unit, developers need signals that sufficient numbers of potential residents are all willing and able to pay a sufficient premium for the third bedroom, and further, that other more attractive substitutes do not exist in the market.

4.2. Previous MM Housing Demand Evidence

Evidence of underlying demand for MM housing was produced through collaborative research and shared previously with municipalities, real estate professionals, and developers. We summarize the take-home points communicated, emphasizing that the research was shared when current. While these trends likely persist, surveys would need to be repeated to confirm findings.
Responses from a survey of households with private yards [58] demonstrated a willingness of higher-income couples with children and retirement-age single-family-home residents to move to MM housing types. However, these groups desired private greenspace or, to compensate for no private greenspace, a nice view, proximity to a park or forest, a porch or balcony, proximity to an urban center, and/or a sense of privacy.
A 2016 survey of local renters [59] found evidence of demand for the urban amenities generally associated with MM housing. When rating the importance of neighborhood characteristics in their rental decisions, 80% rated “ease of walking” important to very important, and around 60% rated land-use mix “important to very important”, whereas around 60% rated “density of housing” neutral to not at all important, indicating openness to denser MM housing. While most respondents stated that their ideal housing type was lower density than their current housing, renters in the youngest (students) and oldest (retirees) categories generally preferred apartments to houses. Evidence for MM housing was most clearly seen in reported gaps between renters’ current and ideal number of bedrooms. For instance, while 17% of respondents currently occupied three-bedroom units, 31% listed three-bedroom as their ideal. Further, whereas 7% of residents lived in four-bedroom units, 17% rated these as ideal. Across all categories, 47% rated a home size of 1000–1500 square feet (ideal for a small three-bedroom) as their ideal home size. Echoing the survey of DeFields [58], while 43% of renters ideally wished for a small or medium yard, 49% ideally wanted no outdoor space or a patio/deck/balcony only. Couples and lone-parent families, not surprisingly, preferred yards, whereas singles, students, and seniors preferred a deck, patio, or balcony. While rents have accelerated locally since this survey, many respondents reported that their ideal rent was higher than their current rent, indicating latent demand for unit size, quality, and access to open space in local rental markets.
Huang et al. [89] applied latent-class analysis to a survey of local buyers and sellers between 2016 and 2018 to identify unmet demand for TOD. They found that while young professionals and seniors were the most common buyer groups in the TOD areas, and families most common in the suburbs, many younger families would have preferred to buy in the TOD areas but could not find units with sufficient dwelling space and access to greenspace to meet their needs.
In summary, ten years of local research supports the potential demand for MM housing, especially in areas served by transit. It suggests that “suitable” housing in our case context requires both sufficient bedrooms and sufficient greenspace access. Concurrent with common wisdom and other research, some of this demand comes from younger and downsizing households, but some also comes from family households seeking access to TOD amenities and an urban lifestyle.

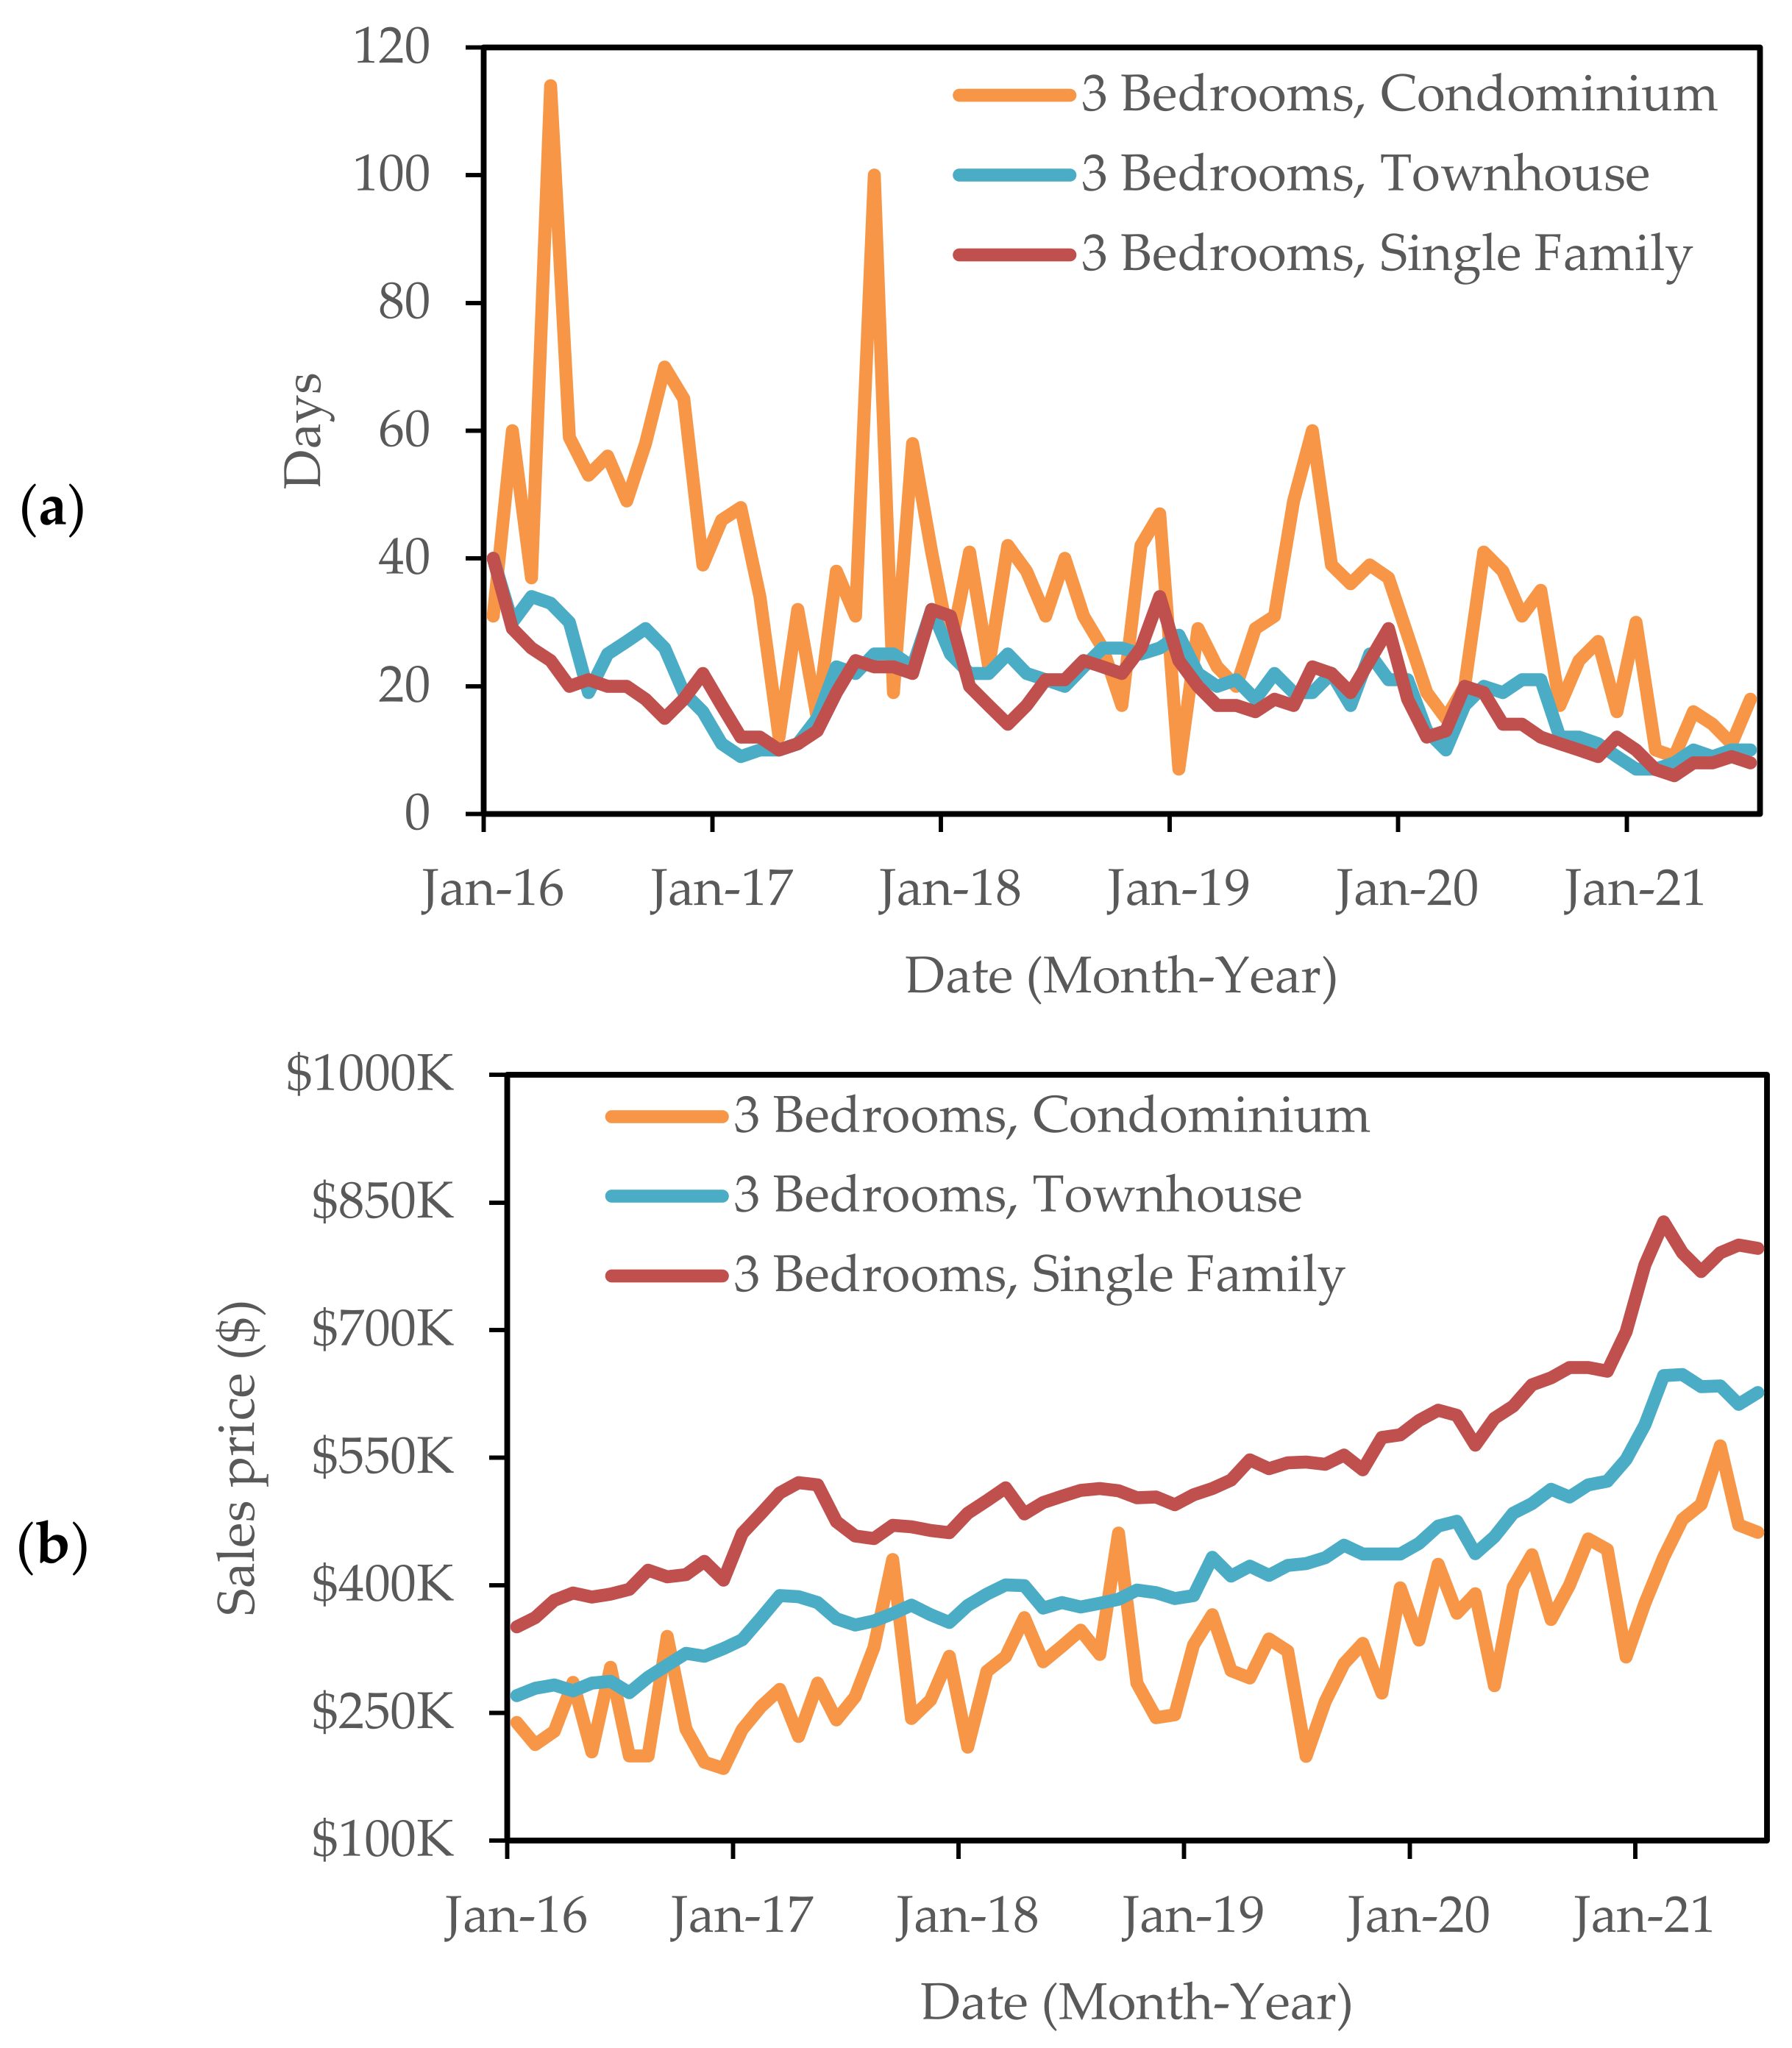
4.3. Data Narrative: Empirical Evidence of the Scarcity of Three-Bedroom Units

Below we summarize the main points of our longer data narrative, developed and shared with stakeholders in 2021. We began our data narrative by arguing for the then-current scarcity and potential profitability through these “take-home” points:
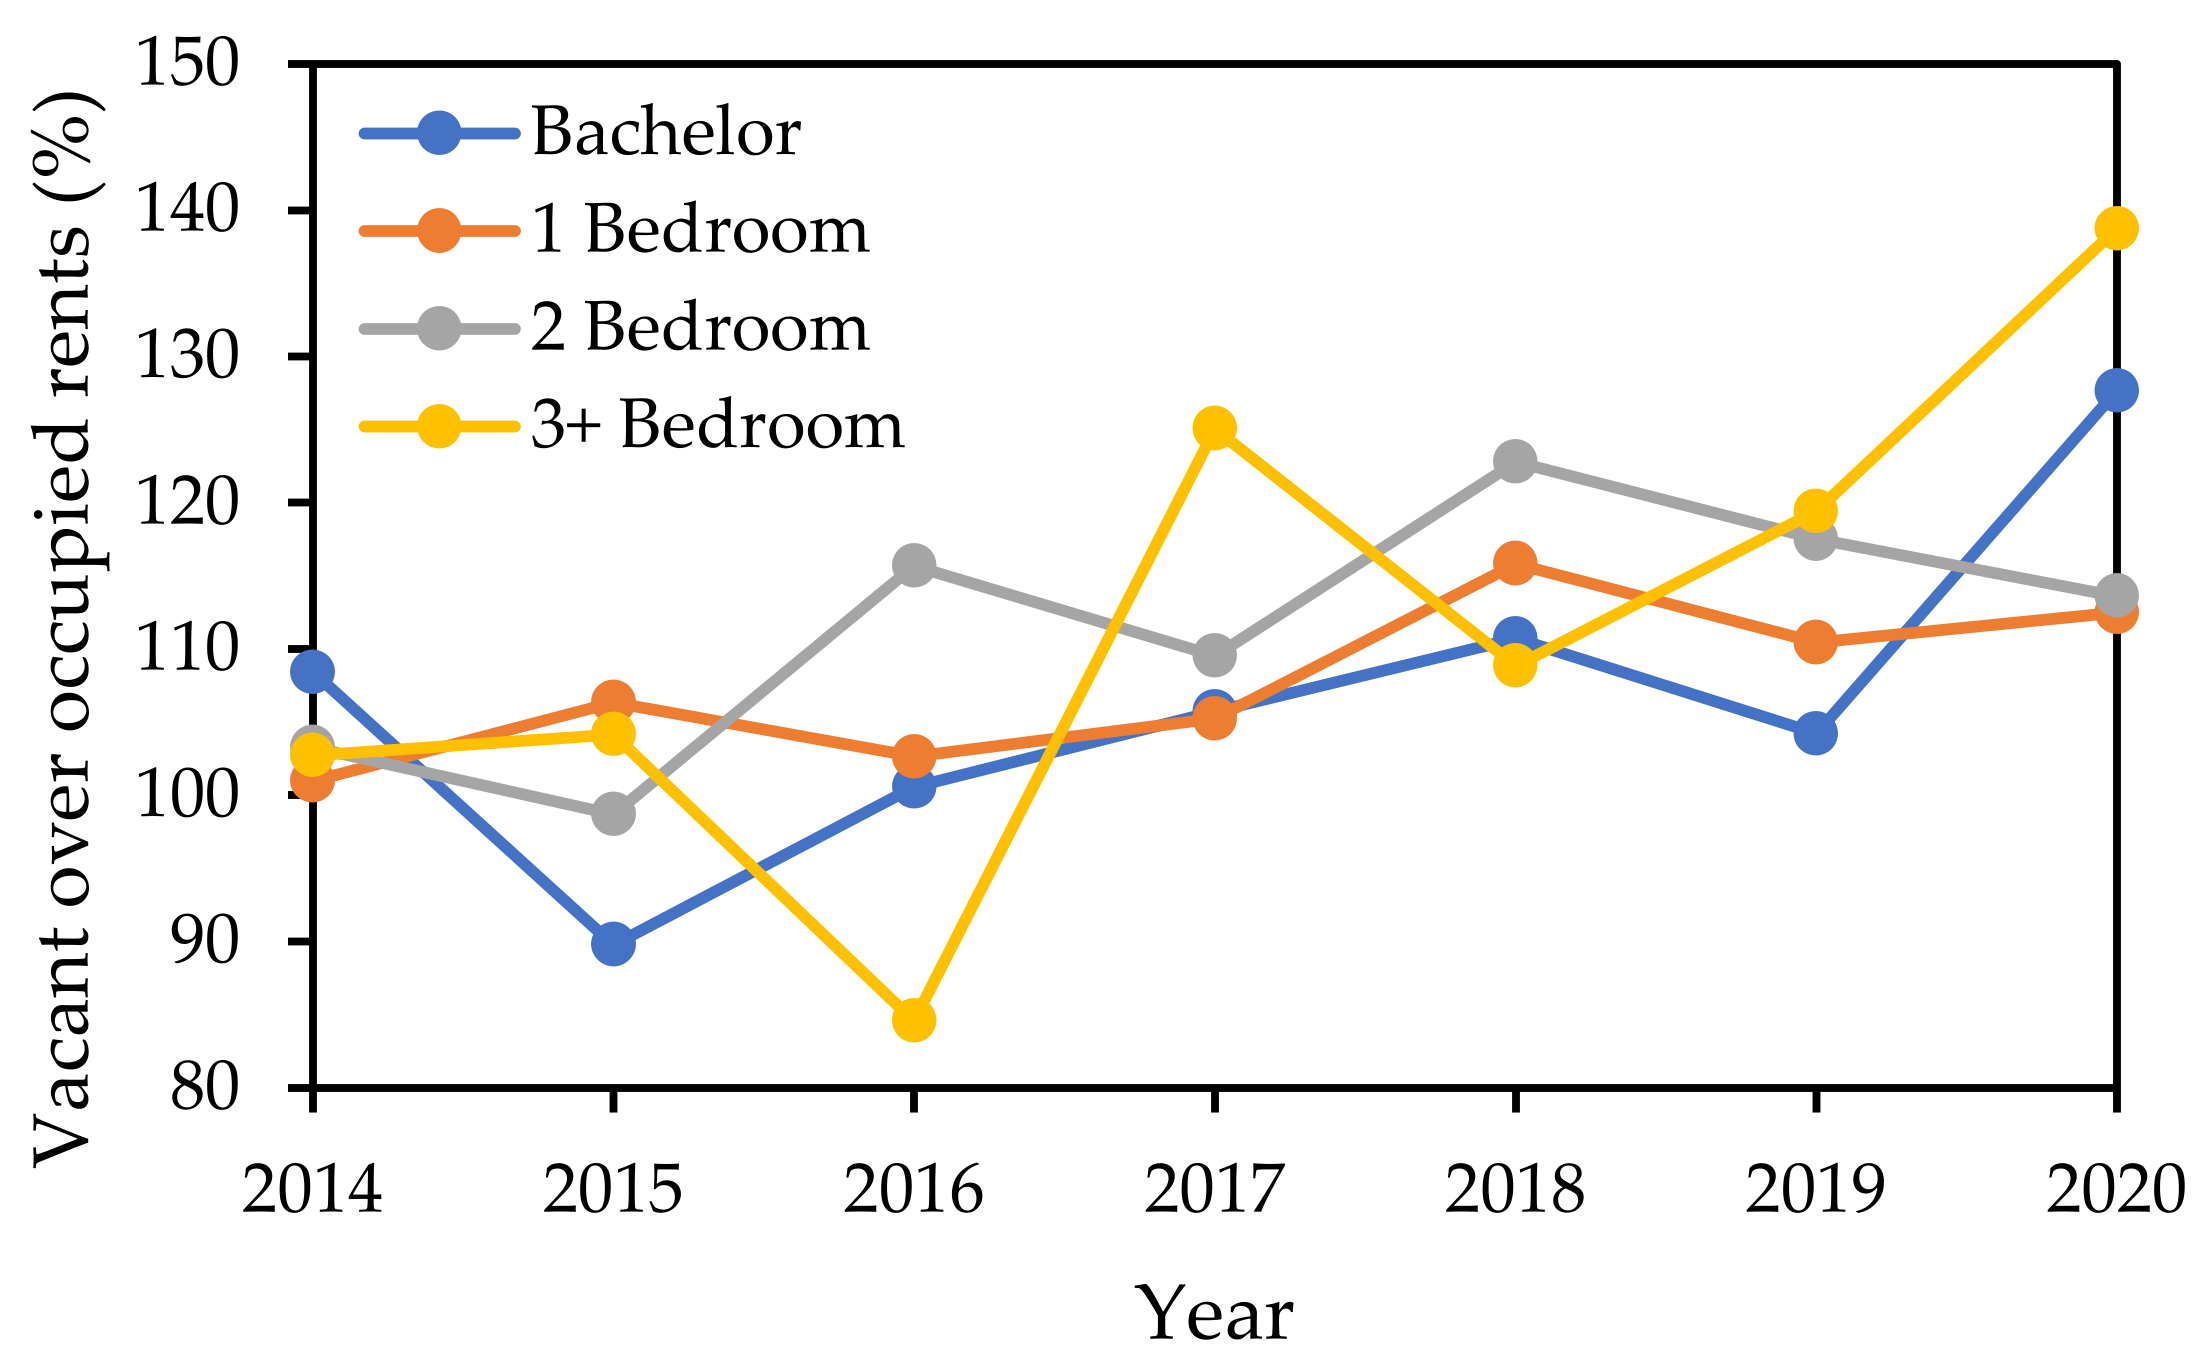
  • Although there is clear scarcity of rentals with three or more bedrooms, they are not being constructed as part of new builds, most acutely not in Kitchener Central.
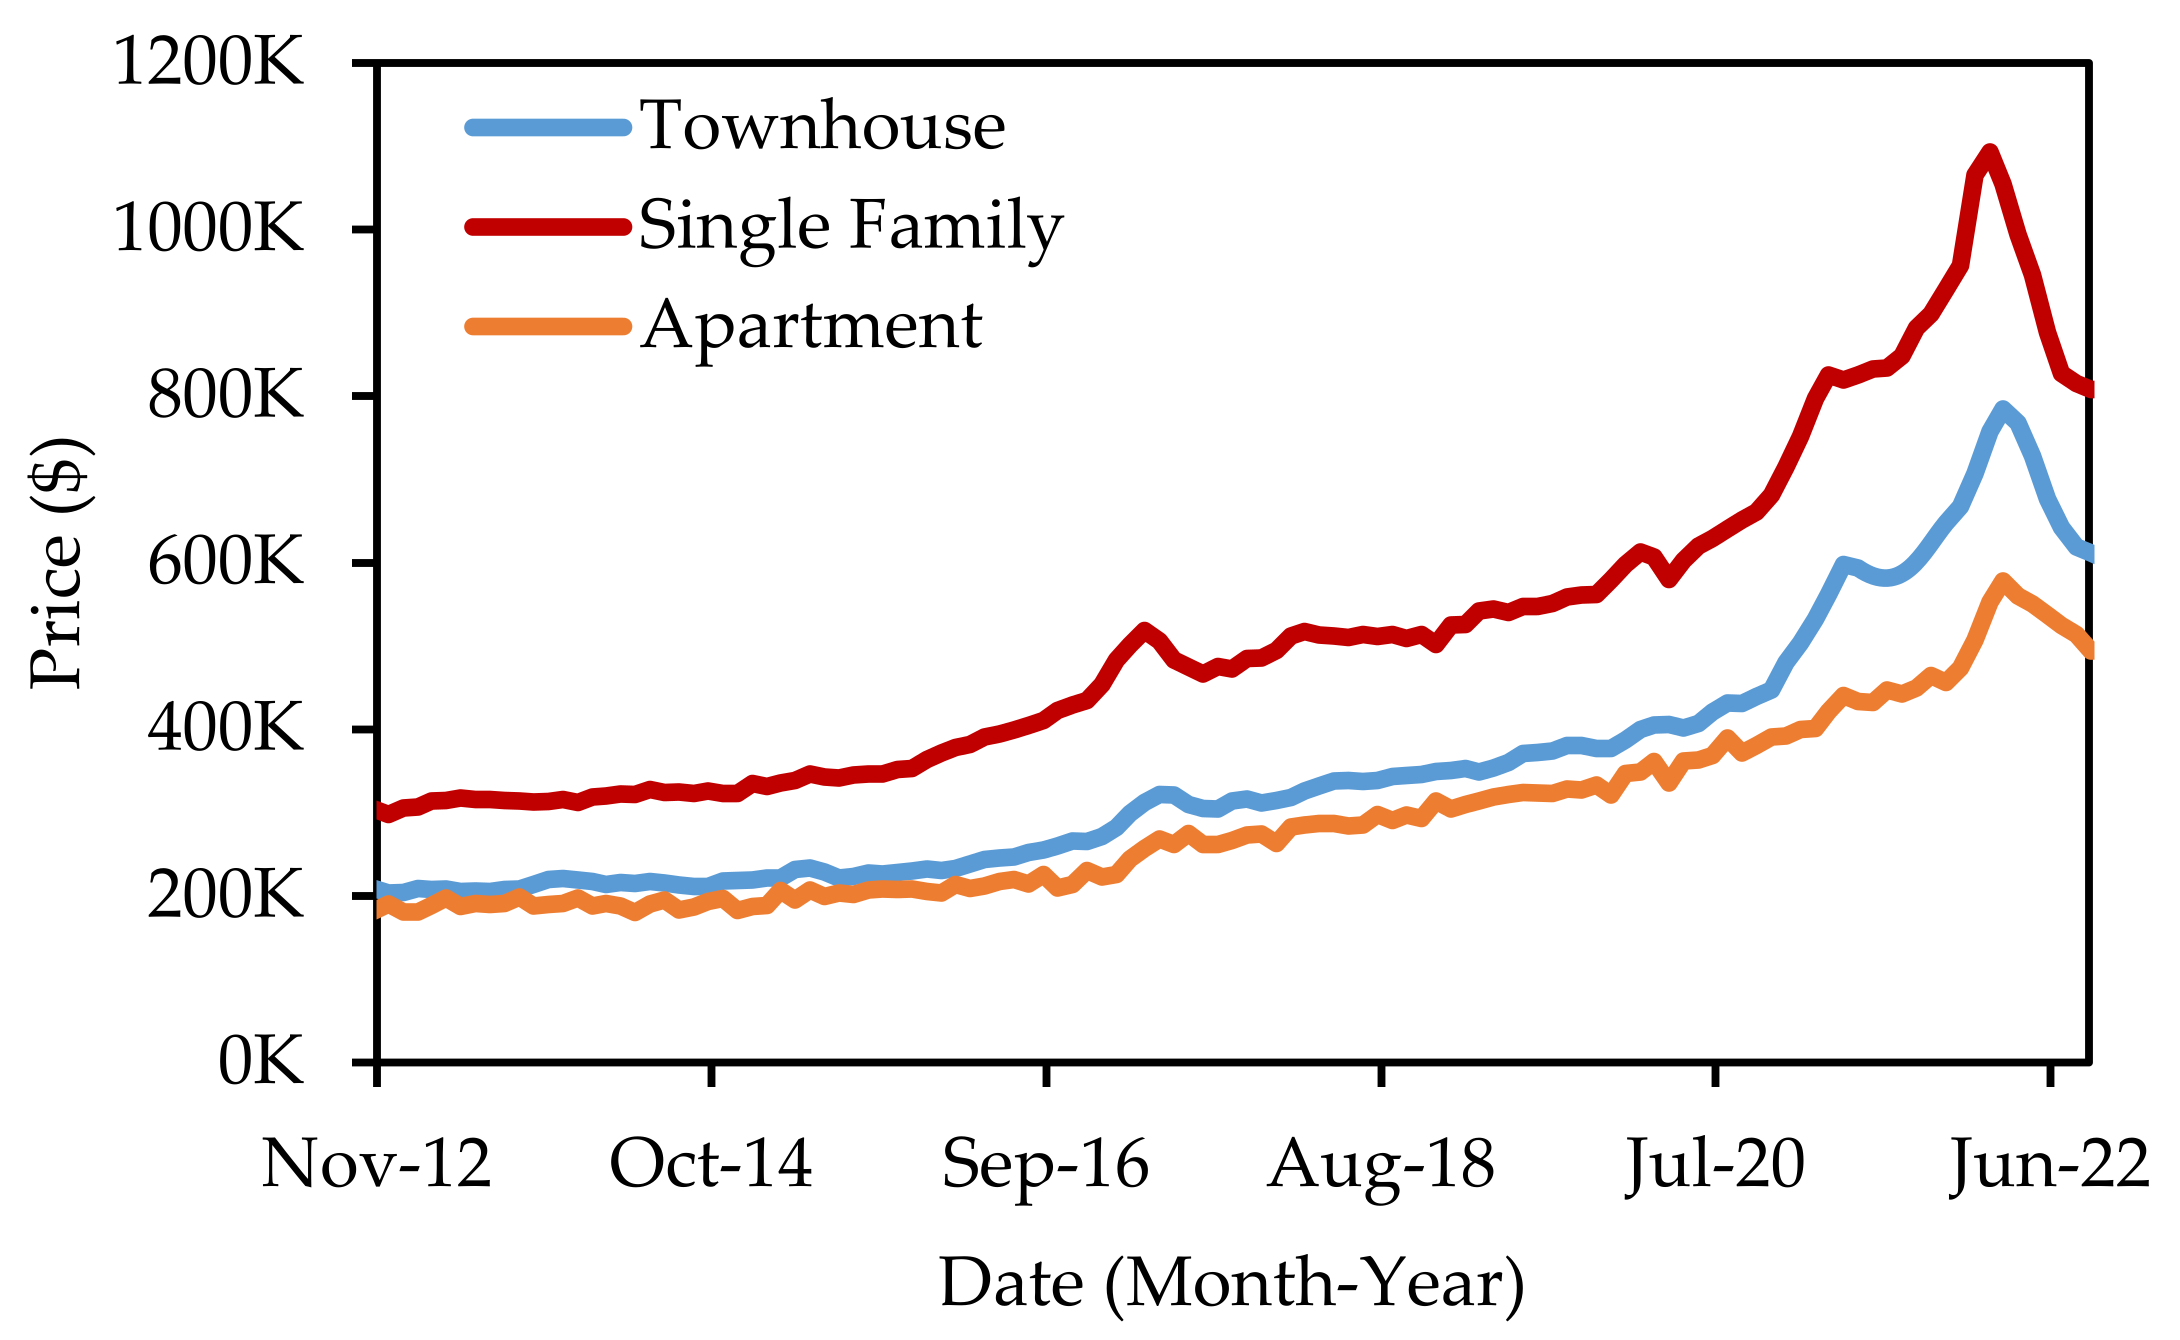
  • With benchmark single-family homes selling for more than CAD 800,000, rents for units with three or more bedrooms should be very high, as so many family households cannot afford to buy a single-family home.
  • There is very clear evidence from market research for strong demand for rentals with three or more bedrooms, not only for families with children living in the home, but also for downsizers.
  • One explanatory hypothesis is that developer decisions are mostly shaped by investor demand, rather than that of potential residents. We need to ask both actors what barriers exist for the supply of three-bedroom units.
In addition to the background research summarized above, we provided evidence of strong, potentially inelastic demand for three-bedroom apartments. On the rental side, Figure 3 shows that when rental units turn over or new units come on the market, rents for three-bedroom units are 40% higher than those for existing three-bedroom units, indicating an accelerating willingness to pay for these units.
We also argued that on the sales side, three-bedroom apartments had become a substitute for three-bedroom townhomes and single-family homes, likely due to the accelerating prices of the single-family options. As Figure 4 shows, a fall in days-on-market and growth in average price and trends for three-bedroom condos across the RoW mirrored the exponential changes seen in the RoW’s largest cities of Kitchener and Waterloo (the location of the new LRT line) for townhomes and single-family homes. These trends are consistent with three-bedroom condos being substitutes for other three-bedroom products, or within the same sub-market.
From Figure 1, we also see that the benchmark sales prices of apartments (all sizes) did not show the same exponential growth trends. As discussed earlier, the majority of apartments in this area are one- or two-bedroom. The accelerating price trends for three-bedroom apartments were not seen for apartments as a whole, indicating that one- and two-bedroom apartments are not substitutes for three-bedroom units in these markets.
We next presented evidence of income and demographic trends favoring MM housing. Our analysis assumes that younger and lower-income households have a higher propensity to choose MM housing, including apartments. Looking at the best available demographic information at that time (the 2016 Canadian Census), we argued there should be very high demand for rental units with three or more bedrooms in the RoW. Based on the 2016 Census, the youth population (0–19) comprises 28% of the RoW’s population, and young adults (20–34) comprise 22%. Together, these stats imply that the RoW’s population is younger than that of the Greater Toronto Area and provincial averages. The proportion and share of 20–34-year-olds living in medium- and high-density housing in the RoW was 53% in 2016, growing since 2011. The average number of persons per unit was projected to increase over the next decade and to remain higher than provincial averages. The average household size in 2016 was 2.6 persons. Only 24.59% of households were one-person, with 33.26% being two-person, 16.58% being three-person, 16.26% being four-person, and 9.32% being five or more persons. If even a proportion of the roughly 45% of households with three persons or more were seeking apartments, there was little to no supply to support the demand [64,95]. In 2019, the average income of renters was CAD 59,700 (down from CAD 68,600 in 2018). The average income of owners was CAD 122,600 (down from CAD 133,800 in 2018). These statistics demonstrate a likely gap for higher-middle-income renters, especially as the income threshold to purchase a home went up dramatically in 2020–2021 [96,97].
In short, these statistics demonstrated likely future demand for three-bedroom apartments due to a high and increasing cohort of younger, lower-income residents, who already have a high and growing propensity to live in higher-density housing (supported also by our previous research).
We presented extensive evidence that MM housing is not currently being supplied in the RoW. On the rental side, CMHC [98] reported that for the Kitchener-Cambridge-Waterloo (KCW) Census Metropolitan Area (CMA), rentals with three or more bedrooms represented only 8% of the existing supply. There was a particular scarcity of purpose-built rental units, with purpose-built rental apartments and row-home rentals comprising a small percentage (9.2%) of total apartment/row rental units. Further, the purpose-built rental stock was aging: 60% of purpose-built rentals in KCW CMA were built before the 1960s; for units with three or more bedrooms, the figure was 62%. Thus, what meager stock was available was mostly lower quality. On the condo rental side, while around 30% of condo units were rented out, there were too few rental condo units with three or more bedrooms to report. Therefore, average rents were also not reported. (This finding likely relates to the low number of condo builds and to investor preferences, discussed below.) This scarcity was not resulting in more new rental supply; rentals with three or more bedrooms also represented only 8% of new rentals. For purpose-built rentals, the supply was even lower. Table 1 shows that in 2020, units with three or more bedrooms were only 6.0% of the new purpose-built rental supply, despite the market scarcity of three-bedroom units.
The deficit of three-bedroom rentals was even more acute in the Kitchener downtown core (defined by CMHC as “Kitchener Central”—the location of the majority of high-tech firms and future home to the new intercity train station). In Kitchener Central, there were only 145 rental units with three or more bedrooms in 2020. These represent only 8.3% of all rentals with three or more bedrooms in Kitchener in 2020. The vacancy rate for units with three or more bedrooms in Kitchener Central in 2020 was 0%. The turnover rate was 2.6%. No new units with three or more bedrooms were constructed in Kitchener Central between 2018 and 2020 [98].
On the sales side, at the time of the memo’s authorship, Realtor.ca (the national housing listing website) listed only three three-bedroom condos for sale [99]. In short, while demand for three-bedroom MM units was clear, current and future supply was absent, especially in the downtown cores.
Although we did not develop full pro formas to calculate the potential profitability of MM housing, we did present evidence that the product had potential profitability. On the rental side, in October 2020, average rents were CAD 863 (bachelor), CAD 1076 (one-bedroom), CAD 1295 (two-bedroom), and CAD 1435 (three or more bedrooms) [98]. While this represents a diminishing willingness to pay for an additional bedroom (CAD 213 for one, CAD 219 for two, and CAD 140 for three), a three-bedroom unit should have a lower per-square-foot construction cost, as the fixed costs of a kitchen, one bathroom, and potentially one parking space are distributed over more area. Further as seen earlier in Figure 3, rent premia for new three-bedroom units are substantially higher than those for one- and two-bedroom units, indicating higher market potential for rent than shown in the 2020 data. Specific to Kitchener Central, the average rent for three or more bedrooms in Kitchener Central was CAD 1627, 4.6% higher than the rest of the KWC CMA. (Note that this is for older housing stock as there were no new builds, and rent growth for these units was not reported due to their low numbers.) On the sales side, while the authors did not have access to all sales data, in June 2021, a 1500 sq. ft. three-bedroom, two-bathroom condo in the Waterloo downtown core sold for CAD 745,000, comparable to the three-bedroom single-family home sales price. We argued that at an estimated price point of about CAD 600,000, construction of three-bedroom condo units should have been profitable. While construction costs are only a portion of final unit costs, assuming a size of 1500 square feet (deemed ideal by a majority of the respondents to our 2016 rental survey) and using construction costs from the Altus Group [46], construction costs for three-bedroom condo units should range from CAD 202,500 to CAD 300,000 per unit.
We tempered our arguments in favor of the potential profitability of three-bedroom apartments by noting that our previous research emphasized that Kitchener–Waterloo apartments are not providing the bundle of attributes (unit size and greenspace access) that buyers need [30,58,59,60,61]. In short, apartments can solve the unit size problem, but unless they also provide access to small private or high-quality public open spaces, they are unlikely to appeal to MM buyers.

4.4. Results of Discussions with Real Estate Industry Stakeholders

Our discussions of the data narrative with developers revealed nuanced evidence. While they have access to similar information, developers express a diversity of beliefs and strategies, with some seeing demand for MM housing and beginning to actively experiment with new supply, and others remaining unconvinced of this market in the RoW.
Our initial hypothesis was that a gap between perceived and actual demand for three-bedroom apartments was the major barrier to their supply. Locally, historical discussions with some municipal staff and developers have reflected a deep skepticism about the market for and feasibility of MM housing. The commonly heard expression has been “the demand is not there”. Some of this skepticism continued among developers in our recent discussions. A commonly expressed belief is that three-bedroom units would be too expensive for potential buyers. This rhetoric contradicts the acknowledged point that per-unit costs for three-bedroom units are lower than those for smaller units, as three-bedroom units need only one kitchen, often one parking place, and potentially no more bathrooms. Implicitly, developers express skepticism that renters or buyers would pay the premium required for the three-bedroom units, based on the belief that more attractive substitutes exist in the market. For instance, developers assume that if the price point of a three-bedroom downtown condo is comparable to that of a three-bedroom suburban townhome, all local buyers would choose the suburban townhome. Thus, evidence of latent market demand may not be sufficient to convince developers of profitability; rather, a critical mass of successful examples would be needed. The situation is confounded by the fact that most of the few three-bedroom apartments that have been constructed in the downtown cores are in high-rises, with no immediate access to private or public greenspace. It is not a surprise to the authors that demand for such units would be weak, given our previous research.
However, our discussions revealed a set of much more nuanced and complex barriers to MM housing supply, which were created and mediated through interactions between the investment, development, and planning realms. Our initial mental model of the market dynamics focused mainly on demand-side actors (renter and buyer households, acknowledging their diverse cohorts), developer actors, and developers’ perceptions. We needed to modify our mental model to better articulate the dual nature of land and housing markets (as a use good, for living in, and an investment good, for asset value) and thus to also include diverse investor actors—construction finance and individual condo pre-purchase investors.
Discussions revealed additional profitability constraints to the supply of MM housing, especially in transit areas where land values reflect possible profits from small-unit high-rise housing. Again, we needed to modify our conceptual models and narrative to include the dynamics behind land-value uplift. Land-value uplift occurs when a new investment (in our case, the ION) creates increases in expected and then realized land values due to improved accessibility and expected TOD [100].
Our discussion with developers also emphasized project risk as a central constraint to supply decisions. Beyond the uncertainty of direct resident demand, developers stressed the importance of other sources of market uncertainty, emphasizing the important role that construction cost volatility plays in the decision to develop, postpone, or cancel a project. Looking at broader market trends, developers also reported tracking unit uptake and delaying development when uptake decreased.
Discussions shed light on the important, and often constraining, role that project finance played. Locally, developers reported lender requirements for highly specific existing demand evidence, requirements to pre-sell 60–80% of units to obtain additional financing, and a minimum 10–15% return on their investments. For large-scale high-rise, small condominium builds, developers can partner with large investors, but they need to demonstrate substantial pre-sale (up to 80% of units), need to demonstrate potential project returns (internal rate of return) of 10% or higher, and need to provide highly specific evidence of demand and previous success of the potential build in the local market. Evidence of latent demand [89] will not suffice—the unit type needs to have been previously sold in the local market.
Condo brokers and developers report that there is often a gap of at least 3 years between pre-sales and taking possession of units. Discussions with realtors and a local condo marketing firm revealed how this gap might limit pre-sales of three-bedroom units. Buyers looking for such family-sized units often have immediate needs (for example, an expanding family). Beyond this, especially in volatile housing markets, buyers might not want to give up the option value of purchasing a single-family home, which has features such as private greenspace and sufficient living space that most family households desire. Resident buyers also tend to look towards realtors and Realtor.ca for potential homes, and condo units do not appear on these sites until units are almost ready for occupancy. In short, there are substantive barriers to residents participating in pre-sales of family-sized units.
While no developer suggested this barrier, it is possible to conclude that investors purchasing condos would not prefer three-bedroom units for several reasons. First, they would often be rented to households with children, and investors might perceive that units with children receive more wear and tear. Second, a small family could remain in a three-bedroom unit indefinitely—as a young couple, with 1–2 children, and as downsizers. When regulations limit rent increases, turnover is the only opportunity for investors to substantively raise rents. Further, in volatile real estate markets, such as Ontario’s current falling market as shown in Figure 1, investors have an incentive to keep condo units empty, as it increases their ability to liquidate (In Ontario, buyers need to honor an existing lease in a purchased unit in most circumstances.). Again, investors therefore benefit from short leases and frequent turnover.
Finally, land-value uplift from increases in the allowed density of housing builds (up-zoning), or anticipated up-zoning approvals, clearly limits what can be built. From our previous research, discussions with greenfield developers and discussions with realtors, it is clear that products such as low-rise stacked townhomes with small private yards and balconies are viable, and increasingly popular, new housing models. They further have the advantage that builds can be staged so that initial units can be quickly completed, providing revenues to finance the next build. However, developers report that land in intensified areas, where small high-rise condos have succeeded, is too expensive for low-rise projects to be viable, even though construction costs per square foot are substantively lower for low-rise builds. Thus, seemingly counterintuitively, real zoning limits to low-rise height may contribute to the development of more affordable housing.
While zoning is frequently asserted to be a barrier to housing supply in Ontario, our discussions focused only peripherally on zoning. Station-area planning in the local cities envisioned generous up-zoning along the transit corridor, and in anticipation of this up-zoning, rates of approval of Official Plan and Zoning By-law Amendment applications have been high, with approvals granting zoning higher than planned densities [101]. Some developers, however, expressed a preference for building as-of-right, rather than going through the additional time and financial cost of amendment applications.

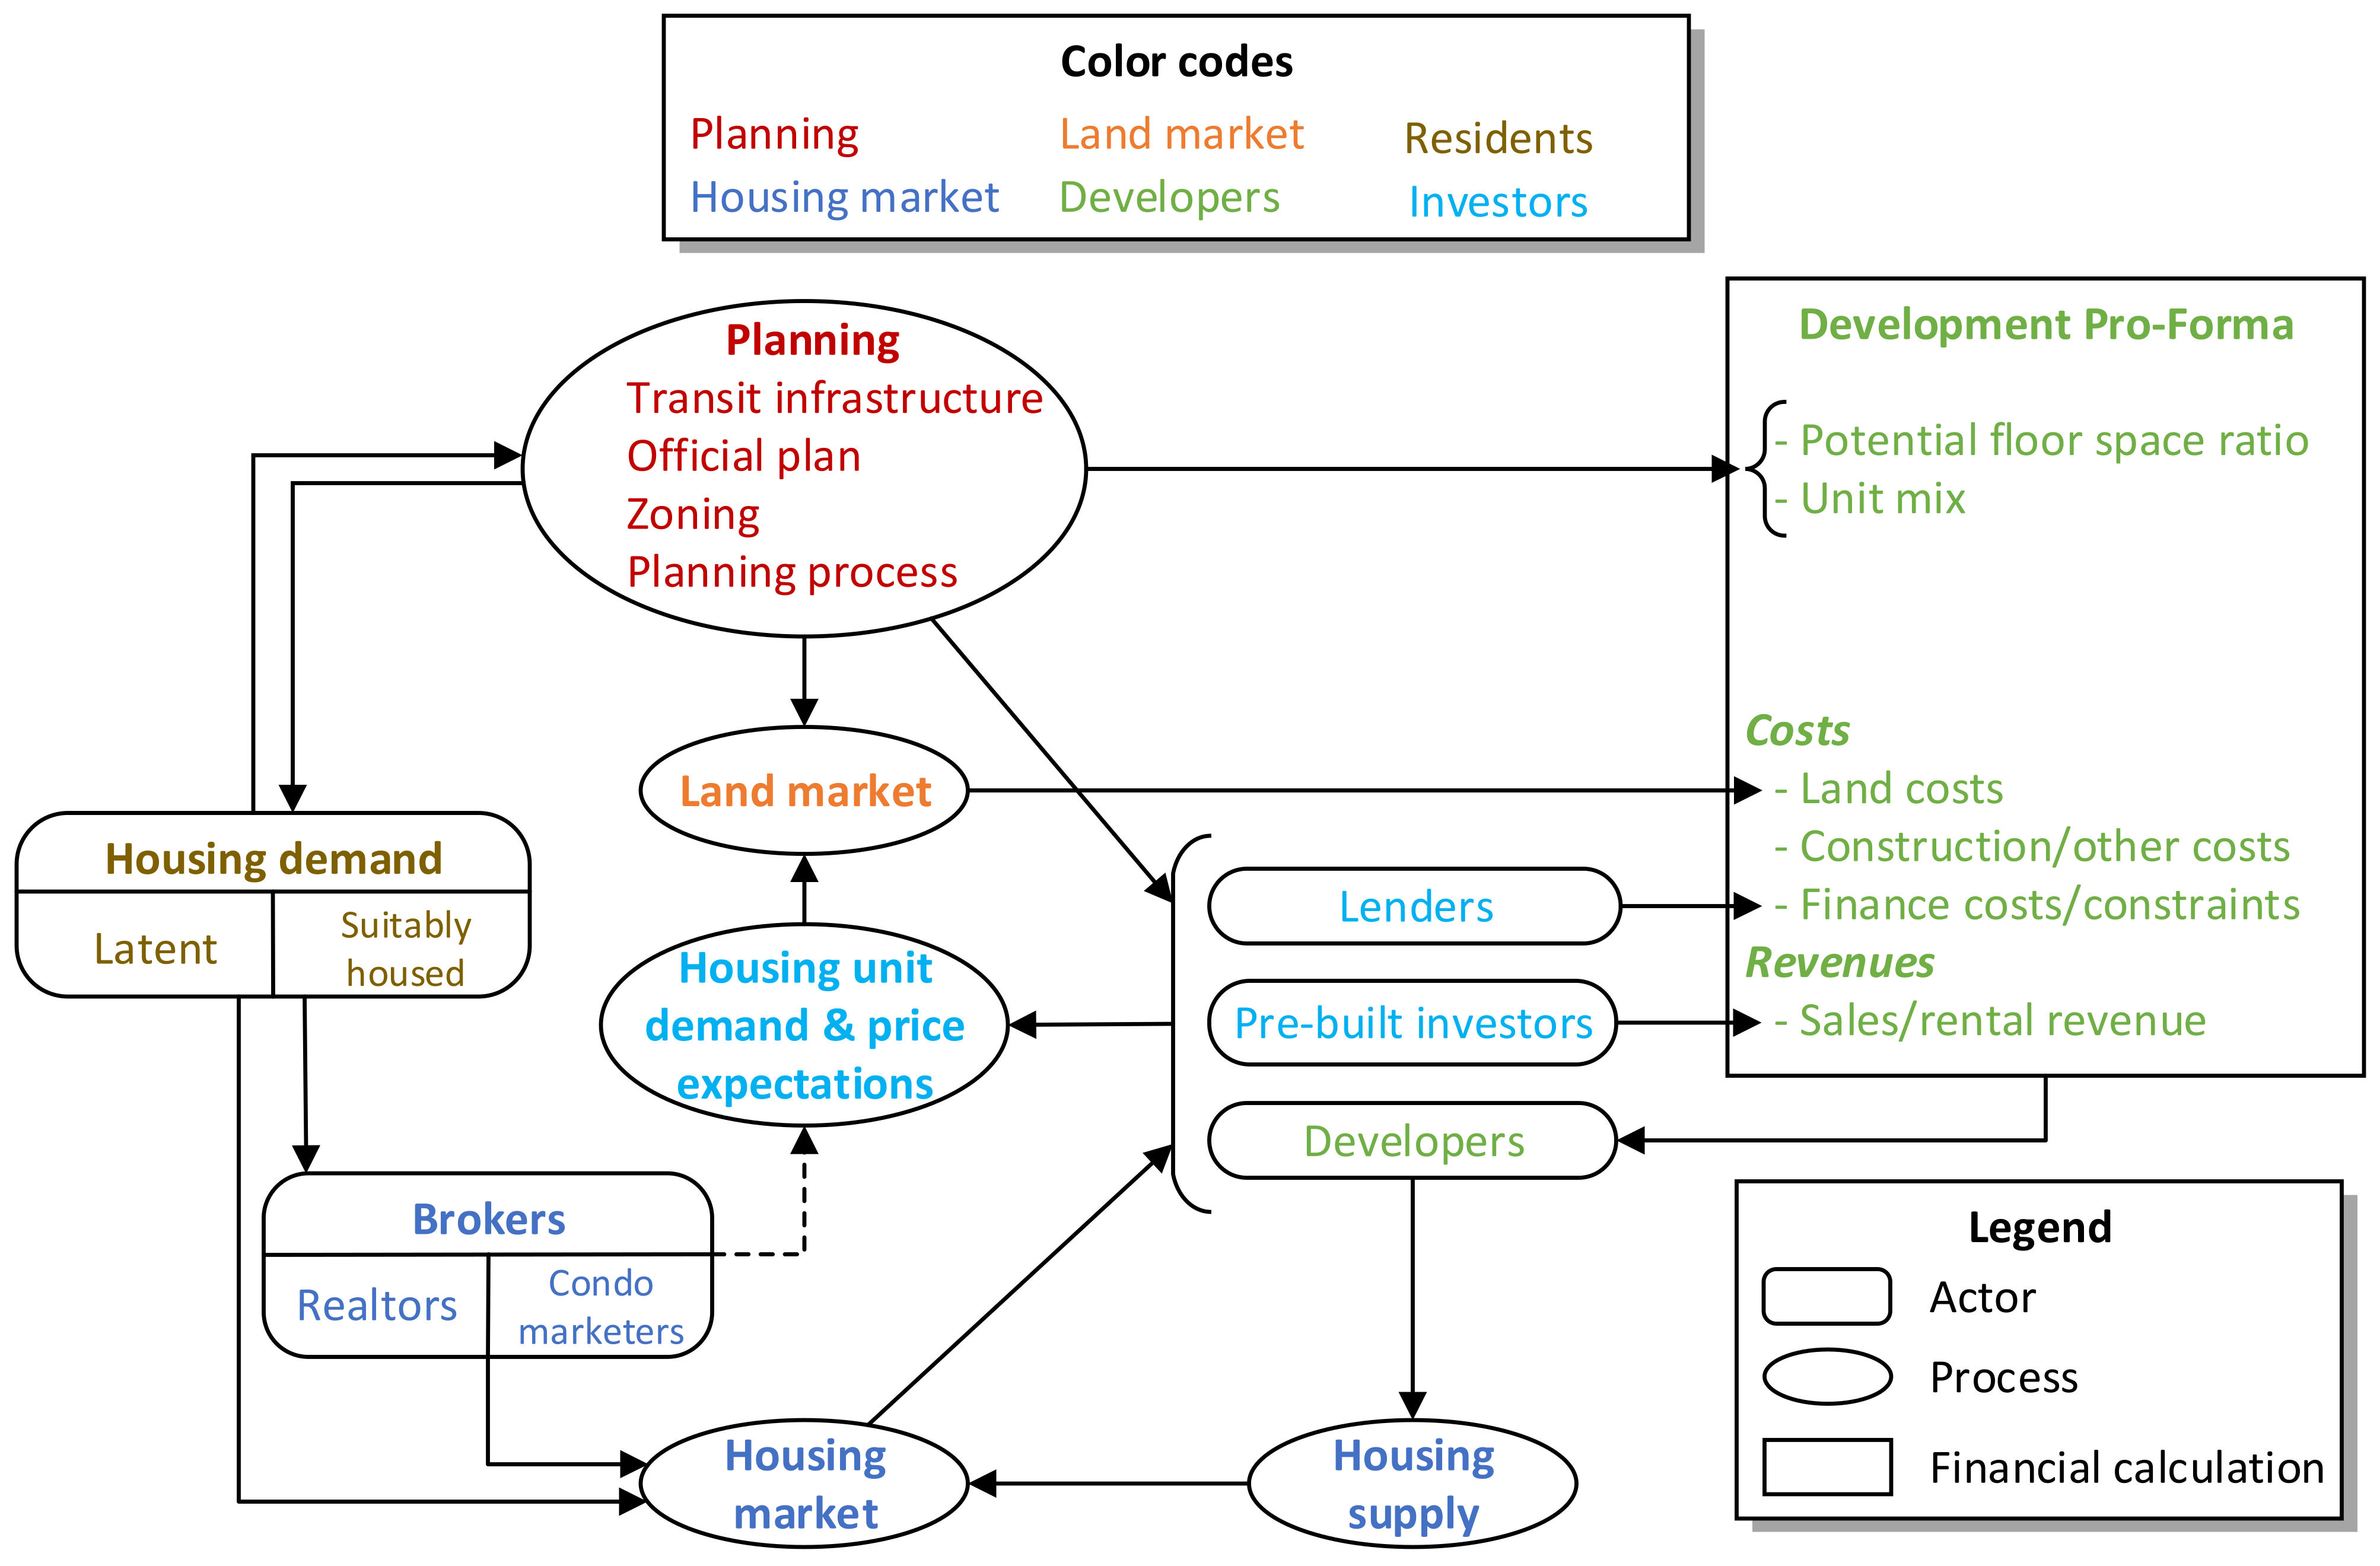
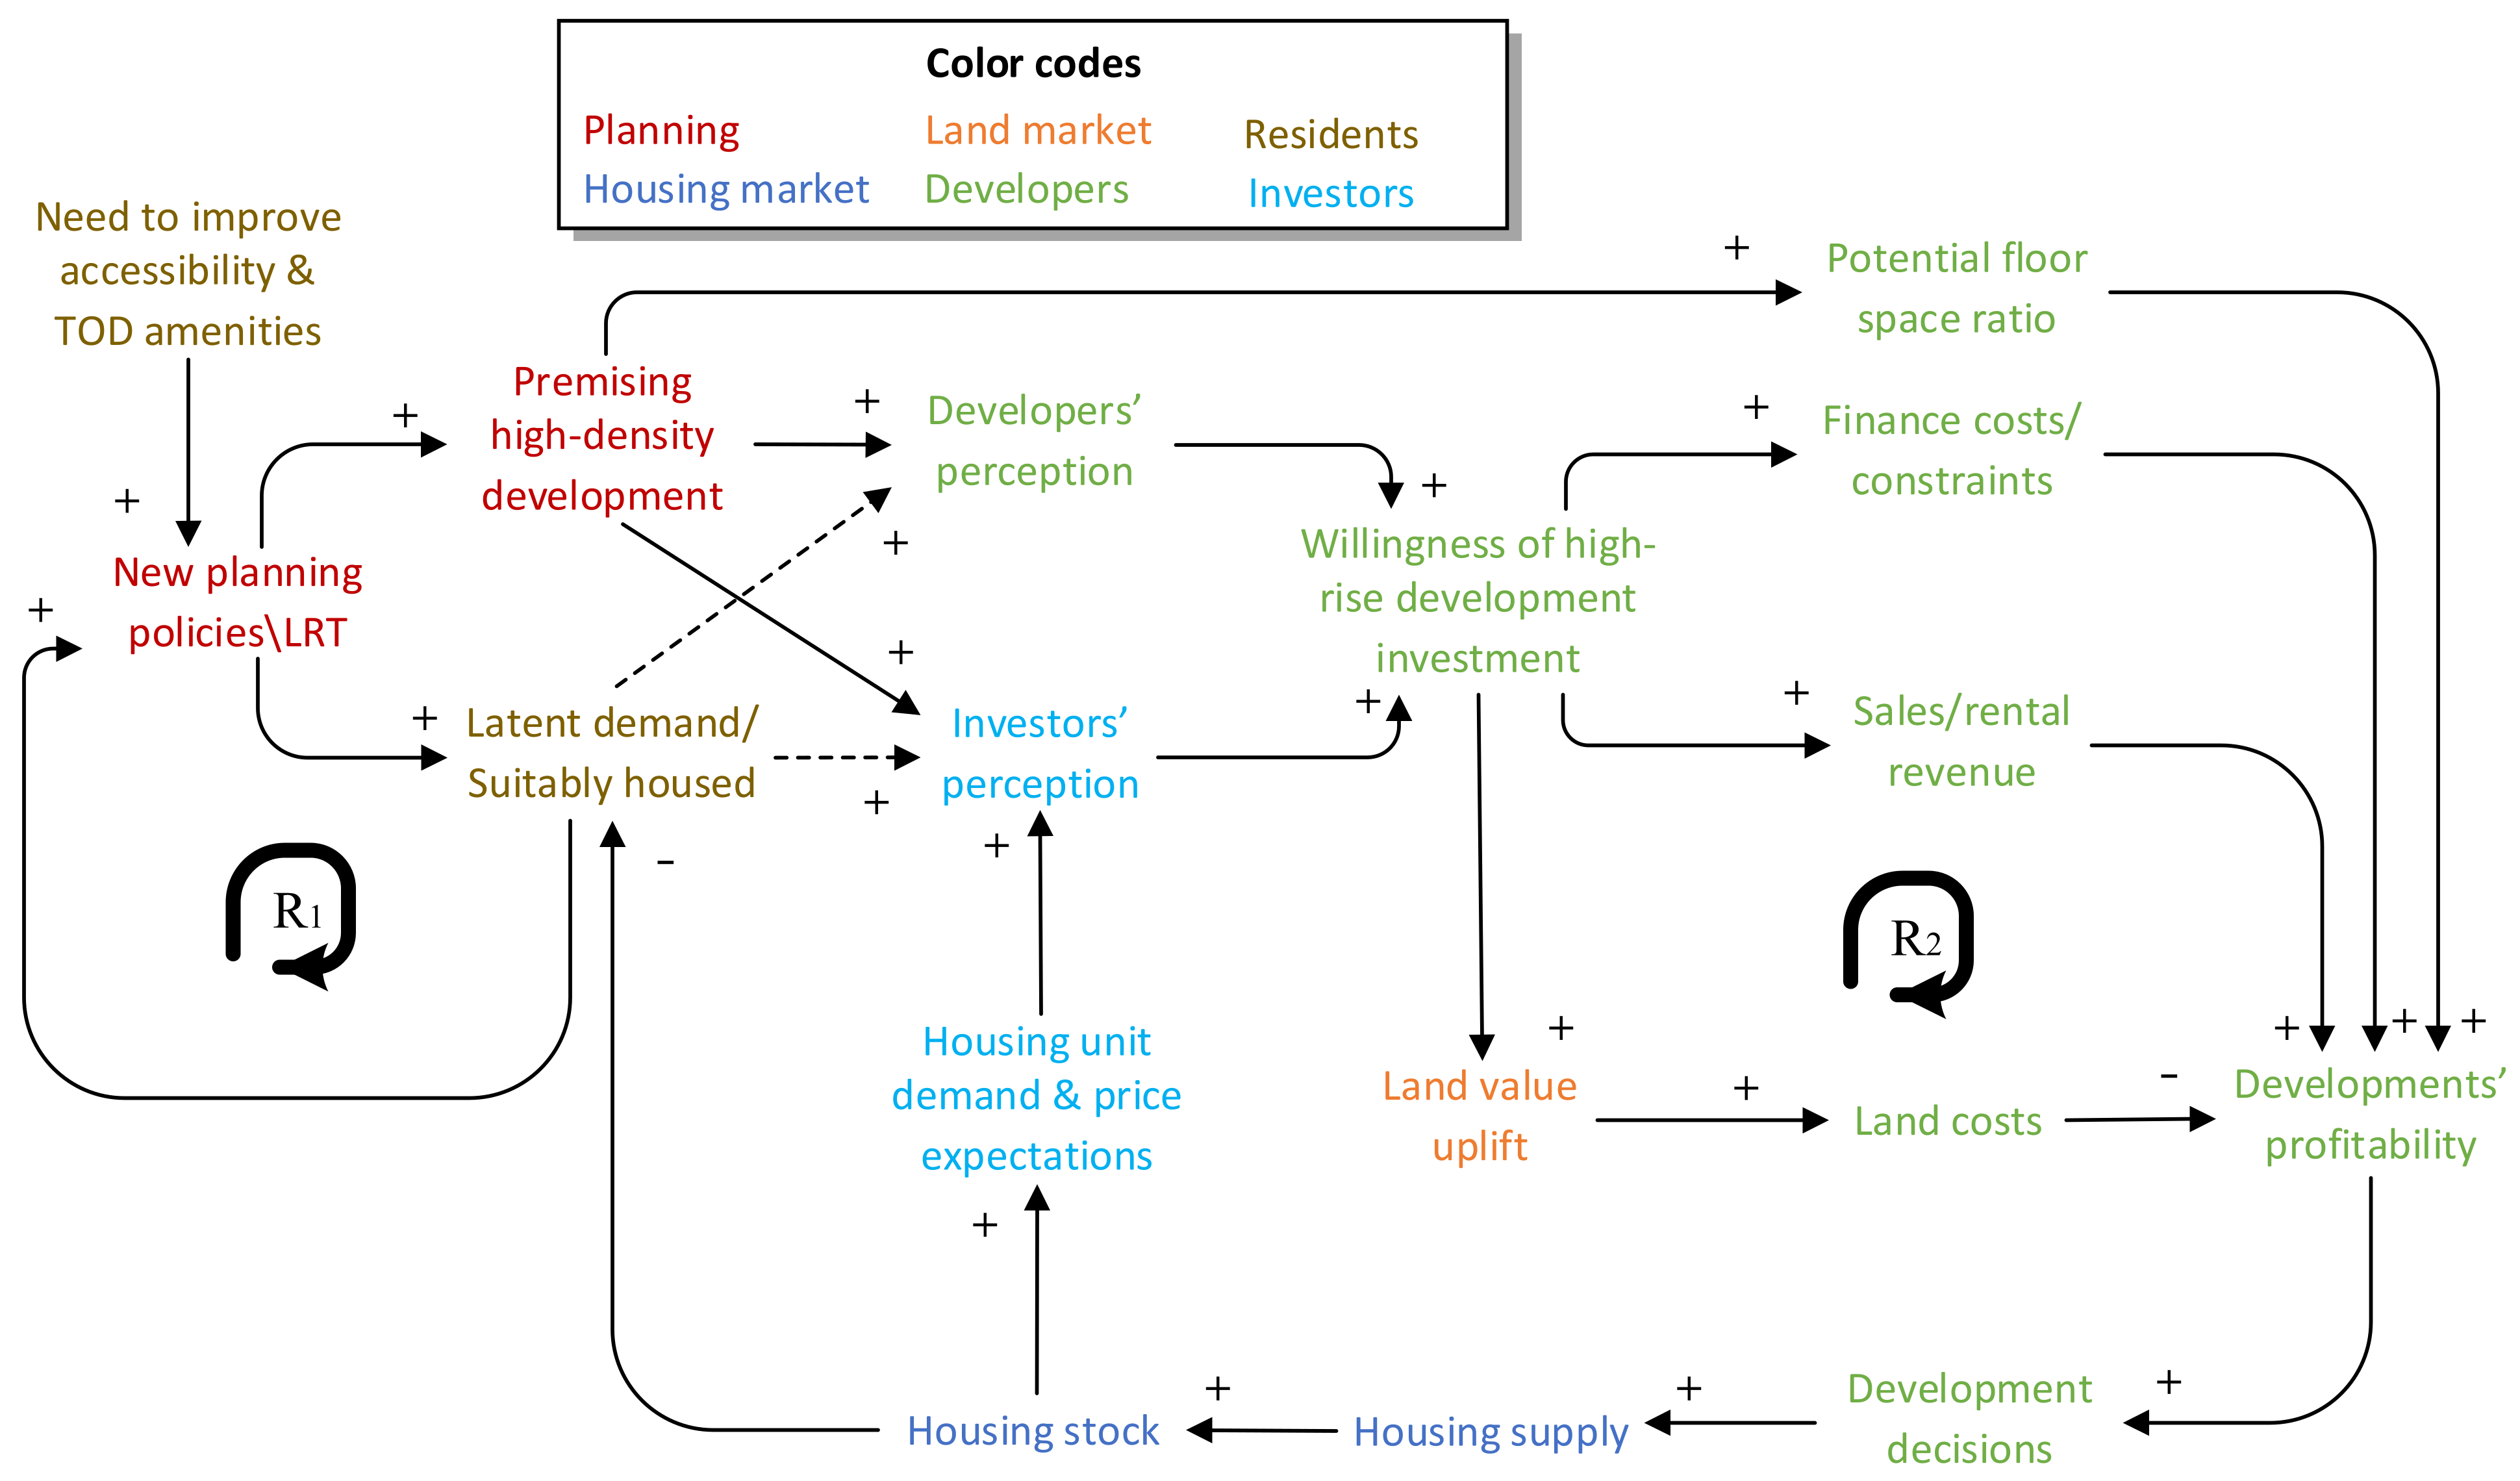
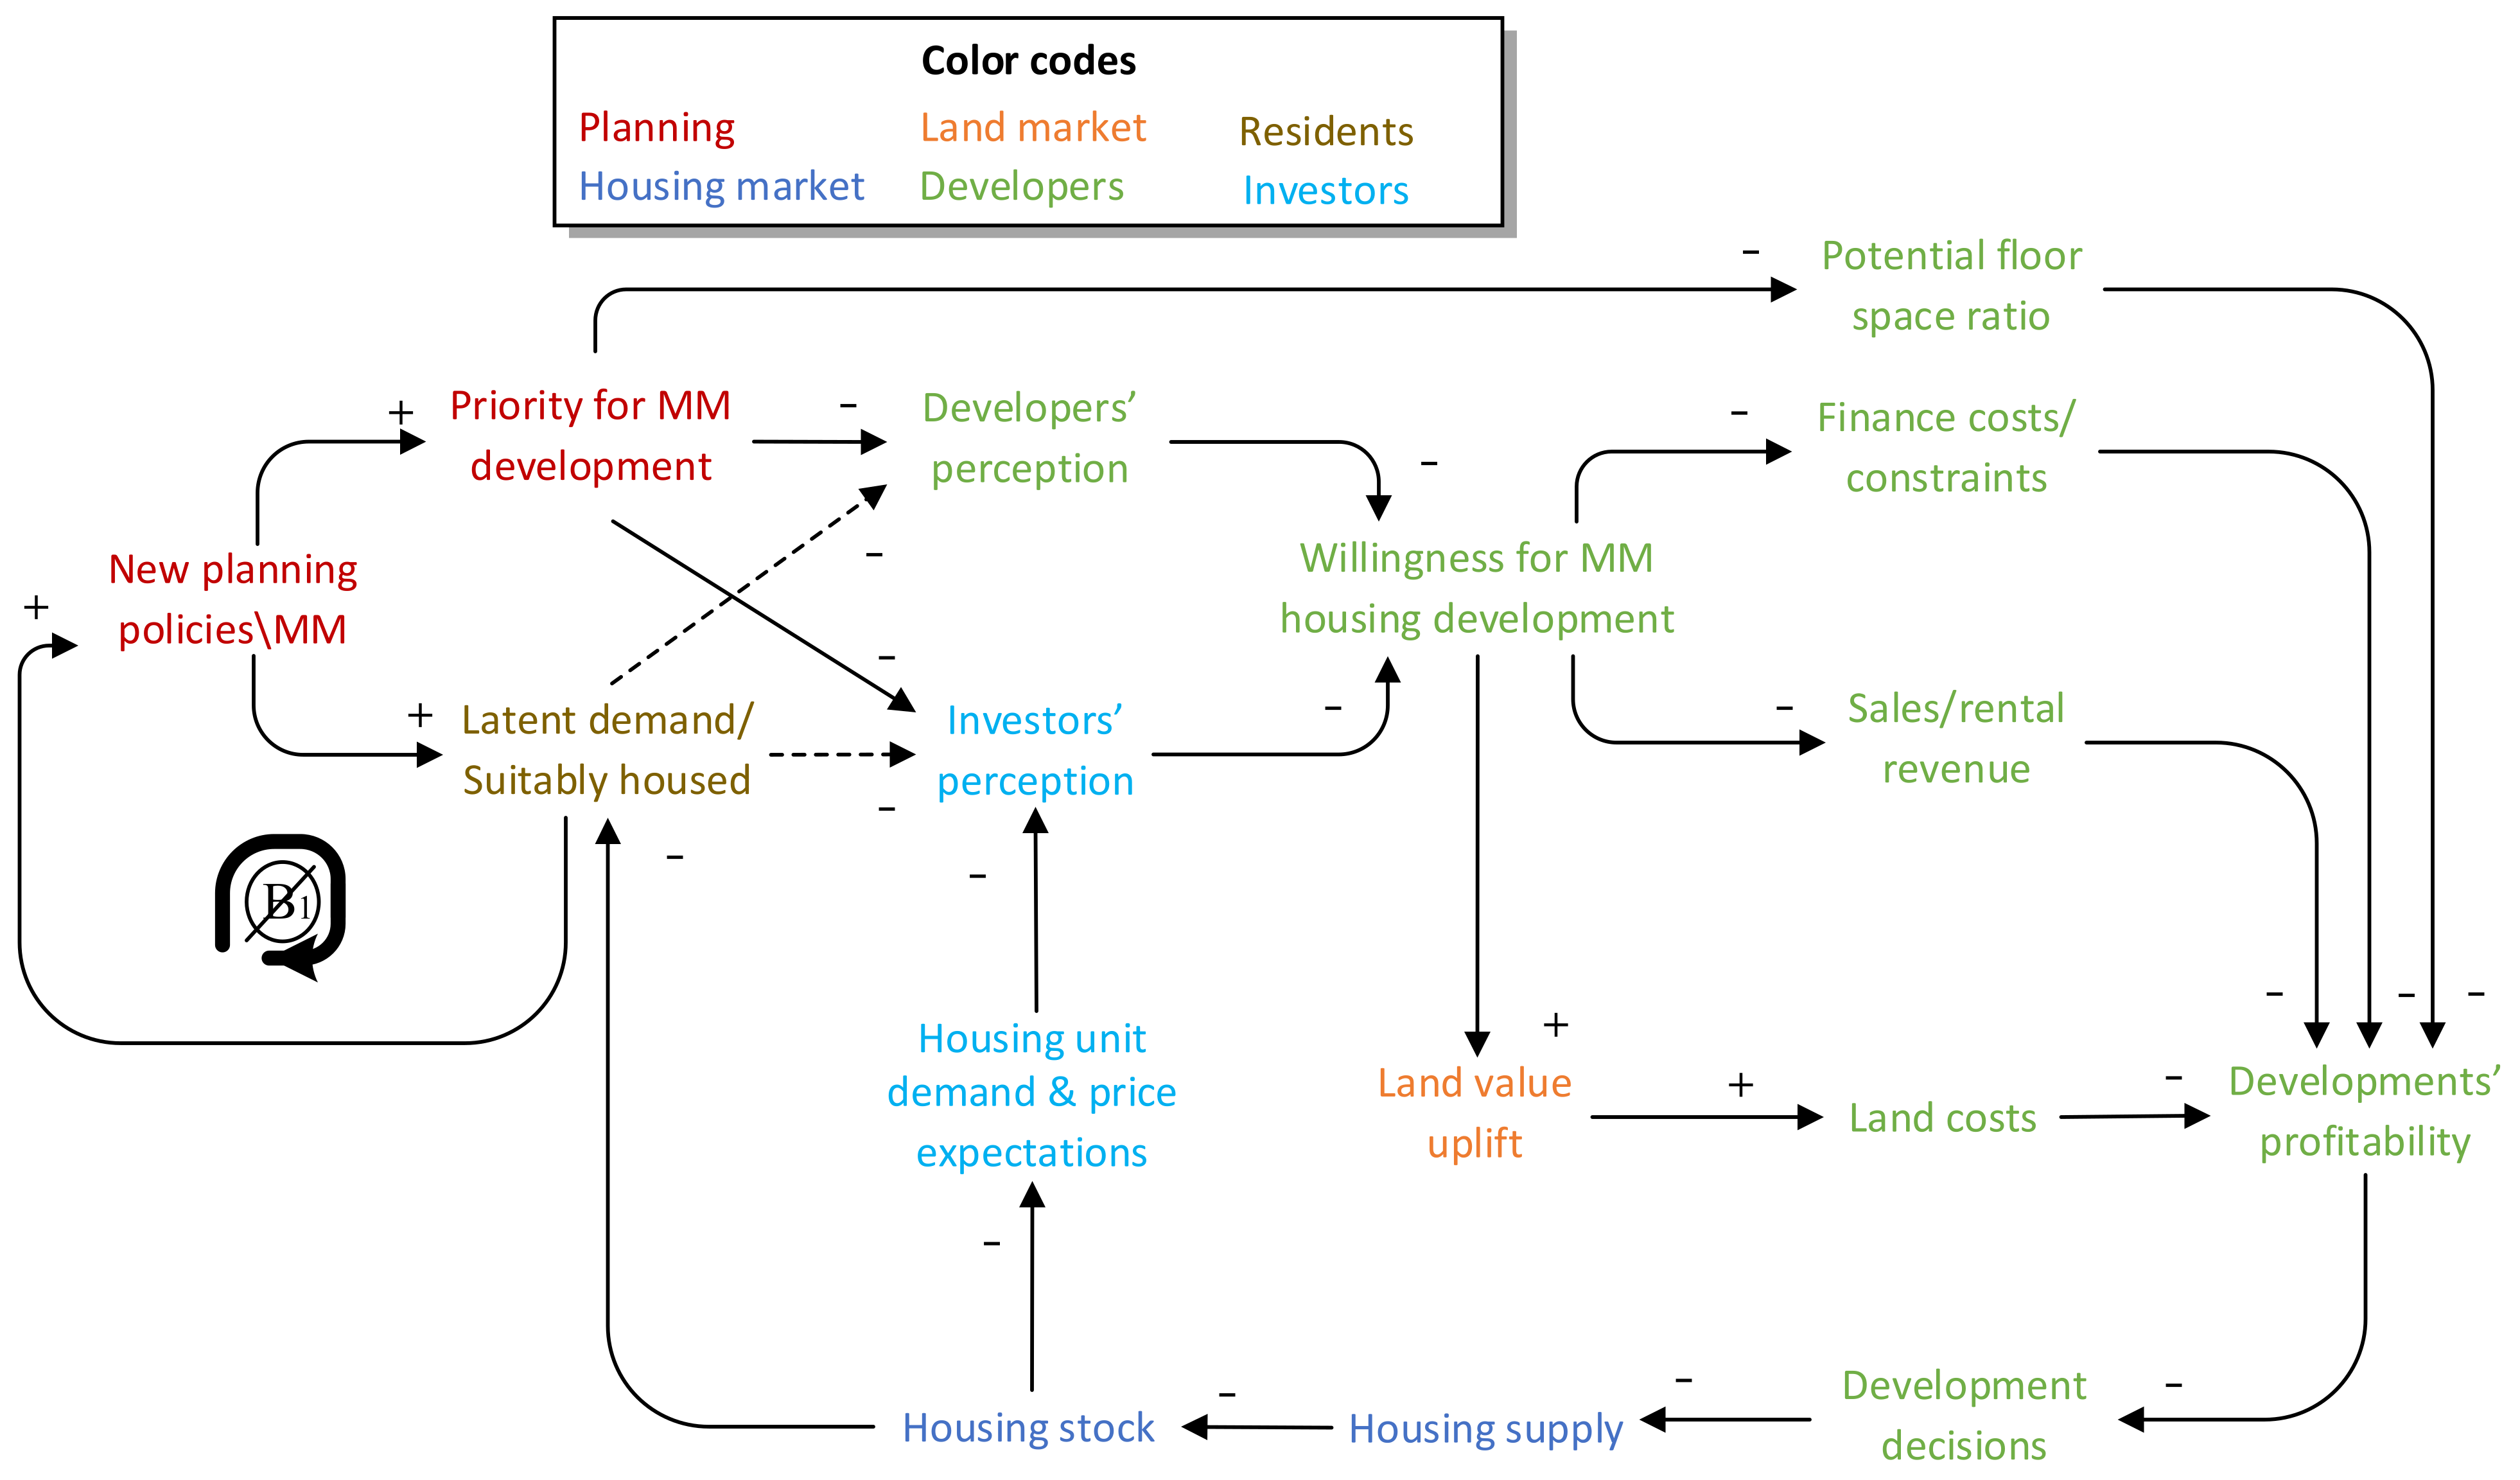
5. Qualitative Systems Mapping of Development, Investment, and Planning Interactions

Based on our literature review and stakeholder conversations, we formalized our system understanding through a qualitative systems diagram (Figure 2) [68]. The diagram shows the key actors (residents demanding housing for rental or sale, real estate brokers, developers, and financial actors: lenders who finance construction and investors who pre-purchase condos). It also shows their main interaction environments: the planning realm, land markets, and housing markets. Interaction environments are limited by the actor’s roles. Residents seeking housing participate in housing markets, interacting with brokers and, to some extent, with planners. Realtor brokers interact directly with residents and planners, but less frequently have direct interactions with developers. Condo brokers interact with some residents, but primarily with developers and pre-build investors. Developers interact with lenders, pre-build investors, and planners. Within this system, Figure 2 highlights the important role of housing unit demand and price expectations, and it shows how development costs are impacted by key actors and processes.
Based on Figure 2, we developed a causal loop diagram (Figure 5) to hypothesize how these complex processes may lead to a self-reinforcing lock-in of high-density, small-unit-size condo builds in the RoW. At the regional level, the planned LRT promised to improve accessibility and bring TOD amenities. The RoW’s stated intensification goals, along with station-area plans, signaled a permissive planning for high-density development, reflected in the developer’s pro forma as higher potential floor space ratios. Together, these planning changes created latent demand from potential residents seeking improved accessibility and TOD amenities. Planning changes also led investors (lenders and pre-build investors) and developers to anticipate this latent demand—although given their bounded rationality, they may or may not have correctly perceived such demand. These perceptions led to a favorable assessment of the profitability of high-rise developments, which motivated them to invest in new high-rise builds, thereby contributing to housing supply and increasing high-rise, small-unit housing stock. New residents whose demand was correctly perceived then located in downtown cores through rental and housing market interactions. These successful housing market outcomes positively reinforce the planning priority for high-rise development (reinforcing loop 1). The positive price expectations for high-rise builds by the housing investors led to an increased willingness to pay for properties where additional high-rise development would be feasible. These dynamics created an expectation that profitable high-rise development was possible on any parcel in the downtown cores, leading to land-value uplift in the land markets. As long as there was investor or resident uptake of housing units (real or expected), this dynamic created a self-reinforcing lock-in of the high-rise development model (reinforcing loop 2).
Those whose needs were not met (family-sized households) remained in latent demand. Locally, planners have begun to perceive this latent MM housing demand and have responded by creating a more permissive residential parcel zoning in Kitchener and targeting MM housing in the RoW’s most recent Official Plan update. However, we argue that the planner’s attempts to increase MM housing supply are likely to fail, because multiple dynamic factors “lock out” MM housing in our downtown cores, as well as any areas where developers anticipate that high-rise builds would be approved. We illustrate this “broken” balancing loop in Figure 6. While the new planning interventions signal a priority for MM development, developers and investors may not perceive the latent demand for MM housing. MM housing also has a reduced floor space ratio relative to high-rise builds, meaning fewer units built on costly land (due to land-value uplift that prices land by the potential profitability of high-rise builds). Without strong evidence of existing demand and profitability, lenders will not provide construction financing, and pre-build investors will not purchase units. With no MM supply of the product, latent demand will not be revealed, locking out new MM housing supply. These dynamics directly reflect the narratives put forth in conversations with our developer partners—in the downtown cores, MM builds are no longer cost-feasible. Therefore, the planning priorities will not be realized without other interventions.

6. Conclusions and Implications for Planning

6.1. Concluding Recommendation for Planning and Housing Markets

Our discussions and analysis suggest particular planning and policy responses, some already acknowledged, and some novel. While a full review of factors impacting the supply and success of MM housing is beyond the scope of this paper, recommendations arising from our analysis include the following:
  • In areas targeted for MM housing that would otherwise be under pressure for land-value uplift reflecting potential high-rise development, limit this uplift by enforcing low-rise zoning (i.e., refusing development applications for higher height and density). This suggestion may contradict the belief by some planning and economic actors that markets allocate land to its highest and best social use. They do not, as land and housing markets incorrectly and incompletely incorporate external and public good values [102]. We also remind the reader of the dual market for housing as both a use and investment good. Investors will push land allocation to its profit-maximizing use as an investment good, not a use good. Thus, planning and zoning have important roles to play in correcting market failures. Planning interventions may have the capacity to create successful “balancing loops” if they limit land-value uplift.
  • Simplify the planning and approvals process by modifying single-family zoning to allow multiple units on all residential parcels “as-of-right” (i.e., without submitting an Official Planning or Zoning By-law Amendment application). This widely supported planning measure has been implemented in various jurisdictions around North America to differing extents, including Kitchener (duplex plus two additional units) [90]; Minneapolis (three units) [103]; Grand Rapids, MI (four units) [104,105]; Portland (multiplexes) [106]; California (four units) [107]; and to geographically limited extents in Atlanta, GA [104], and Saint Paul, MN [17].
  • Simplify the planning and approvals process by creating easily approved standardized MM typologies. Our future research in the RoW is focused on this goal. In the RoW, site plan applications are currently required for residential builds of three units or more, but not for duplexes, incentivizing duplex builds over higher-density MM. While existing examples of this approach are scarce, the City of Edmonton held a contest to create MM architectural typologies [108]. Moreover, Saint Paul, Minnesota, facilitated the housing permission by including MM housing types such as duplexes, triplexes, townhomes, small-scale multifamily, and accessory dwelling units [109].
  • Provide non-profit finance to create reasonably affordable MM builds, allowing for support by broad evidence of potential demand. For example, a joint project between the City of Minneapolis and the Minnesota Housing and Land Bank Twin Cities provides MM finance of up to USD 70,000 to USD 95,000 per affordable unit, with higher subsidies for larger units [17,110]. The State of Michigan has provided no-interest construction and rehabilitation loans for MM homes for moderate-income residents [111].
  • Create programs to facilitate co-op builds, where three or more households collaborate to finance, design, and build an MM housing build, as undertaken by the City of Vancouver in low-density neighborhoods targeted for MM housing [22]. The Government of Canada has also initiated a new Co-operative Housing Development Program to expand co-op housing in Vancouver and across Canada to stimulate a new generation of co-op housing [112].
  • Acknowledging the potential bias by condo investors against renting to families with children, implement planning requirements for unit mix (including three-bedroom units), minimum sizes (1200–1500 square feet), and adequate provision of on-site private and proximate public greenspace and playgrounds. Unit-mix requirements and recommendations have been implemented in Grand Rapids, MI [104]; Montreal [113,114]; and Toronto [115].
  • Facilitate non-profit or municipal pre-purchase of three-bedroom condo units to bridge the gap between end-user resident demand and the financing need for condo pre-sales. We have not found previous examples of this “bridging broker” role for non-profit or municipal entities.
  • Facilitate MM demonstration projects to demonstrate financial feasibility and market uptake, reducing uncertainty for both the for-profit and non-profit housing supply sectors. Ideally, these demonstration projects should be co-designed with end-users to ensure their market viability. Such demonstrations may be particularly important given the finding by the authors of [23] that new MM builds are more likely in neighborhoods with existing MM housing.

6.2. Recapping our Complex Systems Lens

This paper has demonstrated how a complex systems lens, supported by qualitative systems mapping, can help to identify the potential and limitations of the planning process to address housing market challenges. Planning plays direct and indirect roles. Major planning investments and up-zoning can create path-dependent change, not only by incentivizing new populations to seek residence in an area, but also by creating expectations of new demand by developers and investors. These changes can create positive feedback loops that lock in certain kinds of development—where there is strong evidence of existing demand—and lock out novel housing types—where demand evidence is weaker, or the new products are “priced out” through land-value uplift. Our narrative emphasizes how market interactions between heterogeneous resident, planning, developer, and investor actors in the planning and land/housing market realms create reinforcing feedbacks.
Our systems view also has allowed us to identify potential solutions—some of which may need to be implemented concurrently—that might spark supply of MM housing in our study area. While some have been implemented elsewhere, others appear to be novel. We argue that our systems analysis allows us to move beyond the data narratives most often used to drive policy locally, without major investments in data and quantitative modeling. Thus, a systems analysis approach can facilitate improved policy design by incorporating an understanding of system dependencies and feedbacks. Such analysis thus has the potential to create policies that avoid misaligned incentives and unintended consequences.
Finally, we wish to emphasize that systems analysis need not be quantitative to accomplish its main goals of understanding systems and the implications of their causal mechanisms and identifying potentially effective interventions. The work that we have presented can be effectively communicated verbally, through a qualitative systems map, and through causal loop diagrams. In participatory research, there may be benefit to taking the simplest and most universally understood means of communicating systems dynamics. Basic systems diagrams can then be used to support the development of quantitative models [84].

6.3. Limitations and Future Work

This research describes an expectations-driven positive feedback loop, which accelerated planning approvals, high-rise housing supply, and land-value uplift. While such market dynamics have been observed throughout history and characterized as “bubbles” [116], market fundamentals such as limits to rents, increasing land prices, and even out-migration should create balancing mechanisms, limiting the persistence of the feedback loop. Locally, housing supply has slowed, but this has been due to external increases in construction costs and rising interest rates, rather than balancing due to market saturation [117].
While our case study shared generalizable features with other planning and housing market regimes across North America, local planning regulations and market conditions create particular constraints and opportunities for our location. More generally, even though some of our proposed solutions have been implanted elsewhere, their longer-term impacts in the real world are not yet completely understood. In frequently shifting policy and planning environments, it can be challenging to assess the empirical impact of interventions. Future research with our planning, development industry, and resident partners locally should, however, allow us to develop and test the interventions proposed here and assess how effectively they can harness planning and finance tools to better incentivize MM housing builds.

Supplementary Materials

The following supporting information can be downloaded at: https://www.mdpi.com/article/10.3390/land12020434/s1, Video S1: Video description.

Author Contributions

Conceptualization, D.C.P., S.V.S. and K.W.; methodology, D.C.P.; formal analysis, D.C.P. and S.V.S.; investigation, D.C.P.; resources, D.C.P.; data curation, D.C.P., S.V.S. and K.W.; writing—original draft preparation, D.C.P. and S.V.S.; writing—review and editing, D.C.P., S.V.S. and K.W.; visualization, D.C.P., S.V.S. and K.W.; supervision, D.C.P.; project administration, D.C.P.; funding acquisition, D.C.P. All authors have read and agreed to the published version of the manuscript.

Funding

This research was funded by the Waterloo Institute for Complexity and Innovation (research support stipend to director D.C.P.); a University of Waterloo Exchange grant to D.C.P. (2020); and SSHRC grants 435-2012-1697, 890-2013-003, and 890-2021-0021 to D.C.P.

Data Availability Statement

CHMC rental market data are available for download at https://assets.cmhc-schl.gc.ca/sites/cmhc/data-research/data-tables/rental-market-data/rmr-data-tables/2020/rmr-kitchener-cambridge-waterloo-2020-en.xlsx?utm_medium=report&utm_source=rental-market-report&utm_campaign=january2021&utm_content=english. (Accessed on 6 December 2022) Selected real estate data for Waterloo Region are available at the Waterloo Region Association of Realtors https://wrar.ca/hpi/ (Accessed on 6 December 2022).

Acknowledgments

We thank participating colleagues from the Canada Housing and Mortgage Corporation, Waterloo Association of Realtors, Waterloo Region municipal staff, and anonymous developers and other real estate industry professionals for their input, without which this research would not have been possible. The views expressed are solely the authors’. We thank Alex Petric for research assistance. We also thank participants from the 2022 ACSP meeting, the 2022 Computational Social Science Association of the Americas conference, the McGill MCCHE seminar series, Markus Moos, and members of the Urban Growth and Change research group for helpful feedback.

Conflicts of Interest

The authors declare no conflict of interest. The funders had no role in the design of the study; in the collection, analyses, or interpretation of data; in the writing of the manuscript; or in the decision to publish the results.

References

  1. Region of Waterloo. Monitoring Change in the CTC: 2020 Report; Region of Waterloo: Kitchener, ON, Canada, 2022; Available online: https://www.regionofwaterloo.ca/en/regional-government/resources/LandUse_BuildingActivity/3868173-PDL-CPL-22-02_Attachment_1_Monitoring_Change_in_the_CTC_2020_Report.ACCESS.pdf (accessed on 5 December 2022).
  2. Thompson, C. Construction in Region Continues at a Breakneck Pace. 2021. Available online: https://www.therecord.com/news/council/2021/11/05/construction-in-waterloo-region-continues-at-breakneck-pace.html (accessed on 5 December 2022).
  3. Parker, D.C.; Casello, J.; Dean, J. Monitoring and modelling the causes and consequences of urban intensification in Waterloo Region. In Housing Market Insights; Kitchener Waterloo Association of Realtors: Kitchener, ON, Canada, 2018. [Google Scholar]
  4. KWAR. Home Price Index Dashboard; Kitchener-Waterloo Association of Realtors: Kitchener, ON, Canada, 2021; Available online: https://kwar.ca/hpi-dashboard/ (accessed on 5 December 2022).
  5. Van der Merwe, J.; Doucet, B. Housing challenges, mid-sized cities and the COVID-19 pandemic. Can. Plan. Policy/Amenage. Et Polit. Au Can. 2021, 2021, 70–90. [Google Scholar] [CrossRef]
  6. KWCF. Waterloo Region’s Vital Signs; Kitchener Waterloo Community Foundation: Kitchener, ON, Canada, 2021; Available online: https://www.wrcf.ca/s/KWCF-2021-Waterloo-Region-Vital-Signs-Report-Affordable-Housing.pdf (accessed on 5 December 2022).
  7. Moffatt, M. Baby Needs a New Home; Smart Prosperity Institute: Ottawa, ON, Canada, 2021; Available online: https://institute.smartprosperity.ca/publications/growing-number-households (accessed on 5 December 2022).
  8. Ontario. Housing Affordability Task Force Report; Ontario: Ottawa, ON, Canada, 2022; Available online: https://www.ontario.ca/page/housing-affordability-task-force-report (accessed on 5 December 2022).
  9. Moffatt, M.; Dudu, A.; Hosseini, M. Ontario’s Need for 1.5 Million More Homes; Smart Prosperity Institute: Ottawa, ON, Canada, 2022; Available online: https://institute.smartprosperity.ca/1.5MillionMoreHomes (accessed on 5 December 2022).
  10. CMHC. Canada’s Housing Supply Shortages: Estimating What is Needed to Solve Canada’s Housing Affordability Crisis by 2030; Canadian Mortgage and Housing Corporation: Ottawa, ON, Canada, 2022; Available online: https://assets.cmhc-schl.gc.ca/sites/cmhc/professional/housing-markets-data-and-research/housing-research/research-reports/2022/housing-shortages-canada-solving-affordability-crisis-en.pdf?rev=88308aef-f14a-4dbb-b692-6ebbddcd79a0 (accessed on 5 December 2022).
  11. Statistics Canada. Dictionary, Census of Population, 2021: Structural Type of Dwelling; Statistics Canada: Ottawa, ON, Canada, 2021; Available online: https://www12.statcan.gc.ca/census-recensement/2021/ref/dict/az/definition-eng.cfm?ID=dwelling-logements013 (accessed on 5 December 2022).
  12. Canada Mortgage and Housing Corporation. National Occupancy Standard; Canada Mortgage and Housing Corporation: Ottawa, ON, Canada, 2022; Available online: https://www.cmhc-schl.gc.ca/en/professionals/industry-innovation-and-leadership/industry-expertise/affordable-housing/provincial-territorial-agreements/investment-in-affordable-housing/national-occupancy-standard (accessed on 5 December 2022).
  13. Haan, M. The residential crowding of immigrants in Canada, 1971–2001. J. Ethn. Migr. Stud. 2011, 37, 443–465. [Google Scholar] [CrossRef]
  14. Statistics Canada. Table 98-10-0238-01: Housing Suitability by Tenure, with Household Type Including Census Family Structure: Canada, Provinces and Territories, Census Divisions and Census Subdivisions; Statistics Canada: Ottawa, ON, Canada, 2022. [Google Scholar] [CrossRef]
  15. Moos, M.; Revington, N.; Wilkin, T. Is there suitable housing near work? The impact of housing suitability on commute distances in Montreal, Toronto, and Vancouver. J. Urban. Int. Res. Placemaking Urban Sustain. 2018, 11, 436–459. [Google Scholar] [CrossRef]
  16. Bimm, A.J.; Chesquin, A.F.; Xu, C.; Atencio-Malixi, A.; Oliveira, K. The City-Builder’s Guide to Building the Missing Middle; School of Cities, University of Toronto: Toronto, ON, Canada, 2021; Available online: https://smartdensity.com/wp-content/uploads/2021/05/Tour-Guide-_Building-the-Missing-Middle.pdf (accessed on 5 December 2022).
  17. Parolek, D.G. Missing Middle Housing: Thinking Big and Building Small to Respond to Today’s Housing Crisis; Island Press: Washington, DC, USA, 2020. [Google Scholar]
  18. Haines, G.; Aird, B. Finding the Missing Middle in the GTHA An Intensification Case Study of Mississauga; Ryerson City Building Institute: Toronto, ON, Canada, 2018. [Google Scholar]
  19. Urban Strategies Inc. The “Missing Middle”: An Answer to Toronto’s Housing Shortages? Toronto Regional Real Estate Board: Toronto, ON, Canada, 2020; Available online: https://trreb.ca/hlfiles/pdf/2021.01.04-TRREB_Missing_Middle.pdf (accessed on 5 December 2022).
  20. Parker, D.C.; Filatova, T. A conceptual design for a bilateral agent-based land market with heterogeneous economic agents. Comput. Environ. Urban Syst. 2008, 32, 454–463. [Google Scholar] [CrossRef]
  21. Zellner, M.; Campbell, S.D. Planning for deep-rooted problems: What can we learn from aligning complex systems and wicked problems? Plan. Theory Pract. 2015, 16, 457–478. [Google Scholar] [CrossRef]
  22. Popal, A. Filling in the Housing Gaps: Planning for Missing Middle Housing in Toronto’s Yellowbelt; York Space: Denver, CO, USA, 2020; Available online: http://hdl.handle.net/10315/38331 (accessed on 5 December 2022).
  23. Kuhlmann, D.; Rodnyansky, S. Search of the Missing Middle: Historical Trends in and Contemporary Correlates of Small Multifamily Development; Daniel Kuhlmann; Tucson, AZ, USA. 2022. Available online: https://www.dankuhlmann.com/publication/working-paper-missing-middle/ (accessed on 5 December 2022).
  24. Statistics Canada. Canada at a Glance. Statistics Canada Catalogue No. 12-581-X; Statistics Canada: Ottawa, ON, Canada, 2018; Available online: https://www150.statcan.gc.ca/n1/pub/12-581-x/12-581-x2018000-eng.htm (accessed on 5 December 2022).
  25. Clayton, F.; Petramala, D.; Zaduban, A. A Strategy for Significantly Increasing the Supply of “Missing Middle” Housing in the City of Toronto; CUR/Ryerson University: Toronto, ON, Canada, 2019; Available online: https://www.torontomu.ca/content/dam/centre-urban-research-land-development/pdfs/TREB/CUR_TREB_Presentation_Feb.6.pdf (accessed on 5 December 2022).
  26. Evenson, J.; Cancelli, A.; Matthews-Hunter, K.; German, M.; Fader, J. What is the Missing Middle? A Toronto Housing Challenge Demystified. 2018. Available online: https://canurb.org/publications/what-is-the-missing-middle-a-toronto-housing-challenge-demystified/ (accessed on 5 December 2022).
  27. Clayton, F.; Paton, G. Missing in Action: New Low-Rise Apartments in the Greater Golden Horseshoe; Toronto Metropolitan University: Toronto, ON, Canada, 2022; Available online: https://www.torontomu.ca/centre-urban-research-land-development/blog/blogentry72/ (accessed on 5 December 2022).
  28. Maharaj, S.H.O. Factors Affecting the Supply of “Missing Middle” Housing Types in Walkable Urban Core Neighborhoods. Muma Bus. Rev. 2020, 4, 001–015. [Google Scholar] [CrossRef]
  29. Yeoman, R.; Akehurst, G. The Housing We’d Choose: A Study of Housing Preferences, Choices and Trade-offs in Auckland; Market Economics Ltd.: Annapolis, MD, USA, 2015. [Google Scholar]
  30. Babin, R. Estimating Homebuyer Preferences Under Intensification: Hedonic Modelling of Open Space and Multimodal Transit Amenities Preceding Light Rail in Kitchener-Waterloo; University of Waterloo, UWSpace: Waterloo, ON, Canada, 2016; Available online: http://hdl.handle.net/10012/10936 (accessed on 5 December 2022).
  31. Opit, S.; Kearns, R.; Witten, K.; Fergusson, E. Density in the Suburbs: Families with Children Adapting to Living in a Medium Density Social Housing Development. Urban Policy Res. 2021, 39, 397–413. [Google Scholar] [CrossRef]
  32. The Canadian Centre for Economic Analysis. Understanding the Forces Driving the Shelter Affordability Issue; Residential Construction Council of Ontario (RESCON): Concord, ON, Canada, 2017; Available online: https://www.rccao.com/research/files/Affordability-Phase2-report.pdf (accessed on 5 December 2022).
  33. Burda, C.; Collins-Williams, M. Make Way for Mid-Rise.; Pembina Institute: Ottawa, ON, Canada, 2015; Available online: https://www.pembina.org/pub/make-way-for-mid-rise (accessed on 5 December 2022).
  34. Cox, W.; He, A. Canada’s Middle-Income Housing Affordability Crisis; Frontier Centre for Public Policy: Winnipeg, MB, USA, 2016. [Google Scholar]
  35. Green, K.P.; Filipowicz, J.; Lafleur, S.; Herzog, I. The Impact of Land-Use Regulation on Housing Supply in CANADA; Fraser Institute Vancouver: Vancouver, BC, Canada, 2016. [Google Scholar]
  36. Donner, C. Housing Agents and Housing Submarkets. In International Encyclopedia of Housing and Home; Smith, S.J., Ed.; Elsevier: San Diego, CA, USA, 2012; pp. 265–272. [Google Scholar]
  37. Geva, Y.; Rosen, G. The regeneration deal: Developers, homeowners and new competencies in the development process. Geoforum 2018, 96, 10–20. [Google Scholar] [CrossRef]
  38. Prochorskaite, A.; Couch, C.; Malys, N.; Maliene, V. Housing stakeholder preferences for the “Soft” features of sustainable and healthy housing design in the UK. Int. J. Environ. Res. Public Health 2016, 13, 111. [Google Scholar] [CrossRef]
  39. Mohd Thas Thaker, H.; Ariff, M. Supply-side drivers of residential price in Malaysia: A qualitative analysis from developers’ perspectives. Prop. Manag. 2020, 38, 543–564. [Google Scholar] [CrossRef]
  40. Coiacetto, E. Diversity in real estate developer behaviour: A case for research. Urban Policy Res. 2001, 19, 43–59. [Google Scholar] [CrossRef]
  41. Maruani, T.; Amit-Cohen, I. Characteristics of developers and their relations to open space conservation. Land Use Policy 2011, 28, 887–897. [Google Scholar] [CrossRef]
  42. Ruming, K.J. Developer typologies in urban renewal in Sydney: Recognising the role of informal associations between developers and local government. Urban Policy Res. 2010, 28, 65–83. [Google Scholar] [CrossRef]
  43. Lai, N.; Wang, K. Land-supply restrictions, developer strategies and housing policies: The case in Hong Kong. Int. Real Estate Rev. 1999, 2, 143–159. [Google Scholar] [CrossRef] [PubMed]
  44. Li, F.; Guo, Z. How Does an Expansion of Mandatory Inclusionary Housing Affect Housing Supply? Evidence From London (UK). J. Am. Plan. Assoc. 2021, 88, 83–96. [Google Scholar] [CrossRef]
  45. Ontario. O. Reg. 329/22: Zonning Order—City of Toronto; Ontario: Ottawa, ON, Canada, 2022; Available online: https://www.ontario.ca/laws/regulation/220329 (accessed on 5 December 2022).
  46. Altus Group. 2020 Canadian Cost Guide.; Altus Group: Toronto, ON, Canada, 2020; Available online: https://www.altusgroup.com/services/reports/2020-canadian-cost-guide/ (accessed on 5 December 2022).
  47. Benjamin, L.; Rubin, J.S.; Zielenbach, S. Community development financial institutions: Current issues and future prospects. J. Urban Aff. 2004, 26, 177–195. [Google Scholar] [CrossRef]
  48. Follain, J.R. Some possible directions for research on multifamily housing. Hous. Policy Debate 1994, 5, 533–568. [Google Scholar] [CrossRef]
  49. Federal Reserve Bank of Dallas. Breaking Ground-Beginner’s Guide for Non-Profit; Federal Reserve Bank of Dallas: Dallas, TX, USA, 2004; Available online: https://community-wealth.org/sites/clone.community-wealth.org/files/downloads/tool-breaking-ground.pdf (accessed on 5 December 2022).
  50. Getter, D.E. Multifamily Housing Finance and Selected Policy Issue; Congressional Research Service: Washington, DC, USA, 2020; Available online: https://www.everycrsreport.com/files/2020-08-07_R46480_7d415ecff917f1c33e9e4f9fe81a7e8bc3a8187d.pdf (accessed on 5 December 2022).
  51. Ignatova, I.; Rabenhorst, S. Condominium Housing and Mortgage Lending in Emerging Markets Constraints and Opportunities: IDG Working Paper No. 2009-04; Urban Institute Center on International Development and Governance: Washingrton, DC, USA, 2009. [Google Scholar]
  52. Levitin, A.J.; Wachter, S.M. The public option in housing finance. UCDL Rev. 2012, 46, 1111. [Google Scholar]
  53. Brill, F. Governing investors and developers: Analysing the role of risk allocation in urban development. Urban Stud. 2021, 59, 1499–1517. [Google Scholar] [CrossRef]
  54. Winarso, H. Developer’s Behaviour in Residential Land Development in Jabothek, Indonesia; University of London: London, UK, 2000; Available online: https://discovery.ucl.ac.uk/id/eprint/1348854 (accessed on 5 December 2022).
  55. Magliocca, N.R.; Brown, D.G.; McConnell, V.D.; Nassauer, J.I.; Westbrook, S.E. Effects of Alternative Developer Decision-Making Models on the Production of Ecological Subdivision Designs: Experimental Results from an Agent-Based Model. Environ. Plan. B Plan. Des. 2014, 41, 907–927. [Google Scholar] [CrossRef]
  56. Mohamed, R. The psychology of residential developers: Lessons from behavioral economics and additional explanations for satisficing. J. Plan. Educ. Res. 2006, 26, 28–37. [Google Scholar] [CrossRef]
  57. Rowley, S.; Gilbert, C.; Gurran, N.; Leishman, C.; Phelps, C. The uneven distribution of housing supply 2006–2016. AHURI Final Report No. 334; Australian Housing and Urban Research Institute Limited: Melbourne, VI, Canada, 2020. [Google Scholar] [CrossRef]
  58. DeFields, E. Property Size Preferences and the Value of Private and Public Outdoor Spaces amid a Shift to High-Density Residential Development: A Case Study of Kitchener-Waterloo, Ontario. University of Waterloo, UWSpace: Waterloo, ON, Canada, 2013; Available online: http://hdl.handle.net/10012/7778 (accessed on 5 December 2022).
  59. Pi, X. Exploring Rental Housing Market in Kitchener-Waterloo, Ontario; University of Waterloo, UWSpace: Waterloo, ON, Canada, 2017; Available online: http://hdl.handle.net/10012/12431 (accessed on 5 December 2022).
  60. Tran, J. Understanding Developer’s Decision Making in the Region of Waterloo; University of Waterloo, UWSpace: Waterloo, ON, Canada, 2017; Available online: http://hdl.handle.net/10012/11163 (accessed on 5 December 2022).
  61. Cook, J. Light Rail Transit in the Region of Waterloo: A Qualitative Examination of Urban Rail’s Effects on Real Estate, Development and Urban Identities; University of Waterloo, UWSpace: Waterloo, ON, Canada, 2019; Available online: http://hdl.handle.net/10012/14345 (accessed on 5 December 2022).
  62. Huang, Y. Analyzing Housing Market Dynamics and Residential Location Choices Concurrent with Light-Rail Transit Investment in Kitchener-Waterloo, Canada; University of Waterloo, UWSpace: Waterloo, ON, Canada, 2020; Available online: http://hdl.handle.net/10012/15801 (accessed on 5 December 2022).
  63. El Outa, F.; Francia, M.; Marcel, P.; Peralta, V.; Vassiliadis, P. Towards a Conceptual Model for Data Narratives. In Proceedings of the Conceptual Modeling: 39th International Conference, ER 2020, Vienna, Austria, 3–6 November 2020; pp. 261–270. [Google Scholar]
  64. Dillon Consulting. Long-Term Population and Housing Growth Analysis; Dillon Consulting Ltd.|Watson & Associates Economists Ltd.: Mississauga, ON, Canada, 2020; Available online: https://www.engagewr.ca/8710/widgets/42728/documents/46361 (accessed on 5 December 2022).
  65. Longhurst, R. Semi-structured interviews and focus groups. Key Methods Geogr. 2003, 3, 143–156. [Google Scholar]
  66. Kallio, H.; Pietilä, A.-M.; Johnson, M.; Kangasniemi, M. Systematic methodological review: Developing a framework for a qualitative semi-structured interview guide. J. Adv. Nurs. 2016, 72, 2954–2965. [Google Scholar] [CrossRef]
  67. Blee, K.M.; Taylor, V. Semi-structured interviewing in social movement research. Methods Soc. Mov. Res. 2002, 16, 92–117. [Google Scholar]
  68. Sterman, J. System Dynamics: Systems Thinking and Modeling for a Complex World; McGraw-Hill Higher Education: New York, NY, USA, 2002. [Google Scholar]
  69. Forrester, J.W. Learning through system dynamics as preparation for the 21st century. Syst. Dyn. Rev. 2016, 32, 187–203. [Google Scholar] [CrossRef]
  70. Ghosh, A. Thinking in Systems. In Dynamic Systems for Everyone; Springer: Berlin/Heidelberg, Germany, 2015; pp. 1–17. [Google Scholar]
  71. Page, S.E. The Model Thinker: What You Need to Know to Make Data Work for You; Basic Books: New York, NY, USA, 2018. [Google Scholar]
  72. Olaya, C. Cows, agency, and the significance of operational thinking. Syst. Dyn. Rev. 2015, 31, 183–219. [Google Scholar] [CrossRef]
  73. Kubanza, N.S.; Das, D.K.; Simatele, D. Some happy, others sad: Exploring environmental justice in solid waste management in Kinshasa, The Democratic Republic of Congo. Local Environ. 2017, 22, 595–620. [Google Scholar] [CrossRef]
  74. Macmillan, A.; Davies, M.; Shrubsole, C.; Luxford, N.; May, N.; Chiu, L.F.; Trutnevyte, E.; Bobrova, Y.; Chalabi, Z. Integrated decision-making about housing, energy and wellbeing: A qualitative system dynamics model. Environ. Health 2016, 15, 23–34. [Google Scholar] [CrossRef]
  75. Luna-Reyes, L.F.; Andersen, D.L. Collecting and analyzing qualitative data for system dynamics: Methods and models. Syst. Dyn. Rev. J. Syst. Dyn. Soc. 2003, 19, 271–296. [Google Scholar] [CrossRef]
  76. Guest, J.; Skerlos, S.; Daigger, G.; Corbett, J.; Love, N. The use of qualitative system dynamics to identify sustainability characteristics of decentralized wastewater management alternatives. Water Sci. Technol. 2010, 61, 1637–1644. [Google Scholar] [CrossRef]
  77. Haji Gholam Saryazdi, A.; Rajabzadeh Ghatari, A.; Mashayekhi, A.; Hassanzadeh, A. Designing a qualitative system dynamics model of crowdfunding by document model building. Qual. Res. Financ. Mark. 2019, 12, 197–224. [Google Scholar] [CrossRef]
  78. Shoar, S.; Payan, S. A qualitative system dynamics approach to modeling the causes and effects of design deficiencies in construction projects. J. Facil. Manag. 2022, 20, 558–569. [Google Scholar] [CrossRef]
  79. Schwab, J.D.; Kühlwein, S.D.; Ikonomi, N.; Kühl, M.; Kestler, H.A. Concepts in Boolean network modeling: What do they all mean? Comput. Struct. Biotechnol. J. 2020, 18, 571–582. [Google Scholar] [CrossRef]
  80. Weimer-Jehle, W. Cross-impact balances: A system-theoretical approach to cross-impact analysis. Technol. Forecast. Soc. Chang. 2006, 73, 334–361. [Google Scholar] [CrossRef]
  81. Voinov, A. Systems Science and Modeling for Ecological Economics: Amsterdam; Elsevier: Amsterdam, The Netherlands, 2008; ISBN 978-0-12-372593-7. [Google Scholar]
  82. Valaei Sharif, S.; Habibi Moshfegh, P.; Morshedi, M.A.; Kashani, H. Modeling the impact of mitigation policies in a pandemic: A system dynamics approach. Int. J. Disaster Risk Reduct. 2022, 82, 103327. [Google Scholar] [CrossRef]
  83. Kashani, H.; Valaei Sharif, S.; Hosseini, S.; Hekmatian, M.A. Dynamical Modeling of Outbreak and Control of Pandemics: Assessing the Resilience of Healthcare Infrastructure Under Mitigation Policies. In The Science behind the COVID Pandemic and Healthcare Technology Solutions; Springer: Berlin/Heidelberg, Germany, 2022; pp. 329–351. [Google Scholar]
  84. Innocenti, E.; Detotto, C.; Idda, C.; Parker, D.C.; Prunetti, D. An iterative process to construct an interdisciplinary ABM using MR POTATOHEAD: An application to Housing Market Models in touristic areas. Ecol. Complex. 2020, 44, 100882. [Google Scholar] [CrossRef]
  85. Filatova, T.; Parker, D.; Van der Veen, A. Agent-based urban land markets: Agent’s pricing behavior, land prices and urban land use change. J. Artif. Soc. Soc. Simul. 2009, 12, 3. [Google Scholar]
  86. Kaimowitz, D.; Angelsen, A. Economic Models of Tropical Deforestation: A Review; Center for International Forestry Research: Kota Bogor, Indonesia, 1998. [Google Scholar]
  87. KWAR. “Housing Market Insights” Event; Kitchener-Waterloo Association of Realtors: Kitchener, ON, Canada, 2018. [Google Scholar]
  88. Region of Waterloo. Draft Regional Official Plan for the Region of Waterloo; Region of Waterloo: Kitchener, ON, Canada, 2022; Available online: https://www.engagewr.ca/regional-official-plan (accessed on 5 December 2022).
  89. Huang, Y.; Parker, D.; Minaker, L. Identifying latent demand for transit-oriented development neighbourhoods: Evidence from a mid-sized urban area in Canada. J. Transp. Geogr. 2021, 90, 102940. [Google Scholar] [CrossRef]
  90. City of Kitchener. City of Kitchener Zonign Bylaw; City of Kitchener: Kitchener, ON, Canada, 2019; Available online: https://www.kitchener.ca/en/development-and-construction/zoning-bylaw.aspx (accessed on 5 December 2022).
  91. Nicholson, W.; Snyder, C.M. Microeconomic Theory: Basic Principles and Extensions; Cengage Learning: Boston, MA, USA, 2012. [Google Scholar]
  92. Daly, H.E.; Farley, J. Ecological Economics: Principles and Applications; Island press: Washington, DC, USA, 2011. [Google Scholar]
  93. Hackett, S.; Dissanayake, S.T.M. Environmental and Natural Resources Economics: Theory, Policy, and the Sustainable Society, 4th ed.; Routledge: London, UK, 2011. [Google Scholar]
  94. CMHC. Rental Market Survey 2014–2020; Canadian Mortgage and Housing Corporation: Ottawa, ON, Canada, 2022; Available online: https://www.cmhc-schl.gc.ca/en/professionals/housing-markets-data-and-research/housing-data/data-tables/rental-market/rental-market-report-data-tables (accessed on 5 December 2022).
  95. Statistics Canada. Kitchener—Cambridge—Waterloo [Census Metropolitan Area], Ontario and Ontario [Province] (Table). Census Profile. 2016 Census; Catalogue no. 98-316-X2016001; Statistics Canada: Ottawa, ON, Canada, 2017; Available online: https://www12.statcan.gc.ca/census-recensement/2016/dp-pd/prof/index.cfm?Lang=E (accessed on 5 December 2022).
  96. Statistics Canada. Canadian Income Survey: Population Rebasing, 2012 to 2019; Income Research Paper Series; Statistics Canada: Ottawa, ON, Canada, 2022. [Google Scholar]
  97. Statistics Canada. Survey of Labour and Income Dynamics; Statistics Canada: Ottawa, ON, Canada, 2022; Available online: https://www150.statcan.gc.ca/n1/en/catalogue/75F0026X (accessed on 5 December 2022).
  98. CMHC. Rental Market Report: Kitchener-Cambridge-Waterloo CMA; Canadian Mortgage and Housing Corporation: Ottawa, ON, Canada, 2020; Available online: https://publications.gc.ca/collections/collection_2020/schl-cmhc/NH12-72-2020-eng.pdf (accessed on 5 December 2022).
  99. Relator.ca Website. 2021. Available online: Realtor.ca (accessed on 14 June 2021).
  100. Higgins, C.D.; Kanaroglou, P.S. Forty years of modelling rapid transit’s land value uplift in North America: Moving beyond the tip of the iceberg. Transp. Rev. 2016, 36, 610–634. [Google Scholar] [CrossRef]
  101. Nabi, S. Learning from 20 Years of High-Density Development in Kitchener; Sam Nabi: Kitchener, ON, Canada, 2022; Available online: https://samnabi.com/blog/how-do-we-build-from-here?fbclid=IwAR0wnrURClgjAr009jTrsmCIdUeMf5oRrLSziNIjOJuxsxEISYlt9PoVGnc (accessed on 5 December 2022).
  102. Parker, D.C. Revealing “space” in spatial externalities: Edge-effect externalities and spatial incentives. J. Environ. Econ. Manag. 2007, 54, 84–99. [Google Scholar] [CrossRef]
  103. City of Minneapolis. Minneapolis, Minnesota—Code of Ordinances; City of Minneapolis: Minneapolis, MN, USA, 2020. Available online: https://www2.minneapolismn.gov/business-services/planning-zoning/zoning-maps/about-the-zoning-code/ (accessed on 5 December 2022).
  104. Podbielski, T. Finding the Suburban “Missing Middle”: Case Study Analysis of Housing Supply Trends and Needs in Buda, Kyle and San Marcos, Texas. Ph.D. Thesis, The University of Texas at Austin, Austin, TX, USA, 2021. [Google Scholar]
  105. City of Grand Rapids. City of Grand Rapids Zonign Ordinance; City of Grand Rapids: Grand Rapids, MI, USA, 2018. Available online: https://www.grandrapidsmi.gov/Government/Programs-and-Initiatives/Zoning-Ordinance (accessed on 5 December 2022).
  106. City of Portland. City of Portland Planning & Zoning Code; City of Portland: Portland, OR, USA, 2022. Available online: https://www.portland.gov/code/33#toc-zoning-code (accessed on 5 December 2022).
  107. California Legislative Information. California Goverment Code; California Legislative Information: California City, CA, USA, 2022; Available online: https://www.planning.org/knowledgebase/resource/9138404/#enabling (accessed on 5 December 2022).
  108. City of Edmonton. ‘Missing Middle’ Infill Design Competition; City of Edmonton: Edmonton, AB, Canada, 2019; Available online: https://www.edmonton.ca/programs_services/recognition_awards/infill-design-competition (accessed on 5 December 2022).
  109. City of Saint Paul. Zonning Permits and Land Uses; City of Saint Paul: Saint Paul, MN, USA, 2022. Available online: https://www.stpaul.gov/departments/safety-inspections/building-and-construction/construction-permits-and-inspections/zoning-permits-land-uses (accessed on 5 December 2022).
  110. Dill, E. City Program Promotes ‘Missing Middle’ Affordable Housing; The Minnesota Daily: Minneapolis, MN, USA, 2019; Available online: https://mndaily.com/224551/news/ctmiddlehousing/ (accessed on 5 December 2022).
  111. MSHDA. Missing Middle Housing Program; Michigan State Housing Development Authority: Detroit, MI, USA, 2022. Available online: https://www.michigan.gov/mshda/-/media/Project/Websites/mshda/developers/missing-middle/MM-Housing-Program-Plan.pdf?rev=c7a12e72fa6d4792bd23b1f493ae2474&hash=A8EC277F4004EF2CB26B7BEF8F9F8EA9 (accessed on 5 December 2022).
  112. CMHC. Canada Supports Co-Ops in Vancouver and across Canada; CMHC: Ottawa, ON, Canada, 2022; Available online: https://www.newswire.ca/news-releases/canada-supports-co-ops-in-vancouver-and-across-canada-887949021.html (accessed on 5 December 2022).
  113. Raymer, E. Montreal’s 20-20-20 Housing Development Bylaw Comes into Effect; Canadian Lawyer: Canmore, AB, Canada, 2021; Available online: https://www.canadianlawyermag.com/practice-areas/real-estate/montreals-20-20-20-housing-development-bylaw-comes-into-effect/355075 (accessed on 5 December 2022).
  114. City of Montreal. Diverse Metropolis: An Overview of the by-Law; City of Montreal: Montreal, QC, Canada, 2022; Available online: https://montreal.ca/en/articles/diverse-metropolis-overview-law-7816 (accessed on 5 December 2022).
  115. City of Toronto. Toronto Affordable Rental Housing Design Guidelines; City of Toronto: Toronto, ON, Canada, 2015; Available online: https://www.toronto.ca/wp-content/uploads/2017/11/8fea-AFFORDABLE-HOUSING-DESIGN-GUIDELINES.FINAL_.07.06.2017.pdf (accessed on 5 December 2022).
  116. Garber, P.M. Famous First Bubbles. J. Econ. Perspect. 1990, 4, 35–54. [Google Scholar] [CrossRef]
  117. Parker, D.C.; Valaei Sharif, S.; Waddel, P.; Tsiakopoulis, T. Incorporating price expectations into agent-based representations of land developer decision models. In Proceedings of the Social Simulation Conference: Promoting Social Simulation and Computational Social Science, Milan, Italy, 14 September 2022. [Google Scholar]
Figure 1. Benchmark housing prices for Kitchener–Waterloo between November 2012 and October 2022. “Benchmark housing prices” are a “typical” home based on the features of homes that have been bought and sold.” [4].
Land 12 00434 g001
Figure 2. Qualitative systems map representing developers’ decision-making context: actors, processes, and calculations by shape, and actor realm by color; dashed line represents incomplete information flow. (Supplementary Materials Video S1).
Land 12 00434 g002
Figure 3. Premium of vacant rents over occupied rents by year in the Kitchener–Waterloo–Cambridge CMA [94].
Land 12 00434 g003
Figure 4. (a) Average days on market and (b) average sales prices of properties in the housing market of the Waterloo Region [4].
Land 12 00434 g004
Figure 5. Qualitative causal loop diagram characterizing the underlying dynamics of high-rise development decisions.
Land 12 00434 g005
Figure 6. Qualitative causal loop diagram characterizing the underlying dynamics of MM housing development decisions.
Land 12 00434 g006
Table 1. Rental apartment unit supply [94].
YearBachelor1 BR2 BR3+ BR
20152.6%32.0%60.5%4.8%
20202.3%31.4%60.3%6.0%
Net increase in units between 2015 and 20206119714097759
Disclaimer/Publisher’s Note: The statements, opinions and data contained in all publications are solely those of the individual author(s) and contributor(s) and not of MDPI and/or the editor(s). MDPI and/or the editor(s) disclaim responsibility for any injury to people or property resulting from any ideas, methods, instructions or products referred to in the content.

