Article

Combining Spatiotemporally Global and Local Interpolations Improves Modeling of Annual Land Surface Temperature Cycles

1
Jiangsu Provincial Key Laboratory of Geographic Information Science and Technology, International Institute for Earth System Science, Nanjing University, Nanjing 210023, China
2
Jiangsu Center for Collaborative Innovation in Geographical Information Resource Development and Application, Nanjing 210023, China
*
Author to whom correspondence should be addressed.
Land 2023, 12(2), 309; https://doi.org/10.3390/land12020309
Submission received: 8 December 2022 / Revised: 13 January 2023 / Accepted: 20 January 2023 / Published: 22 January 2023
(This article belongs to the Special Issue Spatiotemporal Variations of Land Surface Temperature)

Abstract

:
Annual temperature cycle (ATC) models are widely used to characterize temporally continuous land surface temperature (LST) dynamics within an annual cycle. However, the existing ATC models ignore the spatiotemporally local correlations among adjacent LST pixels and are inadequate for capturing the complex relationships between LSTs and LST-related descriptors. To address these issues, we propose an improved ATC model (termed the ATC_GL), which combines both the spatiotemporally global and local interpolations. Using the random forest (RF) algorithm, the ATC_GL model quantifies the complex relationships between LSTs and LST-related descriptors such as the surface air temperature, normalized difference vegetation index, and digital elevation model. The performances of the ATC_GL and several extensively used LST reconstruction methods were compared under both clear-sky and overcast conditions. In the scenario with randomly missing LSTs, the accuracy of the ATC_GL was 2.3 K and 3.1 K higher than that of the ATCE (the enhanced ATC model) and the ATCO (the original ATC model), respectively. In the scenario with LST gaps of various sizes, the ATC_GL maintained the highest accuracy and was less sensitive to gap size when compared with the ATCH (the hybrid ATC model), Kriging interpolation, RSDAST (Remotely Sensed Daily Land Surface Temperature), and HIT (Hybrid Interpolation Technique). In the scenario of overcast conditions, the accuracy of the ATC_GL was 1.0 K higher than that of other LST reconstruction methods. The ATC_GL enriches the ATC model family and provides enhanced performance for generating spatiotemporally seamless LST products with high accuracy.

1. Introduction

Land surface temperature (LST) is one of the key parameters for determining land–atmosphere energy exchanges and plays a crucial role in various applications, such as the monitoring of the urban thermal environment [1,2], estimation of soil moisture and evapotranspiration [3], and detection of forest fires [4,5]. Satellite thermal remote sensing provides a straightforward and consistent method for obtaining regional LSTs. However, due to cloud contamination and sampling error, more than half of the satellite-derived LST image pixels are invalid or entirely absent [6], and thus, the associated potential applications are severely limited.
Various methods have been proposed for generating spatiotemporally seamless LSTs, including: (1) physical modeling [7,8], (2) analyzing statistical relationships between LST and LST-related descriptors [9,10,11,12,13,14,15,16], and (3) incorporating spatial and/or temporal information [6,17,18,19,20,21,22]. There is no clear boundary between these methods—spatiotemporal interpolation methods may also use auxiliary data [19,23]. Among these three methods, the spatiotemporal interpolation is widely used because of its general simplicity and relatively high accuracy [6,18,19,21] and can be methodologically divided into spatiotemporally local and temporally global interpolation. (1) The spatiotemporally local interpolation reconstructs missing LSTs based on spatially and temporally local information, using several algorithms, such as inverse distance weighted interpolation (IDW) [24,25,26], spline interpolation [27,28], Kriging interpolation or co-kriging interpolation [11,27,29,30], and Remote Sensed Daily Land Surface Temperature (RSDAST) [6]. (2) The temporally global interpolation reconstructs missing LSTs by incorporating all available LST observations on a specific time scale. This group includes the annual temperature cycle (ATC) model [17,19,22,23,31] and the diurnal temperature cycle (DTC) model [32,33].
Among the two spatiotemporal interpolation methods, the temporally global interpolation method is simple and efficient in LST reconstruction with very few available LST observations (or with large spatiotemporal gaps) at various time scales [19,22,23,28]. In particular, the ATC model also belongs to the temporally global interpolation group—it connects the inter-annual and diurnal models and enables a continuous description of LST dynamics within an annual cycle with very few controlling parameters. The ATC model is widely used to generate spatiotemporally seamless LST products [34,35], downscale LST products into finer resolutions [36], and investigate the urban thermal environment [37], and the improvement of this model has been the focus of many studies over the past few years [19,22,23].
There are three types of ATC models: statistical or Fourier series, physical (quasi-physical), and semi-empirical methods. (1) Statistical or Fourier series methods reconstruct missing LSTs purely by statistical or Fourier methods, such as the statistical time-series analysis [38] and Fourier time series analysis methods [39]. (2) Physical (or quasi-physical) methods consider the surface energy balance within an annual cycle, and their parameters are usually physically meaningful for quantifying surface properties and atmospheric status [37,40]. Physical methods include the original ATC model with a single sine function (ATCO hereafter) [40] and its improved version with two sine functions (ATCT hereafter) [17]. (3) Based on physical (or quasi-physical) models, semi-empirical methods integrate additional statistical methods (e.g., Gaussian process regression) [34] or auxiliary data (e.g., surface air temperature (SAT)) and the normalized difference vegetation index (NDVI) [19,22,23], for example, the enhanced ATC model (ATCE), which integrates SAT and NDVI [22], the phenology-based ATC model (PATC hereafter), which integrates vegetation phenology data [23], and the hybrid ATC model (ATCH hereafter), which involves multiple harmonic functions and auxiliary data [19]. Compared with statistical and physical models, semi-empirical ATC models more accurately capture daily LST fluctuations in response to changes in synoptic conditions and vegetation phenology within an annual cycle [19,22,23].
Although great progress has been achieved on the development of ATC models, two issues remain to be addressed. First, the existing ATC models are mainly based on temporally global interpolations and ignore the spatiotemporally local correlations among adjacent LST pixels. The accuracy of these models tends to decrease, particularly when LST gaps are relatively small [19]. Second, most semi-empirical ATC models describe the relationships between LSTs and LST-related descriptors with linear regression and are therefore unable to capture the complex non-linear relationships between LSTs and the associated descriptors [41,42].
To address these issues, here we proposed an improved ATC model based on both spatiotemporally global and local interpolations (termed the ATC_GL). The ATC_GL incorporates the advantages of temporally global and spatiotemporally local models in reconstructing LSTs with large and small gaps, respectively. The ATC_GL employs the random forest (RF) algorithm to analyze the complex relationships between LSTs and LST-related descriptors and accurately capture daily LST fluctuations. The performance of the ATC_GL and several popular methods were evaluated in different scenarios by the daytime overpass of the Terra satellite in 2018. According to our findings, the ATC_GL provides more accurate LST estimates than conventional temporal, spatial, and spatiotemporal interpolation methods in several scenarios. We propose that the ATC_GL will facilitate the generation of high-accuracy spatiotemporal LST products.

2. Study Area and Data

2.1. Study Area

Eight regions (including Regions A to H) in China were selected as the study areas (Figure 1) to evaluate the model performance of the ATC_GL under three scenarios. The elevations of Region B and Region E differ greatly because they are located at the intersection of the first and the second steps of China. In terms of the main land cover types, Regions A, C, and D are mainly covered by farmland or grassland, Region B is covered by bare soil, while Regions E, F, G, and H are primarily covered by forest or grassland. Specifically, (1) Regions A–G (Figure 1 and Table 1), each with an area of 300 × 300 km2, are distributed in seven distinct geographical regions with different climatic and topographical characteristics [43]. Considering the influences of different regions, Regions A–G were used to evaluate the performance of the ATC_GL in a scenario with randomly missing LSTs (see Section 3.2). (2) Region H, with an area of 600 × 600 km2, is in central-eastern China. For frequent rain and cloud, Region H was used to evaluate the accuracy and applicability of models in a scenario with LST gaps of various sizes. (3) Due to the coverage of all-weather LST products (LSTMW), Region A was also used to evaluate the performance of the ATC_GL under overcast conditions in east-central China (refer to Section 3.2).

2.2. Data

This study employed satellite data (MODIS LST, NDVI, and land cover type), in situ measurements (SAT), and auxiliary data (spatiotemporally seamless all-weather LSTs (i.e., the LSTMW data) and DEM) (Table 2).

2.2.1. Satellite Data

The present study used the daily LST product (MOD11A1/MYD11A1, with a spatial resolution of 1 km) [44,45], 16-day NDVI product (MOD13A2, 1 km), and yearly land-cover-type product (MCD12Q1, 0.5 km) (Table 2). These products were obtained from NASA Earth Science Data. Daytime LSTs from MOD11A1 (~10:30) in 2018 were used for LST reconstruction and model evaluation under clear-sky conditions (Strategy 1 & Strategy 2). The quality control (QC) of MODIS products was used to identify clear-sky or overcast conditions. The pixel was under cloud-free conditions when the corresponding QC was labelled as ‘10’ or ‘11’. The NDVI product MOD13A2 (Section 3.1.2) and land cover type product MCD12Q1 (Section 4.1.2) in 2018 were used as model inputs and evaluations over different land cover types, respectively. The clear-sky LSTs of LSTMW and the corresponding NDVI of MOD13A2 were used to reconstruct the LSTs under overcast conditions (Section 3.2). Note that the spatial and temporal resolutions of MCD12Q1 (0.5 km) and MOD13A2 (16-day) were resampled to 1 km and 1 day, respectively, to match those of the LST product by linear interpolation.

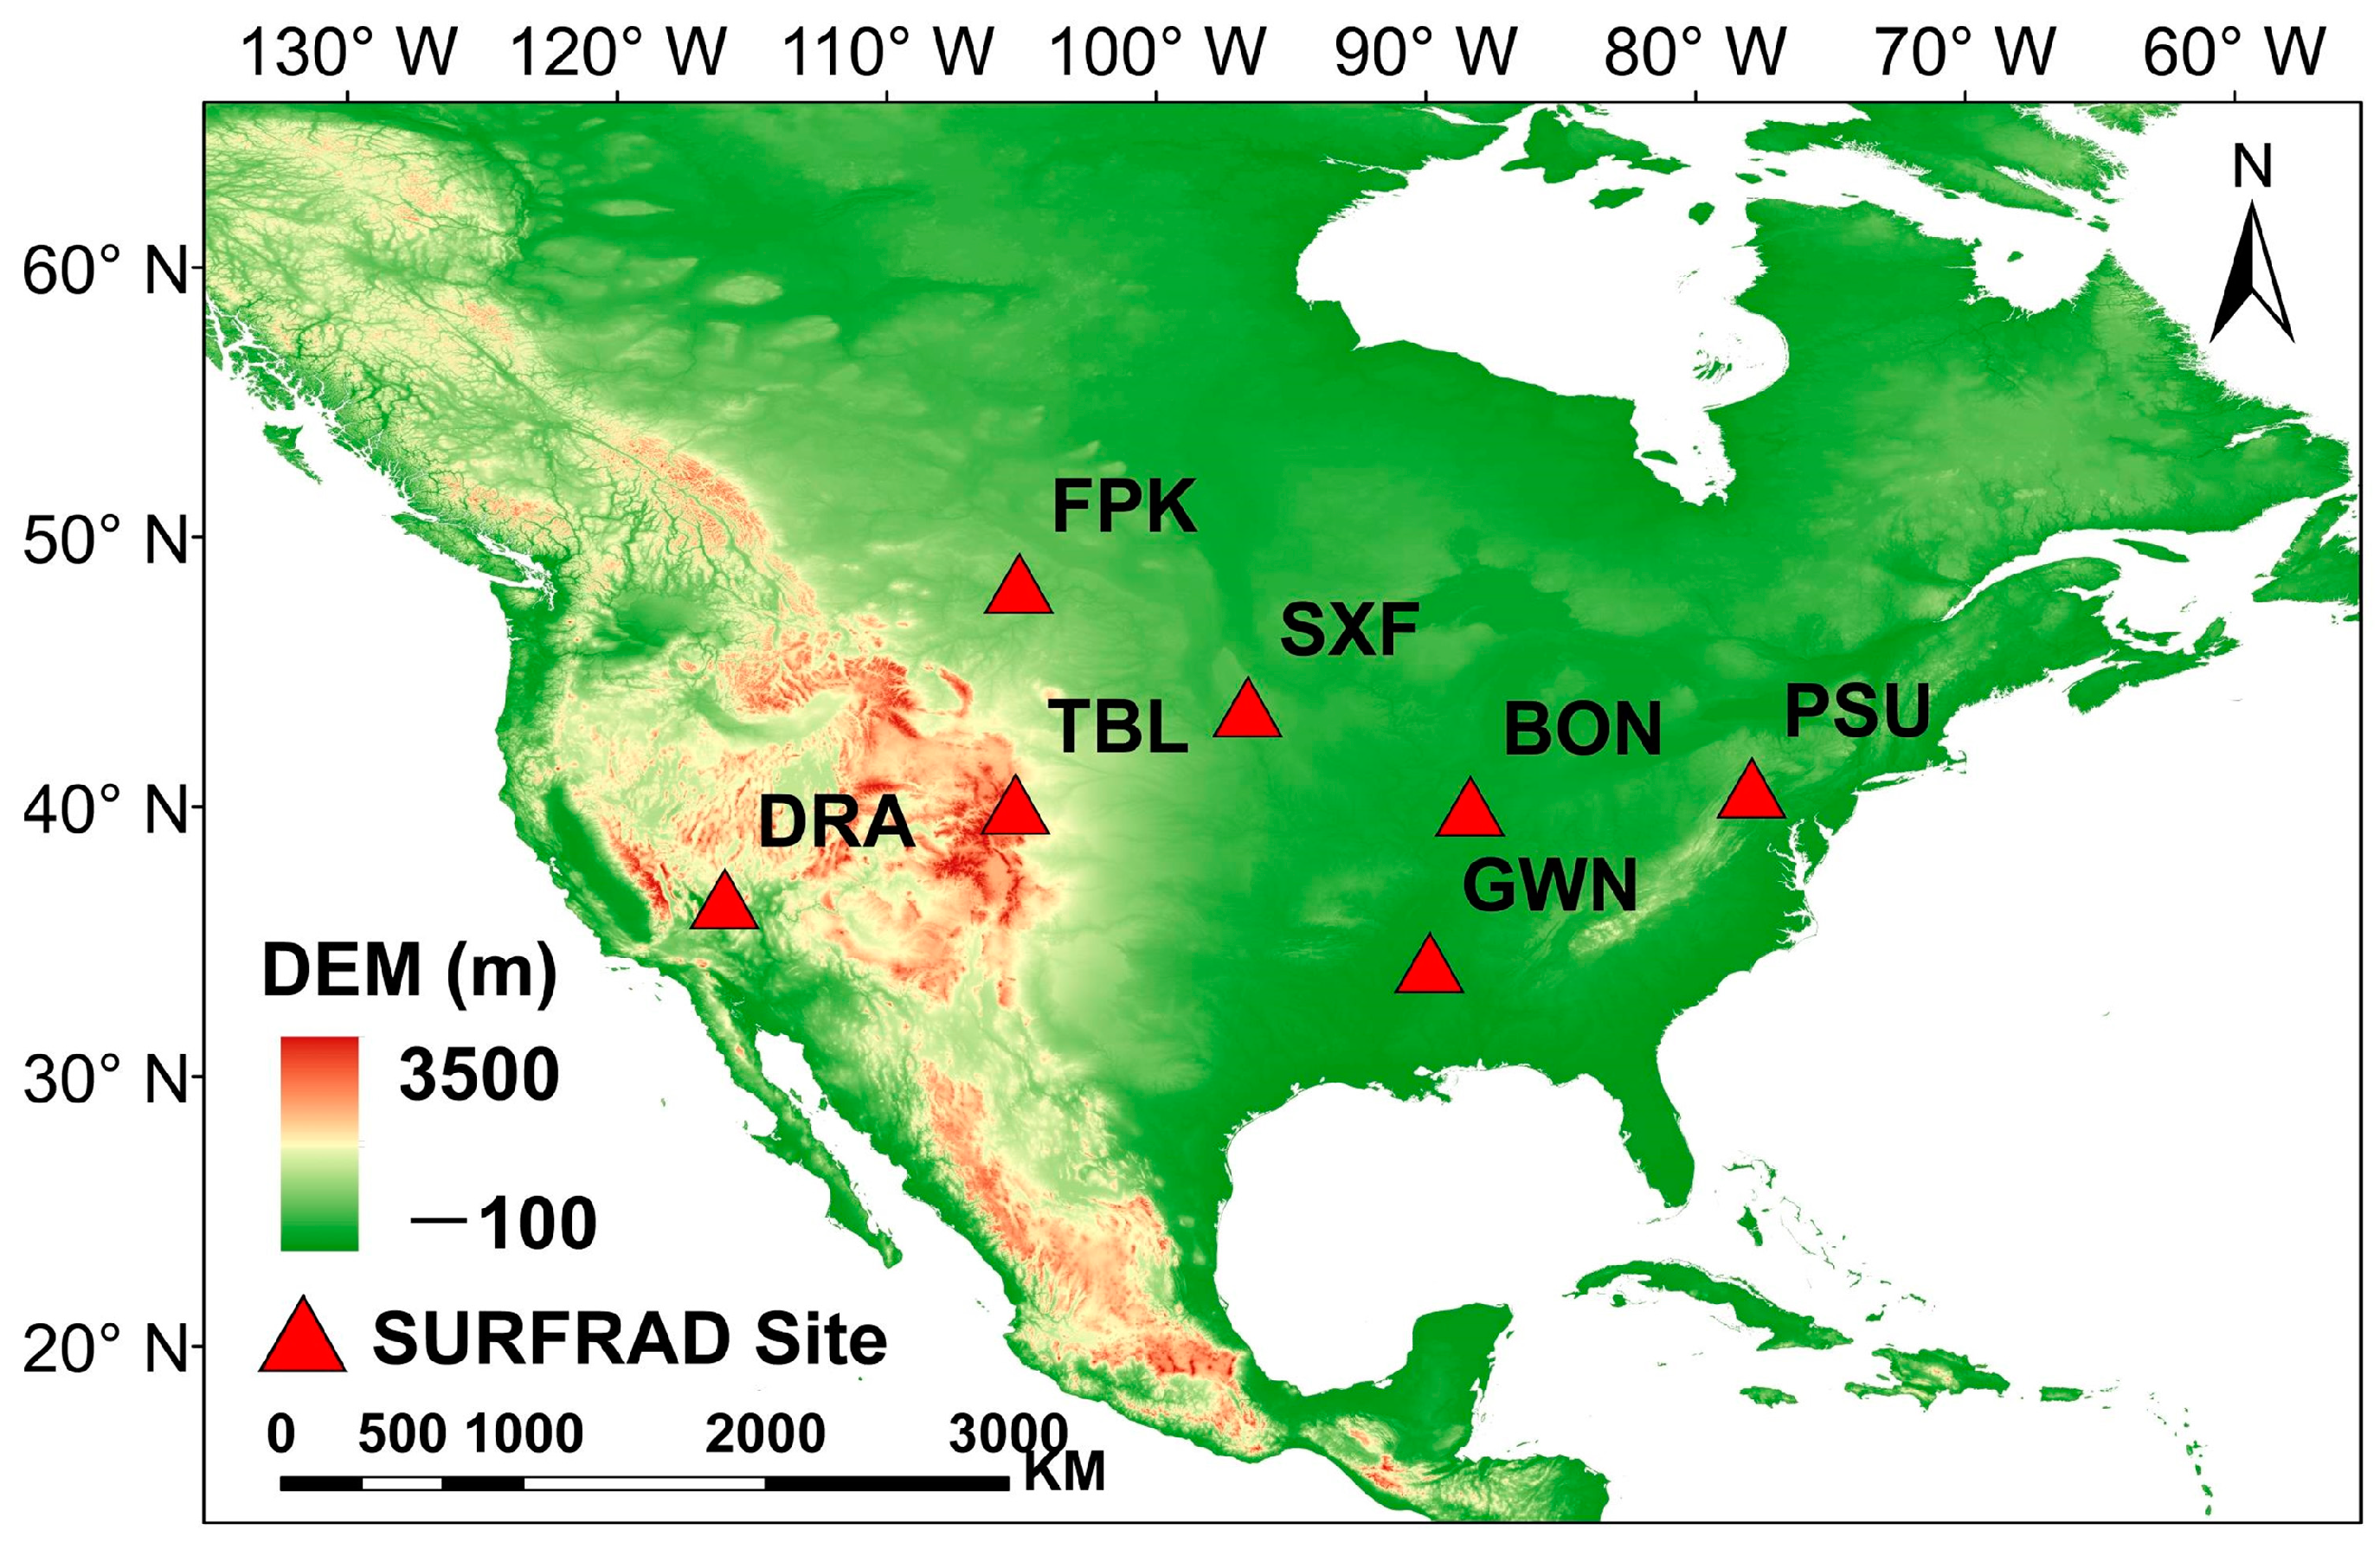
2.2.2. In Situ Measurements

In situ daily maximum and minimum SATs were derived from 2479 meteorological stations in China from 2018. To match the resolution of the LST data, the SATs were resampled to raster images with a resolution of 1 km after considering the impact of evaluation on temperature [22,46]. The daily mean SAT calculated as the average of daily maximum and minimum temperature was used to reflect the daily SAT fluctuations [46]. Subsequently, we calculated the daily mean SATs of each pixel [22,46] and used these values to quantify daily LST fluctuations.
In addition, in situ measurements obtained from seven Surface Radiation Budget Network (SURFRAD) sites in 2018 were used to evaluate the ATC_GL under overcast conditions (Figure 2). We calculated the in situ LST from the upward and downward longwave radiation based on the Stefan–Boltzmann law [10,47], which can be expressed as follows:
T = R Long _ up ( 1 ε b ) R Long _ down ε b σ 4 ε b = 0.261 + 0.314 ε 31 + 0.411 ε 32
where RLong_up and RLong_down represent the upward and downward longwave radiation, respectively; σ denotes the constant of Stefan–Boltzmann (σ = 5.67 × 10⁻⁸ W·m−2·K−4); εb denotes broadband emissivity estimated from MODIS; ε31 and ε32 represent narrowband emissivity in MODIS Channels 31 and 32, respectively.

2.2.3. Auxiliary Data

The LSTMW data were used to evaluate the performance of the ATC_GL under overcast conditions. The LSTMW data were generated by merging thermal and microwave observations with the spatial and temporal resolutions of 1 km and 1 day, respectively [13]. The accuracy of LSTMW is about 1.5 K and there is no significant difference in accuracy under clear-sky and overcast conditions [13]. The LSTMW has two advantages over in situ LSTs: (1) the spatial and temporal resolutions of LSTMW are consistent with those of MODIS LST, and therefore, errors in LST retrieval and scale differences between satellite-derived and ground-based LSTs are reduced; and (2) the available pixel-based LSTMW data are significantly larger than the ground-based LST data so that validations should be more representative [18,35,48]. However, the LSTMW only covers the northeast of China due to some limitations of microwave data (e.g., limited data coverage). Therefore, the LSTMW was used as the reference value for evaluating model performances under overcast conditions.
The yearly DEM product from SRTM3 was included in the quantification of daily LST fluctuations. The DEM product, with a spatial resolution of 90 m, was resampled to 1 km to match the resolution of the LST product.

3. Methodology

This section describes the framework of both model construction and evaluation (Figure 3). The construction of the ATC_GL involves (1) the temporally global reconstruction of annual LST dynamics (Section 3.1.1) and (2) spatiotemporally local estimation of daily LST fluctuations (Section 3.1.2). In terms of model evaluation, the performance of the ATC_GL was compared with that of several popular LST gap-filling methods in three scenarios: (1) with randomly missing LSTs, (2) with LST gaps of various sizes under clear-sky conditions, and (3) under overcast conditions (refer to Section 3.2). In order to help readers better understand the mathematical symbols, we have listed their associated meaning in Table 3.

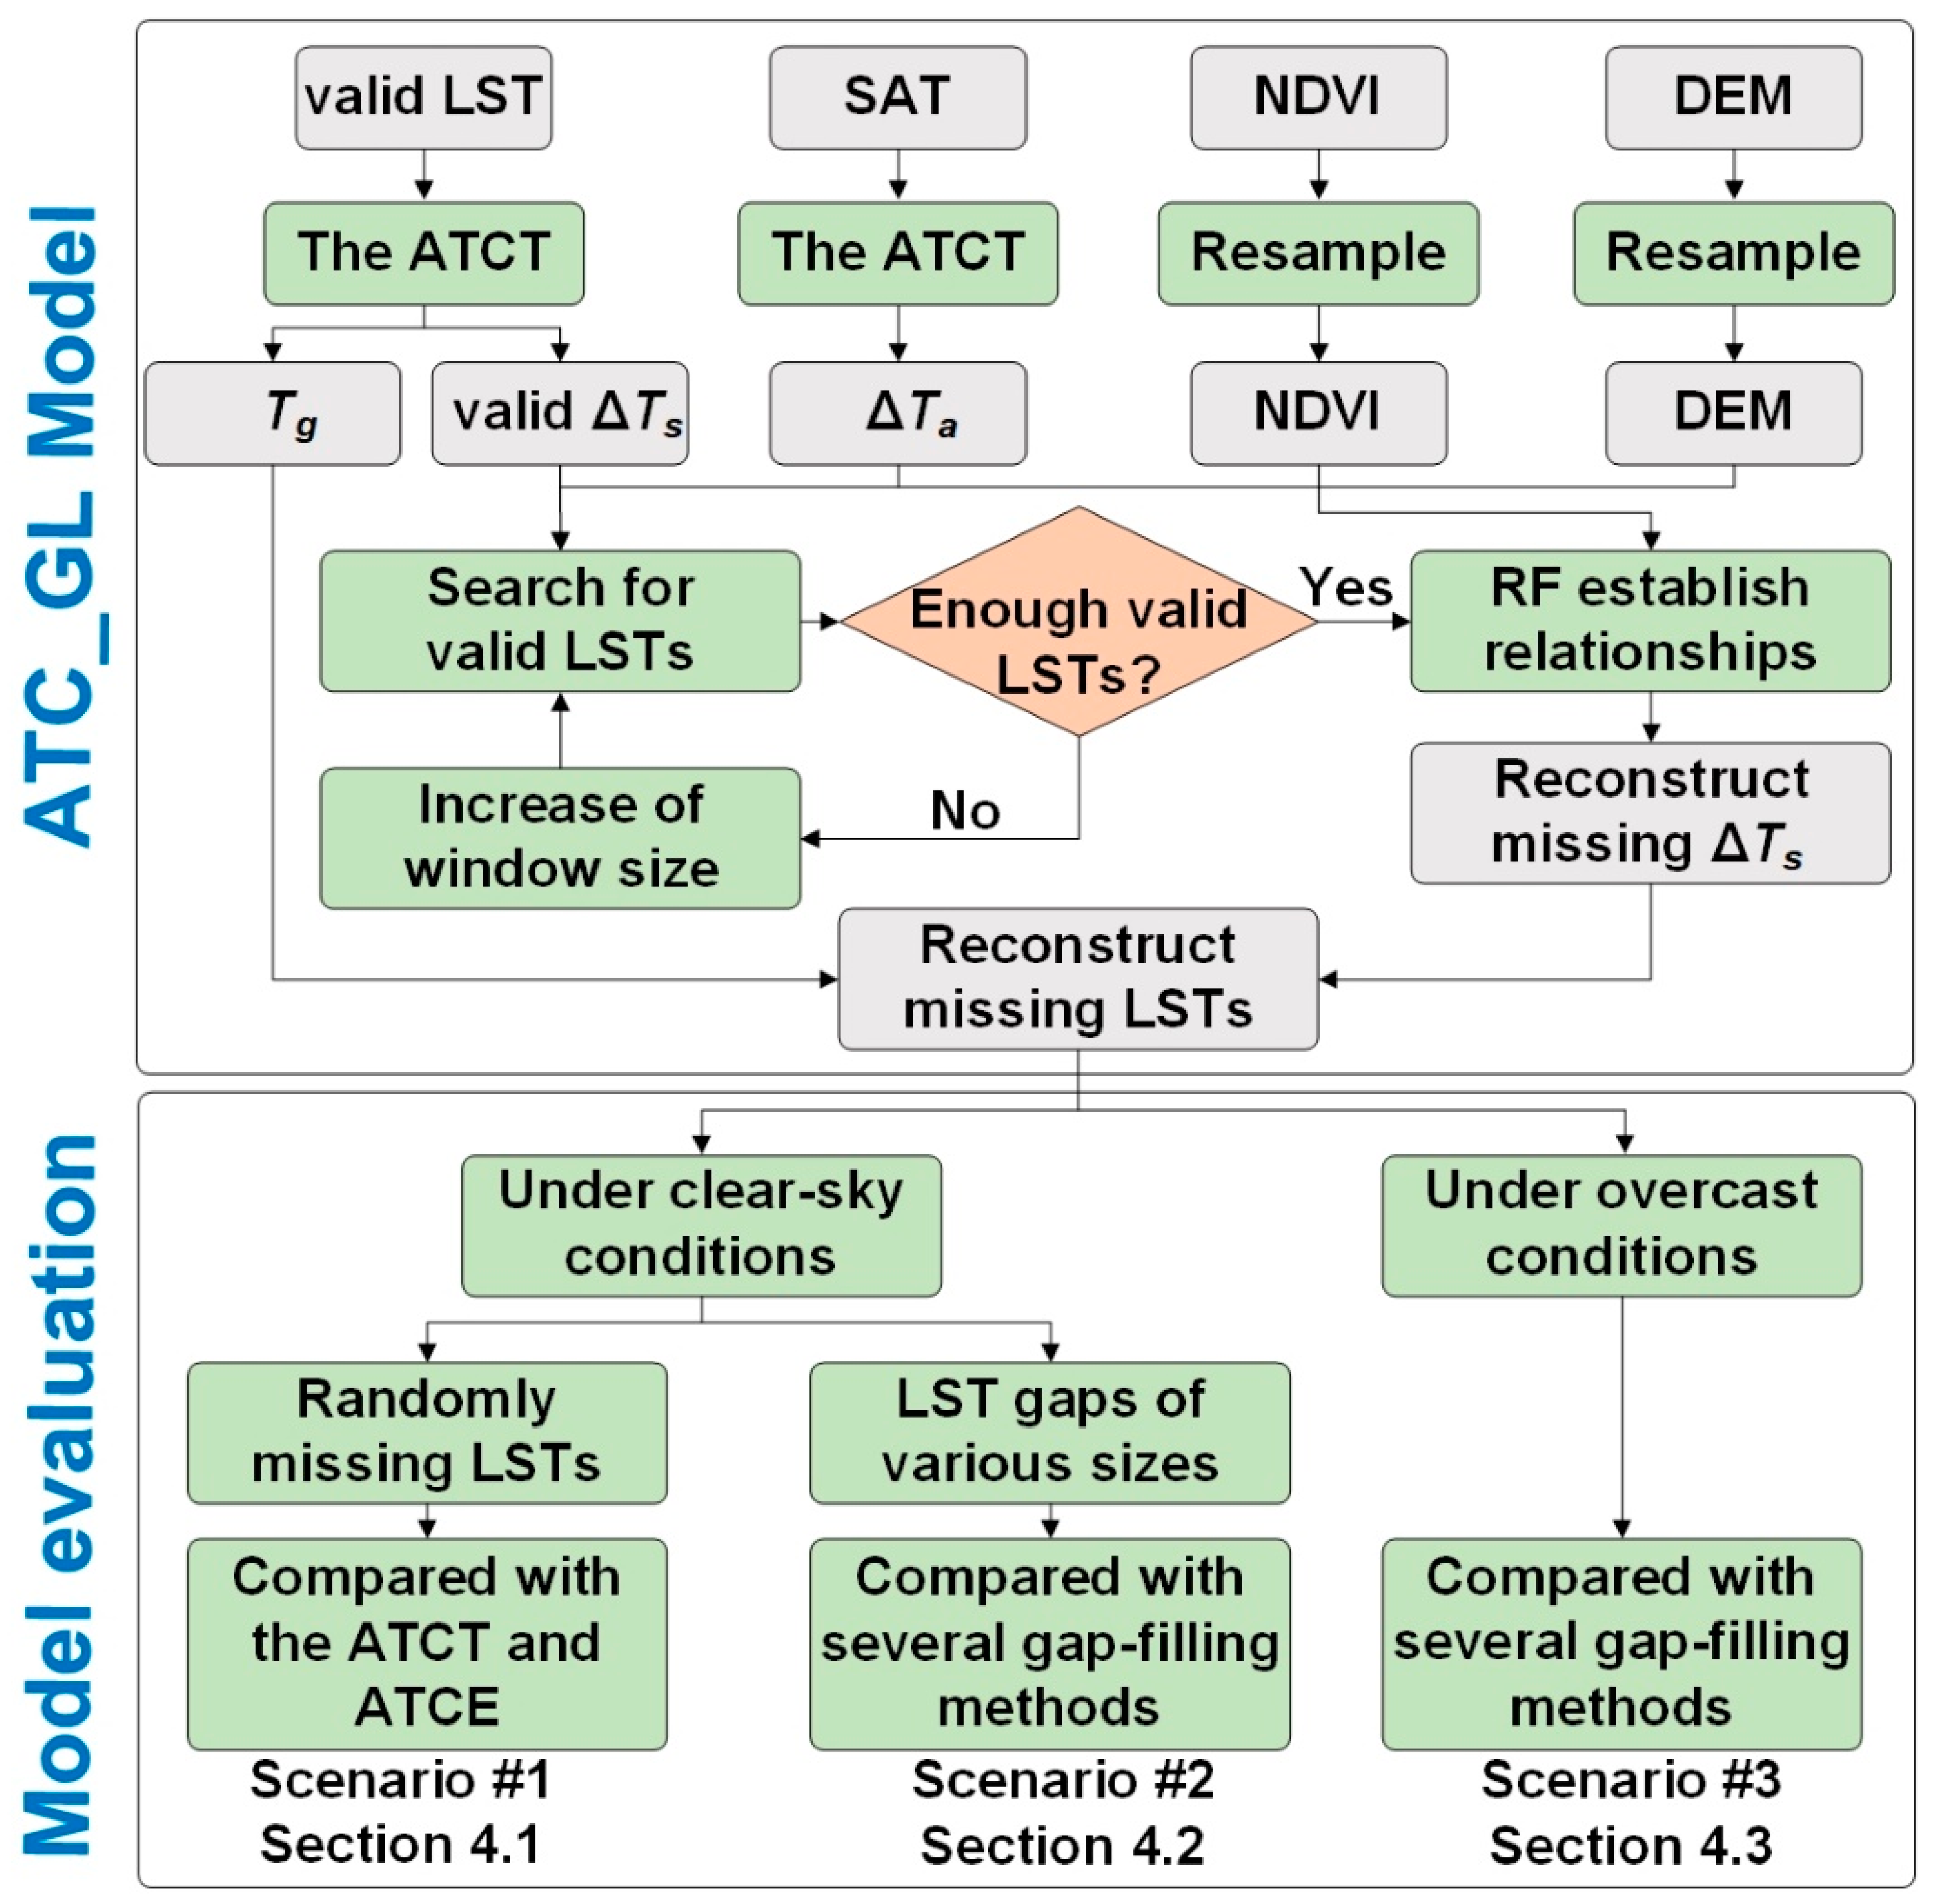
3.1. Modeling of Intra-Annual Land Surface Temperature Dynamics by Combining Spatiotemporally Global and Local Interpolations

Intra-annual LST dynamics can be mainly decomposed into two temporal categories: (1) the general seasonal (or monthly) cycle responding to solar radiation, and (2) the daily fluctuations caused by variations in synoptic conditions and surface thermal properties [19,22]. The ATC_GL addresses these categories separately. At the temporally global (seasonal) scale, the general seasonal LST dynamics (Tg) are modeled directly with the ATCT (see Section 3.1.1), a frequently used ATC model [17,19]. At the spatiotemporally local scale, the daily LST fluctuations (i.e., ΔTs) are statistically modeled using the RF algorithm and a series of LST-related descriptors related to synoptic and surface property variations (see Section 3.1.2). The general formula for the ATC_GL is written as follows:
T s ( d ) = T g ( d ) + Δ T s ( d ) = g ATCT ( d ) + f RF ( X )
where Ts is the modeled LST on day d relative to the spring equinox; Tg and ΔTs are the general seasonal cycles of the intra-annual LST dynamics and the daily LST fluctuations, respectively; Tg and ΔTs are the intra-annual LST cycle dynamics and the daily LST fluctuations, respectively; gATCT denotes the ATCT and is used to reconstruct the Tg; fRF represents the RF algorithm and is used to capture daily LST fluctuations through a series of synoptic and surface parameters (X), such as SAT, NDVI, DEM, and so on.

3.1.1. Reconstruction of Seasonal LST Cycle at the Temporally Global Scale

The existing ATC models are temporally global interpolations that capture the annual LST cycle by using sinusoidal functions to model periodical variations of solar irradiation [17,31]. Previous studies have demonstrated that the accuracy of ATCT modeled by a second harmonic function is generally better than the ATCO equipped with only a sine function, mostly because the annual cycle of solar irradiation is characterized by two annual maxima instead of one at low latitude regions [17,31]. To reconstruct seasonal LST cycles (Tg), we employed the ATCT, which can be expressed as follows:
T g ( d ) = g ATCT ( d ) = T s ¯ + A 1 sin ( ω 1 d + θ 1 ) + A 2 sin ( ω 2 d + θ 2 )
where gATCT denotes the modeled LST on day d relative to the spring equinox, T s ¯ is the annual mean LST, A1 and A2 are the ATC amplitudes, θ1 and θ2 are the corresponding phase shifts relative to the spring equinox, and ω1 and ω2 are two constants calculated as 2πN−1 and 4πN−1, respectively, where N is the number of days in an annual cycle (N = 365).

3.1.2. Reconstruction of Daily LST Fluctuations at the Spatiotemporally Local Scale

The available ATC models can describe the variation of LST within an annual cycle but are not suitable for characterizing short-term LST fluctuations, e.g., on the daily scale. The differences between the observed and fitted LSTs (denoted as the daily LST fluctuations) can be expressed by Equation (4):
Δ T s ( d ) = T s ( d ) g ATCT ( d )
In this study, we incorporated LST-related descriptors and the RF algorithm to simulate the daily LST fluctuations (ΔTs) at the spatiotemporally local scale. The number of decision trees and predictors of each split node were determined by the grid search method [48]. ΔTs is calculated using the following formula:
Δ T s = f RF ( X )
The relationships between ΔTs and the LST-related descriptors are determined by three factors: (1) the type of LST-related descriptors, (2) the type of regression tool (or statistical algorithm), and (3) the spatiotemporal window used for regression. For the type of LST-related descriptors, ΔTs is closely related to surface parameters, such as NDVI and DEM, and is also synchronized with SAT under different synoptic conditions [11,19,22]; thus, we incorporated SAT, NDVI, and DEM to describe ΔTs. However, we did not incorporate SAT directly but included its daily variations (i.e., ΔTa), which can be estimated with the following formula:
Δ T a ( d ) = T a ( d ) g ATCT _ a ( d ) = T a ( d ) { T a ¯ + A 3 sin ( ω 1 d + θ 3 ) + A 4 sin ( ω 2 d + θ 4 ) }
where Ta denotes the SAT, ΔTa denotes its daily fluctuations, and gATCT_a denotes the seasonal cycle in the intra-annual SAT dynamics determined by the ATCT. A3 and A4 are the ATC amplitudes of SAT; θ1 and θ2 are the corresponding phase shifts relative to the spring equinox of SAT. For the regression tool, we used the RF algorithm to model the regression between ΔTs and the LST-related descriptors. The RF algorithm shows especially high performance in modeling complex relationships among parameters [49] and is widely used in remote sensing communities [15,50]. For the spatiotemporal window used for regression, we employed a spatiotemporally adaptive local window to incorporate valid (i.e., cloud-free) pixels. The initial window size for the spatial dimension was set to 9 × 9 km2 and that for the temporal dimension was set to 1 day. The spatiotemporal window was expanded when the number of valid LSTs was lower than the threshold. Starting from the initial size, the spatiotemporal window size was iteratively increased by 2 pixels and 2 days from the spatial and temporal dimensions, respectively. Further discussions on the setting of the spatiotemporal window and the increased sizes of spatial and temporal windows are provided in Figure A1 and Figure A2 and Table A1 of Appendix A. We further repeated this process until there were sufficient valid pixels included. The threshold of the valid pixel number was set to 10 [18]. Notably, the proposed ATC_GL predicts each missing pixel separately during the reconstruction process.

3.2. Evaluation Strategies

The model performance was evaluated using three strategies and was quantified using two statistical metrics including absolute root-mean-square errors (RMSE) and R2 [51].
The ATC_GL combines both the spatially local information and LST-related descriptors based on the existing annual temperature cycle model. Three strategies were employed to evaluate the contributions of spatially local information, temporally global information, and LST-related descriptors, independently. Strategy 1 compares the performances of the ATC_GL and two classical ATC models (i.e., the ATCE and ATCT) when LSTs are randomly missing. Given that, satellite-derived LST images are invalid in a relatively large area. Strategy 2 compares the performances of the ATC_GL with classical temporally local interpolations, spatially local interpolations, and hybrid methods with varying LST gaps. Strategy 3 evaluated the model performances of the ATC_GL and several popular gap-filling methods under overcast conditions.
Strategy 1: For the scenario with randomly missing LSTs under clear-sky conditions, the performance of the ATC_GL was compared with that of two typical ATC models (i.e., the ATCE and ATCO). For this strategy, 70% of the clear-sky LSTs were randomly selected as training data, and the rest were used for validation. This strategy considered data for Regions A–G.
Strategy 2: For the scenario with LST gaps of various sizes under clear-sky conditions, the performance of the ATC_GL was compared with that of several commonly used LST gap-filling methods, including the ATCH, Kriging interpolation, RSDAST, and HIT. The RSDAST, referring to a representative of spatiotemporally local methods, uses the distance relationships between invalid pixels and adjacent LSTs in spatiotemporally local windows to reconstruct missing LSTs [6]. The HIT is a hybrid method that integrates the observed values at the other overpasses in the same day, the spatiotemporally local interpolation, and the temporally global interpolation [18]. Ten LST images (each of a single day) of Region H, with more than 80% valid pixels, were randomly selected. We then produced 14 gaps with different sizes in the selected LST images, which are labelled as G01 (10 × 10) to G14 (500 × 500). The sizes of the produced gaps were 10 × 10, 20 × 20, 30 × 30, 40 × 40, 50 × 50, 60 × 60, 70 × 70, 80 × 80, 90 × 90, 100 × 100, 200 × 200, 300 × 300, 400 × 400, and 500 × 500 pixels. The performances of the methods above were assessed by the original valid LST values in the gaps.
Strategy 3: For the scenario of overcast conditions, Region A was selected to evaluate the performances of the ATC_GL and several popular LST gap-filling methods (including the ATCH, ATCE, Kriging, RSDAST, and HIT). For this strategy, the clear-sky values of LSTMW in Region A were used as training data, while the LSTMW values labelled with a cloud tag were used for validation. In addition, in situ measurements from seven SURFRAD sites in 2018 were used to evaluate the ATC_GL under overcast conditions.

4. Results

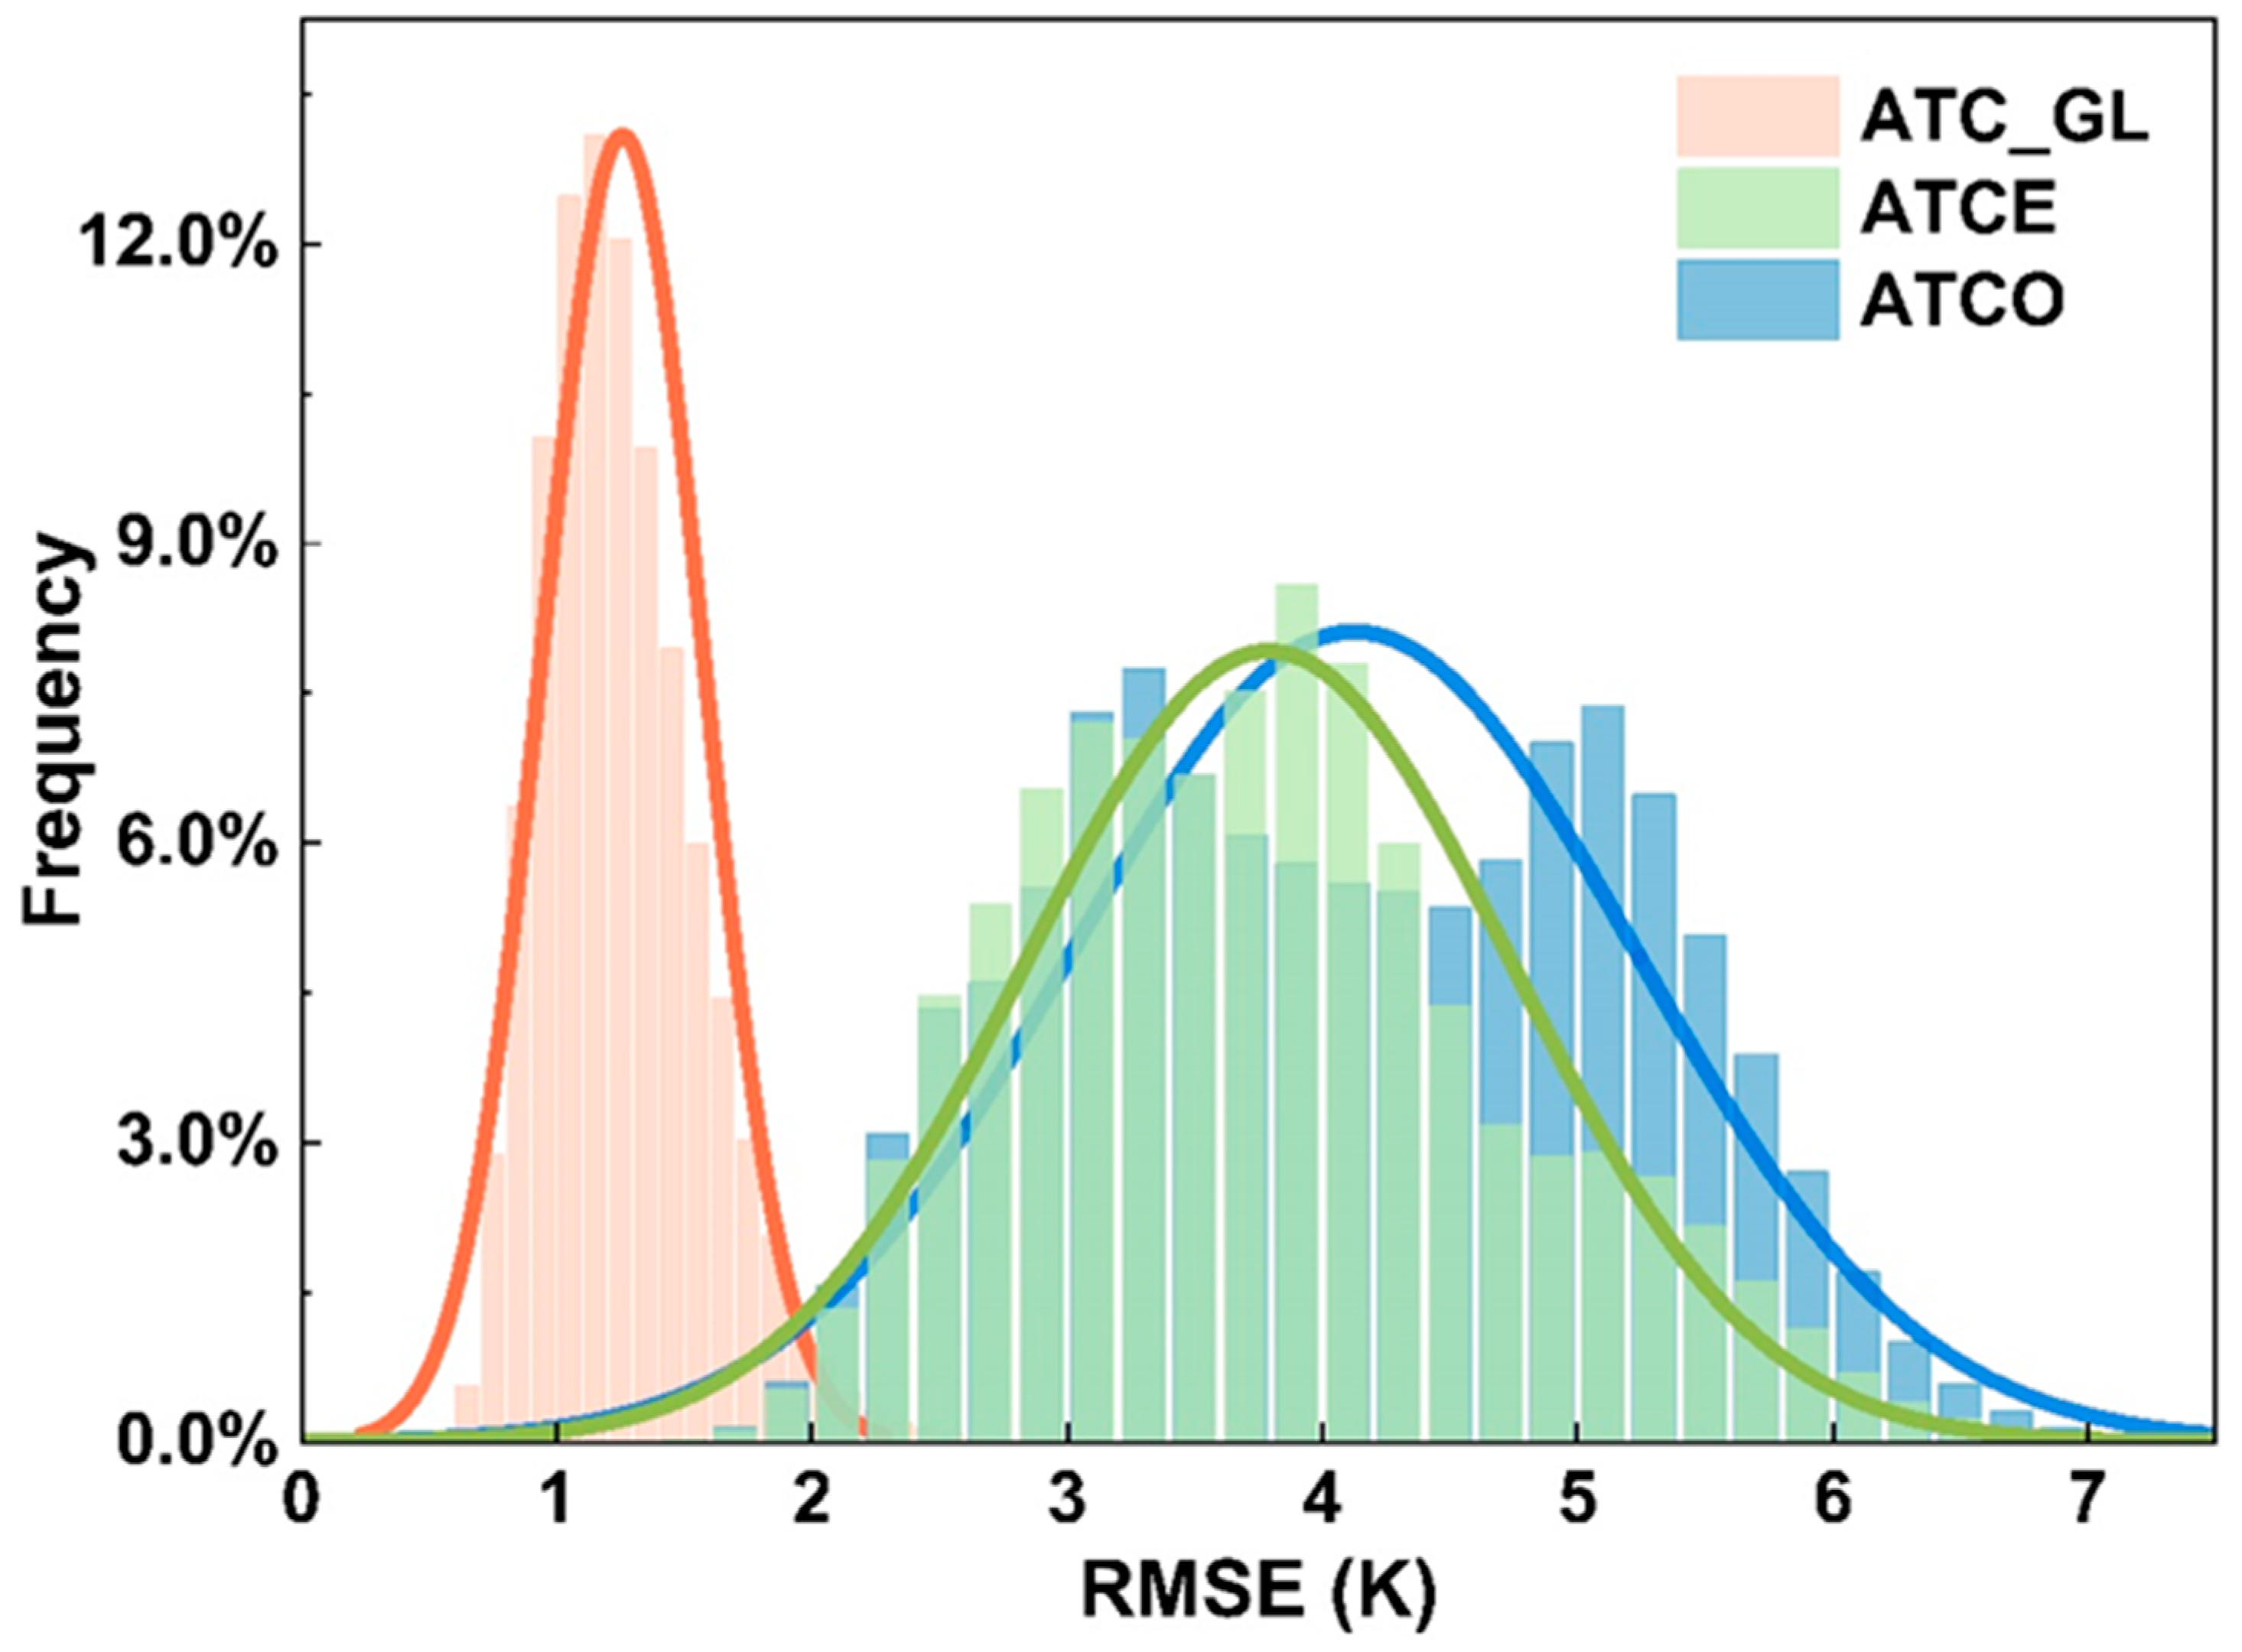
4.1. Comparison of Model Performances in Strategy 1

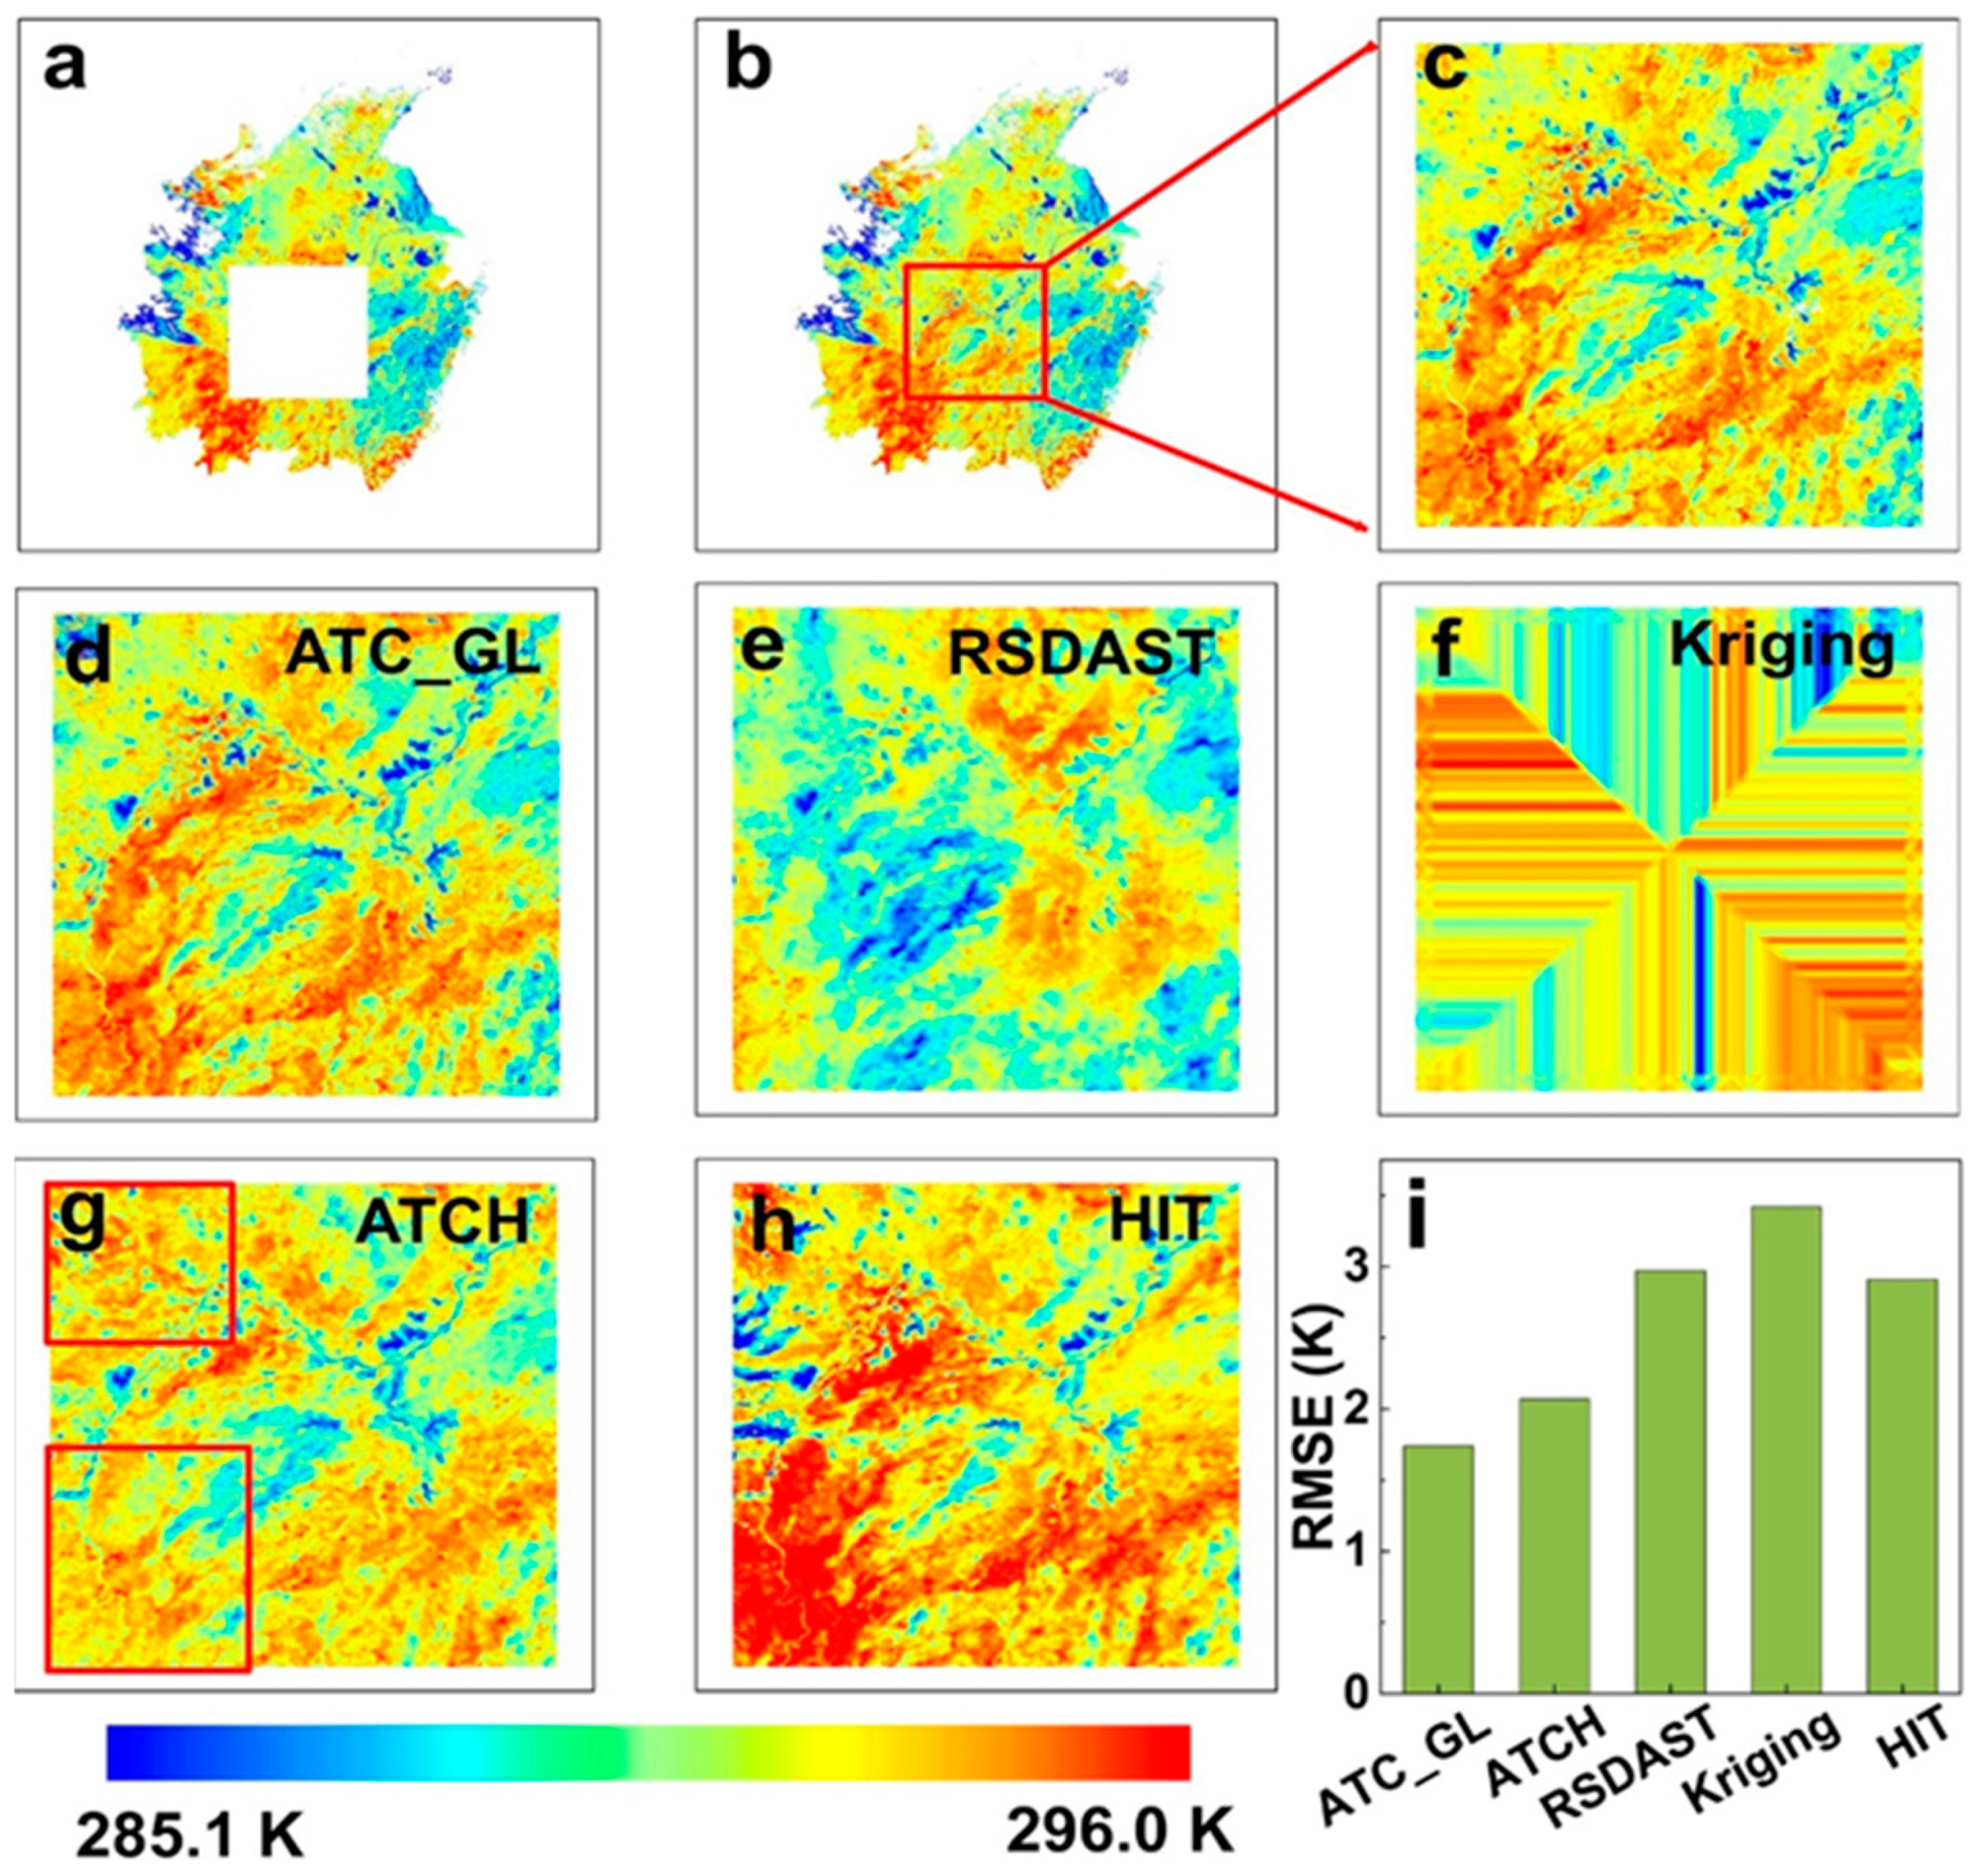
4.1.1. Spatial Distribution of Model Performances

The overall performances of the ATC_GL, ATCE, and ATCO, as well as the accuracy improvement of the ATC_GL when compared with the ATCE (termed Drmse_ATCE) and ATCO (termed Drmse_ATCO), are shown in Figure 4. The mean RMSEs of the ATC_GL, ATCE, and ATCO models were 1.1 K, 3.5 K, and 4.2 K, respectively. As for different regions, the higher RMSEs of the ATC_GL occur in Regions B and E, and the relatively lower ones occur in the other regions. This may be because Regions B and E are located in the north and east of the Tibet Plateau, which is the junction of China’s first and second ladders. The topography and climate conditions vary greatly in Regions B and E, causing drastic variations between adjacent pixels and days [12,51]. Consequently, the performance of the ATC_GL is lower in these high-heterogeneity regions than in other regions. Additionally, the RMSE distribution of the ATC_GL shows a smaller range (0.7–2.0 K) than that of the ATCE and ATCO (2.0–6.5 K; Figure 5) and the maximum frequency interval of the RMSE of each model is slightly smaller than the mean value of RMSE. The spatial distributions of the ATC_GL were relatively homogeneous within each study area when compared with those of the ATCE and ATCO. This result indicates that the ATC_GL can better predict spatiotemporally local variations during LST reconstruction than the other two ATC models. In Regions A, B, and C (located in northern, northeastern, and northwestern China, respectively), the accuracy of the ATC_GL was more than 3.0 K greater than that for the ATCE and ATCO (Figure 4A4–C4,A5–C5); this result may be attributed to the high daily and intra-annual LST variation in these regions, where barren and grassland areas are the major land cover types [52,53,54,55].
The ATC_GL had the highest accuracy for all land cover types (Figure 6). The highest and lowest RMSE for the ATC_GL was estimated in barren land (1.81 K) and farmland (0.92 K), respectively. The RMSEs of the ATCE and ATCO were relatively similar (Figure 6); both the ATCE and ATCO showed maximum RMSEs in barren land (5.29 K and 5.53 K, respectively) and minimum RMSEs over water bodies (2.81 K and 3.04 K, respectively). The pronounced differences in RMSE between the land cover types for the ATCE and ATCO (more than 2.0 K) indicate that the performance of the ATC_GL remained relatively stable. The accuracy enhancement of the ATC_GL was the highest in barren areas (exceeding 3.5 K), with lower differences in accuracy observed between the models for forests, wetlands, and water bodies (more than 1.5 K; Figure 6). This result may reflect the reduced degree of LST fluctuation over dense vegetation and areas with high soil moisture because of higher levels of evapotranspiration and specific heat capacity [52,53,54,55].
The ATC_GL had the highest accuracy for all land cover types (Table 4). The highest and lowest RMSE for the ATC_GL was estimated in barren land (1.8 K) and cropland (0.9 K), respectively. The RMSEs of the ATCE and ATCO were relatively similar (Table 4); both the ATCE and ATCO showed maximum RMSEs in barren land (5.3 K and 5.9 K, respectively) and minimum RMSEs over water bodies (2.8 K and 3.3 K, respectively). The pronounced differences in RMSE between the land cover types for the ATCE and ATCO (more than 2.0 K) indicate that the performance of the ATC_GL (less than 0.9 K) remained relatively stable. The accuracy improvement of the ATC_GL was the highest in barren areas (exceeding 3.5 K), while there were relatively lower accuracies for forests, wetlands, and water bodies (more than 1.5 K; Table 4). The R2 of the ATC_GL (exceed 0.94) was significantly higher than that of the ATCE (0.86–0.92) and the ATCO (0.87–0.94). A smaller RMSE usually corresponds to a larger R2 for various land cover types. This result may reflect that the magnitude of the accuracy improvement depends on the LST fluctuation magnitude of the ATC_GL method. The improvement is relatively small where LSTs keep relatively stable, such as in forest, wetland and water body, probably because the ATCE and ATCO can achieve high accuracy in these areas [19]. On the contrary, the improvement is relatively higher where LSTs have high variations [56,57,58]. That is because the ATCE and ATCO have poor performance in such areas, while the ATC_GL can better reflect the spatial variations of LSTs in these areas by incorporating spatially local information.

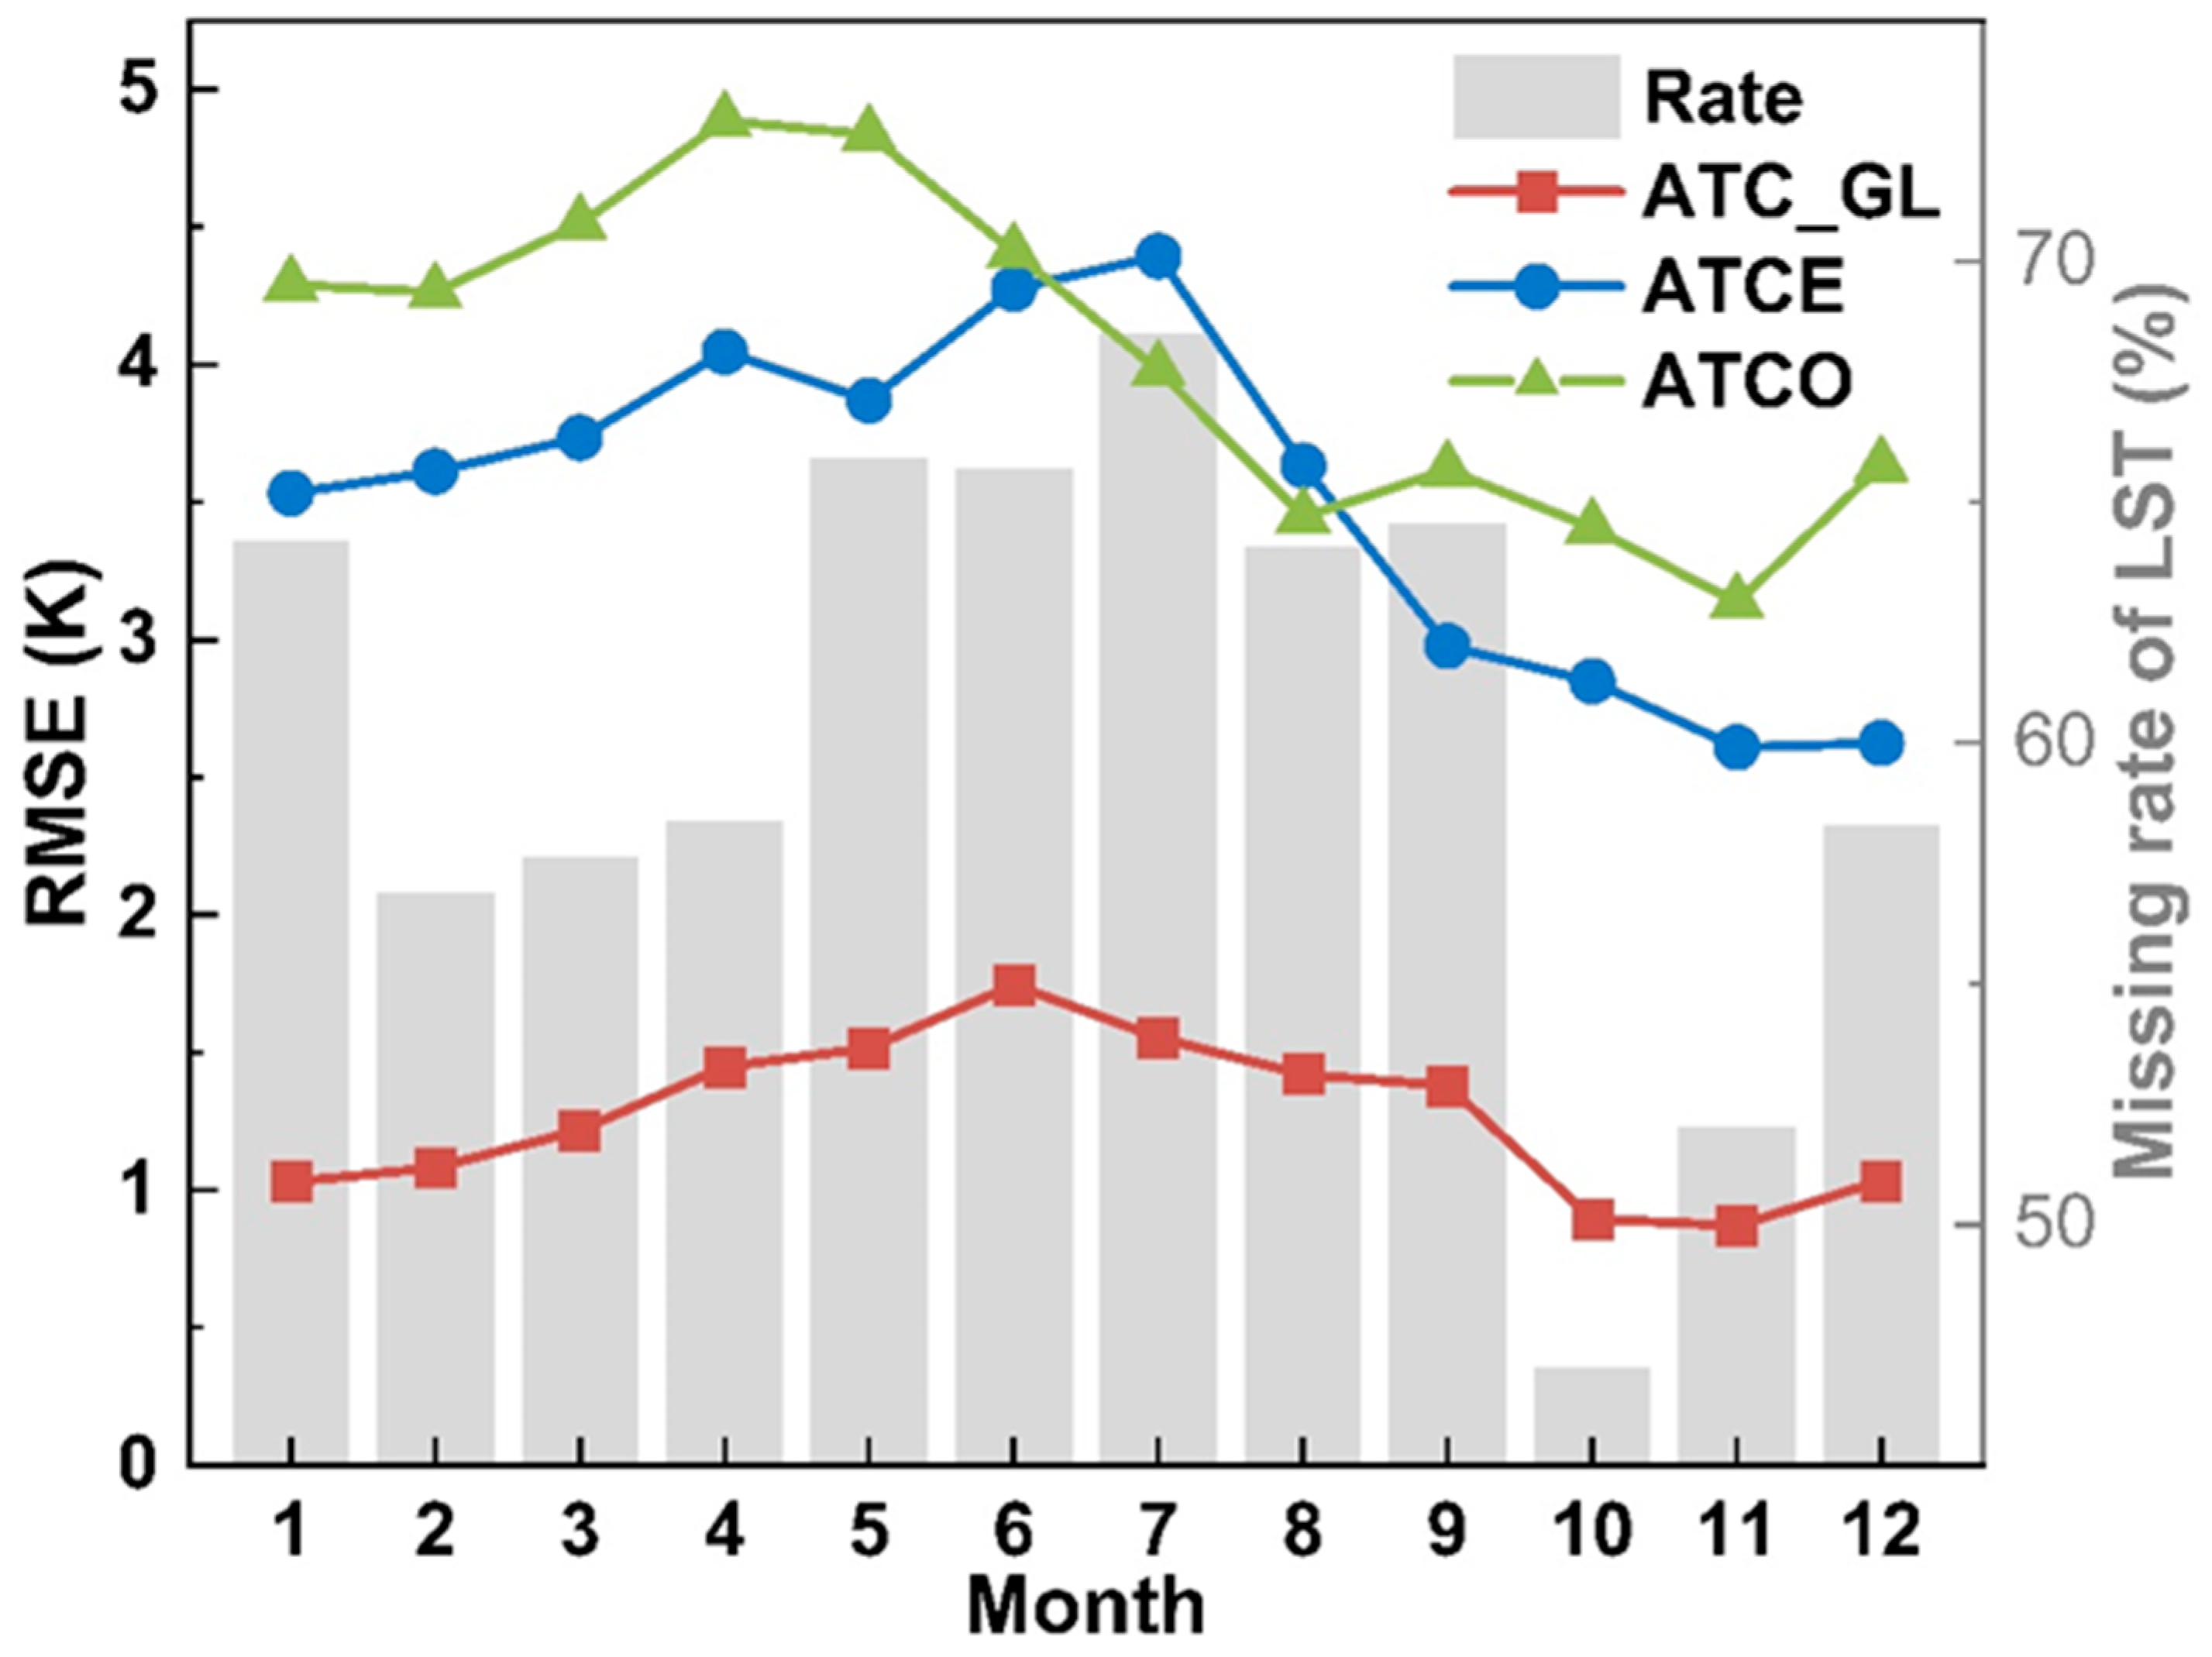
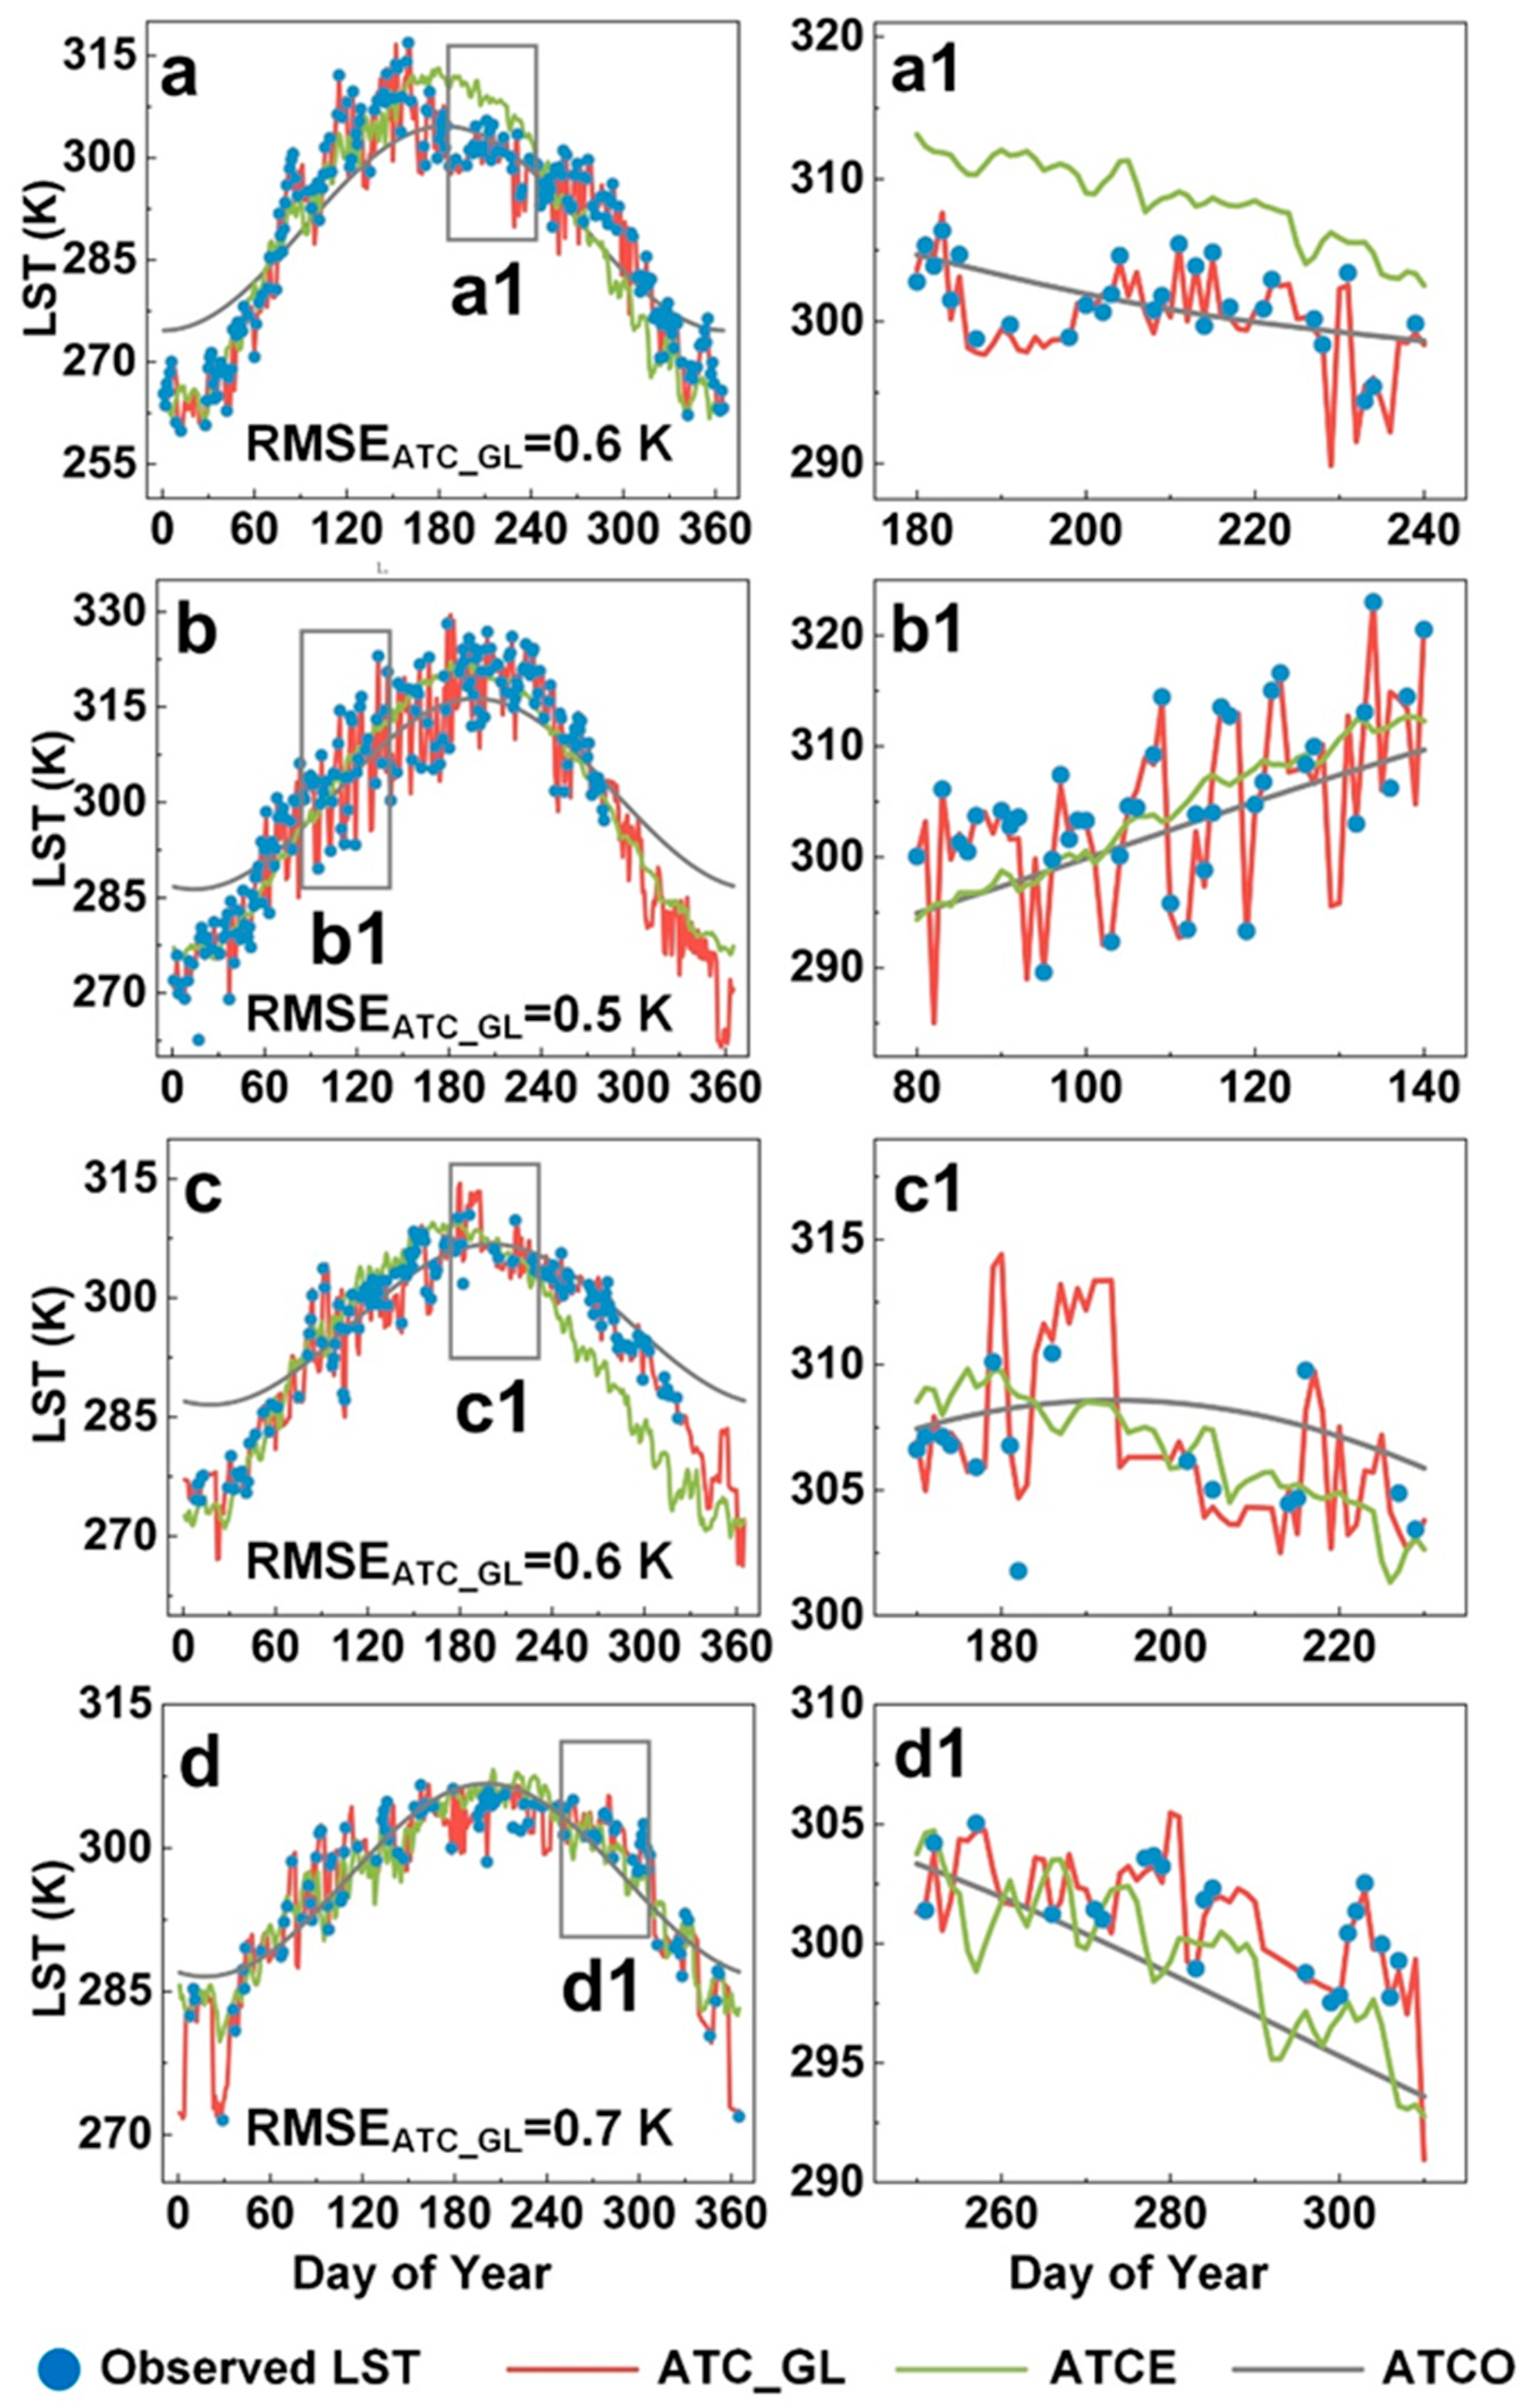
4.1.2. Monthly and Daily Performance of the Models

On a monthly scale, the performance of the ATC_GL was the most stable when compared with that of the ATCE and ATCO. Specifically, The RMSEs of the ATCE and ATCO were 2.6–4.4 K and 3.2–5.2 K, respectively, far exceeding the RMSE of the ATC_GL (0.9–1.7 K). Additionally, the RMSEs of the three models were relatively low from October to November and relatively high from May to July (Figure 7). The main reasons are as follows: the performances of the three models are generally related to the LST missing rate of the original MODIS LST data. There is no adequate neighborhood information when the LST missing rate is high; as a consequence, the spatiotemporal window will increase until the number of observed LSTs is satisfied. However, the use of LSTs with a large spatial or temporal distance can cause more uncertainties. Secondly, we speculate the performances of the three models are related to the LST values. The LSTs are high in the Northern Hemisphere in May to September, when the corresponding RMSEs of models are relatively large. When the LSTs are high, an annual temperature cycle may not be fully capable of capturing the seasonal variation of LSTs; as a consequence, the corresponding model RMSEs are relatively large.
The ATC_GL can more accurately model detailed fluctuations within short intervals than the ATCE and ATCO, with the estimated values being largely consistent with the observed LSTs (Figure 8). The ATCO can effectively quantify intra-annual LST dynamics, but is less capable of handling daily LST fluctuations. The ATCE is superior to the ATCO in describing daily LST fluctuations (Figure 8b1–d1); however, the accuracy of the estimated fluctuations is affected by overestimation or underestimation. These results indicate that, although model performance can be enhanced by the inclusion of LST-related descriptors with temporally global interpolation, the incorporation of spatiotemporally global and local information along with appropriate statistical methods (i.e., RF) can more effectively improve model performance (refer to Section 5.1).

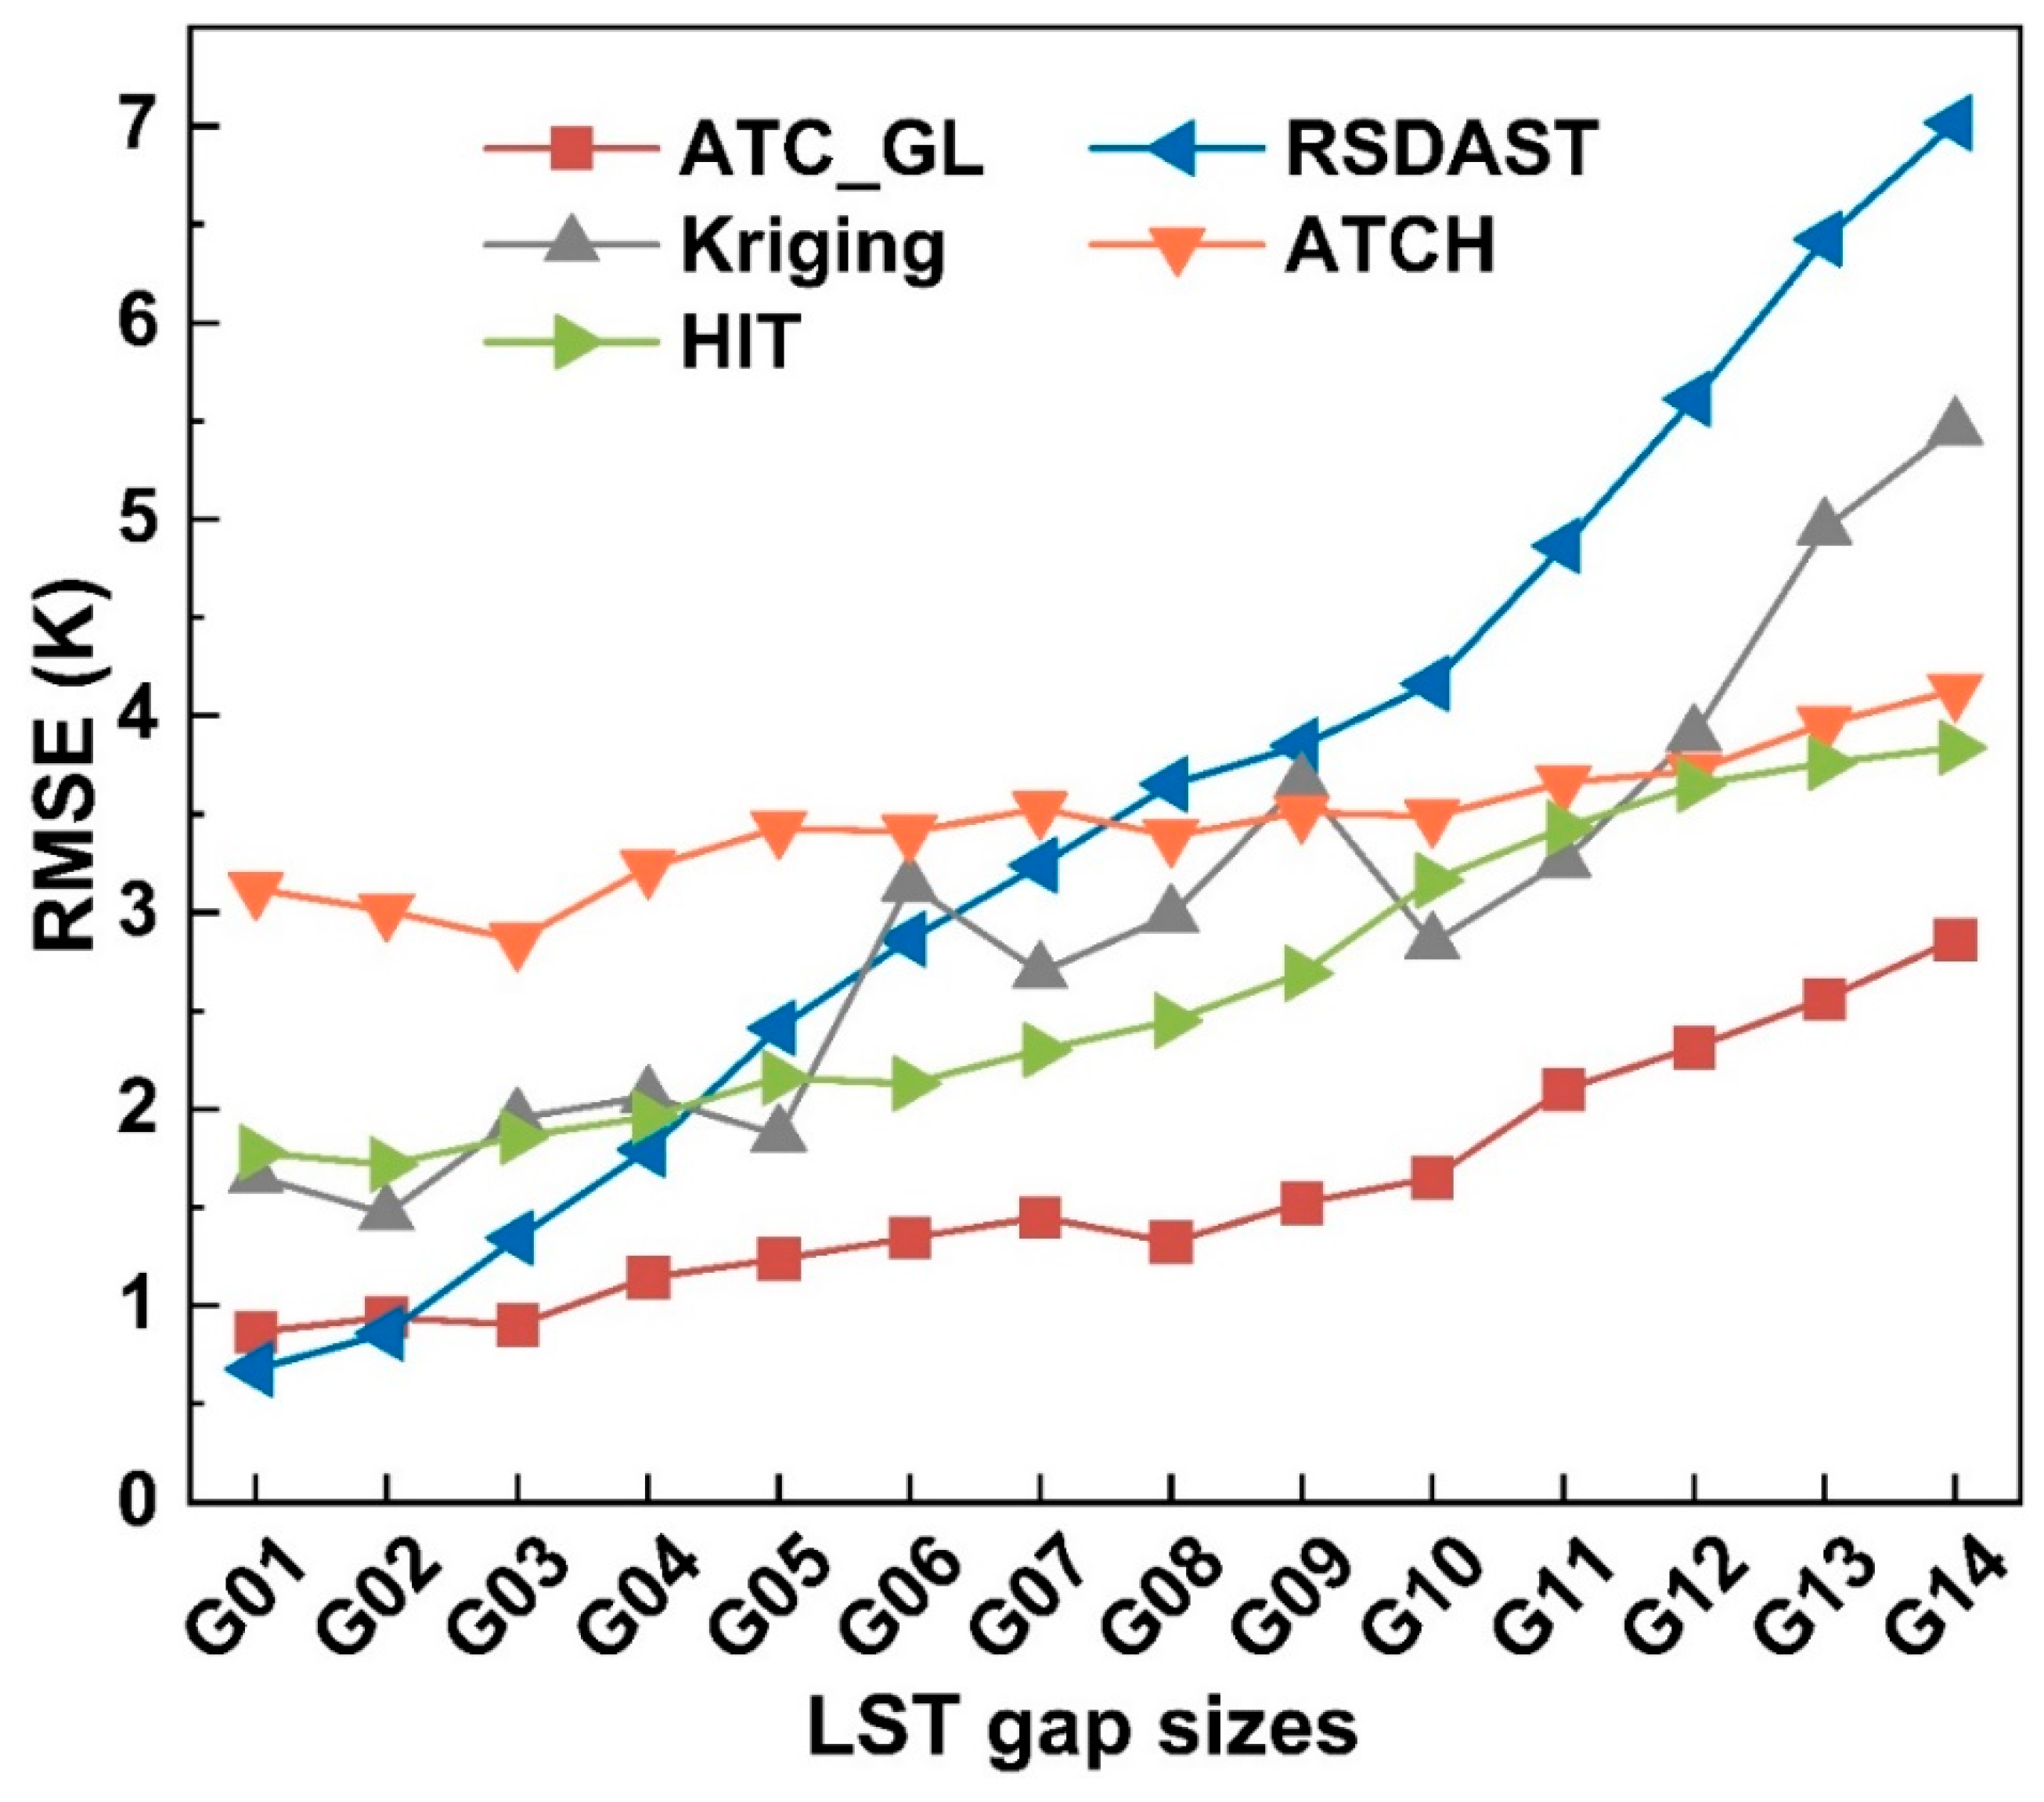
4.2. Comparison of Model Performances in Strategy 2

The ATC_GL had the highest accuracy in most cases, and its performance was less affected by the size of the LST gap (Figure 9). The RMSEs of the ATC_GL increased from 0.8 to 2.6 K with an increase in LST gap size. The performance of the Kriging interpolation decreased gradually with an increase in gap size, although it remained stable (1.4–2.0 K) at relatively small gap sizes (smaller than 50 × 50 pixels). The RMSEs of the HIT were 1.0–1.5 K higher than those of the ATC_GL, although the variation across time was similar between the models. The accuracy of the RSDAST was slightly higher than that of the ATC_GL at very small gap sizes (smaller than 20 × 20 pixels). However, its performance decreased dramatically with an increase in gap size, and the RSDAST was the poorest performing model at gap sizes larger than 80 × 80 pixels.
Compared to the other models, the ATC_GL had the highest accuracy (RMSE = 1.7 K) and preserved the best spatial detail at the largest LST gap size (500 × 500 pixels; Figure 10). The RSDAST (RMSE = 3.0 K) and Kriging interpolation (RMSE = 3.4 K) showed the worst performance in estimating spatial variation. These findings indicate that spatially local interpolations may be less effective or even unfeasible at large gap sizes. The HIT is relatively capable of estimating the LST contrast in this region; however, its overall accuracy was low (RMSE = 2.9 K). The ATCH (RMSE = 2.0 K) had the second highest accuracy among the models and showed the greatest differences in accuracy with the ATC_GL in the regions as shown by the red boxes in Figure 10g.

4.3. Comparison of Model Performances in Strategy 3

For the scenario of overcast conditions, the performance of the ATC_GL was again compared with those of the LST gap-filling methods mentioned in Strategy 2 (the ATCE, ATCH, RSDAST, Kriging, and HIT) (refer to Appendix C for the details of study areas and data). The ATC_GL had the highest accuracy in overcast conditions (RMSE = 3.7 K, R2 = 0.93; Figure 11). The RMSEs of the ATCE, ATCH, Kriging interpolation, and HIT were 5.8 K, 5.1 K, 4.7 K, and 5.2 K, respectively. Notably, the LSTs in overcast conditions may be overestimated by the ATC_GL especially in the range of 275.0 K to 290.0 K, although the level of overestimation is relatively lower when compared with other gap-filling models (Figure 10). The overestimation may be associated with the inadequate capability of SAT to fully grasp the LST dynamics under overcast conditions, especially for regions with large LST gaps [19,59]. We further need to note that the ATC_GL is indeed a framework for LST reconstruction, which can adjust parameter combinations in different scenarios. The performance of the framework is expected to improve if more auxiliary parameters related to overcast conditions (e.g., longwave and shortwave radiation and soil moisture) are incorporated [41].
In addition, the performance of the ATC_GL was evaluated using SURFRAD LSTs under both clear-sky and overcast conditions. Prior to the model evaluation, the systematic differences between MODIS and SURFRAD LSTs were corrected mainly by referring to previous studies [35,60,61]. The ATC_GL maintains high accuracy under both clear-sky (RMSE ranges from 0.5 to 1.0 K) and overcast conditions (RMSE ranges from 2.1 to 4.1 K) (Table 5). We believe that the performance of the ATC_GL may be further improved once more auxiliary data under overcast conditions are employed.

5. Discussion

5.1. Advantages of the ATC_GL Reference to Previous Methods

Our assessments have shown that the ATC_GL has the highest accuracy when compared with several commonly used gap-filling methods (i.e., the Kriging interpolation, RSDAST, ATCE, ATCH, and HIT). The RSDAST and Kriging methods mainly use spatially or spatiotemporally local information for LST reconstruction and exhibit relatively high accuracy when LST gaps are small. However, as LST gap size increases, the performance of these two methods decreases significantly, likely due to the lack of neighborhood information and LST-related descriptors (e.g., NDVI and SAT), both of which are important factors in LST reconstruction. By comparison, the ATCE and ATCH do incorporate LST-related descriptors in a temporally global fashion, and their accuracies are generally insensitive to the size of the LST gap [19]. However, the ATCE and ATCH ignore spatiotemporally local information among adjacent pixels and only use linear regressions to characterize the relationships between LST and LST-related descriptors; thus, their accuracy is usually lower than those that incorporate spatially local information especially when the LST gaps are relatively small [42]. For LST reconstruction, the HIT incorporates a dynamic spatiotemporal window to avoid error accumulation during repeated interpolations with the already reconstructed LSTs [18]. However, similar to the RSDAST and Kriging methods, the HIT does not use LST-related descriptors and therefore has a relatively low performance under overcast conditions.
The ATC_GL incorporates both temporally global and spatiotemporally local interpolations. From the temporally global perspective (i.e., monthly or seasonal cycles), the ATC_GL incorporates the seasonal cycle of solar radiation to reconstruct intra-annual LST dynamics; therefore, it is insensitive to LST gap size, especially compared with the methods based on spatiotemporally local interpolations. From the spatiotemporally local scale, the ATC_GL incorporates the RF algorithm in obtaining the complex relationships between daily LST fluctuations and a series of relevant factors (e.g., the daily SAT fluctuations, NDVI, and DEM) within dynamic spatiotemporal windows. The ATC_GL is therefore suitable for LST reconstruction with complex surface properties. Briefly, the ATC_GL presents the following two key advantages when compared with previous ATC models: (1) the better use of spatiotemporally local information within dynamic spatiotemporal windows, and (2) a more realistic estimation of the relationships between LSTs and LST-related descriptors with the RF algorithm. The ATC_GL is a simple yet robust model that is able to reconstruct accurately spatiotemporally continuous LSTs. In addition, the ATC_GL is also independent of auxiliary data (i.e., only requiring globally acquirable LST and reanalysis data) and thus applicable globally.

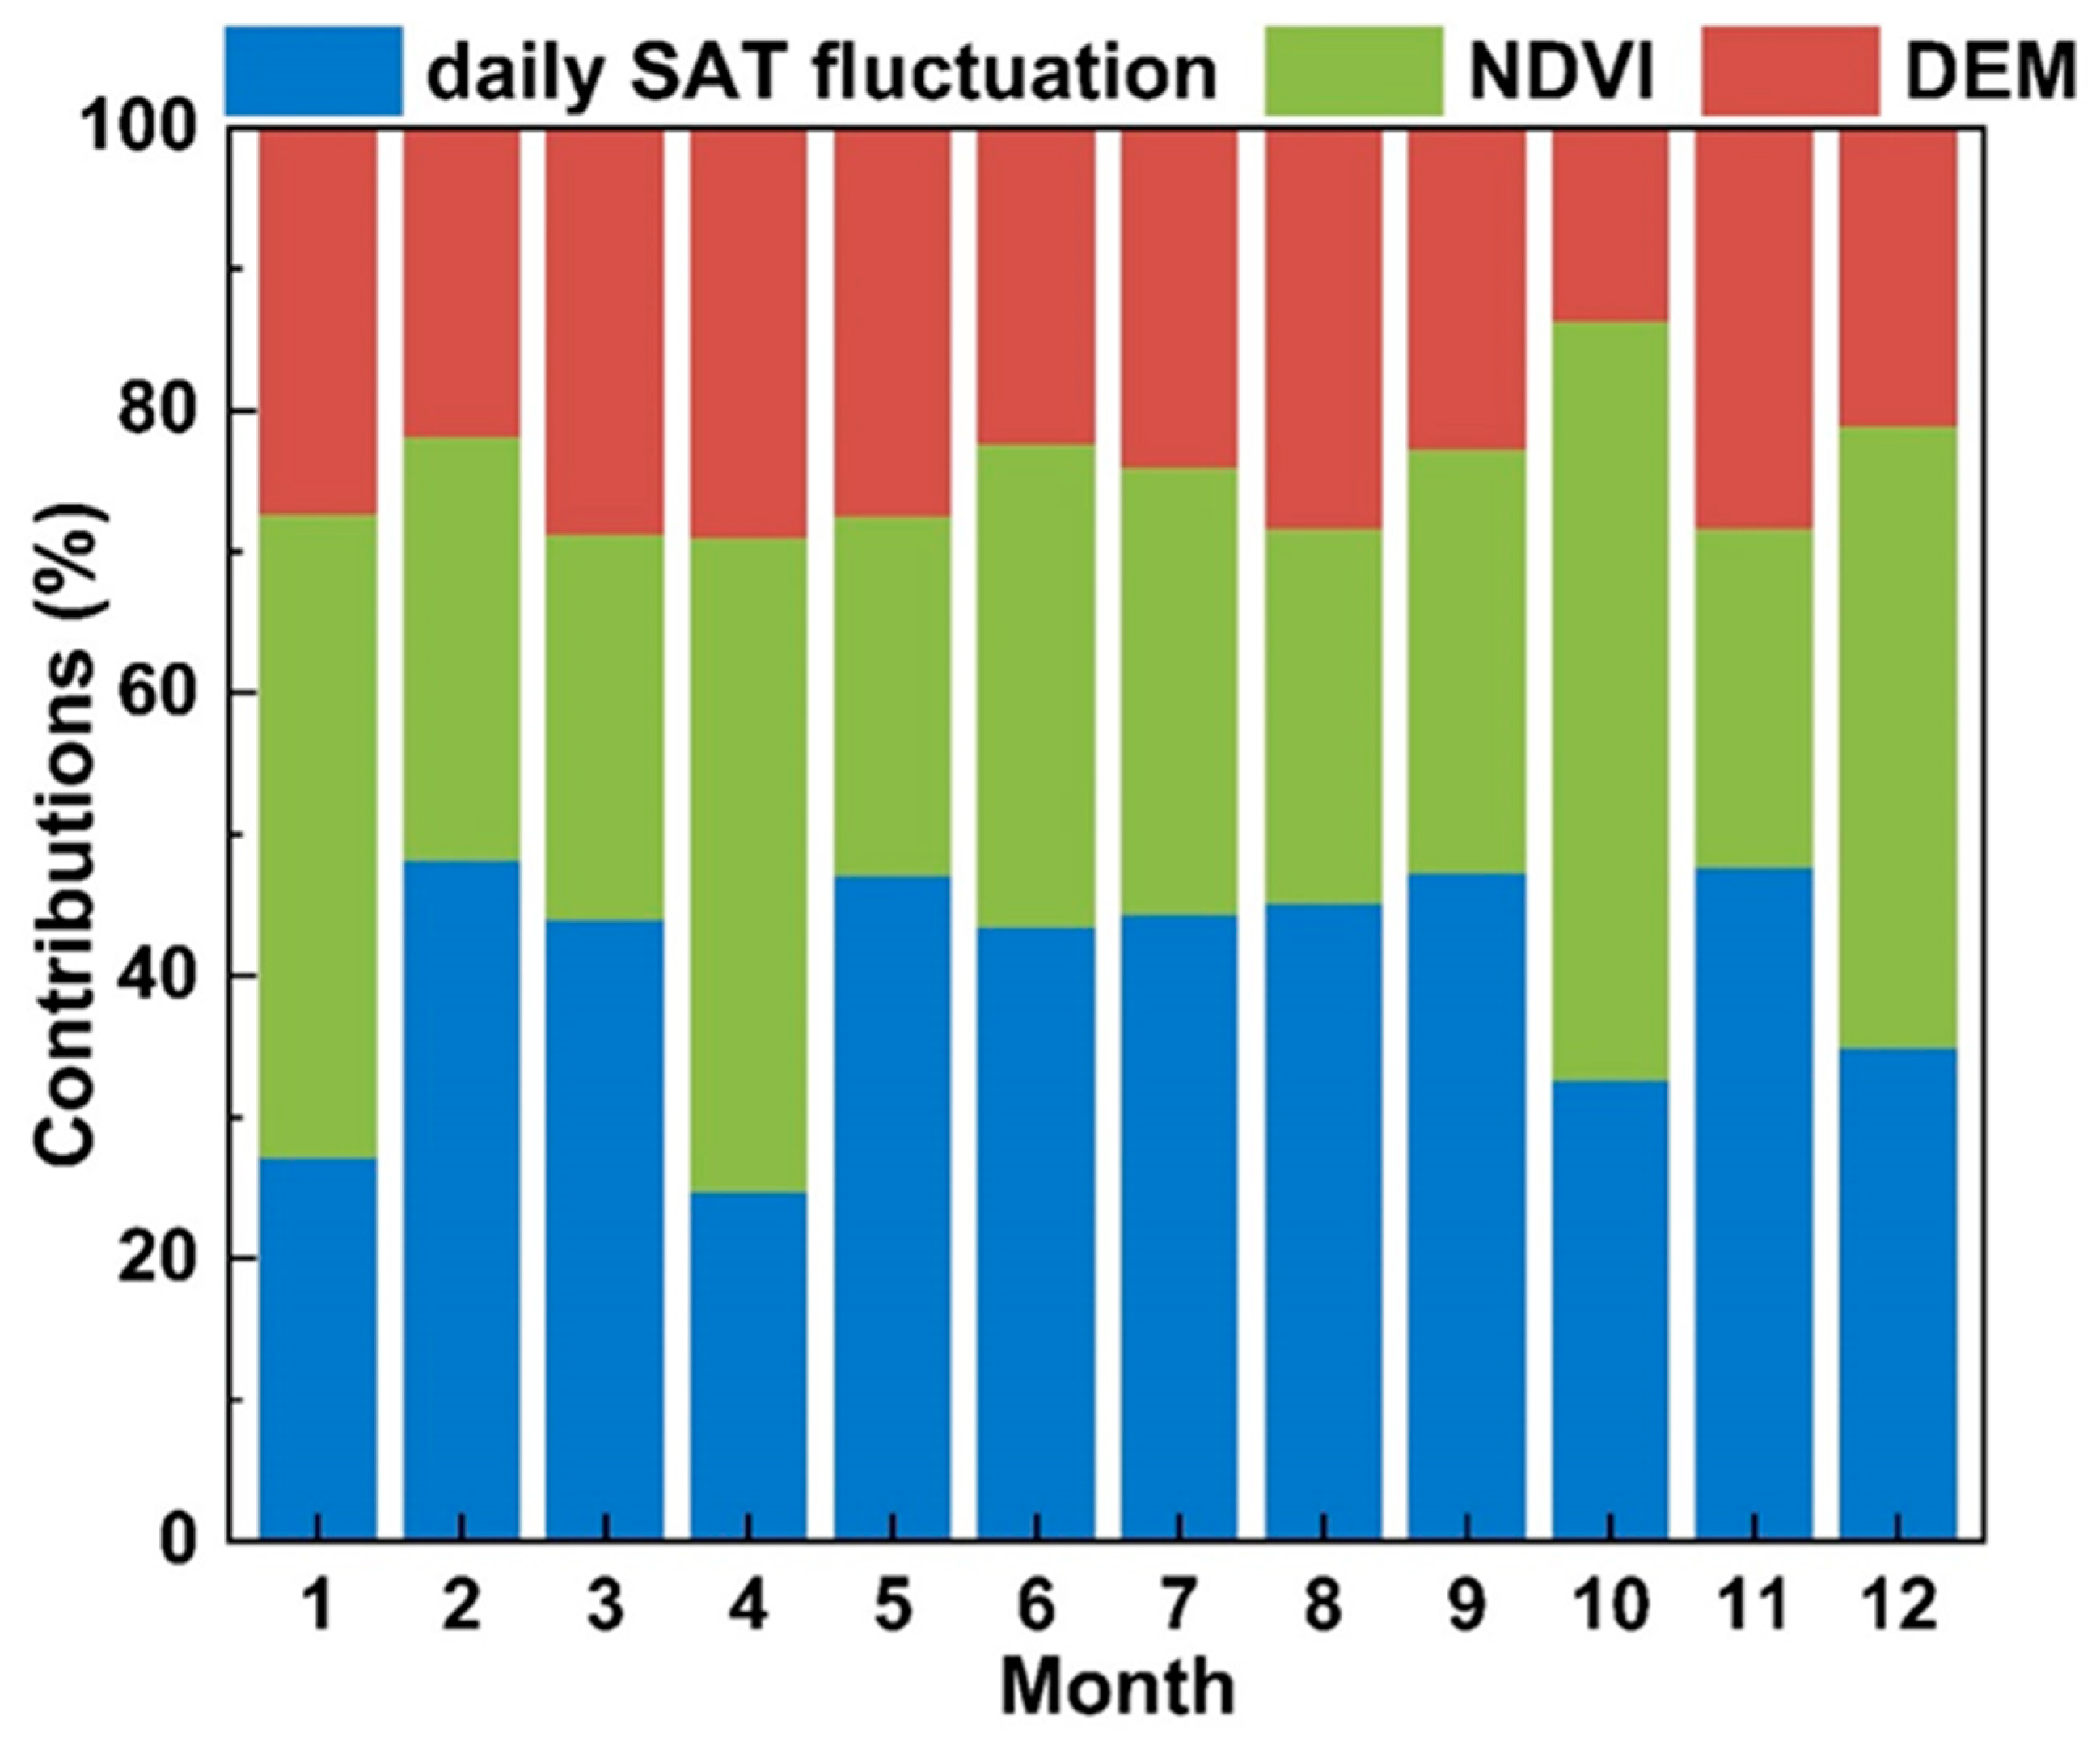
5.2. Contributions of LST-Related Descriptors in the Estimation of Daily LST Fluctuations

We quantified the contributions of the LST-related descriptors used in ATCT (i.e., daily SAT fluctuation, NDVI, and DEM) with an attribution approach [62]. The daily SAT fluctuation had the highest mean annual contribution (40.6%), followed by NDVI (34.9%) and DEM (24.5%; Figure 12). These results also highlight the deterministic role of daily SAT fluctuation and the indispensable contributions of NDVI and DEM in LST reconstruction. The relevance of these factors to LST reconstruction comes from: (1) the close correlation between LST and SAT under different conditions [63,64], and (2) the regulatory effects of NDVI and DEM on the daily variation of LST [59,63]. Furthermore, notable monthly variations were observed in the contributions of these three variables: (1) The contribution of daily SAT fluctuation was relatively high from May to September (exceeding 40.0%). This was likely owing to the increased amount of cloud coverage during this period that consequently weakened the regulation of LST variation by NDVI and DEM. (2) The contributions of NDVI were relatively higher in January, April, October, and December than those in the other months; this finding could be explained by sudden changes in plant cover (e.g., crop harvesting and sowing). (3) The contribution of the DEM was relatively stable within the annual cycle, with the largest inter-month difference of lower than 15.0%, probably because DEM remained unchanged throughout the year.

5.3. Limitations and Prospects

Regardless of its comparatively high performance in the modeling of intra-annual LST dynamics, the ATC_GL has some limitations. First, the ATC_GL ignores the overpassing time difference of MODIS LSTs (up to 2 h) within a daily cycle [65] and viewing angle differences among temporally adjacent days [66,67,68]. Although previous studies have shown that the accuracy enhancement after the normalization of overpassing time and angle is limited [19], the ATC_GL is still expected to benefit if these factors are considered.
Second, the ATC_GL is prone to overestimate LSTs in overcast conditions, probably because the used LST-related descriptors have less prediction ability in such conditions. Microwave data can be used to directly obtain the surface thermal status under overcast conditions and, therefore, could be useful for LST reconstruction. In situ measurements under overcast conditions, such as the LST or other remote sensing data that are directly related to LST (e.g., radiation), could also be helpful to minimize the overestimation [10,13,14,15,41,69,70,71,72,73,74,75]. The performance of the ATC_GL is expected to improve once these auxiliary data are integrated. Fortunately, the ATC_GL is not a specific algorithm but a framework that can incorporate both spatiotemporally global and local information, for which auxiliary data can be integrated directly as LST-related descriptors during LST reconstruction. When applying the ATC_GL to LST reconstruction, practitioners should consider both the availability of LST-related descriptors and the model efficiency. The ATC_GL maintains high accuracy under both clear-sky (RMSE ranges from 0.5 to 1.0 K) and overcast conditions (RMSE ranges from 2.1 to 4.1 K). We believe that the performance of the ATC_GL may be further improved once more auxiliary data under overcast conditions are employed. In addition, the ATC_GL is expected to be applicable for reconstructing LSTs with long time gaps such as the Landsat thermal data [28,70] (refer to Appendix C for the details).

6. Conclusions

The existing ATC models are temporally global interpolations of nature, without considering the spatiotemporally local information among adjacent pixels as well as the complex relationship between LST and LST-related descriptors. These limitations translate to relatively low-performance estimates under varying conditions. To overcome these limitations, we proposed an improved ATC model (i.e., the ATC_GL) that integrates both spatiotemporally global and local information and incorporates the RF algorithm and a series of auxiliary data (e.g., daily SAT variation and NDVI) to model the complex relationships between LSTs and LST-related descriptors.
Our assessments showed that, in the scenario with randomly missing LSTs under clear-sky conditions, the RMSE of the ATC_GL was 1.1 K (2.3 K and 3.1 K lower than that of the ATCE and ATCO, respectively). The performance of the ATC_GL was more stable between land cover types when compared with the ATCE and ATCO. For the scenario with LST gaps of various sizes under clear-sky conditions, our assessments revealed that the accuracy of the ATC_GL was generally the highest when compared with several LST gap-filling methods. The ATC_GL is a framework rather than a specific algorithm, as it can directly integrate relevant LST-related descriptors in LST reconstruction. We believe that the ATC_ GL would improve the accuracy of intra-annual LST dynamics estimation, LST reconstruction, and other related applications.

Author Contributions

Conceptualization, W.Z.; methodology, Y.C., W.Z. and Z.L.; validation, Y.C., W.Z. and Z.L.; formal analysis, Y.C.; resources, W.Z.; data curation, Y.C.; writing—original draft preparation, Y.C. and W.Z.; writing—review and editing, Y.C., W.Z., Z.L., P.D., H.F., S.M., Y.J., L.J. and S.J.; funding acquisition, W.Z. All authors have read and agreed to the published version of the manuscript.

Funding

This research was funded by the National Natural Science Foundation of China (42171306), the National Key Research and Development Programs for Global Change and Adaptation (2017YFA0603604), and the Jiangsu Provincial Natural Science Foundation (BK20180009). We are very grateful for the financial support from the National Youth Talent Support Program of China.

Data Availability Statement

Not applicable.

Acknowledgments

We are also grateful to Chenguang Wang, Jiufeng Li, Huilin Du, Chunli Wang, and Fan Huang from Nanjing University for the valuable discussions.

Conflicts of Interest

The authors declare no conflict of interest.

Appendix A

The size of the initial spatiotemporal window can affect model accuracy and efficiency [6,71,72]. In order to identify the optimal spatiotemporal window, we examine the accuracy variations of the ATC_GL depending on the increase in spatial window size (increasing from 5 × 5 pixels to 19 × 19 pixels, Figure A1) of Region H and the temporal window size (increasing from 1 to 9 days, Figure A2). The assessments reveal that the accuracy reaches the highest when the initial spatial window sizes are 9 × 9 pixels and 11× 11 pixels (i.e., w3 and w4 as given in Figure A1); and the associated mean RMSE for these two window sizes is around 1.3 K. We therefore chose the size of the initial spatiotemporal window as 9 × 9 pixels for the ATC_GL. The model achieves the best performance when the initial temporal window is 1 day with a mean RMSE of 1.2 K.
Figure A1. The accuracy of the ATC_GL along with the increase in the size of the initial spatial window. w1–w8 denote the size of 5 × 5, 7 × 7, 9 × 9, 11 × 11, 13 × 13, 15 × 15, 17 × 17, and 19 × 19 pixels of initial spatial window, respectively.
Land 12 00309 g0a1
Figure A2. The accuracy variations of the ATC_GL depending on the increase in the size of the initial temporal window. T1–T8 denote the size of 1–9 days for the initial temporal window, respectively.
Land 12 00309 g0a2
The ATC_GL performance shows different sensitivity in response to temporal and spatial window sizes (Figure A1 and Figure A2). Therefore, the different combinations of increased spatial and temporal window sizes may affect the ATC_GL performance. To investigate the impact of different combinations of increased spatial and temporal window sizes on the ATC_GL performance, a new experiment was conducted. The results show that the accuracy of the ATC_GL rarely changes with different combinations of increased spatial and temporal window sizes (Table A1). When using a different combination of increased spatial and temporal window sizes, the ATC_GL performance varies by less than 14% when referenced to the original spatiotemporal window sizes (i.e., 2 km and 2 days). This suggests that the responsiveness of the ATC_GL performance to spatial and temporal window sizes would not largely bias the major conclusions.
Table A1. The performance of the ATC_GL according to different combinations of increased size in spatial and temporal windows, respectively.
GroupIncrease in Spatial
Window Size (km)
Increase in Temporal Window Size (Day)RMSE (K)R2
A220.950.95
B420.970.94
C620.980.94
D241.030.92
E440.970.93
F641.040.91
G261.080.89
H461.040.91
I661.050.92

Appendix B

Figure A3. Study areas. The red boxes refer to the selected Regions IO, which are located in mid-temperate (MT), arid temperate (AT), warm temperate (WT), northern subtropical (NS), plateau temperate (PT), mid-subtropical (MS), and southern subtropical (SS) climates, respectively. Subfigures (IO) represent the land cover types of the corresponding study areas.
Land 12 00309 g0a3

Appendix C

Land surface temperatures may be missing for a long time interval, e.g., the LST missing gaps of the Landsat thermal data can be as large as half a month or more due to the long revisit period of Landsat data and cloud contamination. To test the performance of the ATC_GL when the LST missing gap is large, Region A was chosen as the study area for evaluating model performances when the LST missing gap is as large as one month. Our results show that the ATC_GL maintains a high accuracy when the LSTs are missing for a long time interval. For example, the tests using Region A as the study area by setting the LST missing time interval of one month indicate that the mean RMSE of the ATC_GL can reach 3.3 K (Figure A4), an accuracy that is generally acceptable especially when compared with other popularly used methods for such purposes. Therefore, the ATC_GL is expected to be applicable for reconstructing LSTs with long time gaps such as the Landsat thermal data. The ATC_GL should also be helpful for the generation of spatiotemporally seamless LST products on a daily basis at the spatial resolution of Landsat thermal data (i.e., 100 m).
Figure A4. The performance of the ATC_GL with the LST missing time interval of one month (30 days).
Land 12 00309 g0a4

References

  1. Tomlinson, C.J.; Chapman, L.; Thornes, J.E.; Baker, C.J. Derivation of Birmingham’s summer surface urban heat island from MODIS satellite images. Int. J. Climatol. 2012, 32, 214–224. [Google Scholar] [CrossRef] [Green Version]
  2. Voogt, J.A.; Oke, T.R. Thermal remote sensing of urban climates. Remote Sens. Environ. 2003, 86, 370–384. [Google Scholar] [CrossRef]
  3. Holzman, M.E.; Rivas, R.; Piccolo, M.C. Estimating soil moisture and the relationship with crop yield using surface temperature and vegetation index. Int. J. Appl. Earth Obs. Geoinf. 2014, 28, 181–192. [Google Scholar] [CrossRef]
  4. Giglio, L.; Descloitres, J.; Justice, C.O.; Kaufman, Y.J. An enhanced contextual fire detection algorithm for MODIS. Remote Sens. Environ. 2003, 87, 273–282. [Google Scholar] [CrossRef]
  5. Guo, G.; Zhou, M. Using MODIS land surface temperature to evaluate forest fire risk of northeast China. IEEE Geosci. Remote Sens. Lett. 2004, 1, 98–100. [Google Scholar]
  6. Sun, L.; Chen, Z.; Gao, F.; Anderson, M.; Song, L.; Wang, L.; Hu, B.; Yang, Y. Reconstructing daily clear-sky land surface temperature for cloudy regions from MODIS data. Comput. Geosci. 2017, 105, 10–20. [Google Scholar] [CrossRef]
  7. Jin, M. Interpolation of surface radiative temperature measured from polar orbiting satellites to a diurnal cycle: 2. Cloudy-pixel treatment. J. Geophys. Res. Atmos. 2000, 105, 4061–4076. [Google Scholar] [CrossRef]
  8. Zeng, C.; Long, D.; Shen, H.; Wu, P.; Cui, Y.; Hong, Y. A two-step framework for reconstructing remotely sensed land surface temperatures contaminated by cloud. ISPRS-J. Photogramm. Remote Sens. 2018, 141, 30–45. [Google Scholar] [CrossRef]
  9. Crosson, W.L.; Al-Hamdan, M.Z.; Hemmings, S.N.J.; Wade, G.M. A daily merged MODIS Aqua–Terra land surface temperature data set for the conterminous United States. Remote Sens. Environ. 2012, 119, 315–324. [Google Scholar] [CrossRef]
  10. Duan, S.; Li, Z.; Leng, P. A framework for the retrieval of all-weather land surface temperature at a high spatial resolution from polar-orbiting thermal infrared and passive microwave data. Remote Sens. Environ. 2017, 195, 107–117. [Google Scholar] [CrossRef]
  11. Hengl, T.; Heuvelink, G.B.M.; Tadić, M.P.; Pebesma, E.J. Spatio-temporal prediction of daily temperatures using time-series of MODIS LST images. Theor. Appl. Climatol. 2012, 107, 265–277. [Google Scholar] [CrossRef]
  12. Ke, L.; Song, C.; Ding, X. Reconstructing complete MODIS LST based on temperature gradients in northeastern Qinghai-Tibet Plateau. In Proceedings of the 2012 IEEE International Geoscience and Remote Sensing Symposium, Munich, Germany, 22–27 July 2012; pp. 22–27. [Google Scholar]
  13. Zhang, X.; Zhou, J.; Göttsche, F.; Zhan, W.; Liu, S.; Cao, R. A method based on temporal component decomposition for estimating 1-km all-weather land surface temperature by merging satellite thermal infrared and passive microwave observations. IEEE Trans. Geosci. Remote Sens. 2019, 57, 4670–4691. [Google Scholar] [CrossRef]
  14. Zhang, X.; Zhou, J.; Liang, S.; Chai, L.; Wang, D.; Liu, J. Estimation of 1-km all-weather remotely sensed land surface temperature based on reconstructed spatial-seamless satellite passive microwave brightness temperature and thermal infrared data. ISPRS J. Photogramm. Remote Sens. 2020, 167, 321–344. [Google Scholar] [CrossRef]
  15. Zhang, X.; Zhou, J.; Liang, S.; Wang, D. A practical reanalysis data and thermal infrared remote sensing data merging (RTM) method for reconstruction of a 1-km all-weather land surface temperature. Remote Sens. Environ. 2021, 260, 112437. [Google Scholar] [CrossRef]
  16. Zhao, W.; Duan, S. Reconstruction of daytime land surface temperatures under cloud-covered conditions using integrated MODIS/Terra land products and MSG geostationary satellite data. Remote Sens. Environ. 2020, 247, 111931. [Google Scholar] [CrossRef]
  17. Bechtel, B.; Sismanidis, P. Time Series Analysis of Moderate Resolution Land Surface Temperatures. In Remote Sensing: Time Series Image Processing; Weng, Q., Ed.; Taylor & Francis: Abingdon, UK, 2017. [Google Scholar]
  18. Li, X.; Zhou, Y.; Asrar, G.R.; Zhu, Z. Creating a seamless 1 km resolution daily land surface temperature dataset for urban and surrounding areas in the conterminous United States. Remote Sens. Environ. 2018, 206, 84–97. [Google Scholar] [CrossRef]
  19. Liu, Z.; Zhan, W.; Lai, J.; Hong, F.; Quan, J.; Bechtel, B.; Huang, F.; Zou, Z. Balancing prediction accuracy and generalization ability: A hybrid framework for modelling the annual dynamics of satellite-derived land surface temperatures. ISPRS-J. Photogramm. Remote Sens. 2019, 151, 189–206. [Google Scholar] [CrossRef]
  20. Weng, Q.; Fu, P. Modeling annual parameters of clear-sky land surface temperature variations and evaluating the impact of cloud cover using time series of Landsat TIR data. Remote Sens. Environ. 2014, 140, 267–278. [Google Scholar] [CrossRef]
  21. Wu, P.; Yin, Z.; Yang, H.; Wu, Y.; Ma, X. Reconstructing geostationary satellite land surface temperature imagery based on a multiscale feature connected convolutional neural network. Remote Sens. 2019, 11, 300. [Google Scholar] [CrossRef] [Green Version]
  22. Zou, Z.; Zhan, W.; Liu, Z.; Bechtel, B.; Gao, L.; Hong, F.; Huang, F.; Lai, J. Enhanced modeling of annual temperature cycles with temporally discrete remotely sensed thermal observations. Remote Sens. 2018, 10, 650. [Google Scholar] [CrossRef] [Green Version]
  23. Xia, H.; Chen, Y.; Gong, A.; Li, K.; Liang, L.; Guo, Z. Modeling daily temperatures via a phenology-based annual temperature cycle model. IEEE J. Sel. Top. Appl. Earth Observ. Remote Sens. 2021, 14, 6219–6229. [Google Scholar] [CrossRef]
  24. Chen, F.; Liu, C. Estimation of the spatial rainfall distribution using inverse distance weighting (IDW) in the middle of Taiwan. Paddy Water Environ. 2012, 10, 209–222. [Google Scholar] [CrossRef]
  25. Liu, Z.; Wu, P.; Duan, S.; Zhan, W.; Ma, X.; Wu, Y. Spatiotemporal reconstruction of land surface temperature derived from FengYun geostationary satellite data. IEEE J. Sel. Top. Appl. Earth Observ. Remote Sens. 2017, 10, 4531–4543. [Google Scholar] [CrossRef]
  26. Zhou, Y.; Qin, Z.; Bao, G. Land surface temperature estimation under cloud cover with GIDS. J. Remote Sens. 2012, 16, 492–504. [Google Scholar]
  27. Tu, L.; Qin, Z.H.; Zhang, J.; Liu, M.; Geng, J. Estimation and error analysis of land surface temperature under the cloud based on spatial interpolation. Remote Sens. Inf. 2011, 59–63. [Google Scholar]
  28. Wu, P.; Yin, Z.; Zeng, C.; Duan, S.; Gottsche, F.M.; Ma, X.; Li, X.; Yang, H.; Shen, H. Spatially continuous and high-resolution land surface temperature product generation: A review of reconstruction and spatiotemporal fusion techniques. IEEE Geosci. Remote Sens. Mag. 2021, 9, 112–137. [Google Scholar]
  29. Lyon, S.W.; Sorensen, R.; Stendahl, J.; Seibert, J. Using landscape characteristics to define an adjusted distance metric for improving kriging interpolations. Int. J. Geogr. Inf. Sci. 2010, 24, 723–740. [Google Scholar] [CrossRef] [Green Version]
  30. Zhang, C.; Li, W.; Travis, D. Gaps-fill of SLC-off Landsat ETM+ satellite image using a geostatistical approach. Int. J. Remote Sens. 2007, 28, 5103–5122. [Google Scholar] [CrossRef]
  31. Bechtel, B. Multitemporal Landsat data for urban heat island assessment and classification of local climate zones. In Proceedings of the IEEE Joint Urban Remote Sensing Event (JURSE), Munich, Germany, 11–13 April 2011; pp. 129–132. [Google Scholar]
  32. Hong, F.; Zhan, W.; Göttsche, F.-M.; Liu, Z.; Zhou, J.; Huang, F.; Lai, J.; Li, M. Comprehensive assessment of four-parameter diurnal land surface temperature cycle models under clear-sky. ISPRS-J. Photogramm. Remote Sens. 2018, 142, 190–204. [Google Scholar] [CrossRef]
  33. Huang, F.; Zhan, W.; Duan, S.; Ju, W.; Quan, J. A generic framework for modeling diurnal land surface temperatures with remotely sensed thermal observations under clear sky. Remote Sens. Environ. 2014, 150, 140–151. [Google Scholar] [CrossRef]
  34. Fu, P.; Weng, Q. Consistent land surface temperature data generation from irregularly spaced Landsat imagery. Remote Sens. Environ. 2016, 184, 175–187. [Google Scholar] [CrossRef]
  35. Hong, F.; Zhan, W.; Göttsche, F.-M.; Lai, J.; Liu, Z.; Hu, L.; Fu, P.; Huang, F.; Li, J.; Li, H.; et al. A simple yet robust framework to estimate accurate daily mean land surface temperature from thermal observations of tandem polar orbiters. Remote Sens. Environ. 2021, 264, 112612. [Google Scholar] [CrossRef]
  36. Zhan, W.; Huang, F.; Quan, J.; Zhu, X.; Gao, L.; Zhou, J.; Ju, W. Disaggregation of remotely sensed land surface temperature: A new dynamic methodology. J. Geophys. Res. Atmos. 2016, 121, 10,538–10,554. [Google Scholar] [CrossRef]
  37. Huang, F.; Zhan, W.; Voogt, J.; Hu, L.; Wang, Z.; Quan, J.; Ju, W.; Guo, Z. Temporal upscaling of surface urban heat island by incorporating an annual temperature cycle model: A tale of two cities. Remote Sens. Environ. 2016, 186, 1–12. [Google Scholar] [CrossRef]
  38. Xu, Y.; Shen, Y. Reconstruction of the land surface temperature time series using harmonic analysis. Comput. Geosci. 2013, 61, 126–132. [Google Scholar] [CrossRef]
  39. Scharlemann, J.P.; Benz, D.; Hay, S.I.; Purse, B.V.; Tatem, A.J.; Wint, G.R.; Rogers, D.J. Global data for ecology and epidemiology: A novel algorithm for temporal Fourier processing MODIS data. PLoS ONE 2008, 3, e1408. [Google Scholar] [CrossRef]
  40. Bechtel, B. Robustness of annual cycle parameters to characterize the urban thermal landscapes. IEEE Geosci. Remote Sens. Lett. 2012, 9, 876–880. [Google Scholar] [CrossRef]
  41. Li, B.; Liang, S.; Liu, X.; Ma, H.; Chen, Y.; Liang, T.; He, T. Estimation of all-sky 1 km land surface temperature over the conterminous United States. Remote Sens. Environ. 2021, 266, 112707. [Google Scholar] [CrossRef]
  42. Fu, H.; Shao, Z.; Fu, P.; Huang, X.; Cheng, T.; Fan, Y. Combining ATC and 3D-CNN for reconstructing spatially and temporally continuous land surface temperature. Int. J. Appl. Earth Obs. Geoinf. 2022, 108, 102733. [Google Scholar] [CrossRef]
  43. Wang, W.; Zeng, Z.; Karl, T.R. Urban heat islands in China. Geophys. Res. Lett. 1990, 17, 2377–2380. [Google Scholar] [CrossRef]
  44. Wan, Z.; Zhang, Y.; Zhang, Q.; Li, Z. Validation of the land-surface temperature products retrieved from Terra Moderate Resolution Imaging Spectroradiometer data. Remote Sens. Environ. 2002, 83, 163–180. [Google Scholar] [CrossRef]
  45. Wan, Z. New refinements and validation of the collection-6 MODIS land-surface temperature/emissivity product. Remote Sens. Environ. 2014, 140, 36–45. [Google Scholar] [CrossRef]
  46. Liu, Y.; Xiao, J.; Ju, W.; Zhou, Y.; Wang, S.; Wu, X. Water use efficiency of China’s terrestrial ecosystems and responses to drought. Sci. Rep. 2015, 5, 13799. [Google Scholar] [CrossRef] [PubMed] [Green Version]
  47. Ermida, S.L.; Soares, P.; Mantas, V.; Gottsche, F.-M.; Trigo, I.F. Google earth engine open-source code for land surface temperature estimation from the Landsat series. Remote Sens. 2020, 12, 1471. [Google Scholar] [CrossRef]
  48. Yu, W.; Ma, M.; Yang, H.; Tan, J.; Li, X. Supplement of the radiance-based method to validate satellite-derived land surface temperature products over heterogeneous land surfaces. Remote Sens. Environ. 2019, 230, 111188. [Google Scholar] [CrossRef]
  49. Breiman, L. Bagging Predictors. Mach. Learn. 1996, 24, 123–140. [Google Scholar] [CrossRef] [Green Version]
  50. Hutengs, C.; Vohland, M. Downscaling land surface temperatures at regional scales with random forest regression. Remote Sens. Environ. 2016, 178, 127–141. [Google Scholar] [CrossRef]
  51. Tan, W.; Wei, C.; Lu, Y.; Xue, D. Reconstruction of All-Weather Daytime and Nighttime MODIS Aqua-Terra Land Surface Temperature Products Using an XGBoost Approach. Remote Sens. 2021, 13, 4723. [Google Scholar] [CrossRef]
  52. Sun, D.; Kafatos, M. Note on the NDVI-LST relationship and the use of temperature-related drought indices over North America. Geophys. Res. Lett. 2007, 34. [Google Scholar] [CrossRef] [Green Version]
  53. Van De Kerchove, R.; Lhermitte, S.; Veraverbeke, S.; Goossens, R. Spatio-temporal variability in remotely sensed land surface temperature, and its relationship with physiographic variables in the Russian Altay Mountains. Int. J. Appl. Earth Obs. Geoinf. 2013, 20, 4–19. [Google Scholar] [CrossRef] [Green Version]
  54. Weng, Q. Thermal infrared remote sensing for urban climate and environmental studies: Methods, applications, and trends. ISPRS-J. Photogramm. Remote Sens. 2009, 64, 335–344. [Google Scholar] [CrossRef]
  55. Weng, Q.; Lu, D.; Schubring, J. Estimation of land surface temperature–vegetation abundance relationship for urban heat island studies. Remote Sens. Environ. 2004, 89, 467–483. [Google Scholar] [CrossRef]
  56. Yu, W.; Nan, Z.; Wang, Z.; Chen, H.; Wu, T.; Zhao, L. An effective interpolation method for MODIS land surface temperature on the Qinghai-Tibet plateau. IEEE J. Sel. Top. Appl. Earth Obs. Remote Sens. 2015, 8, 4539–4550. [Google Scholar] [CrossRef]
  57. Lin, X.; Zhang, W.; Huang, Y.; Sun, W.; Han, P.; Yu, L. Empirical estimation of near-surface air temperature in china from MODIS LST data by considering physiographic features. Remote Sens. 2016, 8, 629. [Google Scholar] [CrossRef]
  58. Mildrexler, D.J.; Zhao, M.; Running, S.W. A global comparison between station air temperatures and MODIS land surface temperatures reveals the cooling role of forests. J. Geophys. Res. 2011, 116, G03025. [Google Scholar] [CrossRef]
  59. Good, E.J. An in situ-based analysis of the relationship between land surface “skin” and screen-level air temperatures. J. Geophys. Res. Atmos. 2016, 121, 8801–8819. [Google Scholar] [CrossRef]
  60. Hu, L.; Sun, Y.; Collins, G.; Fu, P. Improved estimates of monthly land surface temperature from MODIS using a diurnal temperature cycle (DTC) model. ISPRS J. Photogramm. Remote Sens. 2020, 168, 131–140. [Google Scholar] [CrossRef]
  61. Wang, K.; Zhou, C. Regional contrasts of the warming rate over land significantly depend on the calculation methods of mean air temperature. Sci. Rep. 2015, 5, 12324. [Google Scholar] [CrossRef] [Green Version]
  62. Murray, K.; Conner, M. Methods to quantify variable importance implications for the analysis of noisy ecological data. Ecology 2009, 90, 348–355. [Google Scholar] [CrossRef] [Green Version]
  63. Good, E.J.; Ghent, D.J.; Bulgin, C.E.; Remedios, J.J. A spatiotemporal analysis of the relationship between near-surface air temperature and satellite land surface temperatures using 17 years of data from the ATSR series. J. Geophys. Res. Atmos. 2017, 122, 9185–9210. [Google Scholar] [CrossRef] [Green Version]
  64. Sohrabinia, M.; Zawar-Reza, P.; Rack, W. Spatio-temporal analysis of the relationship between LST from MODIS and air temperature in New Zealand. Theor. Appl. Climatol. 2014, 119, 567–583. [Google Scholar] [CrossRef]
  65. Duan, S.; Li, Z.; Tang, B.; Wu, H.; Tang, R. Generation of a time-consistent land surface temperature product from MODIS data. Remote Sens. Environ. 2014, 140, 339–349. [Google Scholar] [CrossRef]
  66. Hu, L.; Brunsell, N.A.; Monaghan, A.J.; Barlage, M.; Wilhelmi, O.V. How can we use MODIS land surface temperature to validate long-term urban model simulations? J. Geophys. Res. Atmos. 2014, 119, 3185–3201. [Google Scholar] [CrossRef] [Green Version]
  67. Hu, L.; Monaghan, A.; Voogt, J.A.; Barlage, M. A first satellite-based observational assessment of urban thermal anisotropy. Remote Sens. Environ. 2016, 181, 111–121. [Google Scholar] [CrossRef]
  68. Jin, M.; Mullens, T. A Study of the relations between soil moisture, soil temperatures and surface temperatures using ARM observations and offline CLM4 simulations. Climate 2014, 2, 279–295. [Google Scholar] [CrossRef] [Green Version]
  69. Ke, L.; Ding, X.; Song, C. Reconstruction of time-series MODIS LST in central Qinghai-Tibet Plateau using geostatistical approach. IEEE Geosci. Remote Sens. Lett. 2013, 10, 1602–1606. [Google Scholar] [CrossRef]
  70. Zhu, X.; Duan, S.; Li, Z.; Wu, P.; Wu, H.; Zhao, W.; Qian, Y. Reconstruction of land surface temperature under cloudy conditions from Landsat 8 data using annual temperature cycle model. Remote Sens. Environ. 2022, 281, 113261. [Google Scholar] [CrossRef]
  71. Zeng, C.; Shen, H.; Zhong, M.; Zhang, L.; Wu, P. Reconstructing MODIS lst based on multitemporal classification and robust regression. IEEE Geosci. Remote Sens. Lett. 2015, 12, 512–516. [Google Scholar] [CrossRef]
  72. Gerber, F.; Furrer, R.; Schaepman-Strub, G.; de Jong, R.; Schaepman, M.E. Predicting missing values in spatio-temporal satellite data. arXiv 2016, arXiv:1605.01038. [Google Scholar]
  73. Li, K.; Chen, Y.; Xia, H.; Gong, A.; Guo, Z. Adjustment from Temperature Annual Dynamics for Reconstructing Land Surface Temperature Based on Downscaled Microwave Observations. IEEE J. Sel. Top. Appl. Earth Observ. Remote Sens. 2020, 13, 5272–5283. [Google Scholar] [CrossRef]
  74. Pan, X.; Liu, Y.; Fan, X.; Gan, G.; Yang, Y.; Chen, Y. Quantifying the contributions of environmental parameters to satellite-retrieved surface net longwave radiation error: An examination on ceres dataset in China. In Proceedings of the IEEE International Geoscience and Remote Sensing Symposium (IGARSS), Fort Worth, TX, USA, 23–28 July 2017; pp. 5732–5735. [Google Scholar]
  75. Wang, B.; Bao, Q.; Hoskins, B.; Wu, G.X.; Liu, Y.M. Tibetan plateau warming and precipitation changes in East Asia. Geophys. Res. Lett. 2008, 35, L14702. [Google Scholar] [CrossRef]
Figure 1. Study areas. The red boxes in the figure represent Regions A–G; the green box represents Region H; and subfigures (AH) represent the land cover types in 2018 of the eight study areas, respectively.
Land 12 00309 g001
Figure 2. The distribution of the seven SURFRAD sites.
Land 12 00309 g002
Figure 3. The flowchart of the ATC_GL and the evaluation strategies in different scenarios. Tg denotes the intra-annual LST cycle dynamics, ΔTs and ΔTa denote the daily fluctuations in LSTs and SATs, respectively, and LST, SAT, NDVI, and DEM denote land surface temperature, surface air temperature, normalized difference vegetation index, and digital elevation model, respectively.
Land 12 00309 g003
Figure 4. The RMSEs for the ATC_GL (A1G1), ATCE (A2G2), and ATCO (A3G3) and the RMSE differences between the ATCE and ATC_GL (A4G4); Drmse_ATCE as well as the ATCO and ATC_GL ((A5G5); Drmse_ATCO). The number in each subgraph denotes the mean RMSE of the entire area.
Land 12 00309 g004
Figure 5. The RMSEs estimated for the ATC_GL, ATCE, and ATCO for Regions A–G (see Figure 1).
Land 12 00309 g005
Figure 6. The RMSEs of the ATC_GL, ATCE, and ATCO according to land cover type.
Land 12 00309 g006
Figure 7. Monthly RMSEs of the ATC_GL, ATCE, and ATCO. The histogram represents the monthly missing rates of LST.
Land 12 00309 g007
Figure 8. The performance of the ATC_GL, ATCE, and ATCO at four randomly selected pixels in Regions A–D (labelled (ad)). Each randomly selected pixel corresponds to a specific subfigure. Subfigures (a1d1) are the enlarged insets of subfigures (ad).
Land 12 00309 g008
Figure 9. The performance of different methods according to LST gap size. G01 (10 × 10)–G14 (500 × 500) denote different LST gap sizes, including 10 × 10, 20 × 20, 30 × 30, 40 × 40, 50 × 50, 60 × 60, 70 × 70, 80 × 80, 90 × 90, 100 × 100, 200 × 200, 300 × 300, 400 × 400, and 500 × 500 (pixels or km2).
Land 12 00309 g009
Figure 10. The spatial details of the LSTs reconstructed using various methods with an LST gap size of 500 × 500 pixels. Subfigure (a) denotes the LST gap on an image from 10 March 2018; subfigures (b,c) are the original true LSTs; subfigures (dh) represent the LSTs reconstructed by the ATC_GL, RSDAST, Kriging interpolation, ATCH, and HIT, respectively; subfigure (i) presents the mean RMSEs of the different methods.
Land 12 00309 g010
Figure 11. Accuracy evaluations of the reconstructed LSTs using different methods under overcast conditions. Subfigure (g) shows the bias of different methods in different LST ranges.
Land 12 00309 g011
Figure 12. Monthly contributions of the LST-related descriptors (including daily SAT fluctuation, NDVI, and DEM) for the ATC_GL in LST reconstruction.
Land 12 00309 g012
Table 1. Detailed information of the study areas.
Study AreaGeographical ZoneLocationArea (km2)LST Missing
Rate *
ANortheast122.5° E, 44.3° N300 × 30044.47%
BNorthwest92.4° E, 38.8° N300 × 30037.51%
CNorth114.1° E, 38.6° N300 × 30053.00%
DCentral112.5° E, 30.9° N300 × 30069.98%
ESouthwest101.4° E, 29.4° N300 × 30061.01%
FEast118.0° E, 28.5° N300 × 30071.36%
GSouth109.8° E, 23.7° N300 × 30085.07%
HEast-central114.5° E, 29.3° N600 × 60071.55%
* The LST missing rate is defined as the proportion of the missing LSTs within a yearly cycle in a certain region.
Table 2. Features of the data and products used in this study.
Data TypeVariableProduct NameYearTemporal/Spatial Resolution
Satellite dataLand Surface
Temperature
MOD11A12018Daily/1 km
MYD11A12014Daily/1 km
Normalized Difference Vegetation IndexMOD13A22018/
2014
16 day/1 km
Land cover typeMCD12Q12018Yearly/0.5 km
In situ measurementsSurface Air
Temperature
2018/
2014
Daily/—
Land Surface
Temperature
SURFRAD2018Daily/—
Auxiliary dataDigital Elevation ModelSRTM32018/
2014
Yearly/0.09 km
All-weather LSTLSTMW2014Daily/1 km
Table 3. All the mathematical symbols and their meaning in the following formulas.
AbbreviationsDescriptions
TsThe modeled LST on day d relative to the spring equinox
TgThe general seasonal cycle of the intra-annual LST dynamics
ΔTsThe daily LST fluctuations
gATCTThe Tg modeled by the ATCT
fRFThe daily LST fluctuations modeled using the RF algorithm
XThe synoptic and surface parameters
T s ¯ The annual mean LST
A1, A2The two amplitudes of the ATCT
ω1, ω2The two constants calculated as 2πN−1 and 4πN−1 (N = 365)
θ1, θ2The corresponding phase shifts relative to the spring equinox
gATCT_aThe seasonal cycle in the intra-annual SAT dynamics determined by the ATCT
A3, A4The two ATCT amplitudes of SAT
Table 4. The performances of the ATC_GL, ATCE, and ATCO over different land cover types.
RMSE (K)R2
ATC_GLATCEATCOATC_GLATCEATCO
Forest1.23.43.70.950.900.89
Cropland0.93.54.10.960.890.87
Grassland1.13.64.10.950.880.87
Wetland1.13.03.60.950.920.91
Barren1.85.35.90.940.860.84
Built up1.03.33.60.960.890.89
Water1.12.83.30.950.890.89
Table 5. The performance of the ATC_GL at the seven SURFRAD sites.
SiteRMSE (Unit: K)Land Cover Type
Clear-SkyOvercastAll-Weather
BON1.02.11.6Cropland
BOC0.63.11.6Grassland
DRA0.52.71.8Desert
FPK0.73.72.4Grassland
GWN0.63.82.7Grassland
PST0.54.13.3Cropland
SXF0.63.82.6Grassland
Disclaimer/Publisher’s Note: The statements, opinions and data contained in all publications are solely those of the individual author(s) and contributor(s) and not of MDPI and/or the editor(s). MDPI and/or the editor(s) disclaim responsibility for any injury to people or property resulting from any ideas, methods, instructions or products referred to in the content.

