Abstract
Neotropical forests offer alternatives to surface cooling and their conservation is an effective solution for mitigating the effects of climate change. Little is known about the importance of tropical dry forests for temperature regulation in Chiquitania, a region with increasing deforestation rates. The impact that deforestation processes are having on the surface temperature in Chiquitania remains an open question. This study evaluated trends in forest cover loss based on land surface temperatures (°C) in forested and deforested areas in Chiquitania. We hypothesized a positive relationship between higher deforestation and a temperature increase, which would decrease the resilience of highly disturbed Chiquitano forests. We evaluated ten sampling sites (10 × 10 km), including five in forested areas with some type of protection and the other five in areas with populated centers and accelerated forest loss. We developed scripts on the Google Earth Engine (GEE) platform using information from the Normalized Difference Vegetation Index (NDVI, MOD13A2) and the daytime and nighttime Land Surface Temperature (LST, MYD11A1) from MODIS products for the period 2001–2021. The statistical significance of the trends of the time series averages of the MODIS products was analyzed using a nonparametric Mann–Kendall test and the degree of the relationship between the variables was determined using the Pearson statistic. Our results based on NDVI analysis showed consistent vegetation growth in forested areas across the study period, while the opposite occurred in deforested lands. Regarding surface temperature trends, the results for daytime LST showed a positive increase in the four deforested areas. Comparatively, daytime LST averages in deforested areas were warmer than those in forested areas, with a difference of 3.1 °C. Additionally, correlation analyses showed a significant relationship between low NDVI values due to deforestation in three sites and an increase in daytime LST, while for nighttime LST this phenomenon was registered in two deforested areas. Our results suggest a significant relationship between the loss of forest cover and the increase in land surface temperature in Chiquitania. This study could be the first step in designing and implementing an early climate–forest monitoring system in this region.
1. Introduction
Tropical dry forests are of great ecological importance but are also highly threatened and have received little attention focusing on the impact of their loss in the context of climate change [1]. Forests offer solutions for surface cooling due to the ability of trees to capture and redistribute the energy of the Sun [2]. Forests can exert a strong influence on local land surface temperature based on biophysical mechanisms as they generally have a lower surface albedo and higher evapotranspiration than unvegetated areas [3]. However, these environmental functions can be degraded and even lost if forests are not managed sustainably and responsibly.
Changes in land use have great potential to influence temperature extremes [4]. Indeed, the processes of deforestation directly lead to changes in the physical characteristics of the land surface, which can substantially alter the fluxes of heat, carbon, and moisture in atmospheric circulation and climate [5,6,7]. Globally, different biomes are experiencing changes in the Land Surface Temperature (LST) distributions driven by extreme weather events and land surface changes [8]. As the loss of forest cover increases, greater absorption of shortwave radiation from the Sun is generated, releasing longwave radiation after a few hours and producing increased wind chill [8]. In tropical areas, deforestation significantly suppresses evapotranspiration and moderately increases albedo, exerting a warming influence on the global climate [9,10]. Deforestation also causes warming effects during the day and cooling at night [11]. In addition, changes in land use due to the growth of urban, periurban, and rural areas are generating notable increases in LST levels as urbanization processes reduce natural vegetation, thereby increasing impervious areas and albedo alteration and causing urban residents to be exposed to a greater risk of heat stress than rural residents. This effect is known as the Urban Heat Island [12].
Globally, estimates indicate that between 1982 and 2016, the largest net loss of tree canopy in the tropical region occurred in the tropical dry forest biome (−8%), while the largest net loss of tree canopy occurred in the tropical dry forest biome (−2%) [13]. The main causes of disturbance in these forests are associated with commodity-driven deforestation, silviculture, shifting agriculture, and wildfire [14]. In South America, the area of natural tree cover decreased by 16%, while the use of grasslands, croplands, and plantations increased considerably [15]. Recent global studies highlighted the tropical forests of Brazil and the Chaco of Argentina, Paraguay, and Bolivia as the most threatened forest ecosystems in the world due to recent agricultural expansion. In Bolivia, the area identified with the highest growth in deforestation is the Chiquitano Forest [16,17] due to the rapid expansion of the mechanized agricultural and livestock frontier [18,19]. Currently, the drivers of the rapid and recent increase in deforestation in the Chiquitano Forest are the combined effect of soy expansion, the consolidation of corporate land holdings, and the increase of degraded soils in productive areas [19]. In the Department of Santa Cruz, where the main extension of the Chiquitano Forest in Bolivia is located, the annual rate of deforestation reached −0.16% until 2019 [20], mainly caused by an expansion of cattle ranching, medium- and large-scale mechanized agriculture, and small-scale agriculture [18,19]. Despite this factor, 70.7% of the forests are of great importance in terms of forest area in the region, with three non-fragmented stands of more than two million hectares that represent the largest proportion with 57.9% [21]. If the current trend of forest loss in Santa Cruz continues, it is expected that by 2050 the forest area will be reduced from 25.1 million to 12.8 million hectares, mainly in the Chiquitania region [20].
Based on remotely sensed temperature data, recent research conducted in a lowland metropolitan area of Bolivia [22] found that daytime temperatures of forested areas showed a difference of −1.1 °C in relation to agricultural/livestock use and −2.4 °C in comparison with urban areas, while the average nighttime temperature of fragmented forests showed a dissimilarity of 0.1 °C with agricultural/livestock use and −0.7 °C with urban areas. However, studies on the effects of deforestation on land surface temperature in Chiquitania are nonexistent. The conversion of forests to cropland in the Chiquitania region corresponds to morphological changes in the vegetation, leading to a decrease in canopy conductance and, consequently, to an increase of approximately 2 °C in local temperature, as well as slight nocturnal cooling [23].
This study was conducted to identify the effects of recent deforestation on land surface temperature in the Chiquitania region. Specifically, the three aims of this study were (a) to determine annual trends in forest cover loss; (b) to determine annual trends in the daytime and nighttime LST (°C) in forested and deforested areas; (c) to establish the relationship between intact forested areas and areas with deforestation processes and daytime and nighttime LST (°C) in Chiquitania. We hypothesized that the increase in temperature at ground level is related to a reduction in tree cover, which would demonstrate that conservation is key to risk and hazard management. This research will help decision makers formulate risk prevention strategies for natural disasters, adapt to climate change, and establish public policies that can help improve land-use planning, thus avoiding the progressive advance of land-use change.
2. Materials and Methods
2.1. Study Area
The study area includes the Chiquitania region, an extensive flat to undulating plain located in the Department of Santa Cruz, with mountain ranges of varying amplitude, both vertical and horizontal, formed by transverse faults and water erosion. The Chiquitania region contains a rich cultural heritage made up of indigenous Chiquitano, Guarayo, and Ayoreo peoples, as well as Creoles, indigenous peoples from western Bolivia (Quechua and Aymara), and Mennonite settlers [24].
The climate of this region is warm sub-humid tropical with a rainy period in summer and dry weather in winter, with little average annual thermal variability. The distribution of precipitation determines a strong seasonal rainfall regime, with the rainy season extending from November to March, reaching its maximum in January [24]. The average annual monthly temperature is 25.3 °C, with a difference in the latitudinal gradient; high values between September and March, with a maximum in October; low temperatures between June and August, with lower averages in July [24].
In the Chiquitania region, there are three well-defined vegetation types: forests, well-drained savannas, and savannah wetlands [25]. Forest cover is mainly represented by the Chiquitano Dry Forest (Figure 1), which extends between the Amazonian forests to the north and the Chaco forests to the south [25]. The Chiquitano Forests represent the second largest area of tropical dry forests in the Americas [26] and cover an area close to 24 million hectares, 83% of which are located in Bolivia [27]. The most widely distributed forest type is occupied by large areas of well-drained plains with dominant species such as Acosmium cardenasii, Anadenanthera colubrina, Aspidosperma cylindrocarpon, Aspidosperma tomentosum, and Astronium urundeuva, among others [25].
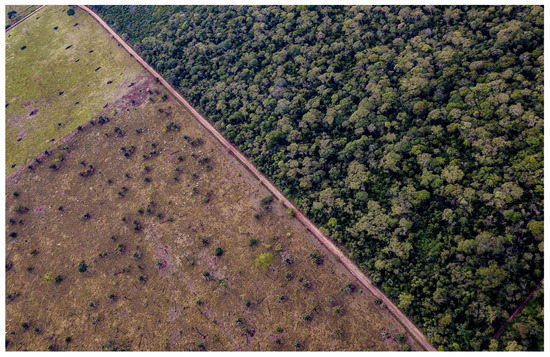
Figure 1.
The Chiquitano Dry Forest, one of the ecoregions with the highest rates of deforestation in Bolivia. Photo: Daniel Coimbra.
2.2. Data Sources
Normalized Difference Vegetation Index. We used the product MOD13A2 Version 6 (https://lpdaac.usgs.gov/products/mod13a2v006, accessed on 12 June 2022), which provides Normalized Difference Vegetation Index (NDVI) values every 16 days at a spatial resolution of 1 km. The NDVI was used to determine trends in values over a time series in forested and deforested areas. The NDVI shows values between −1 and 1 and is determined using the near-infrared (NIR) and red (RED) bands, where values near −1 indicate little photosynthetic activity and, thus, little vegetation growth or reduction, while values near 1 reflect the opposite [28]. MOD13A2 is designed to provide spatially and temporally consistent comparisons of vegetation conditions and was processed from the MODIS L3 daily surface reflectance product (MOD09), corrected for the effects of atmospheric gasses, thin cirrus clouds, and aerosols [29]. In recent decades, MOD13A2 data have been used to quantify vegetation activity and to detect vegetation dynamics in many biological communities [30,31,32].
Land Surface Temperature. Land Surface Temperature (LST) is one of the most important parameters in the physical processes of surface energy and water budgets from local to global scales [8,33,34]. Remotely sensed thermal infrared data provide spatially continuous LST measurements with global coverage to examine the thermal heterogeneity of the Earth’s surface and the impact of natural and human-induced changes on surface temperatures [3]. LST data were selected from the daily product MYD11A1 ver. 6 (https://lpdaac.usgs.gov/products/mod11a2v006, accessed on 12 June 2022), obtained during the daytime and nighttime series from a MODIS sensor with a 1 km spatial resolution for the period 2001 to 2020. MODIS land surface temperature and emissivity products provide per-pixel emissivity and temperature values in a sequence from global swath-based products to grid-based products [35]. In recent years, studies using MODIS data were conducted to analyze the temporal and spatial patterns of regional surface temperature; good results were achieved [36]. In addition, daytime and nighttime LST products have already been validated [37]. The original MODIS LST product was obtained in Kelvin (°K) values, which were then converted to Celsius (°C).
Terrestrial Coverage Type. We used the MODIS product MCD12Q1.006 (https://lpdaac.usgs.gov/products/mcd12q1v006, accessed on 1 December 2021), which provides a Land Cover Type (TCT) classification developed by the University of Maryland (Type 2). The TCT consists of a series of coverage maps with annual interventions and a spatial resolution of 500 m [38] available for the period 2001 to 2020. This product was used to define the selection of sampling sites.
Meteorological stations. We used the monthly average data of maximum and minimum temperatures (in °C) provided by the Bolivian Meteorological Service (SENAMHI, https://senamhi.gob.bo, accessed 10 November 2022) for the urban areas of Concepción and San Ignacio for the period 2001–2020.
2.3. Sampling Sites and Data Processing
Using a stratified randomized design, ten sampling points were selected, with five in forested areas and five in areas with deforestation. Then, 10 km rectangular buffers were created around these central points to obtain 10 × 10 km quadrants representing an area of 100 km2 for each sampling site. The criteria for selecting these sites were based on a distance of more than 100 km from each other. The main criterion for forested areas was that the areas were legally protected or were indigenous territories larger than 100 km2. We selected five quadrants with intact forests in 2020, with three located in northern Chiquitania and two distributed in southern Chiquitania. The main selection criterion for deforested areas was that they represent important urban areas or show different levels of land-use change between 2001 and 2020 due to productive agricultural or livestock activities, identified based on the product MCD12Q1.006. Deforested areas were represented by quadrants located in two population centers in northern Chiquitania and areas with high deforestation rates in southern Chiquitania (Figure 2). Table 1 details the characteristics of all the sites (quadrants) in terms of their names, forest cover, geographic location, and climate. The climate region was identified based on a global map of the aridity index [39].
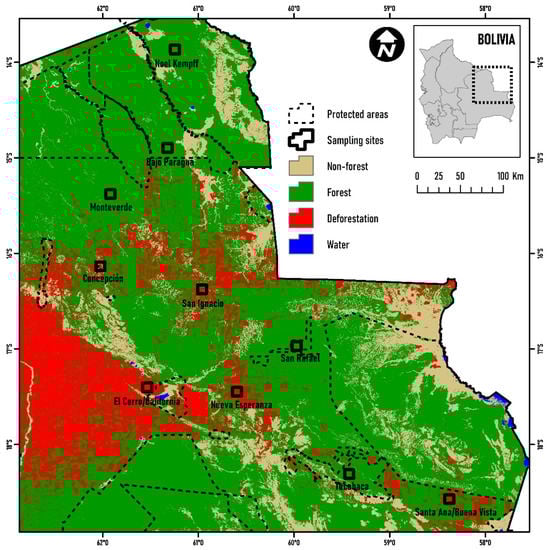
Figure 2.
Sampling sites in forested and deforested areas in the Chiquitania, Department of Santa Cruz, Bolivia: land cover and deforestation until 2020, prepared by the Chiquitano Forest Conservation Foundation (in Spanish FCBC).

Table 1.
Sampling sites selected for five areas of intact forest and five areas with deforestation in the northern and southern Chiquitania sector, Santa Cruz, Bolivia. Climate region: aridity index [39].
The analyses were performed using the Google Earth Engine (GEE), a cloud computing platform designed to store and process large datasets (petabyte scale) for decision making [40,41]. We used the 10 polygons to extract the land cover product values MCD12Q1.006 in ArcMap and reclassified the 15 class types into 7 categories: water bodies, forests, shrublands, savannas, grasslands, urban/croplands, and barren. We then calculated annual percentages for each of the categories (2001 to 2020). To assess the level of uncertainty in the resulting classification, 100 random verification points were distributed in ArcMap, grouped into the 7 categories. In GEE, we selected Sentinel-2 satellite imagery to verify the classification. This approach allowed us to obtain a confusion matrix [42] and three types of accuracy estimates—overall accuracy, user accuracy, and producer accuracy—including their 95% confidence intervals. The confidence level obtained from the coverage classification was 90%.
In the GEE platform, the ten polygons (10 × 10 km) were used and a script was developed for analysis purposes using information from NDVI and LST products for the period from 2001 to 2021. Each quadrant was composed of 100 pixels of MODIS products (1 pixel = 1 km2), so the number of samples in quadrants was calculated with a heterogeneity of 50% and a confidence level of 95% through random point scattering in GEE. Following the methodology proposed by Olofsson et al. [42], 86 points were distributed in each quadrant, resulting in a total of 860 sampling points.
2.4. Statistical Analysis
Trends of change. Differences in trends in MODIS product time series averages of daytime and nighttime temperatures (LST) and vegetation cover (NDVI) were analyzed using a nonparametric Mann–Kendall statistical test [43,44]. This test is commonly used as a trend test for the median slope operator and produces Z-score outputs, allowing both the significance and trend direction to be assessed. The trend values were obtained in RStudio using the Trend package [45].
Correlation between variables. To find the significance (p < 0.05) and degree of the relationship between variables, the intersection between NDVI values and daytime and nighttime LST data was determined using GEE and Pearson’s correlation coefficient (r). Pearson’s coefficient is defined as the association and relationship between two variables and the strength of their relationship. In other words, this coefficient shows how change in one variable causes a change in the other variable, with values ranging between −1 and 1, where a value of −1 indicates a total negative linear relationship, 0 indicates the absence of correlation, and +1 indicates a total positive correlation.
Technical validation. We calculated the monthly averages of the daytime and nighttime LST data and performed an accuracy assessment with the information obtained from the weather stations (maximum and minimum temperatures) based on Pearson’s coefficient and the Root Mean Square Error (RMSE).
3. Results
3.1. Temporal Dynamics of Land Cover Type
Our results show that the five sites with forest did not feature variations in the percentages over the 20 years of analysis (Figure 3). However, the urban areas of San Ignacio and Concepción showed a reduction in forest areas and savannas but an increase in grasslands. In the case of El Cerro/California, the forested area was completely reduced, while grasslands and croplands increased. The area of Nueva Esperanza was the most strongly impacted and the area of Santa Ana/Buena Vista reduced its forest cover from 100 to 61% (Figure 3).
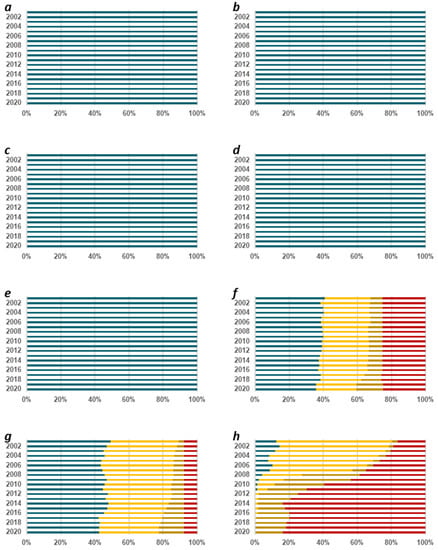
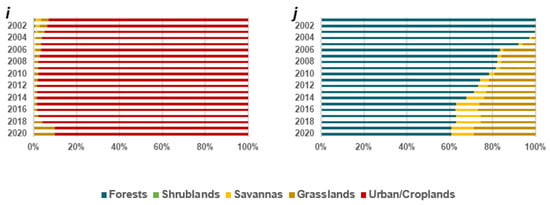
Figure 3.
Annual percentage of land cover type in forested and deforested areas in the Chiquitania region (2001–2020). Sites with intact forest: (a) Noel Kempff, (b) Bajo Paraguá, (c) Monteverde, (d) San Rafael, and (e) Tucabaca. Sites with deforestation: (f) San Ignacio, (g) Concepción, (h) El Cerro/California, (i) Nueva Esperanza, and (j) Santa Ana/Buena Vista.
3.2. Annual Trends of Forest Cover Loss in the Chiquitania Region
The NDVI time series for each study site (Table 2) is shown in Figure 4. There was a small but significant trend (p < 0.05) in the mean values of the index in areas with no forest change (Noel Kempff, Monteverde, San Rafael, and Tucabaca). In sites with increasing deforestation rates during the analysis period, NDVI showed a negative trend. The strongest trend occurred in the El Cerro/California Mennonite colonies (p < 0.001), where all forest cover in 2001 (12% of the quadrant area) was lost by 2021. The next strongest trend was observed at the Santa Ana/Buena Vista site (p < 0.001), where 61% of the original forest area remained by the end of the study period. Significant negative trends were also recorded in San Ignacio, although the area lost 5% of its natural vegetation cover (p < 0.05).
Table 2.
Trends in NDVI time series in forested and deforested areas in the Chiquitania region (2001–2021). n—MODIS data series, p—statistical significance < 0.05 (highlighted in bold), Z—Mann–Kendall nonparametric test.
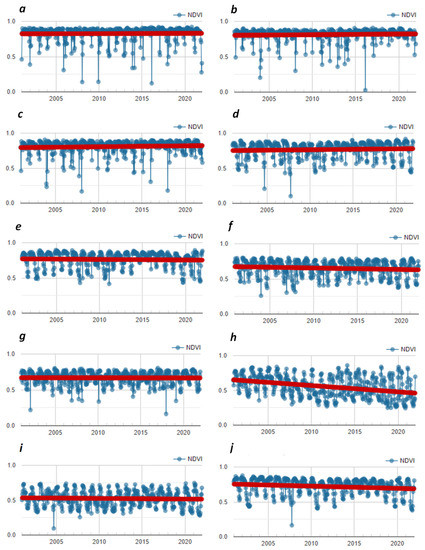
Figure 4.
Trends in NDVI time series in forested and deforested areas in the Chiquitania region (2001–2021). The red line represents the trend line of the data points. Sites with intact forest: (a) Noel Kempff, (b) Bajo Paraguá, (c) Monteverde, (d) San Rafael, and (e) Tucabaca. Sites with deforestation: (f) San Ignacio, (g) Concepción, (h) El Cerro/California, (i) Nueva Esperanza, and (j) Santa Ana/Buena Vista.
3.3. Annual Trends in Land Surface Temperature (LST) Day and Night (°C) in Forested and Deforested Areas
3.3.1. Annual Averages of Daytime LST
The annual averages of daytime LST (°C) obtained from the daily MODIS product MYD11A1 showed latitudinal variations in relation to the location of the sampling sites between northern and southern Chiquitania (Figure 5). The forests of Noel Kempff (27.0 ± 0.50 °C ), Monteverde (27.0 ± 0.45 °C), and Bajo Paraguá (26.6 ± 0.57 °C), located in the northern Chiquitania region, presented lower average temperatures than those in the southern region, specifically in San Rafael (28.1 ± 0.84 °C) and Tucabaca (29.3 ± 0.92 °C). Between forested areas, the daytime LST averages showed a difference of up to 2.7 °C.
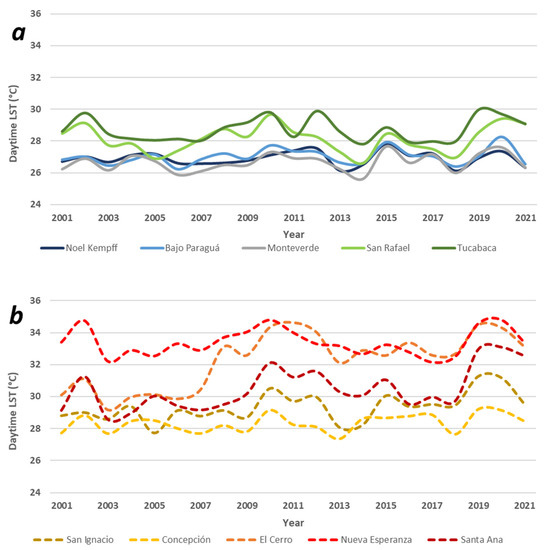
Figure 5.
Average annual daytime LST (°C) in forested areas (a) and deforested (b) areas in the Chiquitania region (2001–2021).
The main variations were associated with deforestation sampling sites (Figure 5). The areas of the population centers and surroundings of San Ignacio (28.7 ± 0.56 °C) and Concepción (28.7 ± 0.74 °C) showed lower average temperatures compared with the areas of the Santa Ana/Buena Vista ranches (30.5 ± 3.95 °C). Even lower temperatures were observed in the areas of the Mennonite colonies of El Cerro/California (32.3 ± 1.74 °C) and Nueva Esperanza (33.4 ± 1.34 °C). In the latter, the forest cover was completely lost. Between deforested areas, daytime LST averages showed a difference of up to 4.7 °C. Comparatively, daytime LST averages in deforested areas were warmer than those in forested areas, with a difference of 3.1 °C.
In addition, in the deforested areas, a pattern of temperature increase anomalies in the daytime LST averages was evident for 2002 and 2010–2012 and was even higher for 2019–2020 (Figure 5), especially in the areas of the Mennonite colonies El Cerro/California and Nueva Esperanza. In forested areas, this pattern was also evident in southern Chiquitania (San Rafael and Tucabaca).
3.3.2. Annual Trends of Daytime LST
Regarding the trends of the increase in daytime LST (°C), the results showed a positive increase at four of the five sites with the loss of forest cover (Table 3, Figure 6). The highest trend was recorded in the San Ignacio area (Z = 45.10; p > 0.001), followed by the El Cerro/California Mennonite colonies (Z = 8.35; p > 0.001), Santa Ana/Buena Vista ranches (Z = 5.75; p > 0.001), and Concepción town center (Z = 45.10; p > 0.05). For sampling sites with intact forests, no significant changes in diurnal temperature trends were observed (Table 3 and Figure 6).
Table 3.
Daytime LST trends (°C) for the ten study sites in the Chiquitania region. n—MODIS data series, p—statistical significance < 0.05 (highlighted in bold), Z—nonparametric Mann–Kendall test.
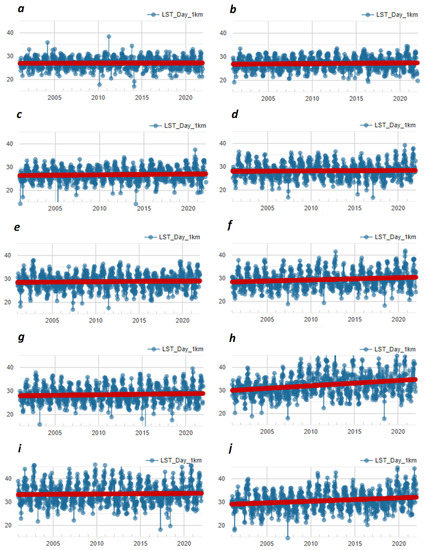
Figure 6.
Time series trends in daytime LST (°C) in forested and deforested areas in the Chiquitania region (2001–2021). The red line represents the trend line of the data points. Sites with intact forest: (a) Noel Kempff, (b) Bajo Paraguá, (c) Monteverde, (d) San Rafael, and (e) Tucabaca. Sites with deforestation: (f) San Ignacio, (g) Concepción, (h) El Cerro/California, (i) Nueva Esperanza, and (j) Santa Ana/Buena Vista.
3.3.3. Annual Averages of Nighttime LST
Compared with the results found for daytime LST, the values of nighttime LST temperatures did not show wide variations between the sampling sites (Figure 7). The forested areas of Noel Kempff (20.5 ± 0.51 °C), Monteverde (20.0 ± 0.41 °C), Bajo Paraguá (20.4 ± 0.43 °C), San Rafael (20.8 ± 0.46 °C), and Tucabaca (20.7 ± 0.43 °C) presented similar averages. For the sites where forest cover loss was recorded (Figure 7), the Concepción area (19.1 ± 0.46 °C) recorded the lowest temperatures relative to El Cerro/California (20.5 ± 0.49 °C), San Ignacio (20.4 ± 0.43 °C), Nueva Esperanza (21.0 ± 0.48 °C), and the Santa Ana/Buena Vista (21.1 ± 0.61 °C) colonies. Comparatively, the nighttime LST averages between forested and deforested areas showed almost no difference (0.06 °C).
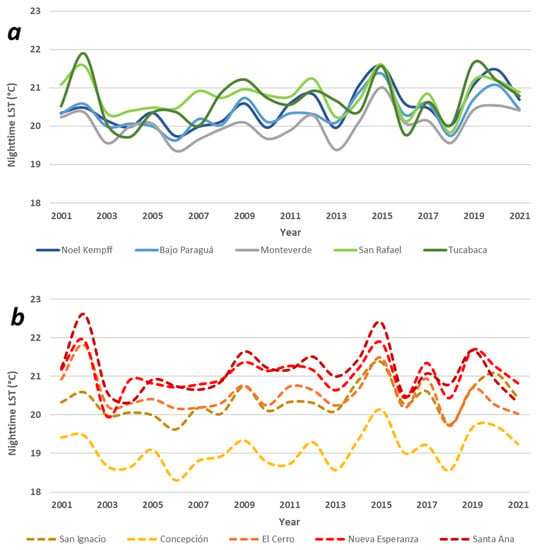
Figure 7.
Average annual nighttime LST (°C) in forested (a) and deforested (b) areas in the Chiquitania region (2001–2021).
Similar to daytime LST, a pattern of temperature increase anomalies was recorded in the nighttime LST averages mainly for the years 2002 and 2015 (Figure 7), especially for the Nueva Esperanza colony and the Santa Ana/Buena Vista ranches.
3.3.4. Annual Trends of Nighttime LST
The results for annual trends of nighttime LST (°C) showed only a positive and significant increase in the forested areas related to Noel Kempff (Z = 4.40; p > 0.001) and Bajo Paraguá (Z = 2.95; p > 0.01) and in the populated areas of San Ignacio (Z = 2.95; p > 0.01) and Concepción (Z = 2.07; p > 0.05) (Table 4, Figure 8). The rest of the sites, despite indicating an increase and decrease, were not statistically significant.
Table 4.
Nighttime LST trends (°C) for ten Chiquitania study sites. n—MODIS data series, p—statistical significance < 0.05 (highlighted in bold), Z—nonparametric Mann–Kendall test.
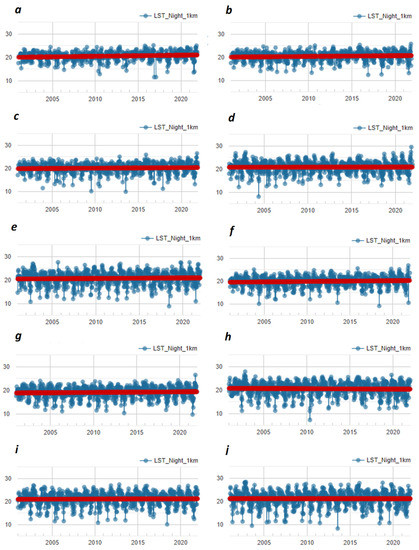
Figure 8.
Trends in the time series of nighttime LST (°C) in forested and deforested areas in the Chiquitania region (2001–2021). The red line represents the trend line of the data points. Sites with intact forest: (a) Noel Kempff, (b) Bajo Paraguá, (c) Monteverde, (d) San Rafael, and (e) Tucabaca. Sites with deforestation: (f) San Ignacio, (g) Concepción, (h) El Cerro/California, (i) Nueva Esperanza, and (j) Santa Ana/Buena Vista.
3.4. Relationship between Intact Forest and Areas with Deforestation Processes and Daytime and Nighttime LST (°C)
The results also indicated that there was a statistically significant medium to high correlation between NDVI and daytime LST, especially for the Santa Ana/Buena Vista ranches (r = 0.76), San Ignacio (r = 0.60), and El Cerro/California Mennonite colonies (r = 0.60) (Table 5, Figure 9). As the NDVI levels decreased, the temperature increased. For nighttime LST, a significant relationship was found between the loss of forest cover and the increase in nighttime temperature in the Santa Ana/Buena Vista (r = 0.59) and El Cerro/California (r = 0.58) areas (Table 5, Figure 10). These results suggest that deforestation increased the land surface temperature in the Chiquitania region.
Table 5.
Pearson correlation (r) between NDVI values with daytime and nighttime LST for the ten study sites in the Chiquitania region. Higher correlations are highlighted in bold.
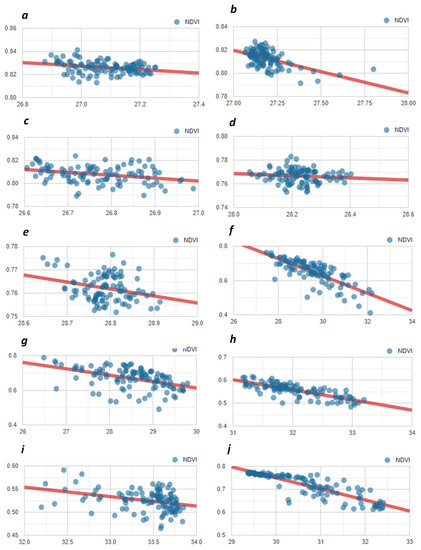
Figure 9.
Relationship between NDVI and daytime LST (°C) values in forested and deforested areas in the Chiquitania region (2001–2021). The red line represents the trend line of the data points. Sites with intact forest: (a) Noel Kempff, (b) Bajo Paraguá, (c) Monteverde, (d) San Rafael, and (e) Tucabaca. Sites with deforestation: (f) San Ignacio, (g) Concepción, (h) El Cerro/California, (i) Nueva Esperanza, and (j) Santa Ana/Buena Vista.
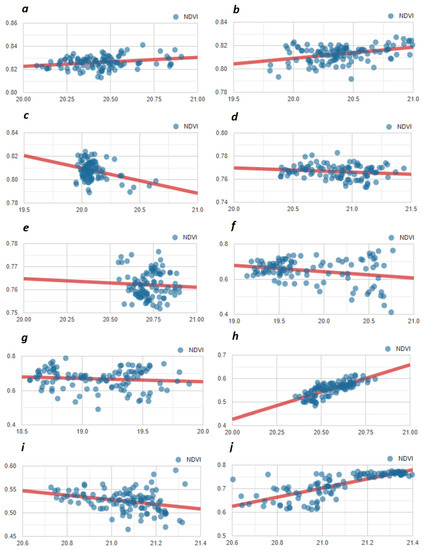
Figure 10.
Relationship between NDVI and nighttime LST (°C) values in forested and deforested areas in the Chiquitania region (2001–2021). The red line represents the trend line of the data points. Sites with intact forest: (a) Noel Kempff, (b) Bajo Paraguá, (c) Monteverde, (d) San Rafael, and (e) Tucabaca. Sites with deforestation: (f) San Ignacio, (g) Concepción, (h) El Cerro/California, (i) Nueva Esperanza, and (j) Santa Ana/Buena Vista.
3.5. Validation Using In Situ Measurement
Table 6 shows the validation statistics (performance metrics) of the monthly average daytime LST and nighttime LST in relation to air temperature data from weather stations in the urban areas of Concepción and San Ignacio. The results of these correlations were also significant and very high for the two study sites. However, the RMSE values were lower for Concepción, with 5.4 °C for daytime LST and 5.5 °C for nighttime LST.
Table 6.
Pearson correlation (r) and Root Mean Square Error (RMSE) between the monthly averages for LST and the air temperatures of the meteorological stations (Concepción and San Ignacio). The highest correlations are highlighted in bold.
4. Discussion
Deforestation in Bolivia is growing at an alarming rate. Recent estimates indicate that the country lost a total of seven million hectares by 2021, 86% of which will be concentrated in the department of Santa Cruz [19]. In addition, the advance of deforestation has been associated in recent years with areas destined for forest use and exploitation [20], as well as legally protected areas [20]. The expansion of soybean and cattle ranching has been the main direct cause of deforestation [19]. Our analyses sought to identify changes in forest cover in sites located in protected areas and indigenous territories using the MODIS product MCD12Q1.006, as well as changes in areas known to be the fastest growing areas of deforestation in Chiquitania. While the area of Nueva Esperanza presented the highest concentration of cropland, we found an evident reduction of natural cover in urban areas (Concepción and San Ignacio), as well as in the areas of El Cerro/California and Santa Ana/Buena Vista. If this deforestation trend continues, it is estimated that forest could disappear completely by 2050 [20].
Assessments of vegetation cover status, changes, and processes are important components of global change research programs and are topics of considerable societal importance [46]. Spectral vegetation indices (e.g., NDVI) are among the most widely used satellite data products and provide metrics for climate, hydrological, and biogeochemical studies, land cover change detection, phenology, and natural resource management [47]. In addition, these indices are important for the analysis of vegetation growth and decrease trends [48]. Our results were mainly based on a comparison of vegetation trends in forested and deforested areas. Using NDVI, we detected continuous vegetation growth in intact forests (Noel Kempff, Monteverde, and San Rafael), which showed no evidence of forest degradation processes in these areas. The explanation for these results is that high NDVI values are mainly related to the density of green leaves in a given area, making them a good indicator of vegetation cover and vitality [49]. Our assessments considered a long time series (2001–2020) to ensure that the results would not be influenced by seasonal and interannual variability in the forests of the Chiquitania region [50]. In contrast, we found sites with negative and statistically significant trends in NDVI values in three of the five sampling sites (El Cerro/California Mennonite colonies, Santa Ana/Buena Vista ranches, and San Ignacio), where a decrease in forest cover was recorded at different sites in Chiquitania. This result was expected, especially considering the current scenario of accelerated land-use change processes in the region [19]. In addition, there was evidence of a negative trend marked by decreases of the NDVI in the Tucabaca forests. These results are very close to those of San Rafael, a forested site with a positive trend, which suggests disturbances due to illegal logging; however, ecological disturbance processes (e.g., changes in stomatal conductance) that cause physiological weakening and tree mortality could not be ruled out. However, the results for Tucabaca should be interpreted with caution and field evaluations should be carried out to identify the factors causing this degradation.
Land Surface Temperature (LST) monitoring using remote sensors offers several advantages over a wide observation range, including easy access and strong spatial continuity. Multiple studies have been conducted globally in recent years to determine LST [3,8,51,52], which is a key parameter for obtaining a more direct measure of surface conditions when analyzing surface–climate interactions [33,52]. Due to these qualities, we were able to determine, over a long period of time (2001–2020), the diurnal and nocturnal temperatures at the local level in Chiquitania. Of the 10 study sites, the highest diurnal LST levels were found in Nueva Esperanza, a completely deforested area. In addition, in the Cerro/California Mennonite colony area, which lost its remaining forest cover, a notable increase in diurnal LST was identified from 2007 onwards, which coincides with the decline in the trend of photosynthetic activity of the vegetation presented in Figure 3. In addition, we were able to compare the differences in LST between forested and non-forested areas. Our results showed that the average values of daytime LST between forested sampling sites varied by up to 2.7 °C and those between deforested sites varied by up to 4.7 °C. However, when comparing forested and deforested sites, the difference in the averages was 3.1 °C. Differences in the diurnal temperature range are known to be smaller for forested areas and larger for non-forested areas [53], because LST increases in deforested areas may be exacerbated by changes in roughness length, which impede energy dissipation via sensible or latent heat fluxes [54]. In contrast, nocturnal heating is caused by the release of stored thermal energy during the day [3]. However, comparisons of nighttime LST averages for the ten sampling sites did not show notable differences and, for this reason, nighttime LST could not be considered a good indicator of the differences between forested and deforested areas in Chiquitania. Nevertheless, our data help highlight the large differences between daytime and nighttime LST averages, which for the forest was 7.1 °C and for the deforested areas was 10.2 °C. This information is valuable, because it highlights the importance of forests in regulating temperatures in the Chiquitania region.
It is known that anomalies of maximum LST capture spatial patterns that are associated with droughts and heat waves on the land surface [8]. In our study, both forested areas and those with deforestation processes in Chiquitania showed interannual anomalies of temperature increases in the daytime LST averages for the years 2002, 2010–2012, and 2019–2020, with the latter increases being higher than the others. In addition, in terms of nighttime LST, similar patterns were recorded for 2002 and 2015. In the Amazon area, generalized anomalies in LST values and large-scale directional changes towards higher temperatures were found in 2005 and 2010 [8], where large and severe droughts were recorded [55]. However, by 2020 different severe to extreme meteorological megadroughts events were recorded at the continental level. One of these events occurred in southern Brazil and Paraguay [56,57] and was also observed in Bolivia. In addition, on a local scale, drought events in the Chiquitania region were identified based on different climate stations, showing significant trends of increased frequency and intensity [21]. Further studies are needed to understand the relationship between heat waves and droughts, which could improve our understanding of the impacts of land-use change on the local climate.
Recent studies indicate that in some lowland areas of Bolivia, temperatures tend to increase mainly in urban and agricultural/livestock areas [19]. In our research on Chiquitania, it was shown that there is a tendency for an increase in daytime LST values, which is associated with deforestation processes, independent of the differences between the climate regions (humid and dry sub-humid areas) of the sampling sites. The trend of an increase in diurnal LST was statistically significant in four of the five areas with deforestation, mainly in San Ignacio, which registered the highest value in the Mann–Kendall test. However, in the sampling sites with forests, there were no statistically significant trends in daytime LST values, because tropical forests can exert a strong influence on local LST. As such, forests generally have a lower surface albedo due to absorbing more shortwave radiation during the day and higher evapotranspiration compared with areas with bare vegetated surfaces [3,58]. Nevertheless, nighttime LST values corresponded to another scenario, with a significant increase observed for the two forested areas (Noel Kempff and Bajo Paraguá) and two urban areas (San Ignacio and Concepción). Although an increasing trend in areas with deforestation was expected, new questions emerged regarding nighttime LST trends in forests. A possible explanation for this phenomenon is the presence of a large number of granitic rocky outcrops (inselbergs) in the Noel Kempff and Bajo Paraguá areas [54], which concentrate the heat during the day and radiate heat to the surrounding forest during the night [59,60]. However, further research is needed in this area.
Globally, deforestation in tropical regions is causing strong warming between 0.38 ± 0.02 [52] and 2.4 ± 0.10 °C [3] (LST values). Our results showed a statistically significant correlation between NDVI and LST at three sites for diurnal values and two sites for nocturnal values. This result is in addition to the trend of 0.1 °C per decade observed for the air temperature increase rate [61]. This result is concerning because the Chiquitania region is home to hundreds of thousands of people who carry out productive livestock and agricultural activities. The increase in LST values in the Chiquitania region could lead to a series of effects that have not been evaluated, including migration, economic production, and human capital to impacts on biodiversity [62]. Given that forest loss is at the heart of both global and local warming, initiatives to reduce deforestation must remain a priority [63]. Climate change adaptation strategies based on maintaining forest integrity are required to mitigate the increase in LST in the Chiquitania region [64], where the conservation of existing forests and restoration of those lost to deforestation should be prioritized [65].
Protected areas continue to be the main defense against forest cover loss and the best strategy for maintaining the ecological integrity of forests [66]. Bolivia has approximately 130 protected areas, of which approximately one-third are located in the Department of Santa Cruz [67]. Most of these protected sites contain ecosystems of high conservational value and, in many cases, intact forests [68]. However, there is direct and indirect pressure around these areas owing to the rapid expansion of the agricultural and livestock frontier [19,69]. In the Chiquitania region, this expansion has caused a loss of forest connectivity [19], a reduction of critical ecosystems [70,71], and a loss of habitats of key and priority species for conservation [72]. If this scenario continues in these protected areas, up to half of forest area harbors could be lost in the next 30 years [68].
Reducing current deforestation trends in Chiquitania is a high priority. It is necessary to redefine norms and public policies regarding forest conservation, aimed at territorial management at multiple scales. Undoubtedly, revising the design criteria for land-use plans, enforcing the economic and social functions of private and communal property, and promoting the protection and restoration of conservation easements will improve opportunities for thermal regulation and the maintenance of ecological functionality at the landscape scale in the Chiquitania region. It is also necessary to establish a monitoring system to evaluate changes in natural vegetation cover, especially temperature and precipitation, at regional and local scales. With these changes, there will be greater opportunities to increase socio-ecological resilience to the impacts of climate change.
5. Conclusions
This is the first study conducted in the Chiquitania region of Bolivia over a long time series to identify the relationship between land surface temperature increases and forest cover loss through remote sensing products. NDVI remains an essential tool for monitoring the health of the field and determining the loss or maintenance of forest cover, especially in the present scenario where deforestation is advancing rapidly. In addition, LST was shown to be a key parameter that can help estimate temperature variations at different scales of space and time. Our findings demonstrate the importance of using combined time series data of spectral indices and LST to fully understand temperature trends and their drivers in the Bolivian lowlands.
These results indicate that the forests of the Chiquitania region play a fundamental role in the regulation of temperature. Our study highlights the importance of protected areas in the Chiquitania region for the conservation of forests, which, in turn, affects the regulation of land surface temperatures. The evaluated forest sites represent national (Noel Kempff), departmental (Tucabaca), and municipal (Bajo Paraguá and San Rafael) protected areas, as well as an indigenous territory (Monteverde), demonstrating that the legal allocation of land tenure and territorial management focusing on the conservation and sustainable use of wild resources are important for maintaining the integrity and conservation of natural ecosystems. However, this scenario may change in the face of land-use change trends. In this sense, conservation strategies and actions are very important for safeguarding the maintenance of forest integrity, biodiversity, and environmental functions. For this reason, it is necessary to continue working on management and capacity building to protect these sites.
Author Contributions
Conceptualization, O.M.; methodology, O.M.; software, O.M.; validation, O.M.; formal analysis, O.M.; investigation, O.M., R.V.-A., Á.S. and D.M.L.-A.; data curation, O.M.; writing—original draft preparation, O.M.; writing—review and editing, O.M., R.V.-A., Á.S. and D.M.L.-A.; visualization, O.M.; supervision, R.V.-A. All authors have read and agreed to the published version of the manuscript.
Funding
This study was developed as part of a research thesis by O.M. and a series of investigations by the FCBC Chiquitano Dry Forest Observatory. A.S. was funded by project FONDECYT 3190563. The publication of the research has been made possible thanks to the financial support of the Government of Canada within the framework of the Knowledge Bases for Restoration-III project (Restauracción).
Data Availability Statement
Not applicable.
Acknowledgments
We are also grateful to Paola Cuellar for her valuable help. We thank the three anonymous reviewers for their insightful comments and suggestions that greatly helped in improving our manuscript.
Conflicts of Interest
The authors declare no conflict of interest.
References
- Siyum, Z.G. Tropical dry forest dynamics in the context of climate change: Syntheses of drivers, gaps, and management perspectives. Ecol. Process. 2020, 9, 1–16. [Google Scholar] [CrossRef]
- Pokorný, J.; Brom, J.; Cermák, J.; Hesslerová, P. Solar energy dissipation and temperature control by water and plants. Int. J. Water 2010, 5, 311–336. [Google Scholar] [CrossRef]
- Li, Y.; Zhao, M.; Mote, S.; Mu, Q.; Kalnay, E.; Li, S. Local cooling and warming effects of forests based on satellite observations. Nat. Commun. 2015, 6, 6603. [Google Scholar] [CrossRef] [PubMed]
- Chen, L.; Dirmeyer, P.A. Reconciling the disagreement between observed and simulated temperature responses to deforestation. Nat. Commun. 2020, 11, 1–10. [Google Scholar] [CrossRef] [PubMed]
- Bonan, G.B. Forests and climate change: Forcings, feedbacks, and the climate benefits of forests. Science 2008, 320, 1444–1449. [Google Scholar] [CrossRef]
- Foley, J.A.; DeFries, R.; Asner, G.P.; Barford, C.; Bonan, G.; Carpenter, S.R.; Chapin, F.S.; Coe, M.T.; Daily, G.C.; Gibbs, H.K.; et al. Global consequences of land use. Science 2005, 309, 570–574. [Google Scholar] [CrossRef]
- Lawrence, D.; Vandecar, K. Effects of tropical deforestation on climate and agriculture. Nat. Clim. Chang. 2014, 5, 27–36. [Google Scholar] [CrossRef]
- Mildrexler, D.J.; Zhao, M.; Cohen, W.B.; Running, S.W.; Song, X.P.; Jones, M.O. Thermal Anomalies Detect Critical Global Land Surface Changes. J. Appl. Meteorol. Clim. 2018, 57, 391–411. [Google Scholar] [CrossRef]
- Feddema, J.J.; Oleson, K.W.; Bonan, G.B.; Mearns, L.O.; Buja, L.E.; Meehl, G.A.; Washington, W.M. The Importance of Land-Cover Change in Simulating Future Climates. Science 2005, 310, 1674–1678. [Google Scholar] [CrossRef]
- Baker, J.C.A.; Spracklen, D.V. Climate Benefits of Intact Amazon Forests and the Biophysical Consequences of Disturbance. Front. For. Glob. Chang. 2019, 2, 47. [Google Scholar] [CrossRef]
- Schultz, N.M.; Lawrence, P.J.; Lee, X. Global satellite data highlights the diurnal asymmetry of the surface temperature response to deforestation. J. Geophys. Res. Biogeosci. 2017, 122, 903–917. [Google Scholar] [CrossRef]
- Chapman, S.; Watson, J.E.M.; Salazar, A.; Thatcher, M.; McAlpine, C.A. The impact of urbanization and climate change on urban temperatures: A systematic review. Landsc. Ecol. 2017, 32, 1921–1935. [Google Scholar] [CrossRef]
- Song, X.-P.; Hansen, M.C.; Stehman, S.V.; Potapov, P.V.; Tyukavina, A.; Vermote, E.F.; Townshend, J.R. Global land change from 1982 to 2016. Nature 2018, 560, 639–643. [Google Scholar] [CrossRef]
- Curtis, P.G.; Slay, C.M.; Harris, N.L.; Tyukavina, A.; Hansen, M.C. Classifying drivers of global forest loss. Science 2018, 361, 1108–1111. [Google Scholar] [CrossRef]
- Zalles, V.; Hansen, M.C.; Potapov, P.V.; Parker, D.; Stehman, S.V.; Pickens, A.H.; Parente, L.L.; Ferreira, L.G.; Song, X.-P.; Hernandez-Serna, A.; et al. Rapid expansion of human impact on natural land in South America since 1985. Sci. Adv. 2021, 7, eabg1620. [Google Scholar] [CrossRef]
- Potapov, P.; Hansen, M.C.; Pickens, A.; Hernandez-Serna, A.; Tyukavina, A.; Turubanova, S.; Zalles, V.; Li, X.; Khan, A.; Stolle, F.; et al. The Global 2000–2020 Land Cover and Land Use Change Dataset Derived From the Landsat Archive: First Results. Front. Remote. Sens. 2022, 3, 856903. [Google Scholar] [CrossRef]
- Buchadas, A.; Baumann, M.; Meyfroidt, P.; Kuemmerle, T. Uncovering major types of deforestation frontiers across the world’s tropical dry woodlands. Nat. Sustain. 2022, 5, 619–627. [Google Scholar] [CrossRef]
- Müller, R.; Pacheco, P.; Montero, J.C. The Context of Deforestation and Forest Degradation in Bolivia: Drivers, Agents and Institutions; Occasional Paper 108; CIFOR: Bogor, Indonesia, 2014. [Google Scholar]
- Colque, G. Deforestación 2016–2021. In El Pragmatismo Irresponsable de la “Agenda Patriótica 2025”; Documento ténico. Tierra: Santa Cruz, Bolivia, 2022; p. 164. [Google Scholar]
- Maillard, O.; Anívarro, R.; Flores-Valencia, M. Pérdida de la Cobertura Natural (1986–2019) y Proyecciones de Escenarios a Futuro (2050) en el Departamento de Santa Cruz; Informe técnico del Observatorio Bosque Seco Chiquitano; Fundación para la Conservación del Bosque Chiquitano: Santa Cruz, Bolivia, 2020; p. 55. [Google Scholar]
- Maillard, O.; Vides-Almonacid, R.; Flores-Valencia, M.; Coronado, R.; Vogt, P.; Vicente-Serrano, S.; Azurduy, H.; Anívarro, R.; Cuellar, R. Relationship of Forest Cover Fragmentation and Drought with the Occurrence of Forest Fires in the Department of Santa Cruz, Bolivia. Forests 2020, 11, 910. [Google Scholar] [CrossRef]
- Hinojosa, B.; Maillard, O.; Guzmán, D. Temperatura de la superficie terrestre y escenarios climáticos por el cambio de uso de suelo en los municipios metropolitanos del departamento de Santa Cruz, Bolivia. Ecol. Boliv. 2021, 56, 17–28. [Google Scholar]
- Bounoua, L.; DeFries, R.S.; Imhoff, M.L.; Steininger, M.K. Land use and local climate: A case study near Santa Cruz, Bolivia. Meteorol. Atmos. Phys. 2004, 86, 73–85. [Google Scholar] [CrossRef]
- Vides-Almonacid, R.; Reichle, S.; Padilla, F. Planificación Ecorregional del Bosque Seco Chiquitano; Editorial Fundación para la Conservación del Bosque Chiquitano: Santa Cruz, Bolivia, 2007; p. 245. [Google Scholar]
- Jardim, A.; Killeen, T.; Fuentes, A. Guía de los Árboles y Arbustos del Bosque Seco Chiquitano, Bolivia; Editorial FAN: Santa Cruz de la Sierra, Bolivia, 2003. [Google Scholar]
- Portillo-Quintero, C.; Sánchez-Azofeifa, G. Extent and conservation of tropical dry forests in the Americas. Biol. Conserv. 2010, 143, 144–155. [Google Scholar] [CrossRef]
- Pawlowski, G.W.; Mariaca, R. Estructura, Composición y Dinámica del Bosque seco Chiquitano; (No. CIDAB-SD437. I4-W6e); Centro de Investigación Agrícola Tropical-Servicio Alemán de Cooperación Social-Técnica: San Ignacio de Velasco, Bolivia, 2007; 50p. [Google Scholar]
- Tucker, C.J. Red and photographic infrared linear combinations for monitoring vegetation. Remote Sens. Environ. 1979, 8, 127–150. [Google Scholar] [CrossRef]
- Didan, K. MOD13A2 MODIS/Terra Vegetation Indices 16-Day L3 Global 1 km SIN Grid V006. NASA EOSDIS Land Processes DAAC. Available online: https://lpdaac.usgs.gov/products/mod13a2v006/ (accessed on 12 June 2022). [CrossRef]
- Fang, X.; Zhu, Q.; Ren, L.; Chen, H.; Wang, K.; Peng, C. Large-scale detection of vegetation dynamics and their potential drivers using MODIS images and BFAST: A case study in Quebec, Canada. Remote. Sens. Environ. 2018, 206, 391–402. [Google Scholar] [CrossRef]
- Zhong, L.; Ma, Y.; Salama, M.S.; Su, Z. Assessment of vegetation dynamics and their response to variations in precipitation and temperature in the Tibetan Plateau. Clim. Chang. 2010, 103, 519–535. [Google Scholar] [CrossRef]
- Wardlow, B.D.; Egbert, S.L. Large-area crop mapping using time-series MODIS 250 m NDVI data: An assessment for the U.S. Central Great Plains. Remote. Sens. Environ. 2008, 112, 1096–1116. [Google Scholar] [CrossRef]
- Mannstein, H. Surface energy budget, surface temperature and thermal inertia. In Remote Sensing Applications in Meteorology and Climatology; Vaughan, R.A., Reidel, D., Eds.; Springer: Dordrecht, The Netherlands, 1987; pp. 391–410. [Google Scholar]
- Li, Z.-L.; Tang, B.-H.; Wu, H.; Ren, H.; Yan, G.; Wan, Z.; Trigo, I.F.; Sobrino, J.A. Satellite-derived land surface temperature: Current status and perspectives. Remote Sens. Environ. 2013, 131, 14–37. [Google Scholar] [CrossRef]
- Wan, Z.; Hook, A.A.S.; Hulley, G. MOD11A2 MODIS/Terra Land Surface Temperature/Emissivity 8-Day L3 Global 1 km SIN Grid V006. NASA EOSDIS Land Processes DAAC. 2015. Available online: https://lpdaac.usgs.gov/products/mod11a2v006/ (accessed on 12 June 2022). [CrossRef]
- Yang, M.; Zhao, W.; Zhan, Q.; Xiong, D. Spatiotemporal Patterns of Land Surface Temperature Change in the Tibetan Plateau Based on MODIS/Terra Daily Product From 2000 to 2018. IEEE J. Sel. Top. Appl. Earth Obs. Remote Sens. 2021, 14, 6501–6514. [Google Scholar] [CrossRef]
- Duan, S.B.; Li, Z.L.; Li, H.; Göttsche, F.M.; Wu, H.; Zhao, W.; Leng, P.; Zhang, X.; Coll, C. Validation of Collection 6 MODIS land surface temperature product using in situ measurements. Remote Sens. Environ. 2019, 225, 16–29. [Google Scholar] [CrossRef]
- Friedl, M.D.; Sulla-Menashe, D. MCD12Q1 MODIS/Terra+Aqua Land Cover Type Yearly L3 Global 500 m SIN Grid V006. NASA EOSDIS Land Processes DAAC. Available online: https://lpdaac.usgs.gov/products/mcd12q1v006/ (accessed on 1 December 2021). [CrossRef]
- Zomer, R.J.; Xu, J.; Trabucco, A. Version 3 of the Global Aridity Index and Potential Evapotranspiration Database. Sci. Data 2022, 9, 1–15. [Google Scholar] [CrossRef]
- Gorelick, N.; Hancher, M.; Dixon, M.; Ilyushchenko, S.; Thau, D.; Moore, R. Google Earth Engine: Planetary-scale geospatial analysis for everyone. Remote Sens. Environ. 2017, 202, 18–27. [Google Scholar] [CrossRef]
- Kumar, L.; Mutanga, O. Google Earth Engine Applications Since Inception: Usage, Trends, and Potential. Remote Sens. 2018, 10, 1509. [Google Scholar] [CrossRef]
- Olofsson, P.; Foody, G.M.; Herold, M.; Stehman, S.V.; Woodcock, C.E.; Wulder, M.A. Good practices for estimating area and assessing accuracy of land change. Remote Sens. Environ. 2014, 148, 42–57. [Google Scholar] [CrossRef]
- Mann, H.B. Nonparametric tests against trend. Econometrica 1945, 13, 245–259. [Google Scholar] [CrossRef]
- Bevan, J.M.; Kendall, M.G. Rank Correlation Methods. J. R. Stat. Soc. Ser. D Stat. 1971, 20, 74. [Google Scholar] [CrossRef]
- Pohlert, T. Package “Trend”: Non-Parametric Trend Tests and Change-Point Detection. R Package,26. 2016. Available online: https://brieger.esalq.usp.br/CRAN/web/packages/trend/trend.pdf (accessed on 16 June 2022).
- National Research Council. Issues in the Integration of Research and Operational Satellite Systems for Climate Research: Part I. Science and Design; The National Academies Press: Washington, DC, USA, 2000. [Google Scholar] [CrossRef]
- Huete, A.; Didan, K.; van Leeuwen, W.; Miura, T.; Glenn, E. MODIS Vegetation Indices. In Land Remote Sensing and Global Environmental Change: NASA's Earth Observing System and the Science of ASTER and MODIS.; Ramachandran, B., Justice, C.O., Abrams, M.J., Eds.; Springer: New York, NY, USA, 2010; pp. 579–602. [Google Scholar] [CrossRef]
- Eastman, J.R.; Sangermano, F.; Machado, E.A.; Rogan, J.; Anyamba, A. Global Trends in Seasonality of Normalized Difference Vegetation Index (NDVI), 1982–2011. Remote. Sens. 2013, 5, 4799–4818. [Google Scholar] [CrossRef]
- Jones, H.G.; Vaughan, R.A. Remote Sensing of Vegetation. Principles, Techniques, and Applications; Oxford University Press: New York, NY, USA, 2010. [Google Scholar]
- Maillard, O.; Flores-Valencia, M.; Michme, G.; Coronado, R.; Bachfischer, M.; Azurduy, H.; Vides-Almonacid, R.; Flores, R.; Angulo, S.; Mielich, N. Phenology Patterns and Postfire Vegetation Regeneration in the Chiquitania Region of Bolivia Using Sentinel-2. Fire 2022, 5, 70. [Google Scholar] [CrossRef]
- Mildrexler, D.J.; Zhao, M.; Running, S.W. A global comparison between station air temperatures and MODIS land surface temperatures reveals the cooling role of forests. J. Geophys. Res. Atmos. 2011, 116. [Google Scholar] [CrossRef]
- Prevedello, J.A.; Winck, G.R.; Weber, M.M.; Nichols, E.; Sinervo, B. Impacts of forestation and deforestation on local temperature across the globe. PLoS ONE 2019, 14, e0213368. [Google Scholar] [CrossRef]
- Collatz, G.J.; Bounoua, L.; Los, S.O.; Randall, D.A.; Fung, I.Y.; Sellers, P.J. A mechanism for the influence of vegetation on the response of the diurnal temperature range to changing climate. Geophys. Res. Lett. 2000, 27, 3381–3384. [Google Scholar] [CrossRef]
- van Leeuwen, T.T.; Frank, A.J.; Jin, Y.; Smyth, P.; Goulden, M.L.; van der Werf, G.R.; Randerson, J.T. Optimal use of land surface temperature data to detect changes in tropical forest cover. Jorunal Geophys. Res. 2011, 116, G02002. [Google Scholar] [CrossRef]
- Li, Y.; Zhao, M.; Mildrexler, D.J.; Motesharrei, S.; Mu, Q.; Kalnay, E.; Zhao, F.; Li, S.; Wang, K. Potential and Actual impacts of deforestation and afforestation on land surface temperature. J. Geophys. Res. Atmos. 2016, 121, 14372–14386. [Google Scholar] [CrossRef]
- Marengo, J.A.; Tomasella, J.; Alves, L.M.; Soares, W.R.; Rodriguez, D.A. The drought of 2010 in the context of historical droughts in the Amazon region. Geophys. Res. Lett. 2011, 38, L12703. [Google Scholar] [CrossRef]
- WMO (World Meteorological Organization). State of the Climate in Latin America and the Caribbean 2020; WMO: Geneva, Switzerland, 2021. [Google Scholar]
- Wongsai, N.; Wongsai, S.; Huete, A.R. Annual Seasonality Extraction Using the Cubic Spline Function and Decadal Trend in Temporal Daytime MODIS LST Data. Remote Sens. 2017, 9, 1254. [Google Scholar] [CrossRef]
- Azurduy, H.; Maillard, O. Islas de roca granítica en la región Chiquitana: Sitios de importancia para la conservación en Bolivia. Ecol. Boliv. 2022, 57, 1. [Google Scholar]
- Fredericksen, N.J.; Fredericksen, T.S.; Flores, B.; McDonald, E.; Rumiz, D. Importance of granitic rock outcrops to vertebrate species in a Bolivian tropical forest. Trop. Ecol. 2003, 44, 185–196. [Google Scholar]
- Seiler, C.; Hutjes, R.W.A.; Kabat, P. Climate Variability and Trends in Bolivia. J. Appl. Meteorol. Clim. 2013, 52, 130–146. [Google Scholar] [CrossRef]
- Nunez, S.; Arets, E.; Alkemade, C.; Verwer, C.; Leemans, R. Assesing the impacts of climate change on biodiversity is below 2 °C enough? Clim. Change 2019, 154, 351–365. [Google Scholar] [CrossRef]
- Brack, D. Forest and climate change. Background Analytical Study; Forests and SDG13; United Nations Forum of Forests: New York, NY, USA, 2019; p. 55. [Google Scholar]
- Colls, A.; Ash, N.; Ikkala, N. Ecosystem-Based Adaptation: A Natural Response To Climate Change; IUCN: Gland, Switzerland, 2009; p. 16. [Google Scholar]
- FAO. The State of the World’s Forests 2022. In Forest Pathways for Green Recovery and Building Inclusive, Resilient and Sustainable Economies; FAO: Rome, Italy, 2022. [Google Scholar]
- Boillat, S.; Ceddia, M.G.; Bottazzi, P. The role of protected areas and land tenure regimes on forest loss in Bolivia: Accounting for spatial spillovers. Glob. Environ. Chang. 2022, 76, 102571. [Google Scholar] [CrossRef]
- Ministerio de Medio Ambiente y Agua. 2022. Available online: https://siarh.gob.bo/dgbap/biodiversidad/areas-protegidas/ (accessed on 2 September 2021).
- Flores-Valencia, M.; Anívarro, R.; Maillard, O. Pérdida de la Cobertura Natural (1986-2019) y Escenarios a Futuro (2050) en las Áreas Protegidas del Departamento de Santa Cruz; Informe técnico del Observatorio Bosque Seco Chiquitano; Fundación para la Conservación del Bosque Chiquitano: Santa Cruz, Bolivia, 2020; p. 53. [Google Scholar]
- Romero-Muñoz, A.; Fernández-Llamazares, A.; Moraes, M.; Larrea-Alcázar, R.D.M.; Wordley, C.F.R. A pivotal year for Bolivian conservation policy. Nat. Ecol. Evol. 2019, 3, 866–869. [Google Scholar] [CrossRef]
- Maillard, O.; Anívarro, R.; Vides-Almonacid, R.; Torres, W. Estado de conservación de los ecosistemas de las serranías chiquitanas: Un caso de estudio de la Lista Roja de Ecosistemas de la UICN en Bolivia. Ecol. En Boliv. 2018, 53, 128–149. [Google Scholar]
- Maillard, O.; Anivarro, R.; Vides-Almonacid, R.; Salinas, J.C. El Impacto de la Infraestructura vial en Ecosistemas de Alta Fragilidad: El Caso de la Construcción de una Carretera en el Norte Chiquitano, Bolivia; en: Bolivia. Desafíos socioambientales en las tierras bajas; Inturias, M., Von Stosch, K., Balderlomar, H., Rodriguez, I., Eds.; Instituto de Investigación Científica Social (IICS) de la Universidad Nur. Santa Cruz: Santa Cruz, Bolivia, 2019; pp. 119–149. [Google Scholar]
- Maillard, O.; Angulo, S.; Vides-Almonacid, R.; Rumiz, D.; Vogt, P.; Monroy-Vilchis, O.; Justiniano, H.; Azurduy, H.; Coronado, R.; Venegas, C.; et al. Integridad del paisaje y riesgos de degradación del hábitat del jaguar (Panthera onca) en áreas ganaderas de las tierras bajas de Santa Cruz, Bolivia. Ecol. En Boliv. 2020, 55, 94–110. [Google Scholar]


Disclaimer/Publisher’s Note: The statements, opinions and data contained in all publications are solely those of the individual author(s) and contributor(s) and not of MDPI and/or the editor(s). MDPI and/or the editor(s) disclaim responsibility for any injury to people or property resulting from any ideas, methods, instructions or products referred to in the content. |
© 2022 by the authors. Licensee MDPI, Basel, Switzerland. This article is an open access article distributed under the terms and conditions of the Creative Commons Attribution (CC BY) license (https://creativecommons.org/licenses/by/4.0/).