Article

Mitigating Soil Erosion through Biomass-Derived Biochar: Exploring the Influence of Feedstock Types and Pyrolysis Temperature

1
Division of Soil Science and Agricultural Chemistry, Faculty of Agriculture, Sher-e-Kashmir University of Agricultural Sciences & Technology of Kashmir, Jammu 193201, India
2
Division of Fruit Sciences, Faculty of Horticulture, Sher-e-Kashmir University of Agricultural Sciences & Technology of Kashmir, Jammu 190025, India
3
Department of Agronomy (Rootcrops), Ministry of Agriculture & Waterways (MOAW), Suva City P.O. Box 77, Fiji
4
Division of Agronomy, Indian Agricultural Research Institute, New Delhi 110012, India
5
Faculty of Agriculture, Sher-e-Kashmir University of Agricultural Sciences & Technology of Kashmir, Jammu 193201, India
6
Division of Agronomy, Faculty of Agriculture, Sher-e-Kashmir University of Agricultural Sciences & Technology of Kashmir, Jammu 193201, India
7
Division of Soil Science & Agricultural Chemistry, Faculty of Horticulture, Sher-e-Kashmir University of Agricultural Sciences & Technology of Kashmir, Jammu 190025, India
8
Department of Botany and Microbiology, College of Science, King Saud University, Riyadh P.O. Box 11451, Saudi Arabia
9
Department of Biology and Environmental Engineering, University of Craiova, 13, A.I.Cuza, 200585 Craiova, Romania
*
Author to whom correspondence should be addressed.
Land 2023, 12(12), 2111; https://doi.org/10.3390/land12122111
Submission received: 5 September 2023 / Revised: 24 October 2023 / Accepted: 27 October 2023 / Published: 27 November 2023

Abstract

:
Soil erosion is one of the major emerging threats to the Himalayan ecosystem. There is a dearth of diverse, cost-effective erosion control measures in the region. In the Himalayan region, where agriculture plays a pivotal role in local livelihoods and environmental stability, the management of soil erosion is of paramount importance. Hence, this study investigates the impact of biochar application on soil erosion and its related indices in the temperate Himalayas of India. This study employs a combination of physicochemical analysis and field experiments to assess the influence of biochar on soil erodibility. The research objectives include an examination of the influence of different temperature pyrolyzed biomasses and varying application rates on soil erodibility indices, viz., dispersion ratio (DR), percolation ratio (PR), clay ratio (CR), erosion ratio (ER), and mean weight diameter (MWD), considering two distinct fertilizer regimes. This study yielded quantitative results that shed light on the impact of various soil amendments and application rates on soil erodibility in the temperate Himalayas. Results showed that the mean values of the DR exhibited by amendment levels NB, AB400, AB600, RAC, DW400, DW600, and RDW were 0.37, 0.35, 0.51, 0.44, 0.51, 0.47, and 0.91, respectively. The mean values of DR for different amendment levels varied, with RDW exhibiting the highest erodibility at 0.91, while DW400 and DW600 demonstrated less soil disturbance, making them promising choices for soil erosion mitigation. Notably, the application of pyrolyzed weed residue improved soil erodibility, whereas AB600 resulted in increased soil erosion due to aggregate disintegration, as indicated by the MWD. Aquatic weed residues and apple wood chips applied without pyrolysis increased the soil erodibility, while pyrolyzed residues improved soil erodibility. The DR was 0.41 at the high application rate, 0.48 at the medium rate, and 0.61 at the low application rate. Among application rates, low rates (1 t ha−1) had the highest DR, followed by medium rates (2 t ha−1) and high rates (3 t ha−1). The no-fertilizer level exhibited higher DR (0.49) compared to the fertilized level (0.38). Results inferred that the application of AB400 °C at 3 t ha−1 can be adopted to minimize soil erosion and maintain ecological security in the temperate Himalayas.

1. Introduction

Soil erosion represents one of the world’s major serious environmental problems because it not only results in soil degradation and a decline in land productivity but is also linked to secondary environmental variables [1] and contributes to global warming by reducing soil carbon (C) [2]. Over 20% of the soil organic carbon (SOC) formed by soil erosion is converted to carbon dioxide (CO2), which worsens the effects of global warming and lowers soil fertility. Accelerated soil erosion leads to the deterioration of soil quality. The rate of soil erosion from croplands worldwide is estimated to be 10.2 Mg ha−1 yr−1, which is over 24 times higher than the average natural erosion rate of 0.42 Mg ha−1 yr−1 [3]. This issue is particularly pronounced in hilly regions where soils are highly susceptible to erosion and other forms of degradation. Erosion leads to the depletion of topsoil depth, SOC concentration, stock, and nutrient levels [4]. Additionally, erosion significantly impacts soil texture, structure, available water holding capacity (WHC), and the ability to retain and transmit water, which ultimately influences soil quality and crop yield [5]. These changes aggravate chemical and nutritional limitations on crop production. Specifically, erosion decreases available water capacity (AWC) and SOC concentration while increasing soil bulk density [6]. Biochar is a substance characterized as “a C-rich material formed through the controlled burning of organic biomass, including crop leftovers, wood shavings, or animal waste, in a sealed container with minimal to no air exposure” [7]. In a more detailed description, [8] articulated biochar as a porous, carbonaceous solid substance derived from the thermochemical transformation of organic biomass under conditions lacking oxygen (O2). It possesses specific physicochemical attributes that make it well-suited for the enduring and secure sequestration of C within the environment. Under ideal pyrolysis conditions, biochar has significant implications for soil biogeochemical cycles. Due to its capacity for C sequestration, the utilization of biochar in soil has been advocated as a promising strategy for mitigating climate change. Notably, this is attributed to the highly favorable impact on atmospheric CO2 emissions, which results from the long-term stability of biochar when incorporated into the soil. Most of the C in biochar is in stable aromatic forms that are difficult to release as CO2 into the atmosphere [9]. Therefore, biochar sequesters more C than it emits and significantly reduces greenhouse gas (GHG) emissions and, ultimately global warming. Recent research in soil applications has revealed that biochar exerts influence on both non-living (abiotic) and living (biotic) processes and additionally leads to a reduction in the emissions of methane (CH4) and nitrous oxide (N2O) [10].
Biochar incorporation into agricultural soils represents a hopeful tactic for improving soil quality, enhancing plant growth and productivity, and reducing biomass remnants. It is a soil additive for remediation, improvement, agricultural fertilizer, and wastewater purification [11]. Furthermore, biochar enhances nutrient retention and cycling in the soil system. Adding biochar can reduce the amount of nutrients lost through erosion runoff [12]. Biochar addition decreases the amount of NH4+ and NO3 transferred by water during erosion [13]. Biochar reduces soil bulk density and penetration resistance, improves soil cohesiveness, offers aggregate stability, increases water availability, modulates soil hydraulic conductivity, reduces tensile strength and particle density, alters water infiltration, changes soil temperature characteristics, and affects soil water repellency [14]. Biochar applied to soil surfaces caused soil pores to become clogged due to dust present in biochar, resulting in a drop in soil porosity [15,16]. Biochar in clayey soils raised hydraulic conductivity and decreased runoff while increasing soil water retention and decreasing saturated hydraulic conductivity under sandy soils [17]. Due to its potential interactions with soil mineral particles when formed at low temperatures, biochar has an extraordinary capacity to enhance the formation of stable soil aggregates [18]. A biochar application rate of 1% increased soil aggregate stability by 217% [19]. Similarly, a 5% biochar application rate increases the 10% overall stability [20]. The increased soil aggregate stability after applying biochar may be due to its high C content. Adding biochar to soils increases hydraulic conductivity [21] and alters the ecosystem’s water balance [22]. Since biochar substantially impacts soil’s hydraulic and mechanical characteristics, the literature has also addressed how well biochar can prevent soil erosion [23]. Biochar application reduced soil losses by 64% [20] and runoff by 19 to 28% over control [24]. A production loss of 30–40 million tons (mt) of food grain per year is estimated to result from the loss of nutrients caused by soil erosion, which ranges from 5.37 to 8.40 [25]. Moreover, it has the ability to inhibit soil-borne pathogens while enhancing the growth and vitality of advantageous microbial communities, along with the efficiency of soil enzymes [26].
The favorable impacts of biochar on the physicochemical and biological attributes of the soil collectively enhance the accessibility of essential plant nutrients, typically resulting in enhanced crop performance [27]. Numerous research studies have shown that the application of biochar in combination with both inorganic and organic fertilizers has a positive effect on soil fertility and enhances plant performance [28,29]. Enhanced soil fertility not only reduces the need for additional fertilizer inputs but also boosts crop productivity, subsequently increasing CO2 absorption; this, in turn, generates a range of advantages, encompassing agricultural, environmental, and economic benefits [30]. The impact of biochar on the soil-plant system is contingent on a multitude of variables, including the physicochemical attributes and quantity of biochar, the type and quantity of fertilizer, the specific plant species, soil properties, and prevailing climatic conditions [31]. The advantages of biochar amendment are particularly pronounced in sandy soils, with sandy loam soils following closely in terms of agronomic benefits. Additionally, silty soils exhibit positive effects, although to a somewhat lesser extent. These benefits are more prominent in acidic soils as opposed to neutral or alkaline soils. Furthermore, greenhouse experiments tend to yield more noticeable agronomic benefits than field experiments [28,29]. Heavy metal contamination is distinguished by its elevated biological toxicity, extended persistence in the environment, and the challenges associated with remediation. Such contamination can result in harm to ecosystems, limitations on biological proliferation, and pose health risks to human populations [32]. The incorporation of biochar into soil has the potential to reduce the mobility and phytoavailability of certain trace elements in the soil through a range of mechanisms and interactions [33]. It serves as an environmentally friendly adsorbent with abundant functional groups and a porous structure, making it highly effective in adsorbing Cd2+ and Pb2+ [34]. The fragile Himalayan region in India is inhabited by ~51 million people, many of whom are involved in hill farming in delicate and complex ecosystems that include forests with a diverse range of species [35]. Erosion in the Indian Himalayas has resulted in the loss of soil, which in turn caused the greenery to deteriorate and, as a corollary, the effectiveness of the greener ecosystems. The Indian Himalayas are highly vulnerable to the adverse effects of global climate change. The temperate Himalayan region is especially more susceptible to soil erosion caused by deforestation, landslides, intensive agriculture, population pressure, and overgrazing. The temperate Himalayan region of India is recognized as a hotspot for erosion-induced soil degradation. The specific characteristics of this region make it particularly prone to soil erosion and its associated negative impacts. The conservation of soil is crucial to restoring yield potential and safeguarding the ecosystem’s natural balance. Food security is at a critical junction since soil erosion in agricultural areas occurs 10 to 40 times faster than soil formation [36]. Soil modifications and vegetation cover are the principal soil erosion control methods. Chemical additives can improve soil tensile strength and soil aggregate, which is thought to be an effective strategy to reduce soil erodibility. Examples of these additives include lignosulfonates, polypropylene fibers, and fly ash [37]. However, adding chemical compounds to soil can cause leaching and is only helpful for fine soils with high compaction levels. Adding straw mulch might be appropriate to arrest soil erosion and nutrient losses. However, typical crops cannot yield enough straw residues to be utilized widely [38]. Erodibility indices are crucial indicators that can be applied to describe the severity of the soil erosion issues posing a threat to the environment. When the physical measurement is very difficult, these indices are useful for estimating erosion susceptibility [39]. Very few studies assessed the effect of biochar on soil erosion in diverse ecosystems. The impact of biochar on soil erodibility indices has not yet been assessed in the Himalayan region of India, specifically in the temperate Himalayas. Soil erosion poses the most important danger to continued agricultural productivity, making the assessment of erosion intensity extremely relevant in the context of land evaluation in the Himalayan region. Consequently, the evaluation of erosion assumes paramount importance in decision-making processes and policy formulation aimed at preserving both land productivity and overall environmental integrity. Moreover, the incorporation of biochar as a soil conditioner warrants careful consideration to bolster the sustainability of natural vegetation. Thus, this study is based on the hypothesis that the application of apple biochar at 600 °C at an optimum rate, along with fertilizer applications, can reduce soil erosion. The purpose of this study is to ascertain the following: (i) the influence of different temperatures (400 and 600 °C) of pyrolyzed biomasses on soil erodibility compared to unpyrolyzed biomasses; and (ii) the effect of the rate of application of pyrolyzed biomasses (biochar) on soil erodibility indices under two fertilizer regimes in the hilly terrains of the temperate Himalayas. In summary, this research seeks to address critical knowledge gaps pertaining to the influence of biochar on soil erosion, with a specific focus on the temperate Himalayas in India. This study’s contributions are multifaceted. First, it will assess the impact of pyrolyzed biomass (biochar) at varying temperatures (400 and 600 °C) compared to unpyrolyzed biomass on soil erodibility, thus enhancing our understanding of the role of biochar in erosion control. Second, this study will explore the effect of the rate of biochar application on soil erodibility indices, providing insights into the optimal dosage for erosion mitigation. Furthermore, the research will investigate how biochar interacts with different fertilizer regimes, a crucial aspect of sustainable land management and agricultural practices. Ultimately, this study’s findings will contribute to the preservation of both land productivity and environmental integrity in the Himalayan region. The research will be organized into sections, including Materials and Methods, Results and Discussion, and Conclusion, with practical recommendations for policymakers, land managers, and environmental conservationists emerging as a central theme, thus offering a comprehensive roadmap for this investigation.

2. Materials and Methods

2.1. Study Area

This study was carried out in the mountains region that lies between 33°54′0″ to 34°22′0″ N and 73°59′0″ to 74°41′0″ E (Figure 1). The region experiences a Mediterranean- climate with four distinct seasons, i.e., spring, summer, autumn, and winter. The temperature in the area varies from −15 °C to as high as 32.5 °C during the hot season. The region’s flora is exceptionally diverse and intricate, including unique ecosystems absent from other parts of the state (Jammu and Kashmir-UT). The region has a very intricate and diversified flora, including distinct ecosystems that are absent from other sections of the state. The people in the district heavily rely on agriculture (crop production and animal husbandry) for their livelihood. The farmers cultivate maize, rice, wheat, barley, apples, pear, peach, walnuts, and other valuable crops and ornamental plants. The study area is characterized by the presence of the Himalayan moist temperate forest, which is predominantly composed of numerous evergreen and deciduous species. The dominant evergreen tree species found are Abies pindrow Spach Ham, Cedrus deodara Loud, Cupressus torulosa D. Don, Euonymus pendulus Wall, Pinus wallichiana Jackson, Quercus leucotrichophora A. Comm, and Rhododendron arboreum Smith. In terms of deciduous tree species, the Aesculus indica Colebr, Pyrus pashia Buch. Hemex D. Don, and Toona ciliata R. The shrubs in the study area were mainly characterized by dominant species such as Rubus leucocarpus A, Berberis chitria Lindl, and Berberis lyceum Royle.

2.2. Experimental Design and Sampling

A two-year experimental study was conducted to investigate the impact of biochar on proximate and soil erodibility indices. This study followed a factorial randomized complete block design (F-RCBD), with a plot size of 4 × 2 m2 incorporating two factors: feedstock type (apple residue—twigs and aquatic weed) and pyrolysis temperature (400 °C and 600 °C). The maize (Zea mays) was the target crop. The first factor, amendment type, consisted of seven levels: control (NB), 400 °C apple biochar (AB400), 600 °C apple biochar (AB600), raw apple chips (RAC), 400 °C weed biochar (DW400), 600 °C aquatic weed biochar (DW600), and raw aquatic weed (RDW) (Figure 2). The second factor involved three distinct levels of application rate: low (L)—1 tonne per hectare, medium (M)—2 tonnes per hectare, and high (H)—3 tonnes per hectare. The third factor encompassed fertilizer management, which was categorized into two levels: no-fertilizer (N) and recommended dose of fertilizer (F) [120:60:30—N: P2O5: K2O].
Upon the completion of the two-year study, soil samples were collected from the different maize plots during the crop harvest stage. A total of 38 treatment plots, each with three replicates, were selected, and samples were obtained at a depth of 30 cm (0–30 cm). The collected soil samples were air-dried at room temperature, ground, sieved through a 2 mm mesh, and stored in plastic containers for subsequent analysis.
The collected soil samples underwent various analyses to assess their proximate composition, erodibility indices, and aggregate stability. These analyses collectively provide a comprehensive understanding of the soil’s composition, erodibility characteristics, and aggregate stability, which are crucial for evaluating soil health, erosion risks, and potential management strategies. The following provides an overview of the performed analyses:
Biochar was produced using Patented technology IOT-based Multipurpose pyrolyzer cum heater cum cooker. It works on the principle of a system approach patented under patent number 202011056587.

2.3. Proximate Analysis

The proximate analysis was conducted to determine the moisture (MC), ash content (AC), volatile matter (VM), and fixed C (FC) in the pyrolyzed biochar. The moisture was measured based on the air-dry condition, while the VM, FC, and MC were calculated without considering the total and inherent moisture. The AC, VM, and MC measurements followed the guidelines and standards of the International Biochar Initiative in 2014 [40] and were performed using the ASTM 1762-84 test method [41].

Estimation of Moisture Content, Volatile Matter, Fixed C, and Yield Content in Biochar

MC estimation is crucial for understanding and managing water resources, irrigation, agricultural practices, and environmental monitoring. The method involved carefully weighing a 5 gram (g) (2 mm sieved) representative sample of biochar and subjecting it to a hot-air oven at 105 °C for 24 hours (h) until a constant weight was reached. This process removes all water present in the sample. After drying, the samples were reweighed to determine the weight loss due to the removal of moisture. MC was then calculated using the formula: MC   % = initial   mass     final   mass / initial   mass × 100 [42]. The calculated MC represents the percentage of water present in the biochar at the time of testing. Accurate determination of MC is crucial as it directly impacts biochar’s physical and chemical properties, including its porosity, surface area, reactivity, and ability to sequester C and nutrients.
Measuring the AC of biochar is a crucial analytical procedure that assesses the inorganic content or mineral content in the material. A 2 g representative sample of biochar was weighed and placed into a clean, dry crucible. After recording the initial weight, the sample was subjected to controlled heating in a muffle furnace at 750 °C for 6 h to completely combust the organic matter (OM). This process leaves behind only the inorganic ash. After cooling the crucible, the biochar sample is weighed, and the final weight is recorded. The AC (%) was then calculated using the formula: AC   % = final   mass     initial   mass / initial   mass × 100 [43]. This information provides valuable insights into the purity of biochar and its potential impact on soil properties and the environment.
The determination of the VM content aims to identify compounds that remain in the activated charcoal after the carbonization and activation processes but evaporate when subjected to a temperature of 950 °C. According to [44], the components present in activated charcoal include water, ash, FC, nitrogen (N), and sulfur (S). When the activated charcoal is heated above 900 °C, N and S components evaporate, constituting the VM content. The measurement involved placing 2 g of the dry sample into a pre-weighed porcelain cup. The sample was then heated in a furnace at 950 °C for 10 min and subsequently cooled in a desiccator for an hour. After cooling, the sample is weighed again to determine its weight after heating. The VM content was calculated using the formula: VM   % = a     b / a   × 100 % , where “a” is the sample weight before heating (in g) and “b” is the sample weight after heating (in g). This procedure enables the assessment of VM in the activated charcoal, providing valuable insights into its composition and characteristics.
The FC content of biochar is a crucial procedure that provides valuable insights into its C sequestration potential and overall stability as a C-rich material. The procedure for determining the FC content follows the guidelines specified in the Indonesian National Standard (SNI) 06-3730-1995 [45], which outlines the quality requirements and testing methods for activated charcoal. FC represents the C-bound fraction within the material, excluding the fractions of water, VM, and AC. For measuring the FC content, the following formula was used: FC   % = 100 %   VM   content   +   AC   content   % . This calculation allows for the quantification of the C content that remains in the activated charcoal after accounting for the volatile matter and ash fractions [45]. The measurement of FC is of utmost importance as it directly influences the C sequestration potential of biochar. FC serves as a stable reservoir of C, making biochar an effective C sink, capable of mitigating GHG emissions and contributing to climate change mitigation.
The YC measurement of biochar is a fundamental process to evaluate the efficiency of biochar production and the amount of biochar obtained from the initial biomass feedstock. The method begins with the pyrolysis of biomass in an O2-limited environment, converting the organic material into biochar, along with other by-products. After collection and cooling, a representative sample of the produced biochar was weighed in a clean container. To determine the YC, VM was removed by heating the container with biochar at a specific temperature for a sufficient duration. After cooling and reweighing, the YC was calculated as the percentage of biochar obtained from the initial biomass, using the formula: YC   % = initial   weight     final   weight / initial   weight     final   weight × 100 [46]. This measurement is crucial for optimizing biochar production, selecting appropriate feedstocks, and assessing its potential applications in soil improvement, carbon sequestration, or energy generation. Additionally, it provides valuable insights into the efficiency and sustainability of biochar production processes.

2.4. Erodibility Indices, Aggregate Stability and Total Organic Carbon

Soil DR refers to the ratio or proportion of dispersed soil particles (clay and silt) to the total soil mass. It is a measure of how easily soil particles disperse and become suspended in water [47]. Considering that soils with higher dispersion ratios are more prone to erosion and sediment flow, the DR is frequently used as a measure of soil erodibility. A soil sample is combined with water in a lab setting to estimate the DR, and the number of dispersed particles is then measured. The Bouyoucos hydrometer method for particle size characterization, as reported by [48], calculated the amount of silt and clay in samples that were distributed in water and calgon. The following formula was used to calculate the DR: DR   =   suspension   % / silt   +   clay .
The clay-to-moisture equivalent ratio (CMR) is a measure of the moisture-holding capacity of clay soils. It represents the ratio of the amount of clay in a soil sample to the moisture content at which the soil is at its maximum water-holding capacity [49]. The moisture equivalent is the point at which the soil retains a certain amount of water against the force of gravity, and no more water can be drained out of the soil. The clay-to-meq ratio was adapted from [5] and computed using the formula: CMR   =   clay / meq   ratio .
PR, also known as infiltration ratio or permeability ratio, is a measure of how water infiltrates or percolates through a soil profile. It represents the ratio of the rate at which water infiltrates into the soil to the rate at which it drains or percolates through the soil [50]. The PR is the possible susceptibility index and was determined by the method adapted from [51]. The following formula was used to calculate the PR: PR   =   suspension   % / clay / meq   ratio .
Soil ER refers to a measure that quantifies the rate or extent of soil loss from a given area over a specific period. It is a crucial indicator used to assess the severity of soil erosion and its impact on soil productivity and environmental sustainability. The soil ER is typically expressed as the amount of soil lost in a certain unit of area or depth over a defined time period. The ER was determined by the method provided by [52]. The following equation was used to obtain the ER: ER   =   DR / clay / meq   ratio .
The CR assesses the proportion of clay [47] in relation to sand and silt. This binding agent firmly binds soil particles together when there is a higher concentration of clay particles, making it more difficult for external pressures to separate them. Determination of the CR provides insights into the soil’s physical properties and behavior. It can help in understanding soil structure, permeability, and other characteristics influenced by the clay content. The following equation was used to obtain the CR: sand   +   silt / clay . Yoder’s wet sieving method determined MWD [53]. A total of 40 g air-dried, 4–8 mm size range aggregate samples were used for this. The wet sieving of the air-dry soil sample was carried out using a nest of sieves with mesh openings of 4.00, 2.00, 1.00, 0.50, 0.25, and 0.125 mm, respectively. Aggregate size distribution was determined based on the weight of aggregates retained in each sieve class concerning the total soil sample weight. MWD characterized the size distribution of aggregates, which was estimated using the following formula :   MWD   = i = 1 n W i     X i . Where Wi is the proportion of the total dry sample weight, Xi is the mean diameter of any particular size range of aggregates separated by sieving and equal to X i + X i 1 / 2 .
Total organic carbon (TOC) was measured with a modified Mebius-based method [54]. In a nutshell, 1 g of soil that had been sieved to a 0.5 mm thickness was put in a 500 mL conical flask and digested for 30 min at 150 °C with 10 mL of 1N K2Cr2O7 and 20 mL of concentrated H2SO4. The samples were allowed to cool, followed by the addition of 200 mL of distilled water, 10 mL of concentrated orthophosphoric acid, and 1 mL of diphenylamine indicator. The contents were titrated against 0.2 mol (Fe2+) L−1 Mohr salt.

2.5. Statistical Analysis

The obtained results from various parameters were subjected to statistical analysis using well-established procedures described by [55]. Descriptive statistics, three-factor analysis, and analysis of variance (ANOVA), followed by mean comparisons using Tukey’s HSD test at a p-value of less than 0.05, and correlation coefficients were computed using SPSS software version 27.0. This comprehensive statistical evaluation allowed for a robust examination of the data, enabling a deeper understanding of the relationships between different factors and their significance.

3. Results and Discussion

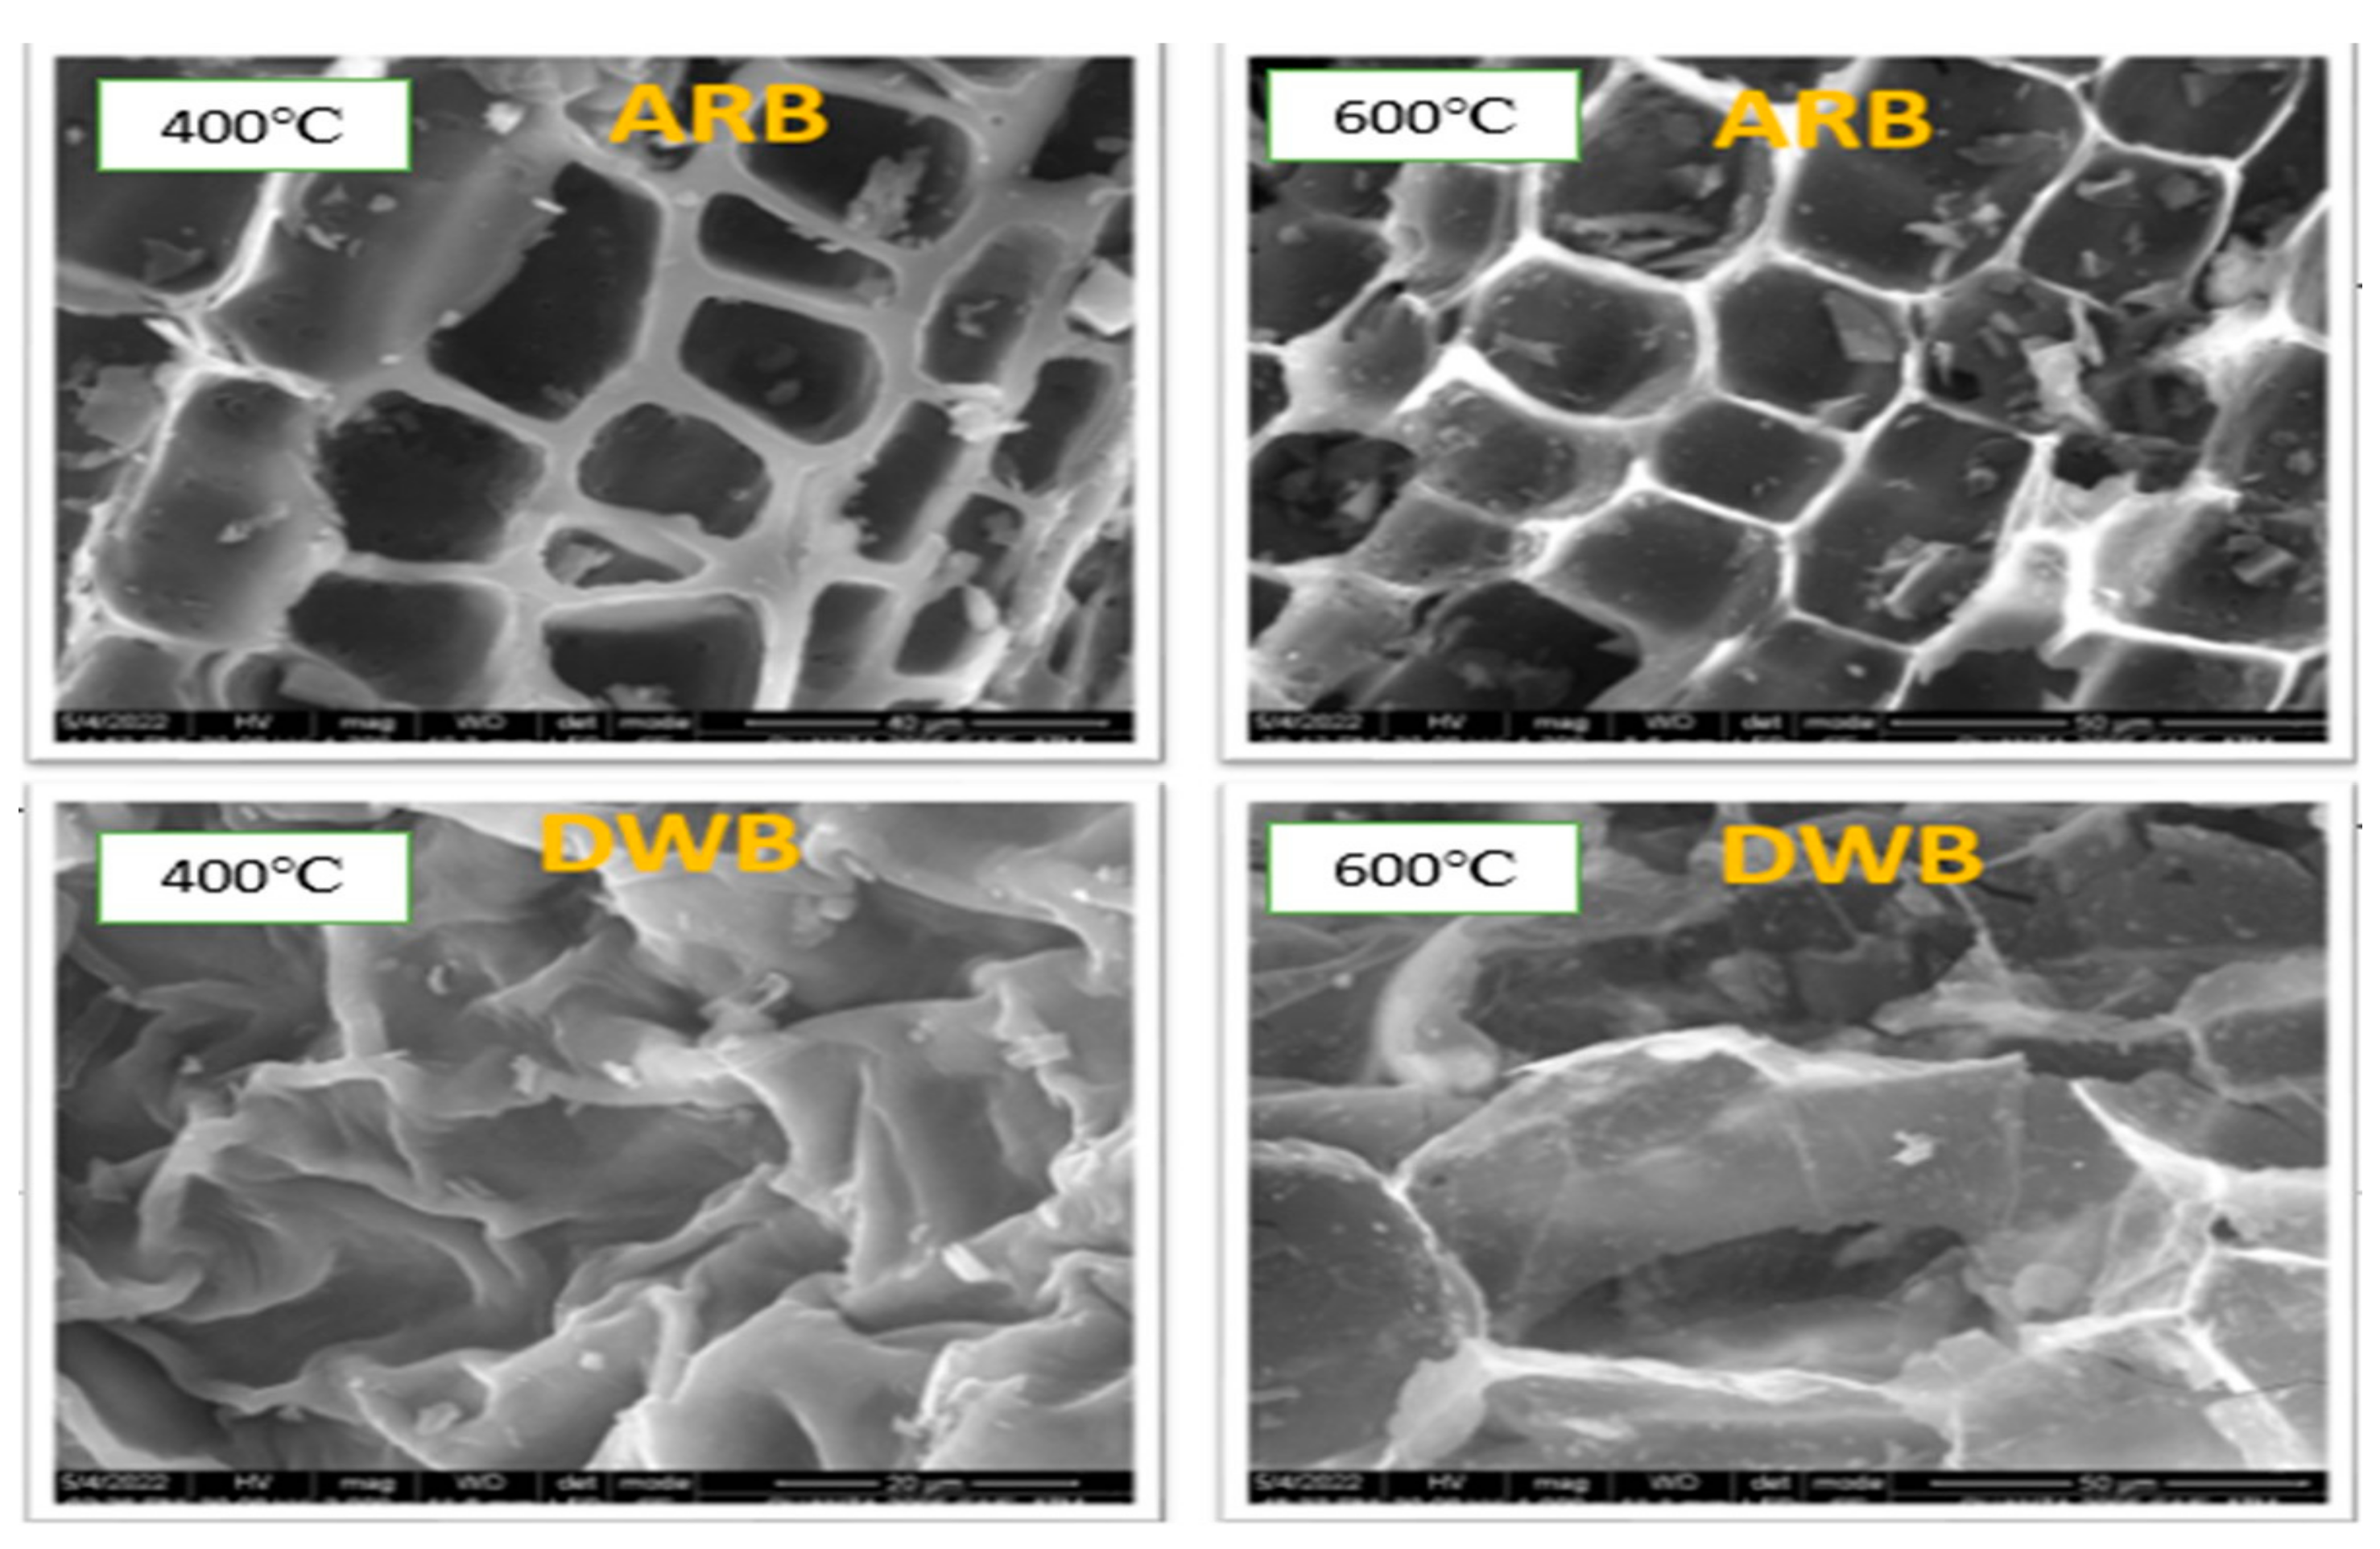
3.1. Effect of Feedstock and Pyrolysis Temperature on Proximate Analysis

The proximate indicators of biochar are influenced by the pyrolysis temperature and feedstock type. Under apple and aquatic weed biochar at 400 °C, the MC was 2.00% and 4.14%, respectively. At 600 °C, the MC was 2.77% and 4.44% for apple and aquatic weed biochar, respectively (Table 1). The aquatic weed biochar had higher MC than apple biochar at both temperatures, with 51.69% and 37.61% higher MC at 400 and 600 °C, respectively. A higher MC was found in the aquatic weed biochar than the apple biochar, and the MC increased with the increased thermal treatment, i.e., MC at 600 °C was >400 °C. Despite observed mean discrepancies, there were no statistically significant differences in MC between the apple and dal weed biochar at both pyrolysis temperatures. Aquatic weed biochar having greater MC at both pyrolysis temperatures could be due to larger surface area and porosity that internally stores more moisture during its growth cycle. Similar findings have been reported by [56,57] indicating that, in comparison to agricultural residues, wetland plant biomass generally contains a higher MC, leading to a substantial increase in transportation and pyrolysis costs. The increase in MC relative to charring temperature could be attributed to a significant increase in the specific surface area leading to the separation of water molecules [58,59]. However, it is noteworthy that the pyrolysis temperature had minimal impact on the MC of the resulting biochar product. These results align with those previously documented by [60].
The AC was higher under aquatic weed biochar compared to apple biochar. At 400 and 600 °C, the AC was 7.75% and 9.64% in apple biochar, 39.64% and 42.74% in aquatic weed biochar, respectively. The AC increased with higher pyrolysis temperatures. Apple biochar had significantly less AC than aquatic weed biochar, with 80.45% less AC at 400 °C and 77.45% less at 600 °C. Statistically significant differences in AC were observed between the apple and dal weed biochar at both pyrolysis temperatures. Research by [61] demonstrated elevated AC in biochar derived from aquatic plants under various pyrolytic conditions. AC impacts biochar quality in a reverse relationship: the lower the AC, the higher the biochar quality. AC is the inorganic fraction that cannot be volatilized or destroyed by combustion [62,63]. AC was more in aquatic weed biochar than the other at both thermal treatments. Low AC in apple biochar may be due to the less mineral content in the feedstock, whereas high AC in aquatic weed biochar could be due to the accumulation of various inorganic compounds [64]. Ref. [65] reported that the presence of ash-forming elements such as calcium carbonate, iron, silicates, and other metals might contribute to the high AC of the biochar. The AC under the studied feedstock biochar substantially increased with an increase in pyrolysis temperature. Similar findings have been reported by [66,67], who found a considerable increase in AC with the increase in pyrolysis temperature. The increase in the AC may be attributed to the progressive concentration of inorganic constituents [68], which also was revealed by [69].
VM content was higher in apple biochar compared to aquatic weed biochar. At 400 °C, apple biochar had a VM of 32.02%, while aquatic weed biochar had 21.64%. At 600 °C, apple biochar had a VM of 15.33%, while aquatic weed biochar had 14.50%. Apple biochar showed significantly higher VM content at both temperatures. There were statistically significant distinctions in VM content between the apple and dal weed biochar at both pyrolysis temperatures. VM decreased in the order of apple biochar and aquatic weed biochar, with apple biochar having more VM at both thermal treatments; this could be a consequence of the volatile fractions further cracking into low molecular weight liquids and gases rather than char as a result of rising temperature [41,70,71,72]. Also, the breakdown of cellulose and hemicellulose moieties may be the cause of the decrease in VM that occurs, along with an increase in pyrolysis temperature [73]. Our findings are in line with those reported by [74,75]. The pattern of our results supports the findings of other researchers who found that decreasing VM was correlated with increasing pyrolysis temperature [76].
FC content was higher in apple biochar compared to aquatic weed biochar. At 400 °C, apple biochar had FC of 60.73%, while aquatic weed biochar had 39.47%. At 600 °C, apple biochar had FC of 74.58%, while aquatic weed biochar had 43.44%. The FC content exhibited statistically significant differences between the two types of biochar at 400 °C. However, they were found to be par at 600 °C. The FC in biochar is that portion of C that is refractory and stays in the soil for a longer length of time [66]. FC is the primary indicator of the biochar’s capacity to sequester C [77]. According to the present study, FC fluctuates depending on feedstock type and pyrolysis temperature. The FC was higher in apple biochar at both the pyrolysis temperatures than aquatic weed biochar, and with an increase in temperature, there was a considerable increase in FC. Biochar produced from woody-based feedstock, in our case apple biochar, typically contains more C than feedstocks from other sources (aquatic weed) [78]. An increase in FC denotes a faster carbonization process occurring at a higher temperature, leading to larger C contents in aromatic compounds [79]. It was found that biochar with a high FC had less AC, which is in line with the findings of [80]. Ref. [81] hypothesized that the FC was comparatively high for biochar having low AC and vice versa. The quantity of biomass components, especially hemicellulose, cellulose, and lignin, as well as the variations in thermal stability among these components, has a major impact on the FC content [82]. Hence, the apple-based biochar had more FC at a higher pyrolysis temperature, i.e., 600 °C, which might be due to more cellulose, lignin, and lignin/cellulose in apple feedstock [83]. With the increase in temperature from 400 °C to 600 °C, the FC increased rapidly from 63.73 to 74.58% (in apple biochar) and from 39.47 to 43.44% fixed C, which may be attributed to the removal of VM, leaving the more stable C in the feedstock [13].
Aquatic weed biochar had a higher yield (%) than apple biochar at both pyrolysis temperatures (Table 1). At 400 °C, apple biochar had a yield of 36.80%, while aquatic weed biochar had 17.37%. At 600 °C, apple biochar had a yield of 47.34%, while aquatic weed biochar had 37.00%. The yield of aquatic weed biochar was greater than the apple biochar at 400 °C. A similar trend was observed under 600 °C pyrolysis temperature. The yield content exhibited statistically significant differences between the two types of biochar at 400 °C. However, they were found to be par at 600 °C. The biochar yield under both feedstocks decreased relative to the increase in pyrolysis temperature. Our results align with those of other workers who reported that the feedstock type and pyrolysis temperature considerably impact the biochar yield [84]. The highest biochar yield was produced using aquatic weed feedstock due to elevated AC and lignin content [85]. The decrease in biochar yields relative to increasing thermal temperature is due to the degradation of lignocelluloses and the devolatilization of OM present in feedstock [86]. Aquatic weed biochar showed higher MC, AC, and yield, while apple biochar exhibited higher VM and FC content.

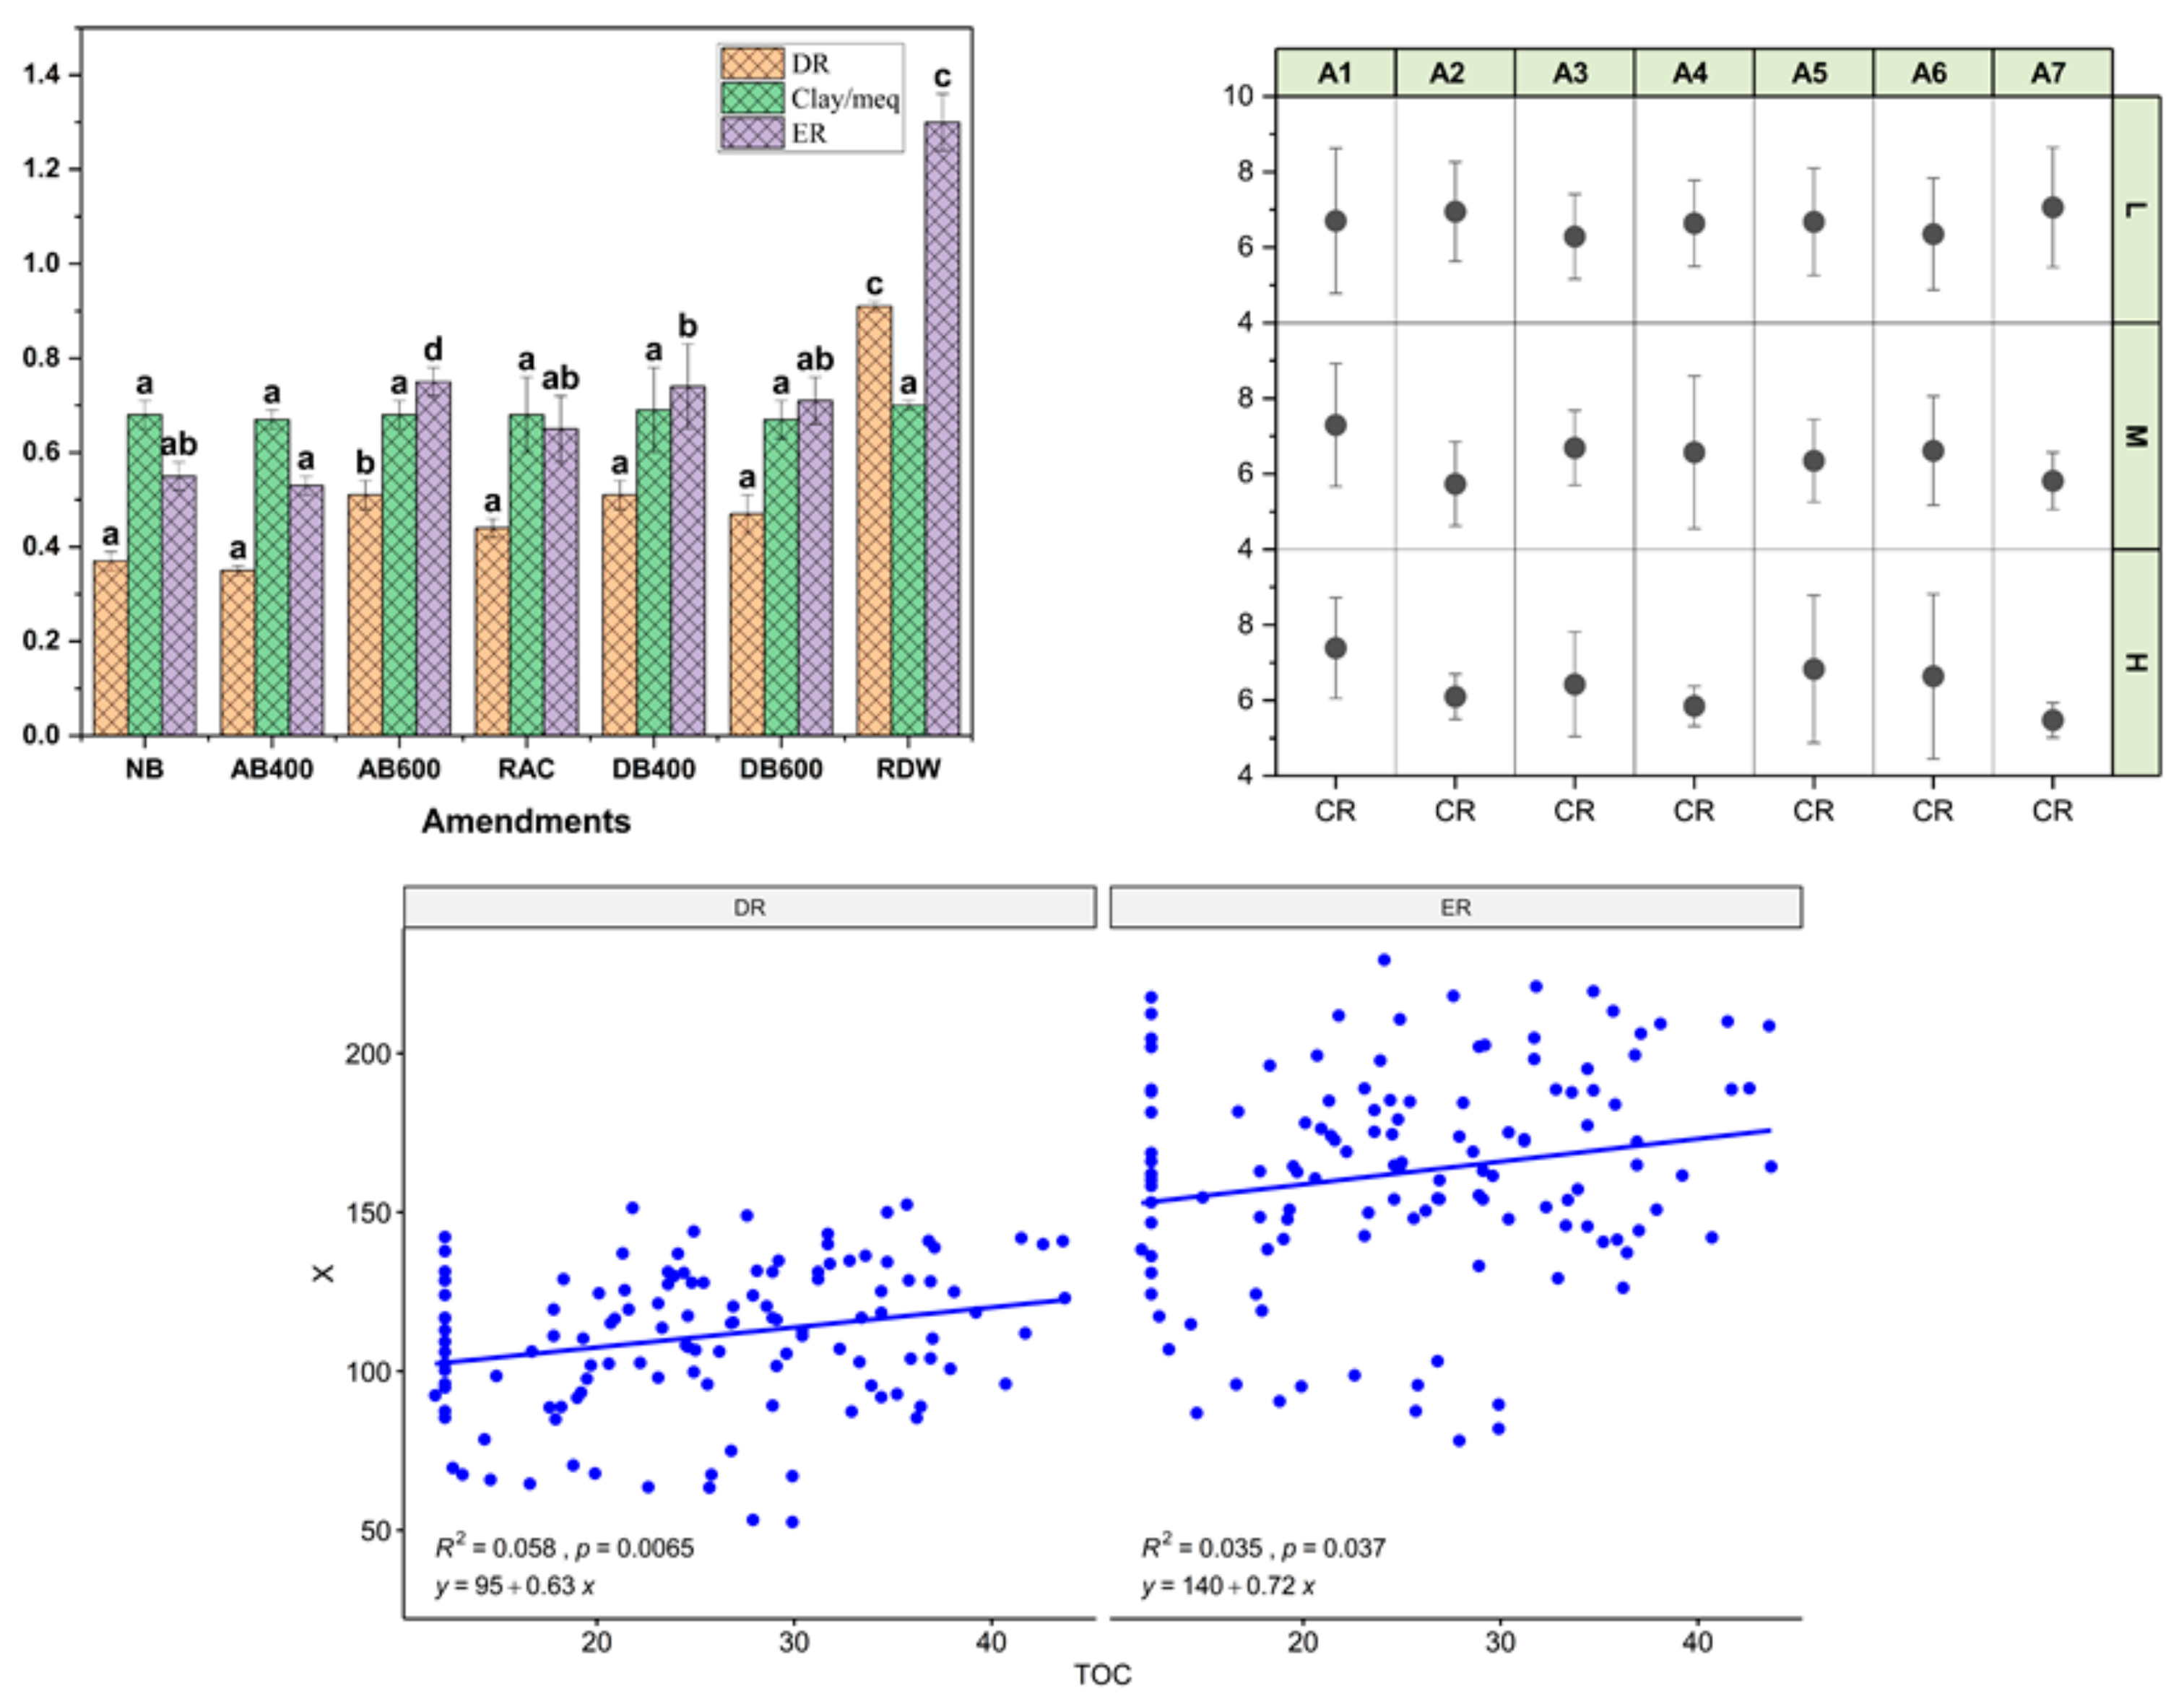
3.2. Effect of the Amendment (Pyrolyzed and Unpyrolyzed), Rate, and Fertilizer on Soil Erodibility, Aggregate Stability and Total Organic Carbon

The percentage of dispersible clay serves as a valuable indicator of soil structure stability. DR values are indicative of reduced resistance against soil erosion [87]. Table 2 shows the DR for various additions, application rates, and fertilizer concentrations. The DR’s average values were 0.37, 0.35, 0.44, 0.51, 0.47, and 0.91 for amendment levels NB, AB400, AB600, RAC, DW400, DW600, and RDW, respectively. The highest DR mean value was found in the RDW amendment level (0.91), followed by AB600 and DW400 (0.51), while the lowest was in AB400 (0.35). Significant differences were only observed in the RDW, AB600, and DW400 amendment levels. Pyrolyzed residues are recognized for their capacity to enhance soil structure, reduce soil erosion, and improve soil stability compared to unpyrolyzed residues, as demonstrated in this study [88]. Similar to our study, Ref. [89] revealed that all biochar treatments improved soil structure stability, evidenced by a notable decrease in DR with statistical significance. High DR soils have a weak structural foundation and are readily degraded [90]. DR among the amendment levels followed the decreasing order: RDW > (AB600 = DW400) > DW600 > RAC > NB > AB400, respectively. The DR was 0.41 at the high application rate, 0.48 at the medium rate, and 0.61 at the low application rate. Significant differences were only observed at the low application rate, while the high and medium rates of application were found to be statistically the same. A high mean DR was recorded at the low application rate, whereas a low DR was found at the high application rate, revealing that the application of amendments at higher rates can facilitate less soil disruption than at low levels. However, the high and medium application rates were statistically similar. High and medium biochar application rates have the potential to reduce soil dispersion ratio through various mechanisms. The study [91] revealed that applying amendments at higher rates led to a substantial reduction in the DR, which is consistent with our own findings. Similarly, Ref. [92] reported that the application of biochar at higher rates resulted in a reduction of the DR compared to the control. This effect was attributed to the OM introduced to the soil through the biochar application. The incorporation of biochar contributed to soil structure stabilization and a subsequent decrease in the DR. This underlines the importance of adding organic matter to fortify soil against physical degradation and erosion. Soils with high DR tend to have weaker structural integrity, making them more susceptible to erosion [93]. As a stable form of C, biochar acts as a physical barrier and creates a porous network when applied at high rates, helping bind soil particles together and reducing their susceptibility to dispersion. Moreover, it promotes soil aggregation, forming larger and more stable structures that are less prone to dispersion by erosive forces like water [94]. Biochar’s high water-holding capacity retains moisture in the soil, preventing soil particles from breaking apart and becoming easily dispersed. Its alkaline properties can also neutralize soil acidity, favoring the formation of stable soil aggregates [95]. The persistent OM content from biochar improves soil structure and stability. Beneficial soil microorganisms thrive in the presence of biochar, contributing to soil aggregation and further reducing the DR. The DR among the application rates decreased in the order of L > M > H. Dispersed soil is vulnerable to mechanical collapse, erosion, and silting and generally would have poor stabilization issues; therefore, this has a favorable impact at a low application rate [96]. The DR among the fertilizer levels was 0.49 at the no-fertilizer level and 0.38 at the fertilized level, exhibiting no significant differences between the fertilizer levels. However, reports by [97] revealed that biochar combined with both organic and inorganic fertilizers was reported to yield substantial enhancements in soil quality, improved soil tilth, aggregation, and stabilized soil structure, providing soil resistance to erosion and dispersion. Low-dispersive soils provide higher structural stability because they are better suited to absorbing shocks, overcoming issues with deterioration or pressures, and remaining resilient [98].
The amendment NB, AB400, AB600, RAC, DW400, DW600, and RDW, respectively, indicated mean values of the CMR of 0.68, 0.67, 0.68, 0.68, 0.69, 0.67, and 0.70 (Table 2). The RDW amendment had the highest mean CMR (0.70), whereas the lowest was observed in the AB400 and DW600 (0.67). The RDW amendment might have contributed to increasing the water retention capacity. RDW acts as a sponge-like material, absorbing and holding water effectively, which results in a higher CMR value. This increased water retention would have improved the moisture availability to the clay particles in the soil [99]. Ref. [100] reported that aquatic weeds have a greater surface area that affects their ability to hold water; this may result in varying CMR values among the other amendments. All the amendments had non-significant differences in the CMR. Aquatic plants, which grow in water-rich environments, often have a high-water content. When these plants are converted into biochar, some of this water is retained in the biochar structure, contributing to a higher CMR [101]. The mean CMR was greater at the low application rate (0.78), followed by the high (0.69), and was lower at the medium (0.68) application rate. The CMR for high, medium, and low application rates was found to be statistically similar (i.e., non-significantly different). The CMR among the application rates decreased in the order of L > H > M. Biochar-treated plots at a medium application rate had low CMR due to the ability of biochar to form soil aggregates and the creation of floccules reduced clay formation as compared to those without biochar [102]. In the fertilizer levels, the mean CMR for the no-fertilizer level was 0.68 and 0.73 for the fertilizer-based level. The no-fertilizer-based level had a mean CMR that was at par with the fertilizer-based level. No significant difference was observed between the two fertilizer levels (i.e., N = F). The RDW amendment had a higher PR (58.50), followed by AB600 (33.75), whereas the lowest was in AB400 (23.51). RDW might have had a higher porosity than both types of apple biochar, allowing water to percolate more easily through the soil. RDW might have integrated more effectively with the soil particles, creating larger pore spaces and pathways for water movement compared to the apple biochar treatments [103]. PR among amendments was in the decreasing order as follows RDW ˃ AB600 ˃ DW400 ˃ DW600 ˃ RAC ˃ NB ˃ AB400 with mean values 58.50, 33.75, 33.27, 31.57, 29.12, 24.49 and 23.51, respectively (Table 2). The mean values of the PR among the amendment levels varied widely. The NB, RAC, DW400, and DW600 amendment levels were found to be statistically par with each other. The AB400, AB600, and RDW amendment levels exhibited significant differences in the PR compared to the other amendment levels. PR difference level followed the decreasing order; RDW > AB600 > (NB = RAC = DW400 = DW600) > AB400, respectively. RDWs with higher water-holding capacity may slow percolation because they can absorb and retain more water within their porous structure. In contrast, biochars with lower water-holding capacity may allow water to pass through more quickly [104]. Similar findings by [105,106] revealed that biochar attributed to a decrease in the PR due to reduced water flow and soil detachment, but this also depends on the residence time and biochar type. The PR was 26.74 at the high application rate, 31.77 at the medium rate, and 35.20 at the low application rate. The mean PR was substantially higher at the low application rate than at the medium and high application rates. The mean PR among the application levels increased in the order of H > M > L. Despite mean discrepancies, there was no discernible difference between the three application rates. Our findings are in line with those reported by [107], revealing no consistent difference in application rates. Compared to the control level, biochar incorporation and feedstock biomass addition in maize crops have a greater tendency to reduce percolation losses due to the size of internal pore spaces, pore structure, and soil adsorption capacity [108]. The PR at the no-fertilized level was 32.43, whereas, at the fertilized level, it was 23.43. The PR at the no-fertilized level was more than at the fertilized level, indicating that soils with no fertilizer additions tend to extend towards greater losses than those that have added fertilizers (Figure 2). Despite mean discrepancies, there was no discernible difference between the two fertilizer levels, i.e., N = F. A low ER (0.53) was observed in the AB400 amendment level, followed by NB (0.55), and the highest was in the RDW amendment level (1.30). Our findings are in line with those of [109]. The mean ER values were 0.55, 0.53, 0.75, 0.65, 0.74, 0.71, and 1.30 in the various amendment levels, i.e., NB, AB400, AB600, RAC, DW400, DW600, and RDW, respectively (Table 2, Figure 3). The mean ER values among the various amendment levels ranged from 0.53 to 1.30. The AB400, AB600, DW400, and RDW amendment levels exhibited a significant difference in ER. Meanwhile, the NB, RAC, and DW600 amendment levels were found to be non-significant between each other and were significantly different from the other amendment levels. The AB400 amendment level was 59.23% lower in ER than in RDW. The mean values of the ER among the amendment levels followed the increasing order: AB400 < NB < RAC < DW600 < DW400 < AB600 < RDW, respectively. The decrease in ER observed after the introduction of biochar is consistent with a recent study conducted by [110] revealing the erosion potential of apple wood biochar using flume tests. The mean ER was 0.60 at the high application rate, 0.71 at the medium rate, and 0.79 at the low application rate (Figure 4). A considerably low mean ER was recorded at the high application rate level, whereas a high ER was found at the low application rate level. Our findings are supported by the results of previous studies [111,112], which reported that higher biochar application rates lead to a significant decrease in soil loss rates. The high and medium application rate levels were statistically non-significantly different in ER, whereas the low application rate varied significantly among the three application rates. Biochar favors stable soil structure and high aggregate stability for increasing soil porosity and reducing erodibility [113]. The porous form of biochar can bind nutrients and water, improving the soil’s capacity to hold water and preventing water erosion [114]. Higher clay content in the soil results in a larger specific surface area, making it more favorable for interactions with biochar compared to soils with lower clay content. This characteristic enables the soil to bind more tightly with the biochar directly or through a process where the biochar first adsorbs SOM and then binds to adjacent soil particles [115]. Consequently, biochar becomes occluded into aggregates, enhancing their stability [116]. Consequently, with increasing biochar application rates, soil erosion decreases due to the improved soil structure and stability brought about by the interaction between clay-rich soils and biochar. The mean values of ER among the application levels decreased in the order of L > M > H. The ER in the no-fertilized fertilizer level was 0.73; at the fertilized level, it was 0.53. The non-fertilized level had a 27.40% higher mean ER value than the fertilized level. However, despite such mean and percentage differences, they were found to be statistically par with each other (F = N). Our results are consistent with the findings of [117], indicating that the combination of biochar and fertilizer provides a robust foundation for its inclusion in soil management strategies aimed at mitigating fertility erosion. The application of soil nutrients through external sources such as fertilizers enhances crop performance by increasing both above-ground and below-ground biomass, thereby reducing the velocity of runoff [118] and causing erosion.
CR measures the ratio of erosion-prone primary particles to clay; therefore, higher CR values imply erosion susceptibility [119]. The mean CR values of the various amendment levels, i.e., NB, AB400, AB600, RAC, DW400, DW600, and RDW, were 4.26, 4.12, 4.01, 4.40, 4.11, 4.32, and 5.22 (Table 2). The various amendment levels did not show statistically significant differences in the CR. A high mean CR value was recorded at the low application rate level, whereas a low CR was recorded at the high application rate level. The mean values of CR among the application levels decreased in the order of L > M > H. Regarding CR; there was no statistically significant difference between the high, medium, and low application rates (i.e., H = M = L). The CR value at the AB600 amendment level and high application rate imply that erosion impact and adverse implications on land can be maintained and reduced compared to control and other amendments and application rates. Higher CR reduces the ability of soil to form soil aggregates and improve structure, leading to greater erosion. According to [120], a minimum of 10% clay content is required for any useful interpretation. The CR was found to be higher at the fertilizer level (4.50) than at the no-fertilized level (4.34); however, non-significant differences varied between the two fertilizer levels, indicating a similar intricate effect. The MWD values exhibited by amendment levels NB, AB400, AB600, RAC, DW400, DW600, and RDW were 1.25, 1.45, 1.46, 1.32, 1.32, 1.31, and 0.86 (Table 2). The highest mean value for MWD was found in the AB600 amendment level (1.46), followed by AB400 (1.45), while the lowest was in RDW (0.86). The MWD was statistically at par between AB400 and AB600, whereas it was also at par between the RAC, DW400, and DW600 amendment levels. A number of studies have revealed significant differences in MWD among varying amendments [121,122]. A key determinant of the quality of soil structure, soil sustainability, plant growth, and crop output is the stability of soil aggregates and the generation of those aggregates [123]. Applying biochar-based amendments into the soil enhanced MWD significantly. Similar findings have been reported by [24]. High TOC in apple-based amendments may have increased MWD by increasing the hydrophobicity and adhesion between the soil particles, which may have created interconnected layers and large aggregates at the soil surface [124]. High MWD in AB600 and AB400 amendment levels may be attributed to high C contents. Higher soil MWD indicates more stable aggregates with more resistance to erosive pressures, particularly the wind and water. The MWD was 1.01 at the high application rate, 1.26 at the medium rate, and 1.19 at the low application rate levels. In contrast, a low MWD was found at the high application rate level. The high, medium, and low application rate levels significantly differed in MWD. The MWD means valued among the application rate levels increased in the order H < L < M. Our findings are in contrast to those presented by [20,92] and in line with [125]. The MWD was higher at the no fertilizer level (1.29) than at the fertilized level (1.27). However, non-significant differences between the two fertilizer levels suggest a similar effect.
A higher TOC content (34.74) was observed in the AB600 amendment level, followed by DW600 (29.69), and the lowest was in the NB amendment level (12.30). The mean TOC values were 12.30, 28.83, 34.74, 25.94, 25.50, 29.69, and 20.05 in the various amendment levels, i.e., NB, AB400, AB600, RAC, DW400, DW600, and RDW, respectively (Table 2). Statistically significant differences in TOC were observed among the different amendments; however, the AB400 and RAC were found to be at par. Similar findings have been reported by [126,127], revealing that wood-based biochar tends to have higher TOC contents. The mean values for TOC were 19.73, 24.36, and 31.80 for the high, medium, and low application rate levels. A considerably high TOC content was recorded at the low application rate level, whereas a low TOC was observed at the high application rate level. The mean values of TOC among the application levels decreased in the order of L > M > H. The TOC content between the three application rates varied significantly. Our results showed that the application of biochar amendments at a medium application rate increased TOC [128], which improves soil quality by enhancing aggregate stability and sequestration of C in the soil. Biochar due to the recalcitrant nature of the polycondensed aromatic groups, biochar is a relatively stable type of TOC. It is primarily made up of alcohols, phenols, and organic acids (which contribute O-H groups), ethyl and ethylene structures (which contribute C-H, CH2 groups), amide, ketone, and quinone structures (which contribute C = group), as well as another olefin (C=C) structures, contributes to higher TOC in biochar based amendments [129]. Similarly, a few researchers found that adding biochar to the soil under field settings increased its C concentrations [9,130]. The TOC in the no-fertilized level was 24.45; at the fertilized level, it was 26.14. Higher mean TOC was found at the fertilized level than at the non-fertilized level. The fertilized level had a 6.47% higher TOC as compared to the non-fertilized level; however, despite mean discrepancies, there was no discernible difference between the fertilizer levels.

4. Conclusions

Pyrolysis temperature and feedstock played a vital role in governing biochar’s physical and nutrient characteristics. Various soil erosion mitigation strategies are currently employed under Himalayan conditions, but most of them are cost-intensive and cannot be applied over a large area. It is evident that different amendment levels had varying effects on DR, a key indicator of soil erodibility. RDW demonstrated the highest erodibility, while DW400 and DW600 exhibited promise in mitigating soil erosion by causing less soil disturbance. Notably, the pyrolysis of aquatic weed residue led to improved soil erodibility, contrasting with the increased erosion resulting from AB600 due to aggregate disintegration. Sole residue application, viz., apple woodchip residue and aquatic weed, cannot be recommended for application to soil because, from the above study, it was concluded that these residues could increase soil erosion rates in a hilly region, especially at higher rates. Hence, pyrolysis of these residues is highly recommended because of its dual benefits as pyrolysis increases C content in the residues as well as improves their physical properties, which makes these residues better absorbents, which helps in enhancing nutrient use efficiency and minimizing dependence on chemical fertilizers for crop production. The application rates also played a significant role, with lower rates showing higher DR compared to medium and high rates. Interestingly, the absence of fertilizer showed a higher DR compared to the fertilized level. Applying fertilizers with pyrolyzed residues will improve crop productivity and increase crop biomass and later incorporation into the soil, making the soil stronger to resist erosion. As a practical recommendation, applying AB600 °C at 3 t ha−1 with fertilizer incorporation stands out as a promising strategy to minimize soil erosion and ensure ecological security in the temperate Himalayan region. These findings underscore the potential of biochar and pyrolyzed residues in sustainable soil management. This study has a few notable limitations that warrant consideration. Firstly, the research findings are specific to the temperate Himalayan region of India, and their applicability to other areas with different environmental conditions may vary. Additionally, this study’s short-term nature might not fully capture the long-term effects of biochar application, emphasizing the need for longer-duration investigations. Furthermore, the interaction between biochar and different fertilizer types and application rates must be thoroughly explored, highlighting the need for further research to account for this variability. Implementing biochar and residue management on a larger practical scale might face logistical and economic challenges that were not addressed in this study. These limitations emphasize the need for cautious interpretation and consideration of this study’s findings in different geographical and environmental contexts.

Author Contributions

Conceptualization, O.A.W., S.S.K. and S.B. (Subhash Babu); methodology, O.A.W. and S.S.K.; software, O.A.W.; validation, O.A.W., F.A., S.S.K., R.H.K., S.A.M. and S.B. (Shabir Bangroo); formal analysis, O.A.W. and S.B. (Shabir Bangroo); investigation, O.A.W. and S.S.K.; resources, O.A.W. and S.B. (Subhash Babu); data curation, O.A.W. and S.S.K.; writing—original draft, O.A.W., S.S.K. and S.B. (Subhash Babu); writing—review and editing, O.A.W., S.S.K., S.B. (Subhash Babu) and A.R.M.; visualization, O.A.W.; supervision, F.A., S.B. (Subhash Babu), R.H.K., S.A.M., S.S.M., S.B. (Shabir Bangroo), A.-R.Z.G., S.M.P. and S.S.R.; funding acquisition, S.B. (Subhash Babu), A.-R.Z.G. and S.M.P. All authors have read and agreed to the published version of the manuscript.

Funding

This research received no external funding.

Data Availability Statement

Data can be made available on request to corresponding author.

Acknowledgments

The authors are thankful to all the members of the Division of Soil Science SKUAST K and PI—IDP NAHEP SKUAST K. The authors extend their appreciation to the Researchers Supporting Project number RSPD2023R686, King Saud University, Riyadh, Saudi Arabia.

Conflicts of Interest

The authors declare no conflict of interest.

References

  1. Adimassu, Z.; Mekonnen, K.; Yirga, C.; Kessler, A. Effect of soil bunds on runoff, soil and nutrient losses, and crop yield in the central highlands of Ethiopia. Land Degrad. Dev. 2014, 25, 554–564. [Google Scholar]
  2. Borrelli, P.; Robinson, D.A.; Panagos, P.; Lugato, E.; Yang, J.E.; Alewell, C.; Wuepper, D.; Montanarella, L.; Ballabio, C. Land use and climate change impacts on global soil erosion by water (2015–2070). Proc. Natl. Acad. Sci. USA 2020, 117, 21994–22001. [Google Scholar]
  3. Zhide, Z.; Yuling, T. Sediment in Rivers-Origin and Challenges. Stockh. Water Front. 2010, 4, 8–10. [Google Scholar]
  4. Zdruli, P.; Lal, R.; Cherlet, M.; Kapur, S. New world atlas of desertification and issues of carbon sequestration, organic carbon stocks, nutrient depletion and implications for food security. In Carbon Management, Technologies, and Trends in Mediterranean Ecosystems; Springer: Berlin/Heidelberg, Germany, 2017; pp. 13–25. [Google Scholar]
  5. Saha, D.; Sahu, S.; Chandra, P.C. Arsenic-safe alternate aquifers and their hydraulic characteristics in contaminated areas of Middle Ganga Plain, Eastern India. Environ. Monit. Assess. 2011, 175, 331–348. [Google Scholar] [PubMed]
  6. Lal, R.; Smith, P.; Jungkunst, H.F.; Mitsch, W.J.; Lehmann, J.; Nair, P.R.; McBratney, A.B.; Sá, J.C.d.M.; Schneider, J.; Zinn, Y.L.; et al. The carbon sequestration potential of terrestrial ecosystems. J. Soil Water Conserv. 2018, 73, 145A–152A. [Google Scholar] [CrossRef]
  7. O’Laughlin, J.; McElligott, K. Biochar for Environmental Management: Science and Technology; Lehmann, J., Joseph, S.M., Eds.; Earthscan: London, UK, 2009; 448p. [Google Scholar]
  8. Shackley, S.; Carter, S.; Knowles, T.; Middelink, E.; Haefele, S.; Sohi, S.; Cross, A.; Haszeldine, S. Sustainable gasification–biochar systems? A case-study of rice-husk gasification in Cambodia, Part I: Context, chemical properties, environmental and health and safety issues. Energy Policy 2012, 42, 49–58. [Google Scholar]
  9. Sohi, S.P.; Krull, E.; Lopez-Capel, E.; Bol, R. A review of biochar and its use and function in soil. Adv. Agron. 2010, 105, 47–82. [Google Scholar]
  10. Liu, Y.; Yang, M.; Wu, Y.; Wang, H.; Chen, Y.; Wu, W. Reducing CH4 and CO2 emissions from waterlogged paddy soil with biochar. J. Soils Sediments 2011, 11, 930–939. [Google Scholar]
  11. Wang, J.; Wang, S. Preparation, modification and environmental application of biochar: A review. J. Clean. Prod. 2019, 227, 1002–1022. [Google Scholar]
  12. Waqas, M.; Asam, Z.; Rehan, M.; Anwar, M.N.; Khattak, R.A.; Ismail, I.M.I.; Tabatabaei, M.; Nizami, A.S. Development of biomass-derived biochar for agronomic and environmental remediation applications. Biomass Convers. Biorefin. 2021, 11, 339–361. [Google Scholar]
  13. Saha, R.; Galagedara, L.; Thomas, R.; Nadeem, M.; Hawboldt, K. Investigating the influence of biochar amendment on the physicochemical properties of podzolic soil. Agriculture 2020, 10, 471. [Google Scholar] [CrossRef]
  14. Omondi, M.O.; Xia, X.; Nahayo, A.; Liu, X.; Korai, P.K.; Pan, G. Quantification of biochar effects on soil hydrological properties using meta-analysis of literature data. Geoderma 2016, 274, 28–34. [Google Scholar] [CrossRef]
  15. Herath, H.; Camps-Arbestain, M.; Hedley, M. Effect of biochar on soil physical properties in two contrasting soils: An Alfisol and an Andisol. Geoderma 2013, 209, 188–197. [Google Scholar] [CrossRef]
  16. Githinji, L. Effect of biochar application rate on soil physical and hydraulic properties of a sandy loam. Arch. Agron. Soil Sci. 2014, 60, 457–470. [Google Scholar] [CrossRef]
  17. Edeh, I.G.; Mašek, O.; Buss, W. A meta-analysis on biochar’s effects on soil water properties–New insights and future research challenges. Sci. Total Environ. 2020, 714, 136857. [Google Scholar] [PubMed]
  18. Yang, F.; Xu, Z.; Huang, Y.; Tsang, D.C.; Ok, Y.S.; Zhao, L.; Qiu, H.; Xu, X.; Cao, X. Stabilization of dissolvable biochar by soil minerals: Release reduction and organo-mineral complexes formation. J. Hazard. Mater. 2021, 412, 125213. [Google Scholar] [CrossRef]
  19. Wang, D.; Fonte, S.J.; Parikh, S.J.; Six, J.; Scow, K.M. Biochar additions can enhance soil structure and the physical stabilization of C in aggregates. Geoderma 2017, 303, 110–117. [Google Scholar] [CrossRef]
  20. Jien, S.H.; Wang, C.S. Effects of biochar on soil properties and erosion potential in a highly weathered soil. Catena 2013, 110, 225–233. [Google Scholar] [CrossRef]
  21. Sun, F.; Lu, S. Biochars improve aggregate stability, water retention, and pore-space properties of clayey soil. J. Plant Nutr. Soil Sci. 2014, 177, 26–33. [Google Scholar] [CrossRef]
  22. Castellini, M.; Giglio, L.; Niedda, M.; Palumbo, A.; Ventrella, D. Impact of biochar addition on the physical and hydraulic properties of a clay soil. Soil Tillage Res. 2015, 154, 1–13. [Google Scholar] [CrossRef]
  23. Basso, A.S.; Miguez, F.E.; Laird, D.A.; Horton, R.; Westgate, M. Assessing potential of biochar for increasing water-holding capacity of sandy soils. Gcb Bioenergy 2013, 5, 132–143. [Google Scholar] [CrossRef]
  24. Liu, Z.; Chen, X.; Jing, Y.; Li, Q.; Zhang, J.; Huang, Q. Effects of biochar amendment on rapeseed and sweet potato yields and water stable aggregate in upland red soil. Catena 2014, 123, 45–51. [Google Scholar] [CrossRef]
  25. Song, J.; Wang, Y.; Zhang, S.; Song, Y.; Xue, S.; Liu, L.; Lvy, X.; Wang, X.; Yang, G. Coupling biochar with anaerobic digestion in a circular economy perspective: A promising way to promote sustainable energy, environment and agriculture development in China. Renew. Sustain. Energy Rev. 2021, 144, 110973. [Google Scholar] [CrossRef]
  26. Navarro, S.; León, M.; Roca-Pérez, L.; Boluda, R.; García-Ferriz, L.; Pérez-Bermúdez, P.; Gavidia, I. Characterisation of Bobal and Crujidera grape cultivars, in comparison with Tempranillo and Cabernet Sauvignon: Evolution of leaf macronutrients and berry composition during grape ripening. Food Chem. 2008, 108, 182–190. [Google Scholar] [CrossRef]
  27. Calcan, S.I.; Pârvulescu, O.C.; Ion, V.A.; Răducanu, C.E.; Bădulescu, L.; Madjar, R.; Dobre, T.; Egri, D.; Moț, A.; Iliescu, L.M.; et al. Effects of biochar on soil properties and tomato growth. Agronomy 2022, 12, 1824. [Google Scholar] [CrossRef]
  28. Yuan, P.; Wang, J.; Pan, Y.; Shen, B.; Wu, C. Review of biochar for the management of contaminated soil: Preparation, application and prospect. Sci. Total Environ. 2019, 659, 473–490. [Google Scholar] [CrossRef]
  29. Murtaza, G.; Ahmed, Z.; Usman, M.; Tariq, W.; Ullah, Z.; Shareef, M.; Iqbal, H.; Waqas, M.; Tariq, A.; Wu, Y.; et al. Biochar induced modifications in soil properties and its impacts on crop growth and production. J. Plant Nutr. 2021, 44, 1677–1691. [Google Scholar] [CrossRef]
  30. Schmidt, H.P.; Kammann, C.; Hagemann, N.; Leifeld, J.; Bucheli, T.D.; Sánchez Monedero, M.A.; Cayuela, M.L. Biochar in agriculture–A systematic review of 26 global meta-analyses. GCB Bioenergy 2021, 13, 1708–1730. [Google Scholar] [CrossRef]
  31. Calcan, S.I.; Pârvulescu, O.C.; Ion, V.A.; Răducanu, C.E.; Bădulescu, L.; Dobre, T.; Egri, D.; Moț, A.; Popa, V.; Crăciun, M.E. Valorization of vine prunings by slow pyrolysis in a fixed-bed reactor. Processes 2021, 10, 37. [Google Scholar] [CrossRef]
  32. Morgan, H.; Sohi, S.; Shackley, S. Biochar: An Emerging Carbon Abatement and Soil Management Strategy. In Oxford Research Encyclopedia of Environmental Science; Oxford University Press: Oxford, UK, 2020. [Google Scholar]
  33. Liao, W.; Zhang, X.; Shao, J.; Yang, H.; Zhang, S.; Chen, H. Simultaneous removal of cadmium and lead by biochar modified with layered double hydroxide. Fuel Process. Technol. 2022, 235, 107389. [Google Scholar] [CrossRef]
  34. Aborisade, M.A.; Oba, B.T.; Kumar, A.; Liu, J.; Chen, D.; Okimiji, O.P.; Zhao, L. Remediation of metal toxicity and alleviation of toxic metals-induced oxidative stress in Brassica chinensis L. using biochar-iron nanocomposites. In Plant and Soil; Springer: Berlin/Heidelberg, Germany, 2023; pp. 1–17. [Google Scholar]
  35. Yuan, X.; Wang, Q.; Wang, Z.; Wu, S.; Zhai, Y.; Zhang, H.; Zhou, L.; Lu, B.; Chen, K.; Wang, X. Optimization of Mixed-Based Biochar Preparation Process and Adsorption Performance of Lead and Cadmium. Sustainability 2023, 15, 11579. [Google Scholar] [CrossRef]
  36. Stokes, A.; Douglas, G.B.; Fourcaud, T.; Giadrossich, F.; Gillies, C.; Hubble, T.; Kim, J.H.; Loades, K.W.; Mao, Z.; McIvor, I.R.; et al. Ecological mitigation of hillslope instability: Ten key issues facing researchers and practitioners. Plant Soil 2014, 377, 1–23. [Google Scholar] [CrossRef]
  37. Jiang, H.; Cai, Y.; Liu, J. Engineering properties of soils reinforced by short discrete polypropylene fiber. J. Mater. Civ. Eng. 2010, 22, 1315–1322. [Google Scholar] [CrossRef]
  38. Peng, X.; Zhu, Q.; Xie, Z.; Darboux, F.; Holden, N. The impact of manure, straw and biochar amendments on aggregation and erosion in a hillslope Ultisol. Catena 2016, 138, 30–37. [Google Scholar] [CrossRef]
  39. Kusre, B.C.; Ghosh, P.; Nath, K. Prioritization of soil conservation measures using erodibility indices as criteria in Sikkim (India). J. Earth Syst. Sci. 2018, 127, 81. [Google Scholar] [CrossRef]
  40. Madari, B.E.; Maia, C.M.B.d.F.; Novotny, E.H. Context and importance of biochar research. Pesqui. Agropecuária Bras. 2012, 47, i–ii. [Google Scholar] [CrossRef]
  41. Ronsse, F.; Van Hecke, S.; Dickinson, D.; Prins, W. Production and characterization of slow pyrolysis biochar: Influence of feedstock type and pyrolysis conditions. Gcb Bioenergy 2013, 5, 104–115. [Google Scholar] [CrossRef]
  42. Carneiro, J.d.S.; Nogueira, R.M.; Martins, M.A.; Valladão, D.M.d.S.; Pires, E.M. The oven-drying method for determination of water content in Brazil nut. Biosci. J. 2018, 34, 595–602. [Google Scholar] [CrossRef]
  43. Sahoo, S.S.; Vijay, V.K.; Chandra, R.; Kumar, H. Production and characterization of biochar produced from slow pyrolysis of pigeon pea stalk and bamboo. Clean. Eng. Technol. 2021, 3, 100101. [Google Scholar] [CrossRef]
  44. Smíšek, M.; Černý, S. Active Carbon: Manufacture, Properties and Applications; Elsevier: Amsterdam, The Netherlands, 1970. [Google Scholar]
  45. SNI. Standar Karbon Aktif. 1995; No. 06–3730–1995. [Google Scholar]
  46. Gaskin, J.W.; Steiner, C.; Harris, K.; Das, K.C.; Bibens, B. Effect of low-temperature pyrolysis conditions on biochar for agricultural use. Trans. ASABE 2008, 51, 2061–2069. [Google Scholar] [CrossRef]
  47. Bouyoucos, G.J. Clay ratio as a criterion of susceptibility of soils to erosion. J. Am. Soc. Agron. 1935, 27, 738–741. [Google Scholar] [CrossRef]
  48. Gee, G.W.; Or, D. 2.4 Particle-size analysis. Methods Soil Anal. Part 4 Phys. Methods 2002, 5, 255–293. [Google Scholar]
  49. Logan, T.; Harrison, B. Physical Characteristics of Alkaline Stabilized Sewage Sludge (N-Viro Soil) and Their Effects on Soil Physical Properties; Wiley Online Library: Hoboken, NJ, USA, 1995. [Google Scholar]
  50. Halliwell, D.J.; Barlow, K.M.; Nash, D.M. A review of the effects of wastewater sodium on soil physical properties and their implications for irrigation systems. Soil Res. 2001, 39, 1259–1267. [Google Scholar] [CrossRef]
  51. Slater, C.S.; Byers, H.G. A Laboratory Study of the Field Percolation Rates of Soils; US Department of Agriculture: Washington, DC, USA, 1931.
  52. Balci, A. Soil Conservation. In IU Forestry Faculty Publication Number: 439; Istanbul University Press: Fatih, Istanbul, Turkey, 1996. [Google Scholar]
  53. Van Bavel, C. Report of the Committee on Physical Analyses 1951–1953, Soil Science Society of America. Soil Sci. Soc. Am. J. 1953, 17, 416–418. [Google Scholar] [CrossRef]
  54. Yeomans, J.C.; Bremner, J.M. A rapid and precise method for routine determination of organic carbon in soil. Commun. Soil Sci. Plant Anal. 1988, 19, 1467–1476. [Google Scholar] [CrossRef]
  55. Gomez, K.A.; Gomez, A.A. Statistical Procedures for Agricultural Research; John Wiley & Sons: Hoboken, NJ, USA, 1984. [Google Scholar]
  56. Cui, X.; Wang, J.; Wang, X.; Khan, M.B.; Lu, M.; Khan, K.Y.; Chen, G. Biochar from constructed wetland biomass waste: A review of its potential and challenges. Chemosphere 2022, 287, 132259. [Google Scholar] [CrossRef] [PubMed]
  57. Zheng, L.; Tong, C.; Gao, J.; Xiao, R. Effects of wetland plant biochars on heavy metal immobilization and enzyme activity in soils from the Yellow River estuary. Environ. Sci. Pollut. Res. 2022, 29, 40796–40811. [Google Scholar] [CrossRef]
  58. Mahdi, Z.; Hanandeh, A.E.; Yu, Q. Influence of pyrolysis conditions on surface characteristics and methylene blue adsorption of biochar derived from date seed biomass. Waste Biomass Valorization 2017, 8, 2061–2073. [Google Scholar] [CrossRef]
  59. Almutairi, A.A.; Ahmad, M.; Rafique, M.I.; Al-Wabel, M.I. Variations in composition and stability of biochars derived from different feedstock types at varying pyrolysis temperature. J. Saudi Soc. Agric. Sci. 2022, 22, 25–34. [Google Scholar] [CrossRef]
  60. Noor, N.M.; Shariff, A.; Abdullah, N.; Aziz, N.S.M. Temperature effect on biochar properties from slow pyrolysis of coconut flesh waste. Malays. J. Fundam. Appl. Sci. 2019, 15, 153–158. [Google Scholar] [CrossRef]
  61. Xu, D.; Li, Z.; Wang, P.; Bai, W.; Wang, H. Aquatic plant-derived biochars produced in different pyrolytic conditions: Spectroscopic studies and adsorption behavior of diclofenac sodium in water media. Sustain. Chem. Pharm. 2020, 17, 100275. [Google Scholar] [CrossRef]
  62. Mansoor, S.; Kour, N.; Manhas, S.; Zahid, S.; Wani, O.A.; Sharma, V.; Wijaya, L.; Alyemeni, M.N.; Alsahli, A.A.; El-Serehy, H.A.; et al. Biochar as a tool for effective management of drought and heavy metal toxicity. Chemosphere 2021, 271, 129458. [Google Scholar] [CrossRef] [PubMed]
  63. Hmid, A.; Mondelli, D.; Fiore, S.; Fanizzi, F.P.; Al Chami, Z.; Dumontet, S. Production and characterization of biochar from three-phase olive mill waste through slow pyrolysis. Biomass Bioenergy 2014, 71, 330–339. [Google Scholar] [CrossRef]
  64. Wani, O.A.; Kumar, S.S.; Hussain, N.; Wani, A.I.A.; Babu, S.; Alam, P.; Rashid, M.; Popescu, S.M.; Mansoor, S. Multi-scale processes influencing global carbon storage and land-carbon-climate nexus: A critical review. Pedosphere 2022, 33, 250–267. [Google Scholar] [CrossRef]
  65. Nguyen, L.X.; Do, P.T.M.; Nguyen, C.H.; Kose, R.; Okayama, T.; Pham, T.N.; Miyanishi, T. Properties of Biochars prepared from local biomass in the Mekong Delta, Vietnam. BioResources 2018, 13, 7325–7344. [Google Scholar] [CrossRef]
  66. Rahman, R.; Sofi, J.A.; Kirmani, N.; Dar, I.H.; Chesti, M.; Bangroo, S.A.; Mir, S.; Wani, O.A. Impact of biochar and pyrolytic temperature on nutrient content of different feed stocks. J. Indian Soc. Soil Sci. 2021, 69, 463–467. [Google Scholar] [CrossRef]
  67. Kumar, S.S.; Mir, S.A.; Wani, O.A.; Babu, S.; Yeasin, M.; Bhat, M.A.; Hussain, N.; Wani, A.I.A.; Kumar, R.; Yadav, D.; et al. Land-use systems regulate carbon geochemistry in the temperate Himalayas, India. J. Environ. Manag. 2022, 320, 115811. [Google Scholar] [CrossRef] [PubMed]
  68. Zahed, Z.; Mufti, S.; Kumar, S.S.; Wani, O.A.; Mushtaq, F.; Rasool, R.; Babu, S.; Abidi, I.; Gaber, A.; Hossain, A. Organic and inorganic mulches combination improves the productivity, quality and profitability of rainfed potato in the temperate himalayan region. Gesunde Pflanz. 2022, 74, 1109–1122. [Google Scholar] [CrossRef]
  69. Chen, T.; Zhang, Y.X.; Wang, H.T.; Lu, W.J.; Zhou, Z.Y.; Zhang, Y.C.; Ren, L.L. Influence of pyrolysis temperature on characteristics and heavy metal adsorptive performance of biochar derived from municipal sewage sludge. Bioresour. Technol. 2014, 164, 47–54. [Google Scholar] [CrossRef] [PubMed]
  70. Zhao, S.-X.; Ta, N.; Wang, X.-D. Effect of temperature on the structural and physicochemical properties of biochar with apple tree branches as feedstock material. Energies 2017, 10, 1293. [Google Scholar] [CrossRef]
  71. Bashir, S.S.; Hussain, A.; Hussain, S.J.; Wani, O.A.; Nabi, S.Z.; Dar, N.A.; Baloch, F.S.; Mansoor, S. Plant drought stress tolerance: Understanding its physiological, biochemical and molecular mechanisms. Biotechnol. Biotechnol. Equip. 2021, 35, 1912–1925. [Google Scholar] [CrossRef]
  72. Mansoor, S.; Wani, O.A.; Lone, J.K.; Manhas, S.; Kour, N.; Alam, P.; Ahmad, A.; Ahmad, P. Reactive Oxygen Species in plants: From source to sink. Antioxidants 2022, 11, 225. [Google Scholar] [CrossRef] [PubMed]
  73. Kim, W.-K.; Shim, T.; Kim, Y.-S.; Hyun, S.; Ryu, C.; Park, Y.-K.; Jung, J. Characterization of cadmium removal from aqueous solution by biochar produced from a giant Miscanthus at different pyrolytic temperatures. Bioresour. Technol. 2013, 138, 266–270. [Google Scholar] [CrossRef] [PubMed]
  74. Han, J.; Zhang, A.; Kang, Y.; Han, J.; Yang, B.; Hussain, Q.; Khan, M.A. Biochar promotes soil organic carbon sequestration and reduces net global warming potential in apple orchard: A two-year study in the Loess Plateau of China. Sci. Total Environ. 2022, 803, 150035. [Google Scholar] [CrossRef] [PubMed]
  75. Lataf, A.; Jozefczak, M.; Vandecasteele, B.; Viaene, J.; Schreurs, S.; Carleer, R.; Vandamme, D. The effect of pyrolysis temperature and feedstock on biochar agronomic properties. J. Anal. Appl. Pyrolysis 2022, 168, 105728. [Google Scholar] [CrossRef]
  76. Tran, H.N.; You, S.-J.; Chao, H.-P. Effect of pyrolysis temperatures and times on the adsorption of cadmium onto orange peel derived biochar. Waste Manag. Res. 2016, 34, 129–138. [Google Scholar] [CrossRef]
  77. Mollinedo, J.; Schumacher, T.E.; Chintala, R. Influence of feedstocks and pyrolysis on biochar’s capacity to modify soil water retention characteristics. J. Anal. Appl. Pyrolysis 2015, 114, 100–108. [Google Scholar] [CrossRef]
  78. Ippolito, J.A.; Cui, L.; Kammann, C.; Wrage-Mönnig, N.; Estavillo, J.M.; Fuertes-Mendizabal, T.; Cayuela, M.L.; Sigua, G.; Novak, J.; Spokas, K.; et al. Feedstock choice, pyrolysis temperature and type influence biochar characteristics: A comprehensive meta-data analysis review. Biochar 2020, 2, 421–438. [Google Scholar] [CrossRef]
  79. Aller, M.F. Biochar properties: Transport, fate, and impact. Crit. Rev. Environ. Sci. Technol. 2016, 46, 1183–1296. [Google Scholar] [CrossRef]
  80. Windeatt, J.H.; Ross, A.B.; Williams, P.T.; Forster, P.M.; Nahil, M.A.; Singh, S. Characteristics of biochars from crop residues: Potential for carbon sequestration and soil amendment. J. Environ. Manag. 2014, 146, 189–197. [Google Scholar] [CrossRef]
  81. Enders, A.; Hanley, K.; Whitman, T.; Joseph, S.; Lehmann, J. Characterization of biochars to evaluate recalcitrance and agronomic performance. Bioresour. Technol. 2012, 114, 644–653. [Google Scholar] [CrossRef]
  82. Viswanathan, S.P.; Njazhakunnathu, G.V.; Neelamury, S.P.; Padmakumar, B.; Ambatt, T.P. The efficiency of aquatic weed–derived biochar in enhanced removal of cationic dyes from aqueous medium. In Biomass Conversion and Biorefinery; Springer: Berlin/Heidelberg, Germany, 2022; pp. 1–16. [Google Scholar]
  83. Luo, L.; Xu, C.; Chen, Z.; Zhang, S. Properties of biomass-derived biochars: Combined effects of operating conditions and biomass types. Bioresour. Technol. 2015, 192, 83–89. [Google Scholar] [CrossRef]
  84. Li, Z.; Liu, C.; Dong, Y.; Chang, X.; Nie, X.; Liu, L.; Xiao, H.; Lu, Y.; Zeng, G. Response of soil organic carbon and nitrogen stocks to soil erosion and land use types in the Loess hilly–gully region of China. Soil Tillage Res. 2017, 166, 1–9. [Google Scholar] [CrossRef]
  85. Song, W.; Guo, M. Quality variations of poultry litter biochar generated at different pyrolysis temperatures. J. Anal. Appl. Pyrolysis 2012, 94, 138–145. [Google Scholar] [CrossRef]
  86. Mohammad, I.; Abakr, Y.; Kabir, F.; Yusuf, S.; Alshareef, I.; Chin, S. Pyrolysis of Napier grass in a fixed bed reactor: Effect of operating conditions on product yields and characteristics. BioResources 2015, 10, 6457–6478. [Google Scholar] [CrossRef]
  87. Lal, R. Soil erosion by wind and water: Problems and prospects. In Soil Erosion Research Methods; Routledge: Oxford, UK, 2017; pp. 1–10. [Google Scholar]
  88. Zahed, M.A.; Salehi, S.; Madadi, R.; Hejabi, F. Biochar as a sustainable product for remediation of petroleum contaminated soil. Curr. Res. Green Sustain. Chem. 2021, 4, 100055. [Google Scholar] [CrossRef]
  89. Baiamonte, G.; Crescimanno, G.; Parrino, F.; De Pasquale, C. Effect of biochar on the physical and structural properties of a sandy soil. Catena 2019, 175, 294–303. [Google Scholar] [CrossRef]
  90. Itami, K.; Kyuma, K. Dispersion behavior of soils from reclaimed lands with poor soil physical properties and their characteristics with special reference to clay mineralogy. Soil Sci. Plant Nutr. 1995, 41, 45–54. [Google Scholar] [CrossRef]
  91. Hammam, A.A.; Mohamed, E.S.; El-Namas, A.E.; Abd-Elmabod, S.K.; Badr Eldin, R.M. Impacted Application of Water-Hyacinth-Derived Biochar and Organic Manures on Soil Properties and Barley Growth. Sustainability 2022, 14, 13096. [Google Scholar] [CrossRef]
  92. Adekiya, A.O.; Agbede, T.M.; Olayanju, A.; Ejue, W.S.; Adekanye, T.A.; Adenusi, T.T.; Ayeni, J.F. Effect of biochar on soil properties, soil loss, and cocoyam yield on a tropical sandy loam Alfisol. Sci. World J. 2020, 2020, 9391630. [Google Scholar] [CrossRef]
  93. Adekiya, A.O.; Ojeniyi, S.O.; Owonifari, O.E. Effect of cow dung on soil physical properties, growth and yield of maize (Zea mays) in a tropical Alfisol. Sci. Agric. 2016, 15, 374–379. [Google Scholar]
  94. Amoah-Antwi, C.; Kwiatkowska-Malina, J.; Thornton, S.F.; Fenton, O.; Malina, G.; Szara, E. Restoration of soil quality using biochar and brown coal waste: A review. Sci. Total Environ. 2020, 722, 137852. [Google Scholar] [CrossRef] [PubMed]
  95. Kumar, A.; Bhattacharya, T.; Mukherjee, S.; Sarkar, B. A perspective on biochar for repairing damages in the soil–plant system caused by climate change-driven extreme weather events. Biochar 2022, 4, 22. [Google Scholar] [CrossRef]
  96. Obi, M. Soil Physics: A Compendium of Lectures; Atlanto, Publishers: Nsukka, Nigeria, 2000; 148p. [Google Scholar]
  97. Glaser, B.; Lehmann, J.; Zech, W. Ameliorating physical and chemical properties of highly weathered soils in the tropics with charcoal—A review. Biol. Fertil. Soils 2002, 35, 219–230. [Google Scholar] [CrossRef]
  98. Nwite, J.; Orji, J.; Okolo, C. Effect of different land use systems on soil carbon storage and structural indices in Abakaliki, Nigeria. Indian J. Ecol. 2018, 45, 522–527. [Google Scholar]
  99. El-Azeim, A.; Salah, Z.M.; Hammam, A.A. Assessment of water hyacinth biochar as a soil amendment for sandy soils. J. Soil Sci. Agric. Eng. 2021, 12, 431–444. [Google Scholar] [CrossRef]
  100. Kumari, K.; Swain, A.A.; Kumar, M.; Bauddh, K. Utilization of Eichhornia crassipes biomass for production of biochar and its feasibility in agroecosystems: A review. Environ. Sustain. 2021, 4, 285–297. [Google Scholar] [CrossRef]
  101. Singh, P.; Sharma, S.; Dhanorkar, M. Aquatic plant biomass-derived porous carbon: Biomaterials for sustainable waste management and climate change mitigation. Int. J. Environ. Sci. Technol. 2022, 11, 1–16. [Google Scholar] [CrossRef]
  102. Soinne, H.; Hovi, J.; Tammeorg, P.; Turtola, E. Effect of biochar on phosphorus sorption and clay soil aggregate stability. Geoderma 2014, 219, 162–167. [Google Scholar] [CrossRef]
  103. Amoakwah, E.; Frimpong, K.A.; Okae-Anti, D.; Arthur, E. Soil water retention, air flow and pore structure characteristics after corn cob biochar application to a tropical sandy loam. Geoderma 2017, 307, 189–197. [Google Scholar] [CrossRef]
  104. Ghorbani, M.; Neugschwandtner, R.W.; Konvalina, P.; Asadi, H.; Kopecký, M.; Amirahmadi, E. Comparative effects of biochar and compost applications on water holding capacity and crop yield of rice under evaporation stress: A two-years field study. Paddy Water Environ. 2023, 21, 47–58. [Google Scholar] [CrossRef]
  105. Schneider, E. The Effects of Biochar Age and Concentration on Soil Retention of Phosphorus and Infiltration Rate. Bachelor’s Thesis, California Polytechnic State University, San Luis Obispo, CA, USA, 2012. [Google Scholar]
  106. Doan, T.T.; Henry-des-Tureaux, T.; Rumpel, C.; Janeau, J.L.; Jouquet, P. Impact of compost, vermicompost and biochar on soil fertility, maize yield and soil erosion in Northern Vietnam: A three year mesocosm experiment. Sci. Total Environ. 2015, 514, 147–154. [Google Scholar] [CrossRef] [PubMed]
  107. Major, J.; Rondon, M.; Molina, D.; Riha, S.J.; Lehmann, J. Nutrient leaching in a Colombian savanna Oxisol amended with biochar. J. Environ. Qual. 2012, 41, 1076–1086. [Google Scholar] [CrossRef]
  108. Cheng, K.; Xu, X.; Cui, L.; Li, Y.; Zheng, J.; Wu, W.; Sun, J.; Pan, G. The role of soils in regulation of freshwater and coastal water quality. Philos. Trans. R. Soc. B 2021, 376, 20200176. [Google Scholar] [CrossRef] [PubMed]
  109. Ahmad, R.; Gao, J.; Gao, Z.; Khan, A.; Ali, I.; Fahad, S. Influence of biochar on soil nutrients and associated Rhizobacterial communities of mountainous apple trees in northern loess plateau China. Microorganisms 2022, 10, 2078. [Google Scholar] [CrossRef]
  110. Li, Y.; Zhang, F.; Yang, M.; Zhang, J.; Xie, Y. Impacts of biochar application rates and particle sizes on runoff and soil loss in small cultivated loess plots under simulated rainfall. Sci. Total Environ. 2019, 649, 1403–1413. [Google Scholar] [CrossRef]
  111. Sadeghi, S.H.; Hazbavi, Z.; Harchegani, M.K. Controllability of runoff and soil loss from small plots treated by vinasse-produced biochar. Sci. Total Environ. 2016, 541, 483–490. [Google Scholar] [CrossRef] [PubMed]
  112. Hseu, Z.Y.; Jien, S.H.; Chien, W.H.; Liou, R.C. Impacts of biochar on physical properties and erosion potential of a mudstone slopeland soil. Sci. World J. 2014, 2014, 602197. [Google Scholar] [CrossRef]
  113. Thomaz, E.; Luiz, J. Soil loss, soil degradation and rehabilitation in a degraded land area in Guarapuava (Brazil). Land Degrad. Dev. 2012, 23, 72–81. [Google Scholar] [CrossRef]
  114. Nugraha, S.S.; Sartohadi, J.; Nurudin, M. Field-Based Biochar, Pumice, and Mycorrhizae Application on Dryland Agriculture in Reducing Soil Erosion. Appl. Environ. Soil Sci. 2022, 2022, 1775330. [Google Scholar] [CrossRef]
  115. Joseph, S.D.; Camps-Arbestain, M.; Lin, Y.; Munroe, P.; Chia, C.H.; Hook, J.; van Zwieten, L.; Kimber, S.; Cowie, A.; Singh, B.P.; et al. An investigation into the reactions of biochar in soil. Aust. J. Soil Res. 2010, 48, 501–515. [Google Scholar] [CrossRef]
  116. Brodowski, S.; John, B.; Flessa, H.; Amelung, W. Aggregate-occluded black carbon in soil. Eur. J. Soil Sci. 2006, 57, 539–546. [Google Scholar] [CrossRef]
  117. Bashagaluke, J.B.; Logah, V.; Opoku, A.; Sarkodie-Addo, J.; Quansah, C. Soil nutrient loss through erosion: Impact of different cropping systems and soil amendments in Ghana. PLoS ONE 2018, 13, e0208250. [Google Scholar] [CrossRef] [PubMed]
  118. Zougmoré, R.; Zida, Z.; Kambou, N. Role of nutrient amendments in the success of half-moon soil and water conservation practice in semiarid Burkina Faso. Soil Tillage Res. 2003, 71, 143–149. [Google Scholar] [CrossRef]
  119. Olaniya, M.; Bora, P.K.; Das, S.; Chanu, P.H. Soil erodibility indices under different land uses in Ri-Bhoi district of Meghalaya (India). Sci. Rep. 2020, 10, 14986. [Google Scholar] [CrossRef]
  120. Ruxton, B.P. Measures of the degree of chemical weathering of rocks. J. Geol. 1968, 76, 518–527. [Google Scholar] [CrossRef]
  121. Yang, C.D.; Lu, S.G. Effects of five different biochars on aggregation, water retention and mechanical properties of paddy soil: A field experiment of three-season crops. Soil Tillage Res. 2021, 205, 104798. [Google Scholar] [CrossRef]
  122. Joseph, U.E.; Toluwase, A.O.; Kehinde, E.O.; Omasan, E.E.; Tolulope, A.Y.; George, O.O.; Zhao, C.; Hongyan, W. Effect of biochar on soil structure and storage of soil organic carbon and nitrogen in the aggregate fractions of an Albic soil. Arch. Agron. Soil Sci. 2020, 66, 1–12. [Google Scholar] [CrossRef]
  123. Six, J.; Bossuyt, H.; Degryze, S.; Denef, K. A history of research on the link between (micro) aggregates, soil biota, and soil organic matter dynamics. Soil Tillage Res. 2004, 79, 7–31. [Google Scholar] [CrossRef]
  124. Rizehbandi, E.; Khademalrasoul, A.; Zahedkolaei, M.T. Effects of recombinant synthetic organic and mineral mulches on physicomechanical properties of erodible soils using wind tunnel. Aeolian Res. 2021, 49, 100659. [Google Scholar] [CrossRef]
  125. Sheng, M.H.; Ai, X.Y.; Huang, B.C.; Zhu, M.K.; Liu, Z.Y.; Ai, Y.W. Effects of biochar additions on the mechanical stability of soil aggregates and their role in the dynamic renewal of aggregates in slope ecological restoration. Sci. Total Environ. 2023, 898, 165478. [Google Scholar] [CrossRef]
  126. Hua, L.; Wu, C.; Zhang, H.; Cao, L.; Wei, T.; Guo, J. Biochar-induced changes in soil microbial affect species of antimony in contaminated soils. Chemosphere 2021, 263, 127795. [Google Scholar] [CrossRef]
  127. Lei, O.; Zhang, R. Effects of biochars derived from different feedstocks and pyrolysis temperatures on soil physical and hydraulic properties. J. Soils Sediments 2013, 13, 1561–1572. [Google Scholar] [CrossRef]
  128. Lin, Y.; Munroe, P.; Joseph, S.; Henderson, R.; Ziolkowski, A. Water extractable organic carbon in untreated and chemical treated biochars. Chemosphere 2012, 87, 151–157. [Google Scholar] [CrossRef]
  129. Jindo, K.; Mizumoto, H.; Sawada, Y.; Sanchez-Monedero, M.A.; Sonoki, T. Physical and chemical characterization of biochars derived from different agricultural residues. Biogeosciences 2014, 11, 6613–6621. [Google Scholar] [CrossRef]
  130. Yadav, V.; Karak, T.; Singh, S.; Singh, A.K.; Khare, P. Benefits of biochar over other organic amendments: Responses for plant productivity (Pelargonium graveolens L.) and nitrogen and phosphorus losses. Ind. Crops Prod. 2019, 131, 96–105. [Google Scholar] [CrossRef]
Figure 1. Map showing the area where the study was carried out that lies between 33°54′0″ to 34°22′0″ N and 73°59′0″ to 74°41′0″ E.
Land 12 02111 g001
Figure 2. SEM images of biochar produced at distinct temperatures ARB (Apple residue biochar), DWB (Aquatic weed biochar).
Land 12 02111 g002
Figure 3. Effect of amendments on soil erodibility (a), magnified view of soil slice and soil-biochar binding (b,c).
Land 12 02111 g003
Figure 4. A bar plot of DR, ER, and clay ratio and a scatter diagram of the relation between soil erodibility and TOC are used (A1 = NB, A2 = AB400, A3 = AB600, A4 = RAC, A5 = DB400, A6 = DW600, A7 = RDW); Different letters (a–d) indicate the significant differences according to Tukey’s HSD test (p ≤ 0.05).
Land 12 02111 g004
Table 1. Influence of feedstock type and pyrolysis temperature on proximate analysis.
Pyrolysis TemperatureProximate AnalysisApple BiocharDal Weed Biochar
400 °CMC2.00 ± 0.10 d4.14 ± 0.36 d
AC7.75 ± 0.45 c39.64 ± 1.87 b
VM32.02 ± 1.61 b21.64 ± 1.86 c
FC60.73 ± 2.73 a39.47 ± 3.06 b
YC36.80 ± 2.36 b47.34 ± 1.73 a
600 °CMC2.77 ± 0.16 d4.44 ± 0.46 d
AC9.64 ± 0.56 c42.74 ± 2.25 a
VM15.33 ± 1.03 b14.50 ± 2.00 c
FC74.58 ± 3.76 a43.44 ± 2.31 a
YC17.37 ± 1.06 b37.00 ± 2.00 b
MC: Moisture content (%); AC: Ash content (%); VM: Volatile matter (%); FC: Fixed carbon (%); YC: Yield (%); Different letters (a–d) indicate the significant differences according to Tukey’s HSD test (p ≤ 0.05).
Table 2. Effect of amendment, rate, and fertilizer levels on erodibility indices and soil aggregate stability.
FactorErodibility Indices and Soil Aggregate Stability
AmendmentDRCMRPRERCRMWDTOC
NB0.37 ± 0.02 a0.68 ± 0.03 a24.49 ± 2.03 b0.55 ± 0.03 ab4.26 ± 0.91 a1.25 ± 0.01 c12.30 ± 0 d
AB4000.35 ± 0.01 a0.67 ± 0.02 a23.51 ± 1.04 a0.53 ± 0.02 a4.12 ± 0.81 a1.45 ± 0.01 a28.83 ± 1.45 b
AB6000.51 ± 0.03 b0.68 ± 0.03 a33.75 ± 3.03 d0.75 ± 0.03 d4.01 ± 0.62 a1.46 ± 0.01 a34.74 ± 1.5 a
RAC0.44 ± 0.02 a0.68 ± 0.08 a29.12 ± 0.97 b0.65 ± 0.07 ab4.40 ± 0.43 a1.32 ± 0.02 b25.94 ± 1.47 b
DB4000.51 ± 0.03 a0.69 ± 0.09 a33.27 ± 4.07 b0.74 ± 0.09 b4.11 ± 0.89 a1.32 ± 0.01 b25.50 ± 1.48 bc
DW6000.47 ± 0.04 a0.67 ± 0.04 a31.57 ± 3.03 b0.71 ± 0.05 ab4.32 ± 0.95 a1.31 ± 0.01 b29.69 ± 1.49 ab
RDW0.91 ± 0.01 c0.70 ± 0.01 a58.50 ± 1.03 c1.30 ± 0.06 c5.22 ± 0.79 a0.86 ± 0.02 d20.05 ± 1.47 c
LSD (0.05)1.890.340.442.101.981.891.89
SEm±0.240.030.050.890.850.240.24
Application rate
H0.41 ± 0.01 a0.69 ± 0.09 a26.74 ± 2.97 a0.60 ± 0.03 a4.12 ± 0.96 a1.01 ± 0.33 b19.73 ± 0.85 c
M0.48 ± 0.03 a0.68 ± 0.04 a31.77 ± 4.04 a0.71 ± 0.07 a4.88 ± 0.75 a1.26 ± 0.37 ab24.36 ± 1.05 b
L0.61 ± 0.02 b0.78 ± 0.07 a35.20 ± 3.02 a0.79 ± 0.09 b5.10 ± 0.66 a1.19 ± 0.33 a31.80 ± 1.42 a
LSD (0.05)1.890.340.442.101.981.771.89
SEm±0.240.030.050.890.850.180.24
Fertilizer
N0.49 ± 0.04 a0.68 ± 0.02 a32.43 ± 6.03 a0.73 ± 0.06 a4.34 ± 0.65 a1.29 ± 0.03 a24.45 ± 1.1 a
F0.38 ± 0.07 a0.73 ± 0.03 a23.43 ± 3.04 a0.53 ± 0.09 a4.50 ± 0.33 a1.27 ± 0.03 a26.14 ± 1.13 a
LSD (0.05)1.890.340.442.101.981.771.89
SEm±0.240.030.050.890.850.180.24
DR: Dispersion ratio; Clay/Meq: Clay to moisture equivalent ratio: CMR; PR: Percolation ratio; ER: Erosion ratio; CR: Clay ratio; MWD: Mean weight diameter; TOC: Total organic carbon (g kg−1); NB: Control (no biochar); AB400: apple biochar at 400 °C; AB600: apple biochar at 600 °C; RAC: Raw apple chips; DW400: dal weed biochar at 400 °C; DW600: dal weed biochar at 600 °C; RDW: Raw dal weed; L: Low (1 tonne per hectare); M: Medium (2 tonnes per hectare); H: High (3 tonnes per hectare); N: no-fertilizer; and F: Recommended dose of fertilizer (120:60:30—N: P2O5: K2O); Different letters (a–d) indicate the significant differences according to Tukey’s HSD test (p ≤ 0.05).
Disclaimer/Publisher’s Note: The statements, opinions and data contained in all publications are solely those of the individual author(s) and contributor(s) and not of MDPI and/or the editor(s). MDPI and/or the editor(s) disclaim responsibility for any injury to people or property resulting from any ideas, methods, instructions or products referred to in the content.

