
Spatiotemporal Evolution and Influencing Factors of Soybean Production in Heilongjiang Province, China

Abstract
:1. Introduction
2. Materials
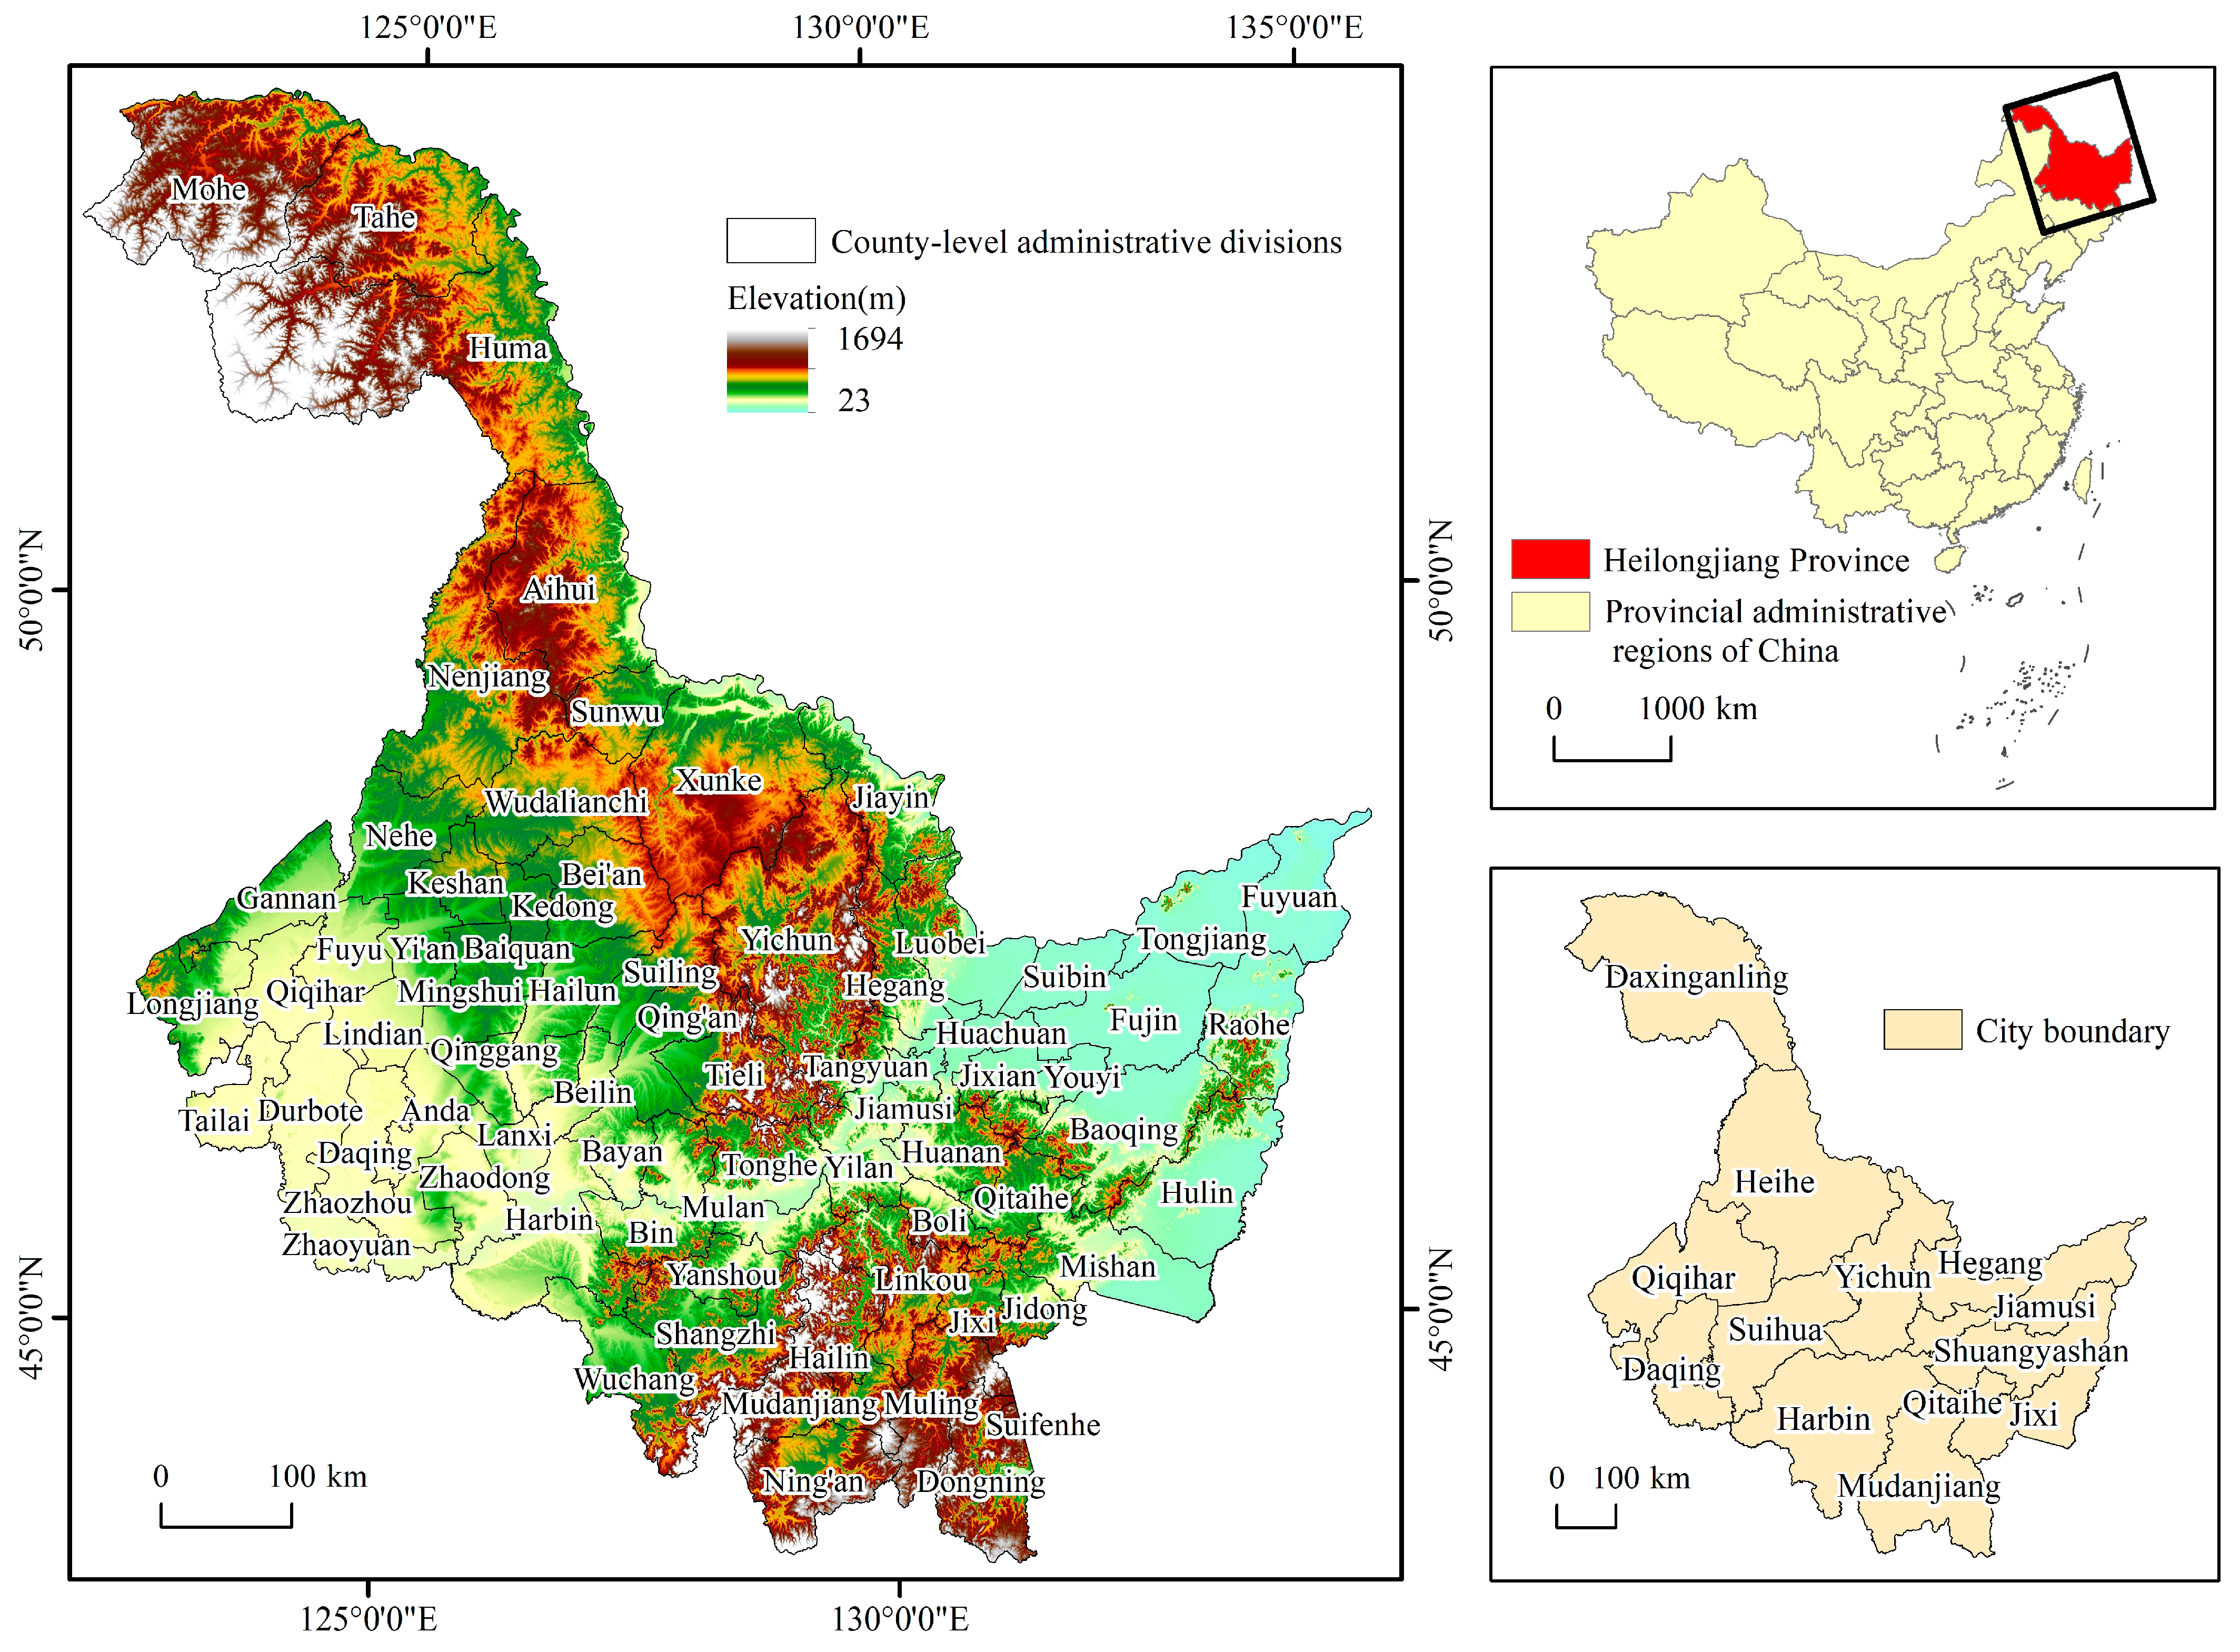
2.1. Study Area
2.2. Data and Processing
2.2.1. Administrative Division Data
2.2.2. Soybean Yield Data
2.2.3. Physical Geographic and Socioeconomic Data
3. Methods
3.1. Barycenter Analysis
3.2. Mann–Kendall Test
3.2.1. Mann–Kendall Trend Test
3.2.2. Mann–Kendall Mutation Test
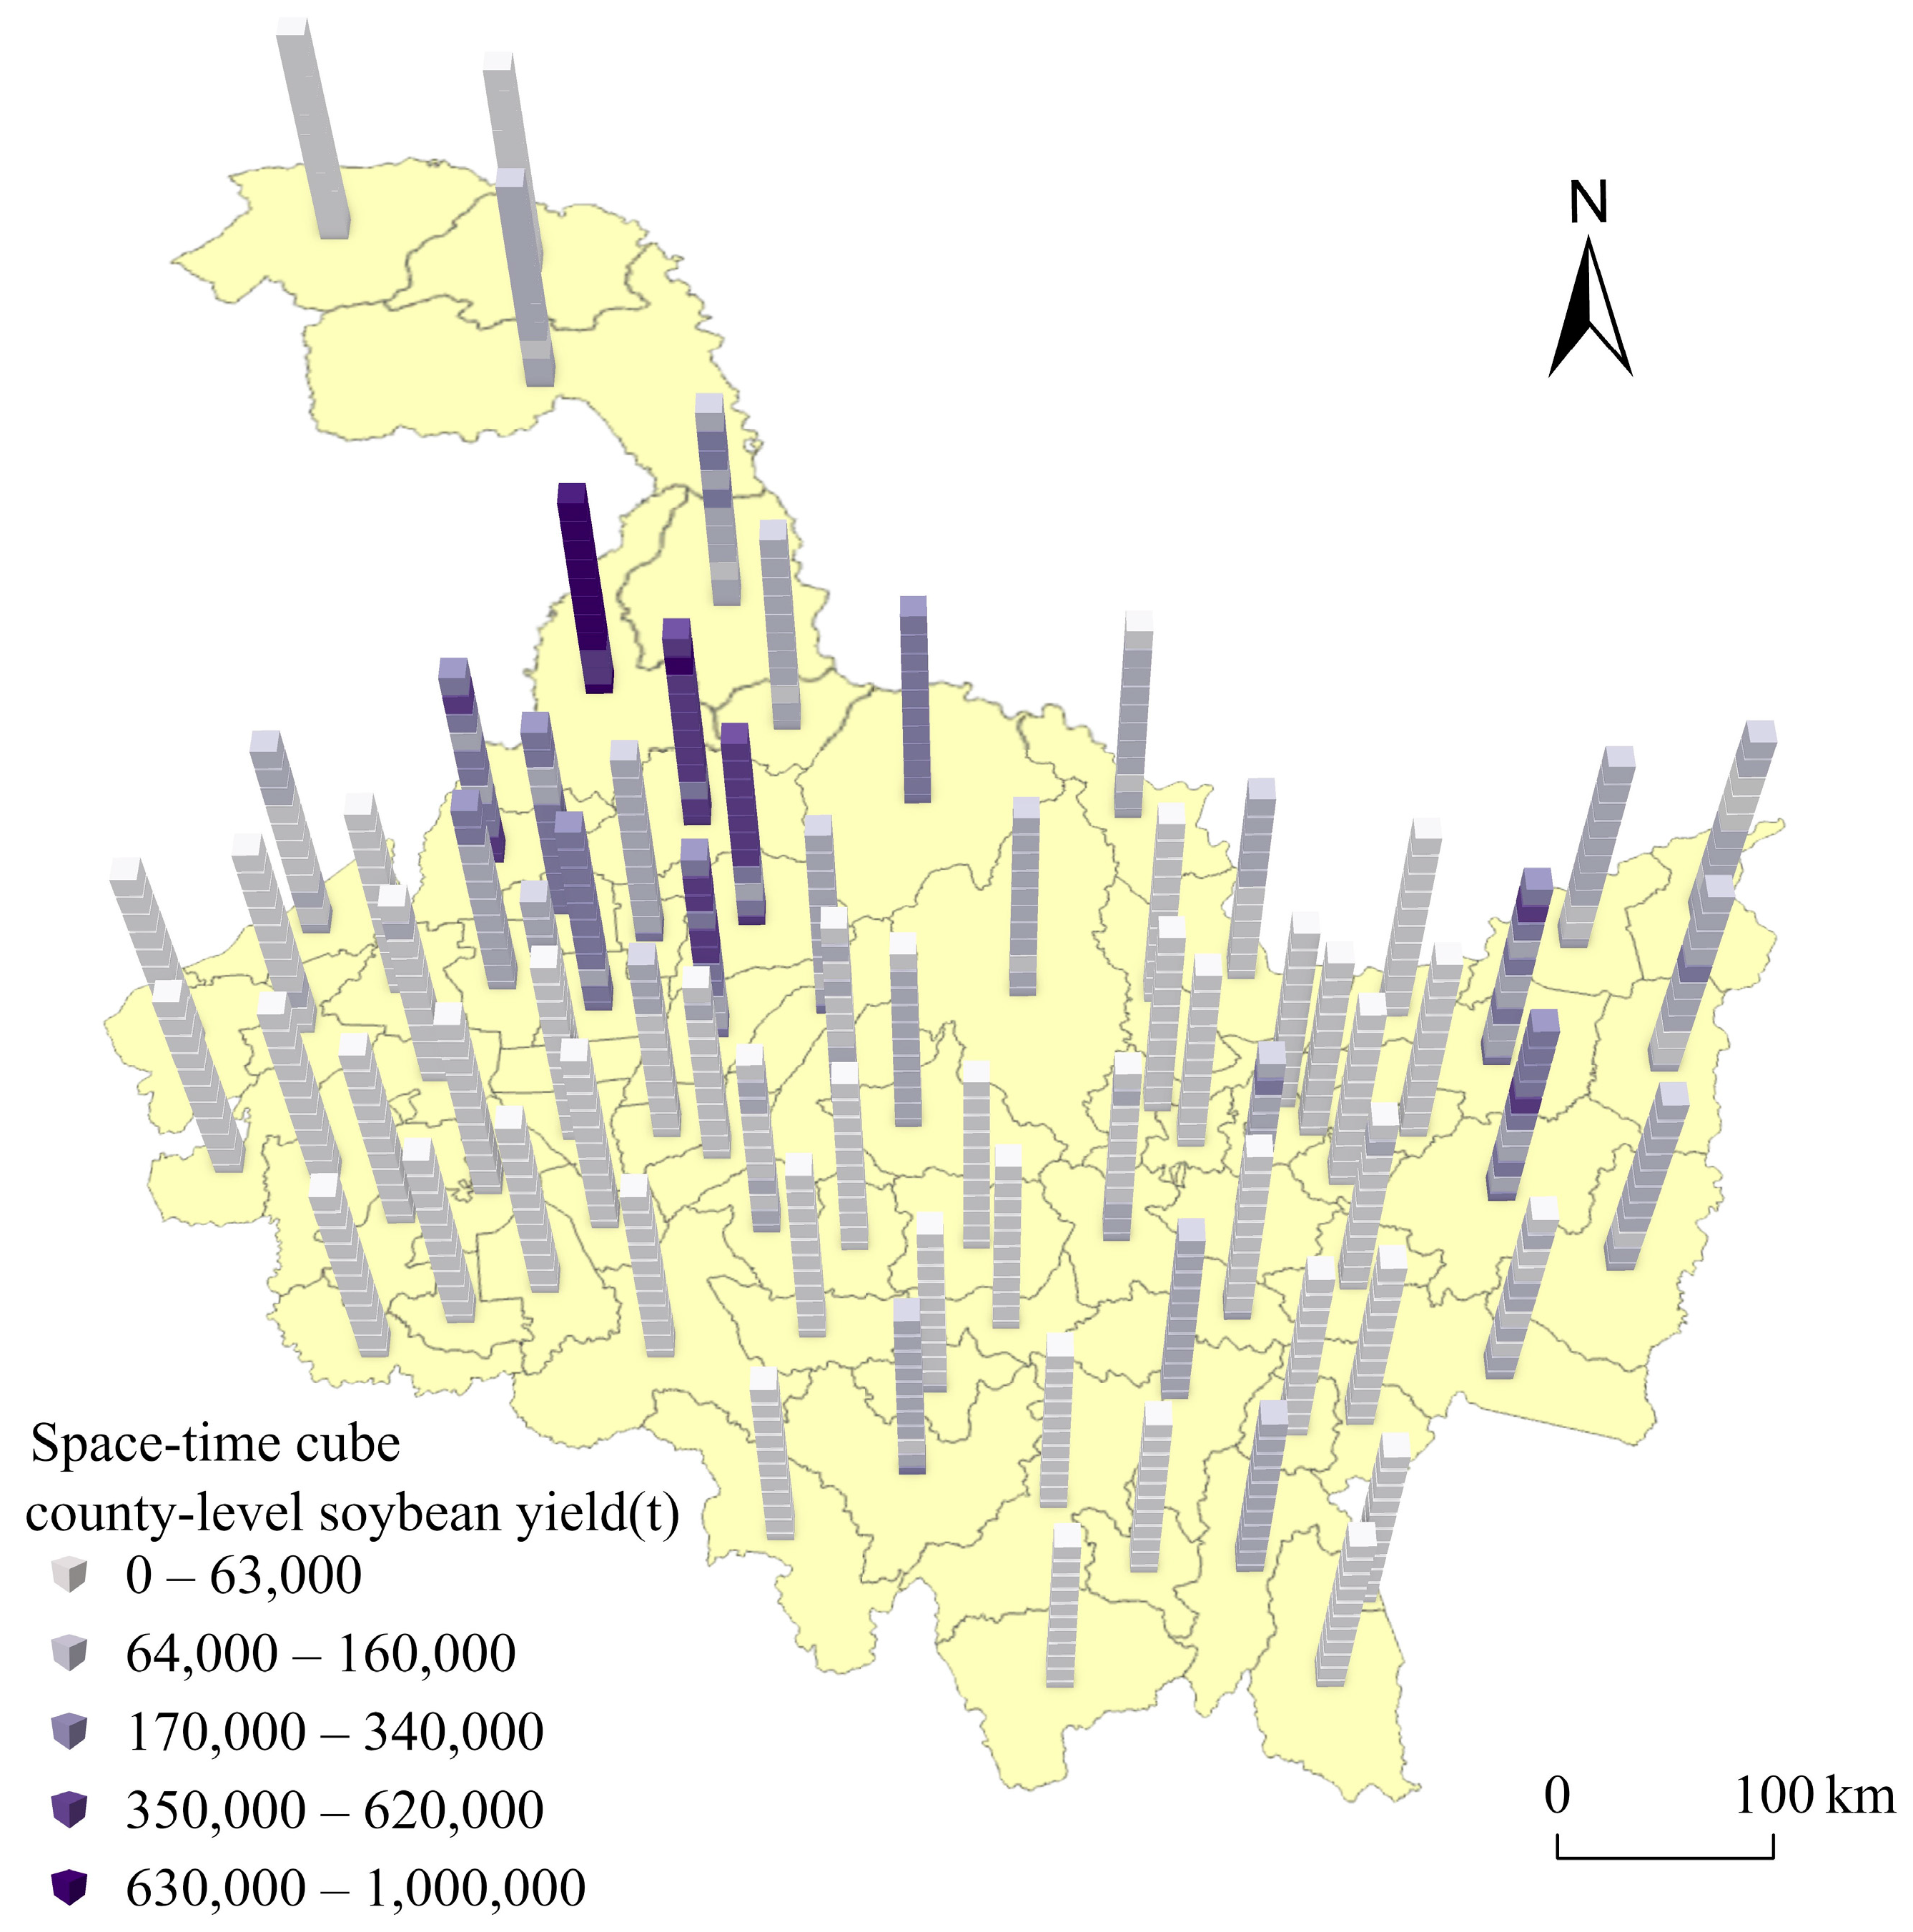
3.3. Spatiotemporal Data Mining Based on the Space–Time Cube
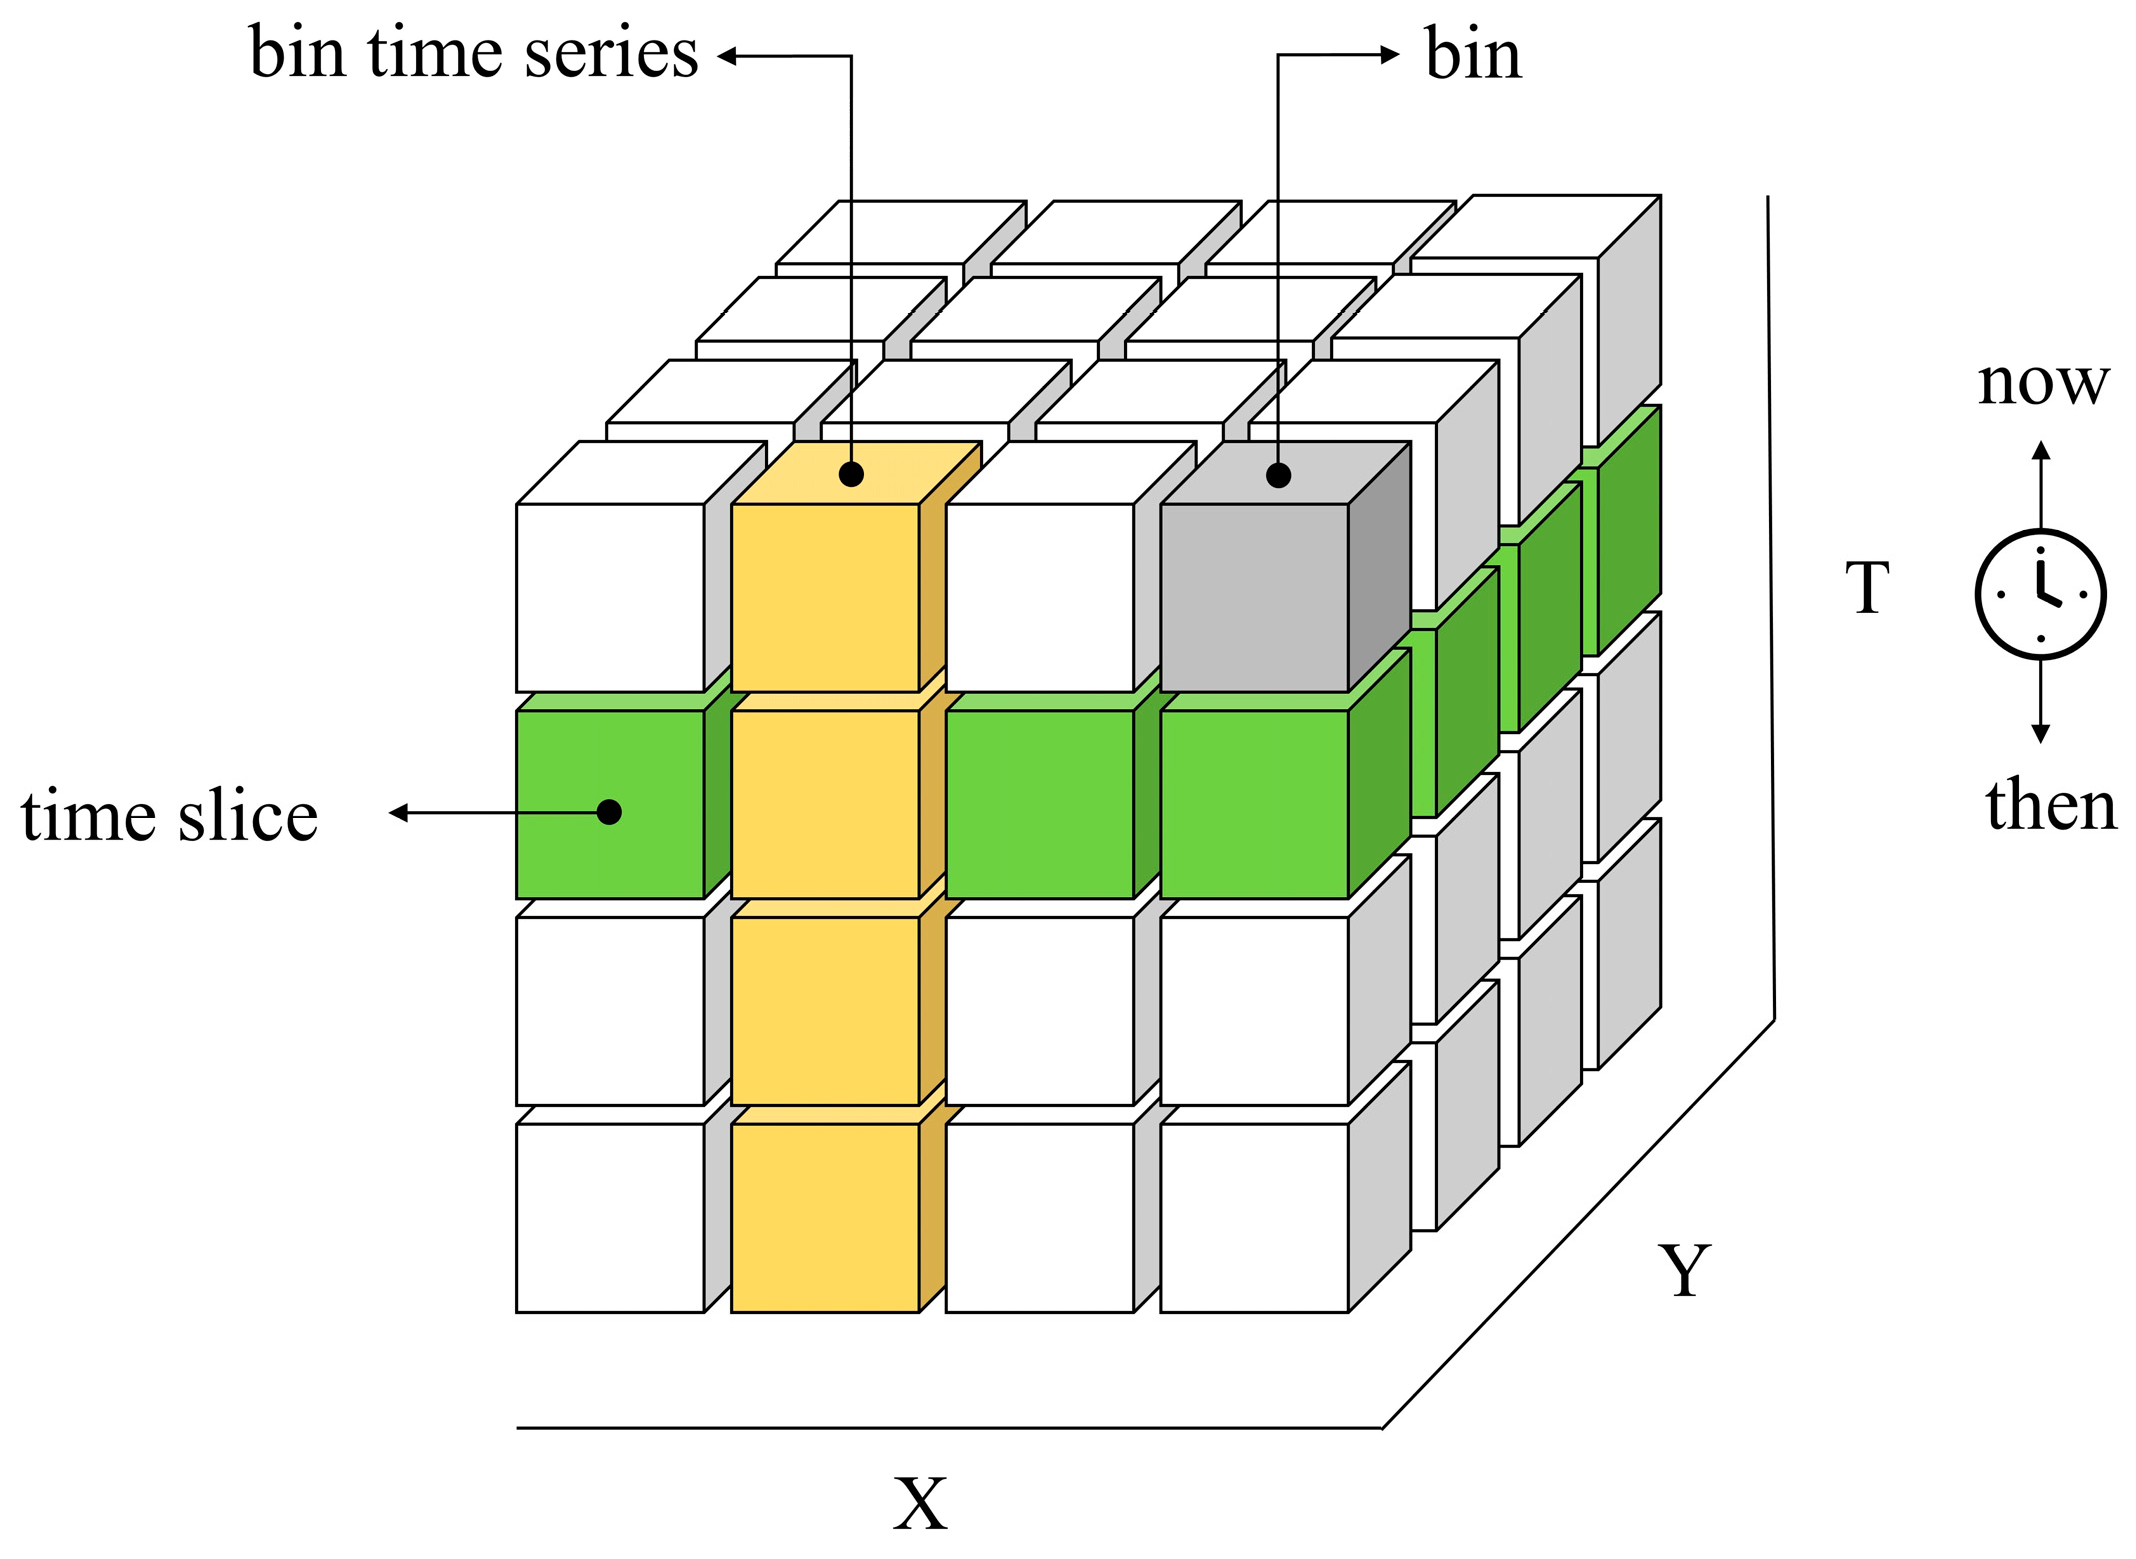
3.3.1. Space–Time Cube
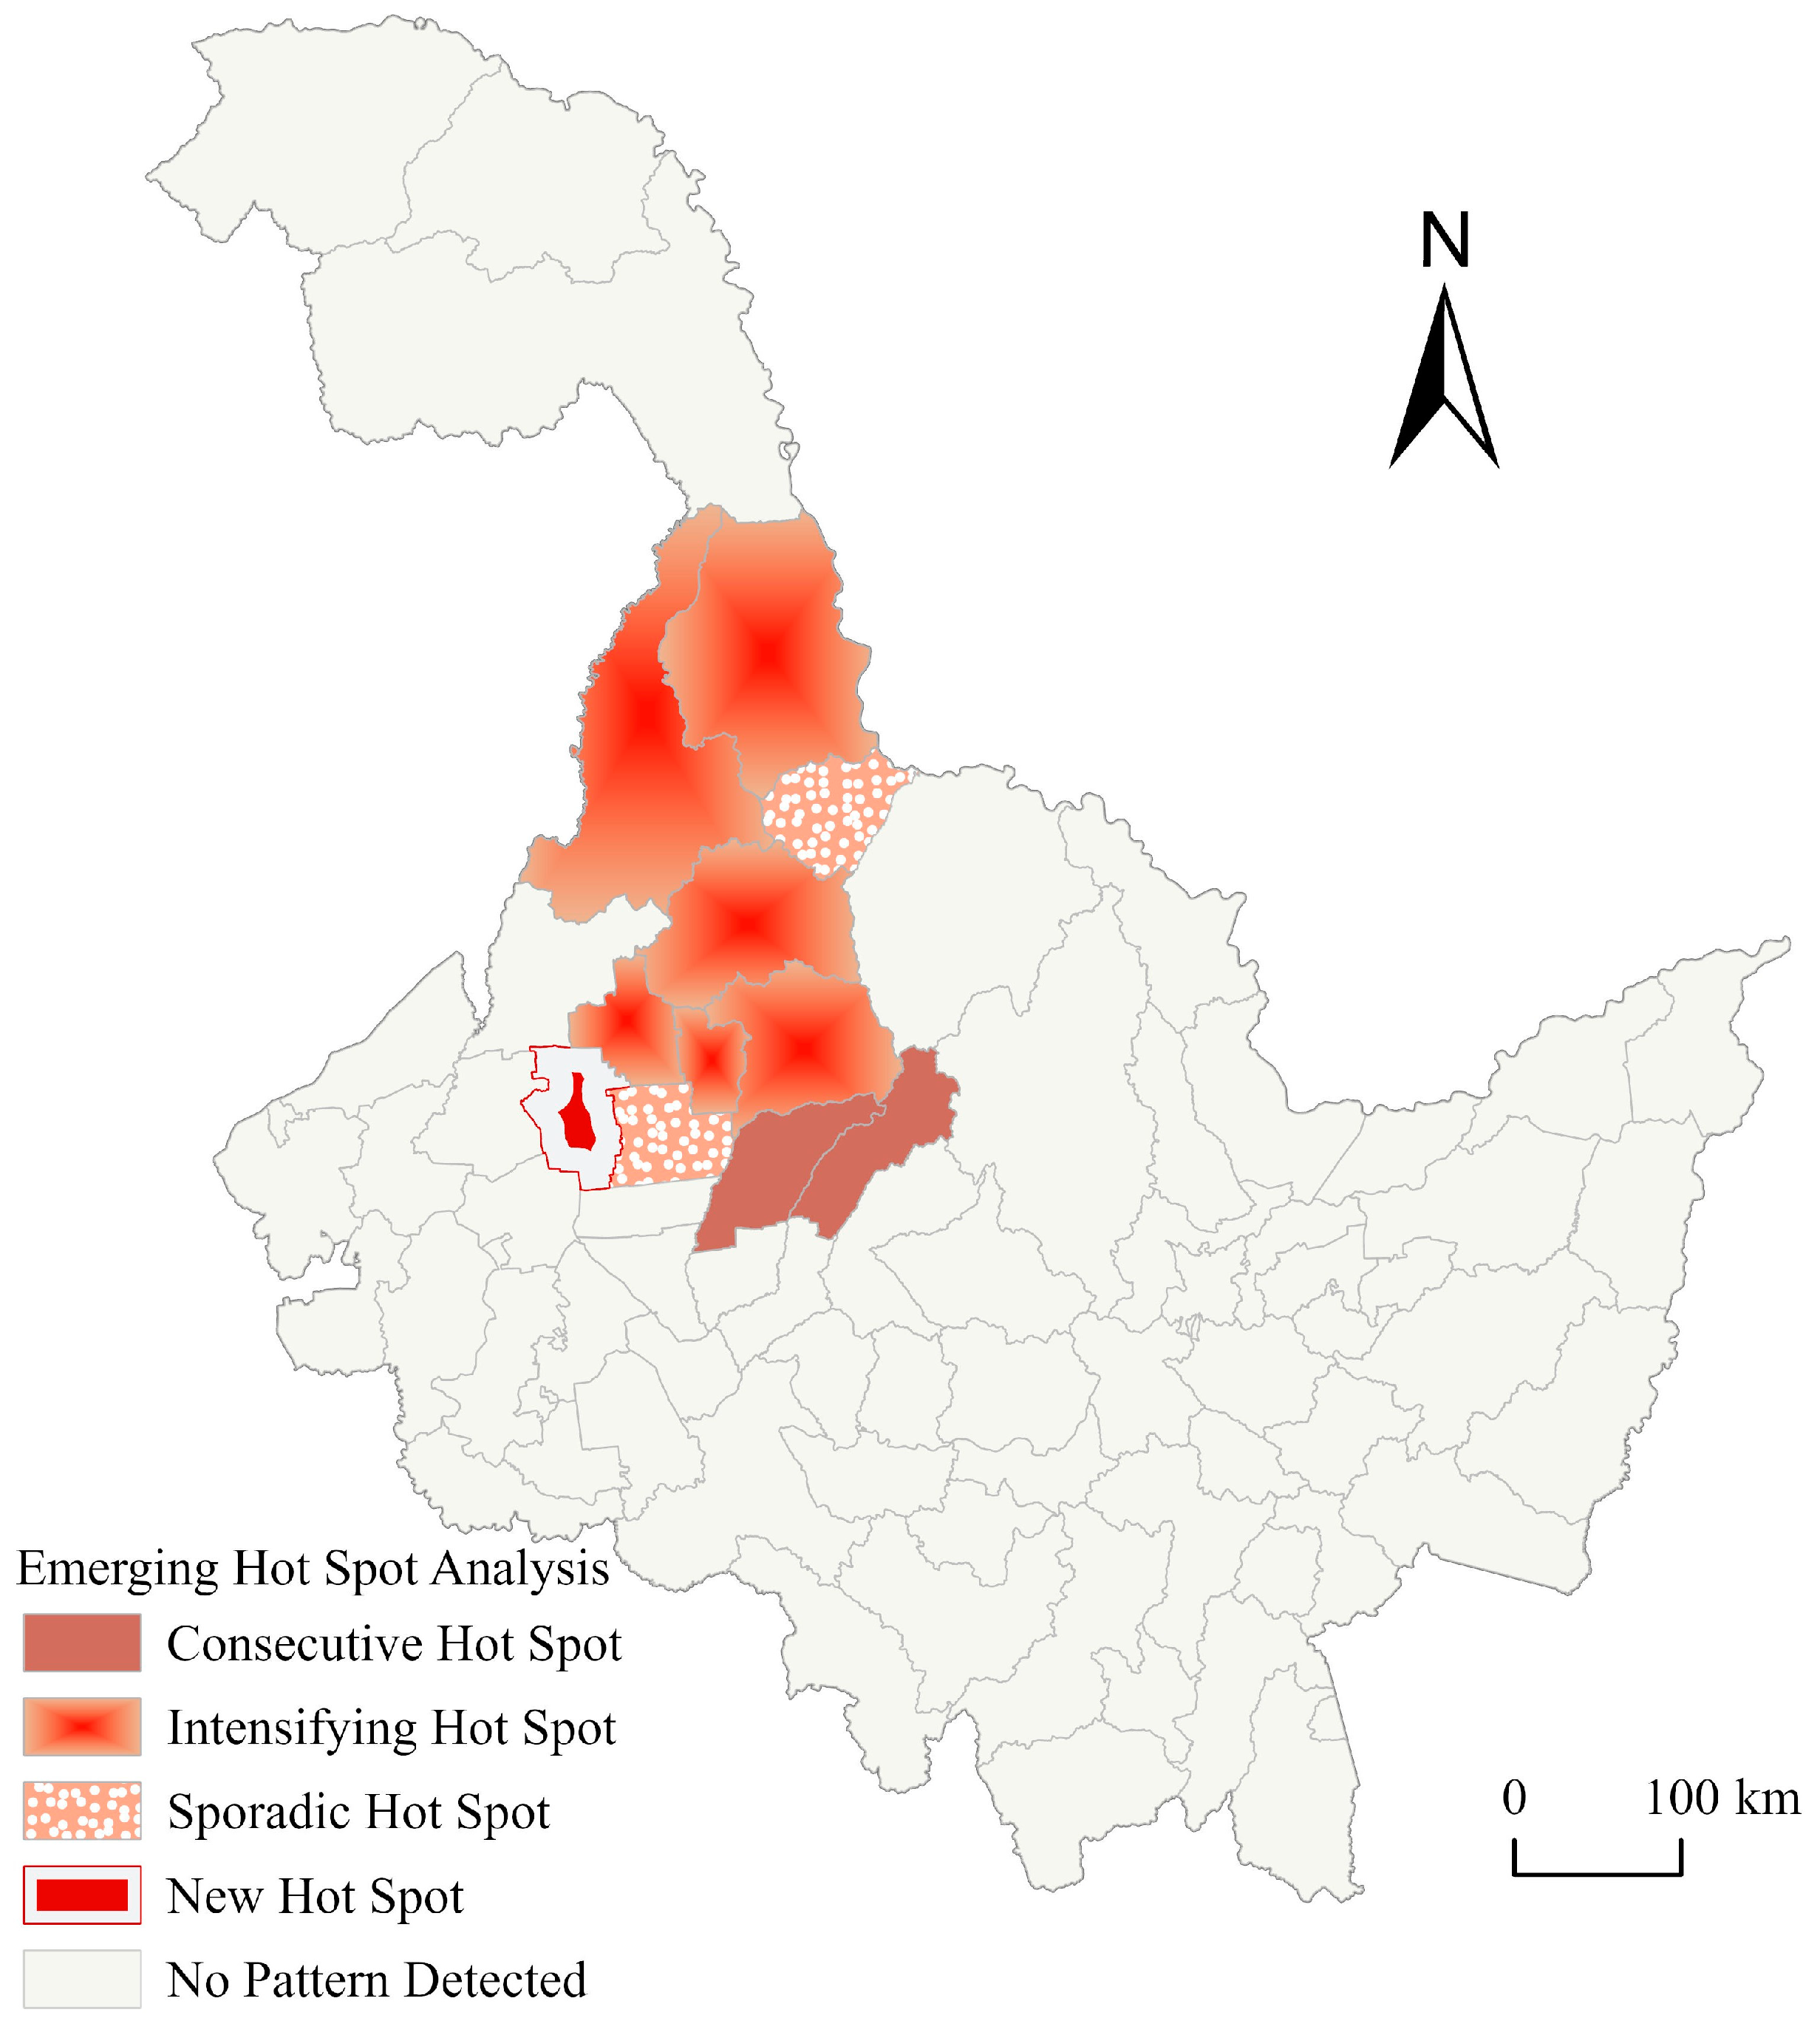
3.3.2. Emerging Hot Spot Analysis
3.3.3. Local Outlier Analysis
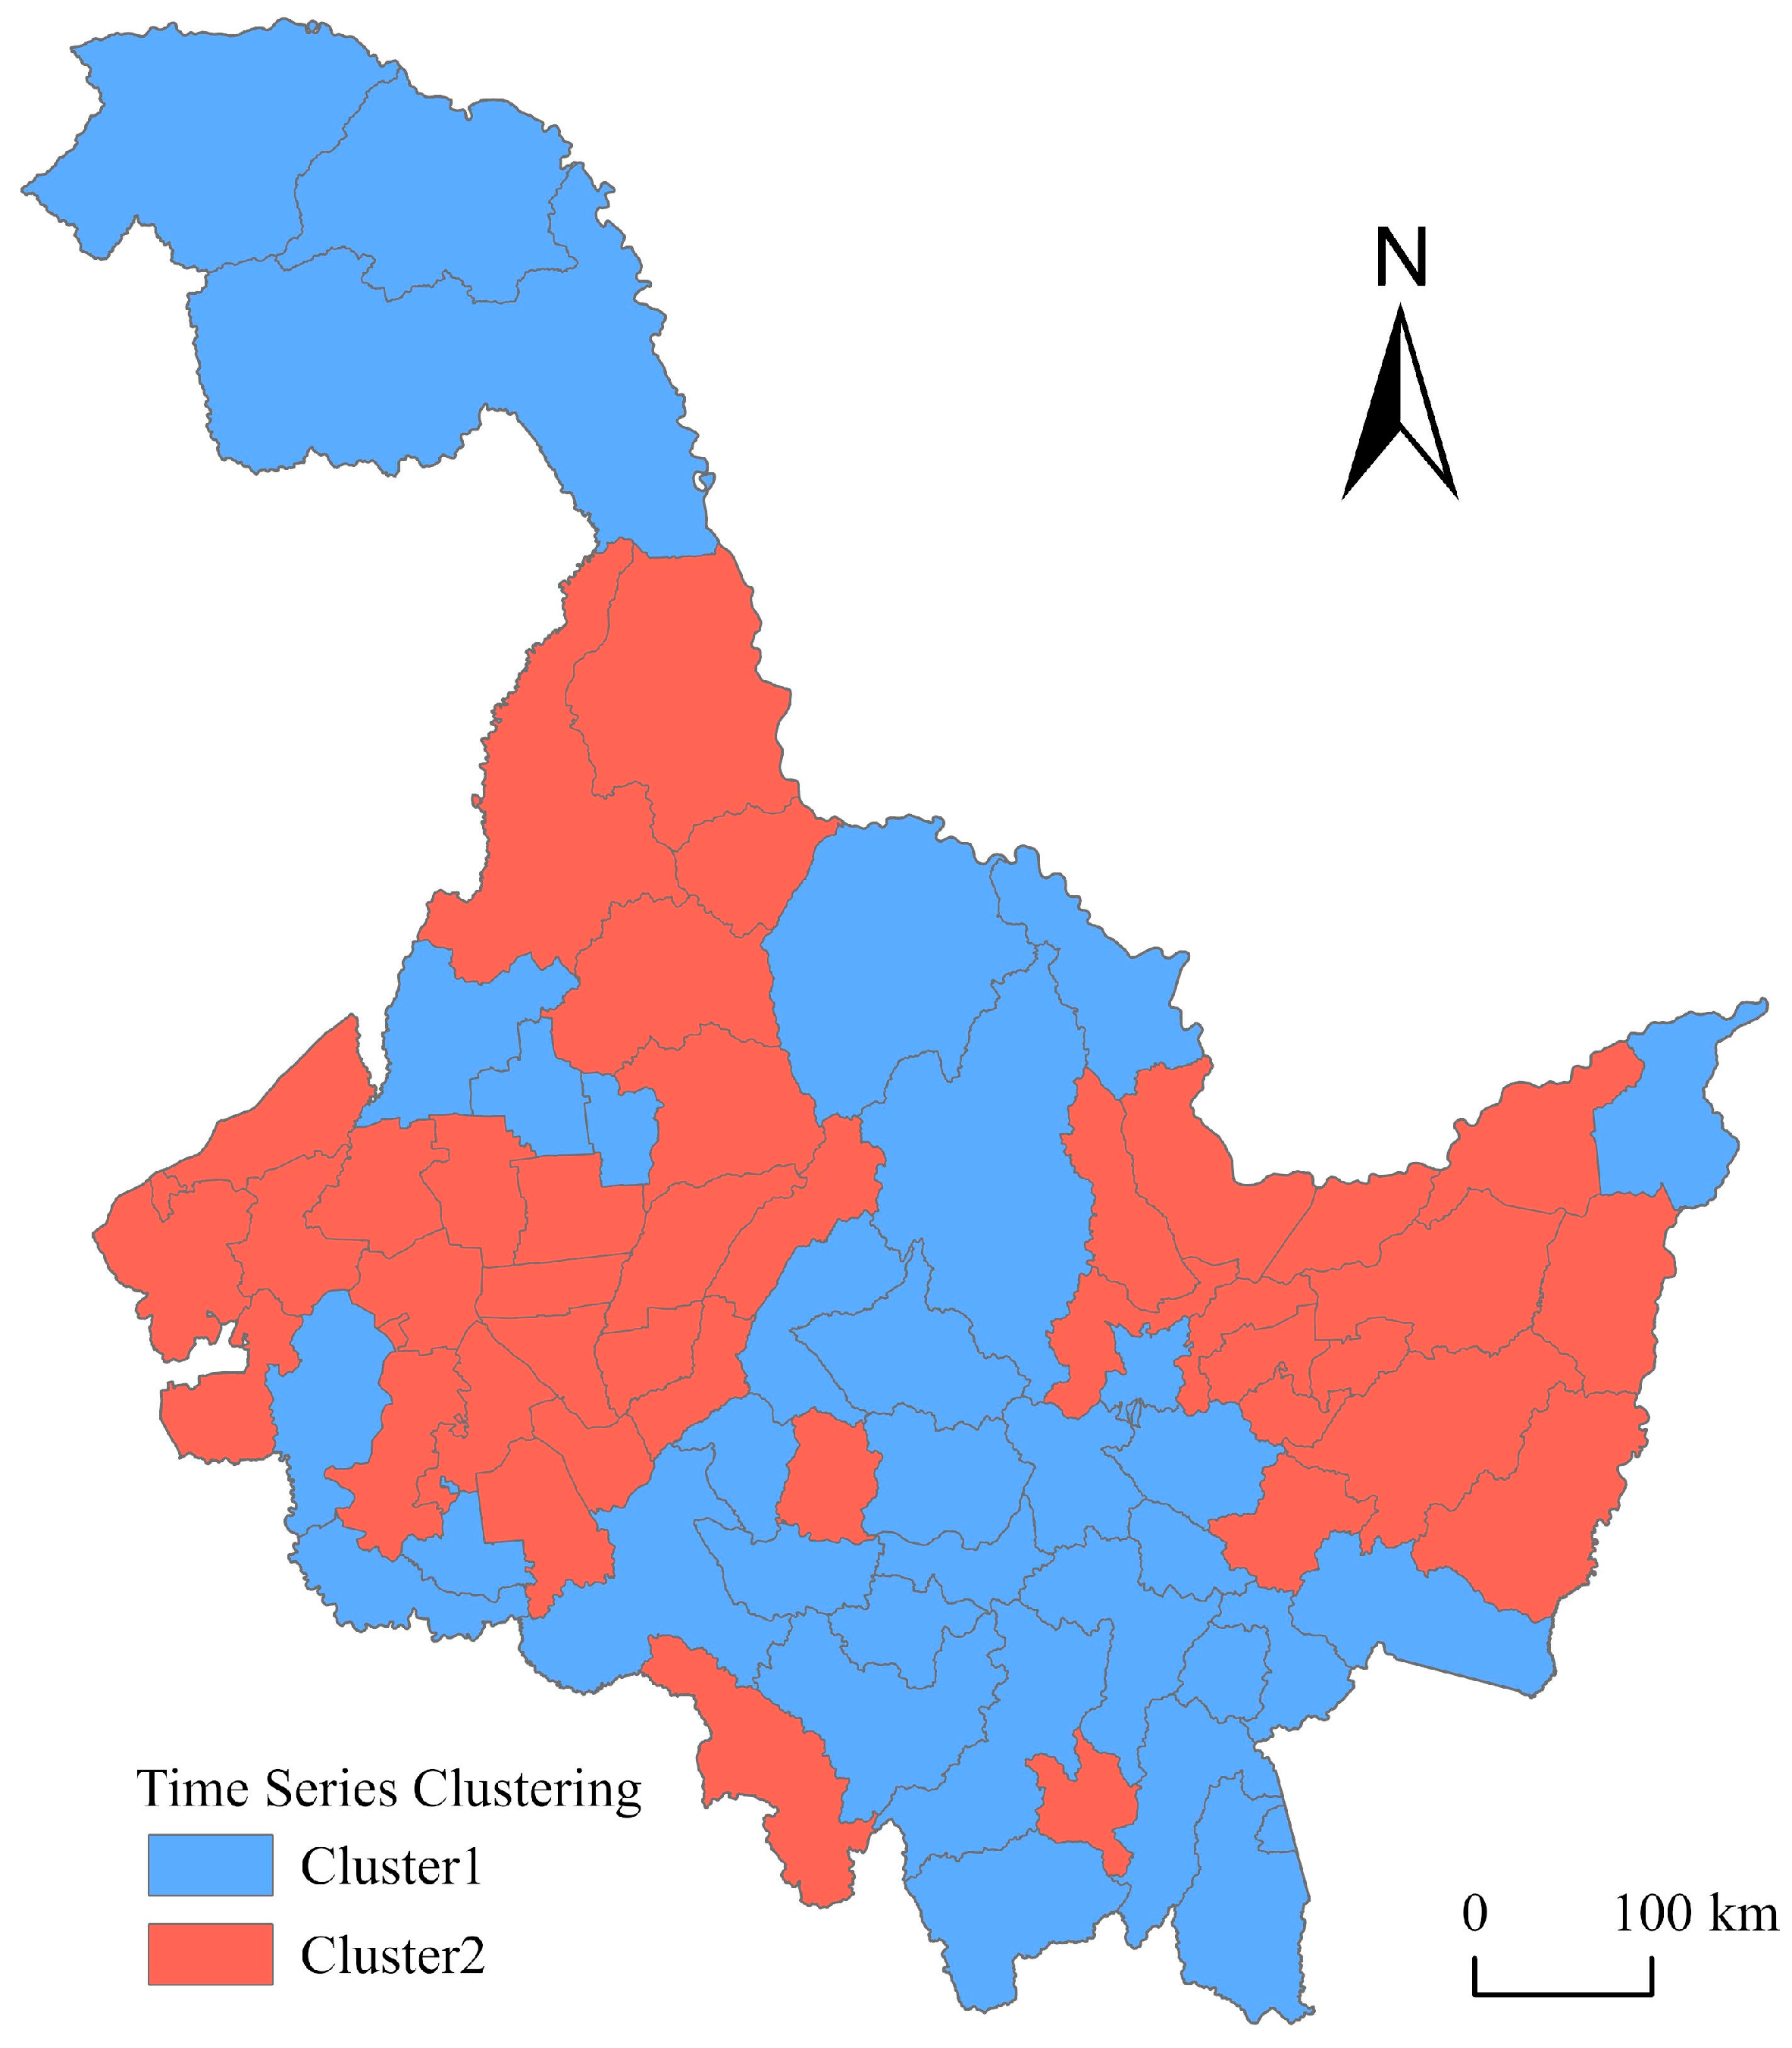
3.3.4. Time Series Clustering
3.4. Grey Relational Analysis
- Soybean yield in Heilongjiang Province was used as the reference sequence, and influencing factors were used as the comparability sequences. The raw data are forward-processed based on the correlation relationship between each comparability sequence and the reference sequence.
- To enhance the comparability between sequences, the reference sequence and the comparability sequences can be transformed into dimensionless forms by average-value processing. Average-value processing divides the elements in each sequence by the average value of the corresponding sequence.
- The grey relational coefficient of the corresponding elements between each comparability sequence and the reference sequence is calculated. The calculation formula is as follows [55]:
- 4.
- Grey relational grade is defined as the numerical measure of similarity between two sequences, such as the reference sequence and the comparability sequence. The grey relational grade between each comparability sequence and the reference sequence is calculated based on the grey correlation coefficient. The calculation formula is as follows:where e0i is the grey relational grade between the reference sequence and the i-th comparability sequence. The grey relational grade between each comparability sequence and the reference sequence is calculated, and the influencing factors are ranked according to the numerical value of the grey relational grade. The higher the grey relational grade is, the greater the impact of this influencing factor on soybean yield in Heilongjiang Province, and vice versa.
4. Results
4.1. Spatiotemporal Evolution of Soybean Production in Heilongjiang Province
4.1.1. Overall Spatiotemporal Variation
4.1.2. Spatiotemporal Model Construction
4.1.3. Spatiotemporal Hot Spot Distribution
4.1.4. Spatiotemporal Agglomeration Pattern
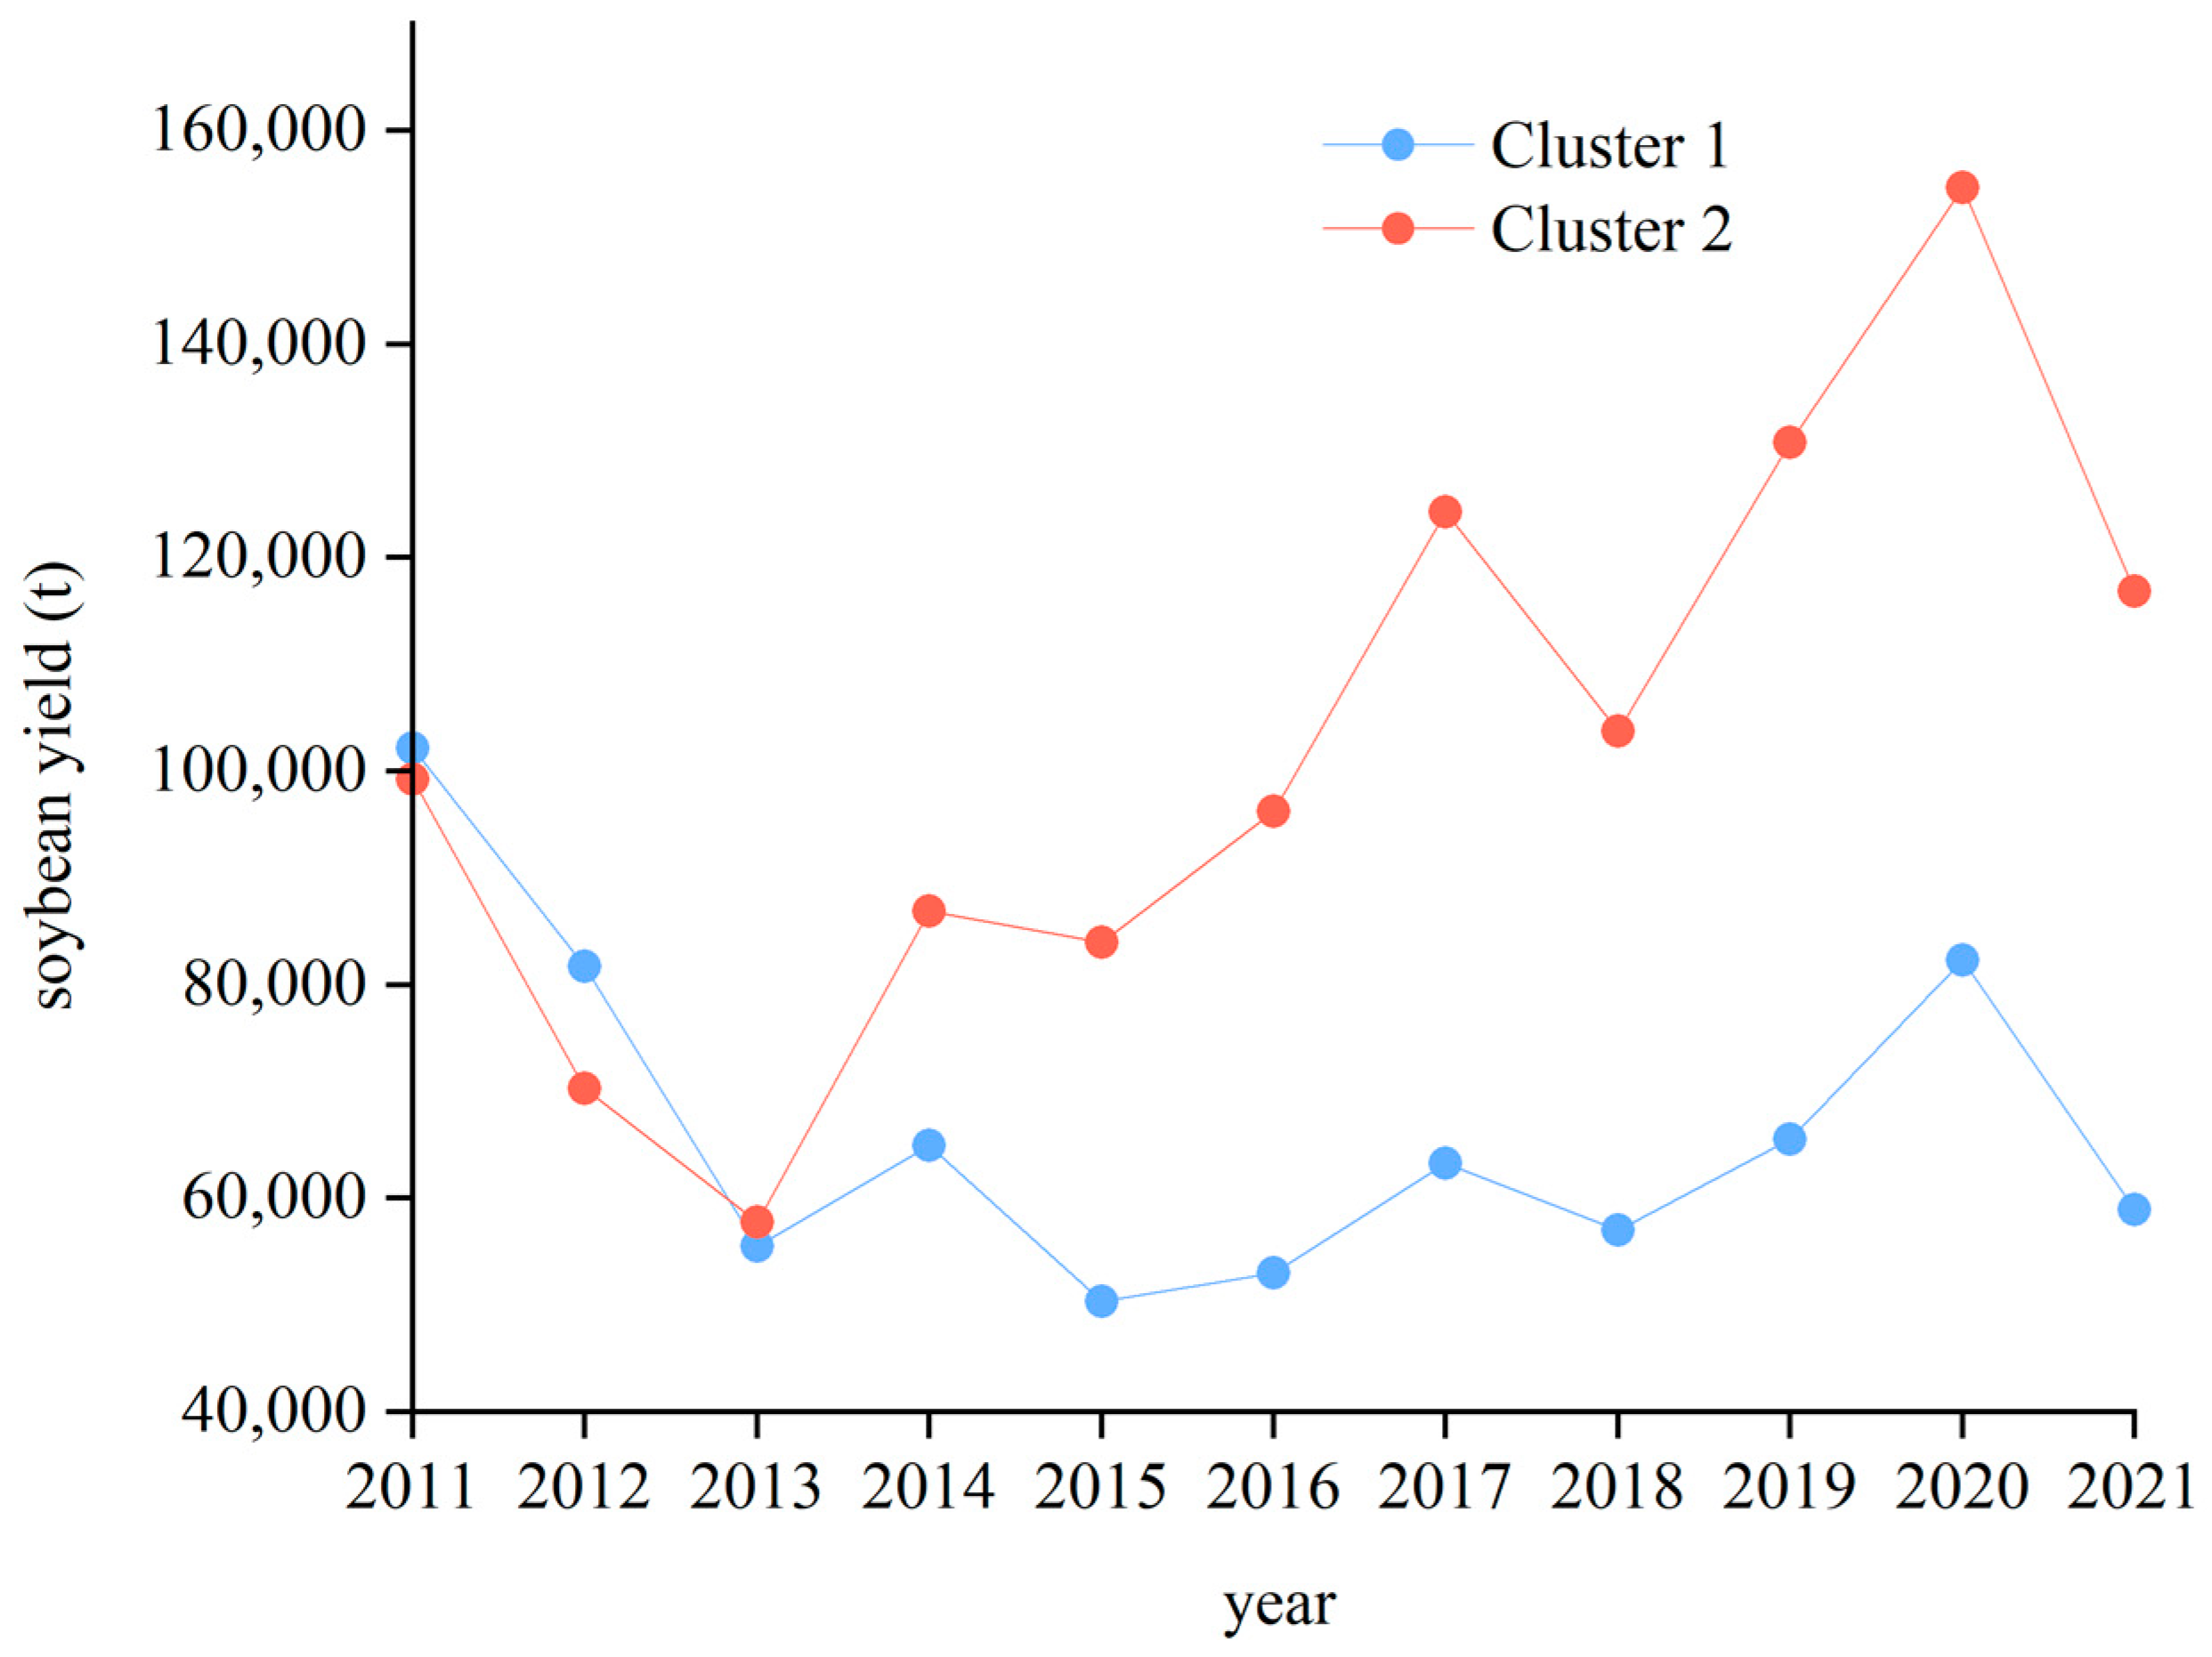
4.1.5. Time Series Analysis
4.2. Influencing Factors of Soybean Production in Heilongjiang Province
4.2.1. Determination of Influencing Factors
4.2.2. Analysis of Influencing Factors
5. Discussion
5.1. Spatial Evolution Mechanism of Soybean Production in Heilongjiang Province
- With global warming and advances in agricultural technology, the soybean production center in Heilongjiang Province is constantly shifting to the northwest [61]. Soybeans have a strong adaptability to the environment, but their distribution is also restricted by natural conditions. Except for non-irrigated areas where the active accumulated temperature (≥10 °C) is below 1900 °C and the precipitation is below 250 mm, soybean cultivation can be found in almost all agricultural areas [25]. Heilongjiang Province has favorable conditions, such as simultaneous heat and precipitation, large temperature differences between day and night, and long sunshine hours in summer. In addition, soybeans exhibit a strong tolerance to cold temperatures. As long as suitable varieties are selected, soybeans can still achieve high yields even in the frigid climate of northern Heilongjiang Province [62]. If other crops, such as maize or rice, are grown in this cold region, their stability is inferior to that of soybeans [63].
- The current soybean production hot spots are concentrated at the junction of Heihe City, Suihua City, and Qiqihar City [64]. With Hailun and Suiling as the southern boundaries and Aihui as the northern boundary, the type of cultivated land in this area is mainly dry land. It is not a dominant planting area for maize. In contrast, soybean production has a greater advantage. The area to the north of Aihui belongs to the Greater Khingan Mountains forest region, with limited arable land resources and an active accumulated temperature (≥10 °C) below 1900 °C. Its natural conditions cannot meet the needs of large-scale soybean cultivation. The latitude of northeastern Heilongjiang Province is relatively low, and the cultivated land type is mainly paddy fields. Rice is the main crop in this area [65]. In the southern part of Heilongjiang Province, where the accumulated temperature is higher, rice and maize cultivation have higher benefits, while soybeans lack a competitive advantage [25].
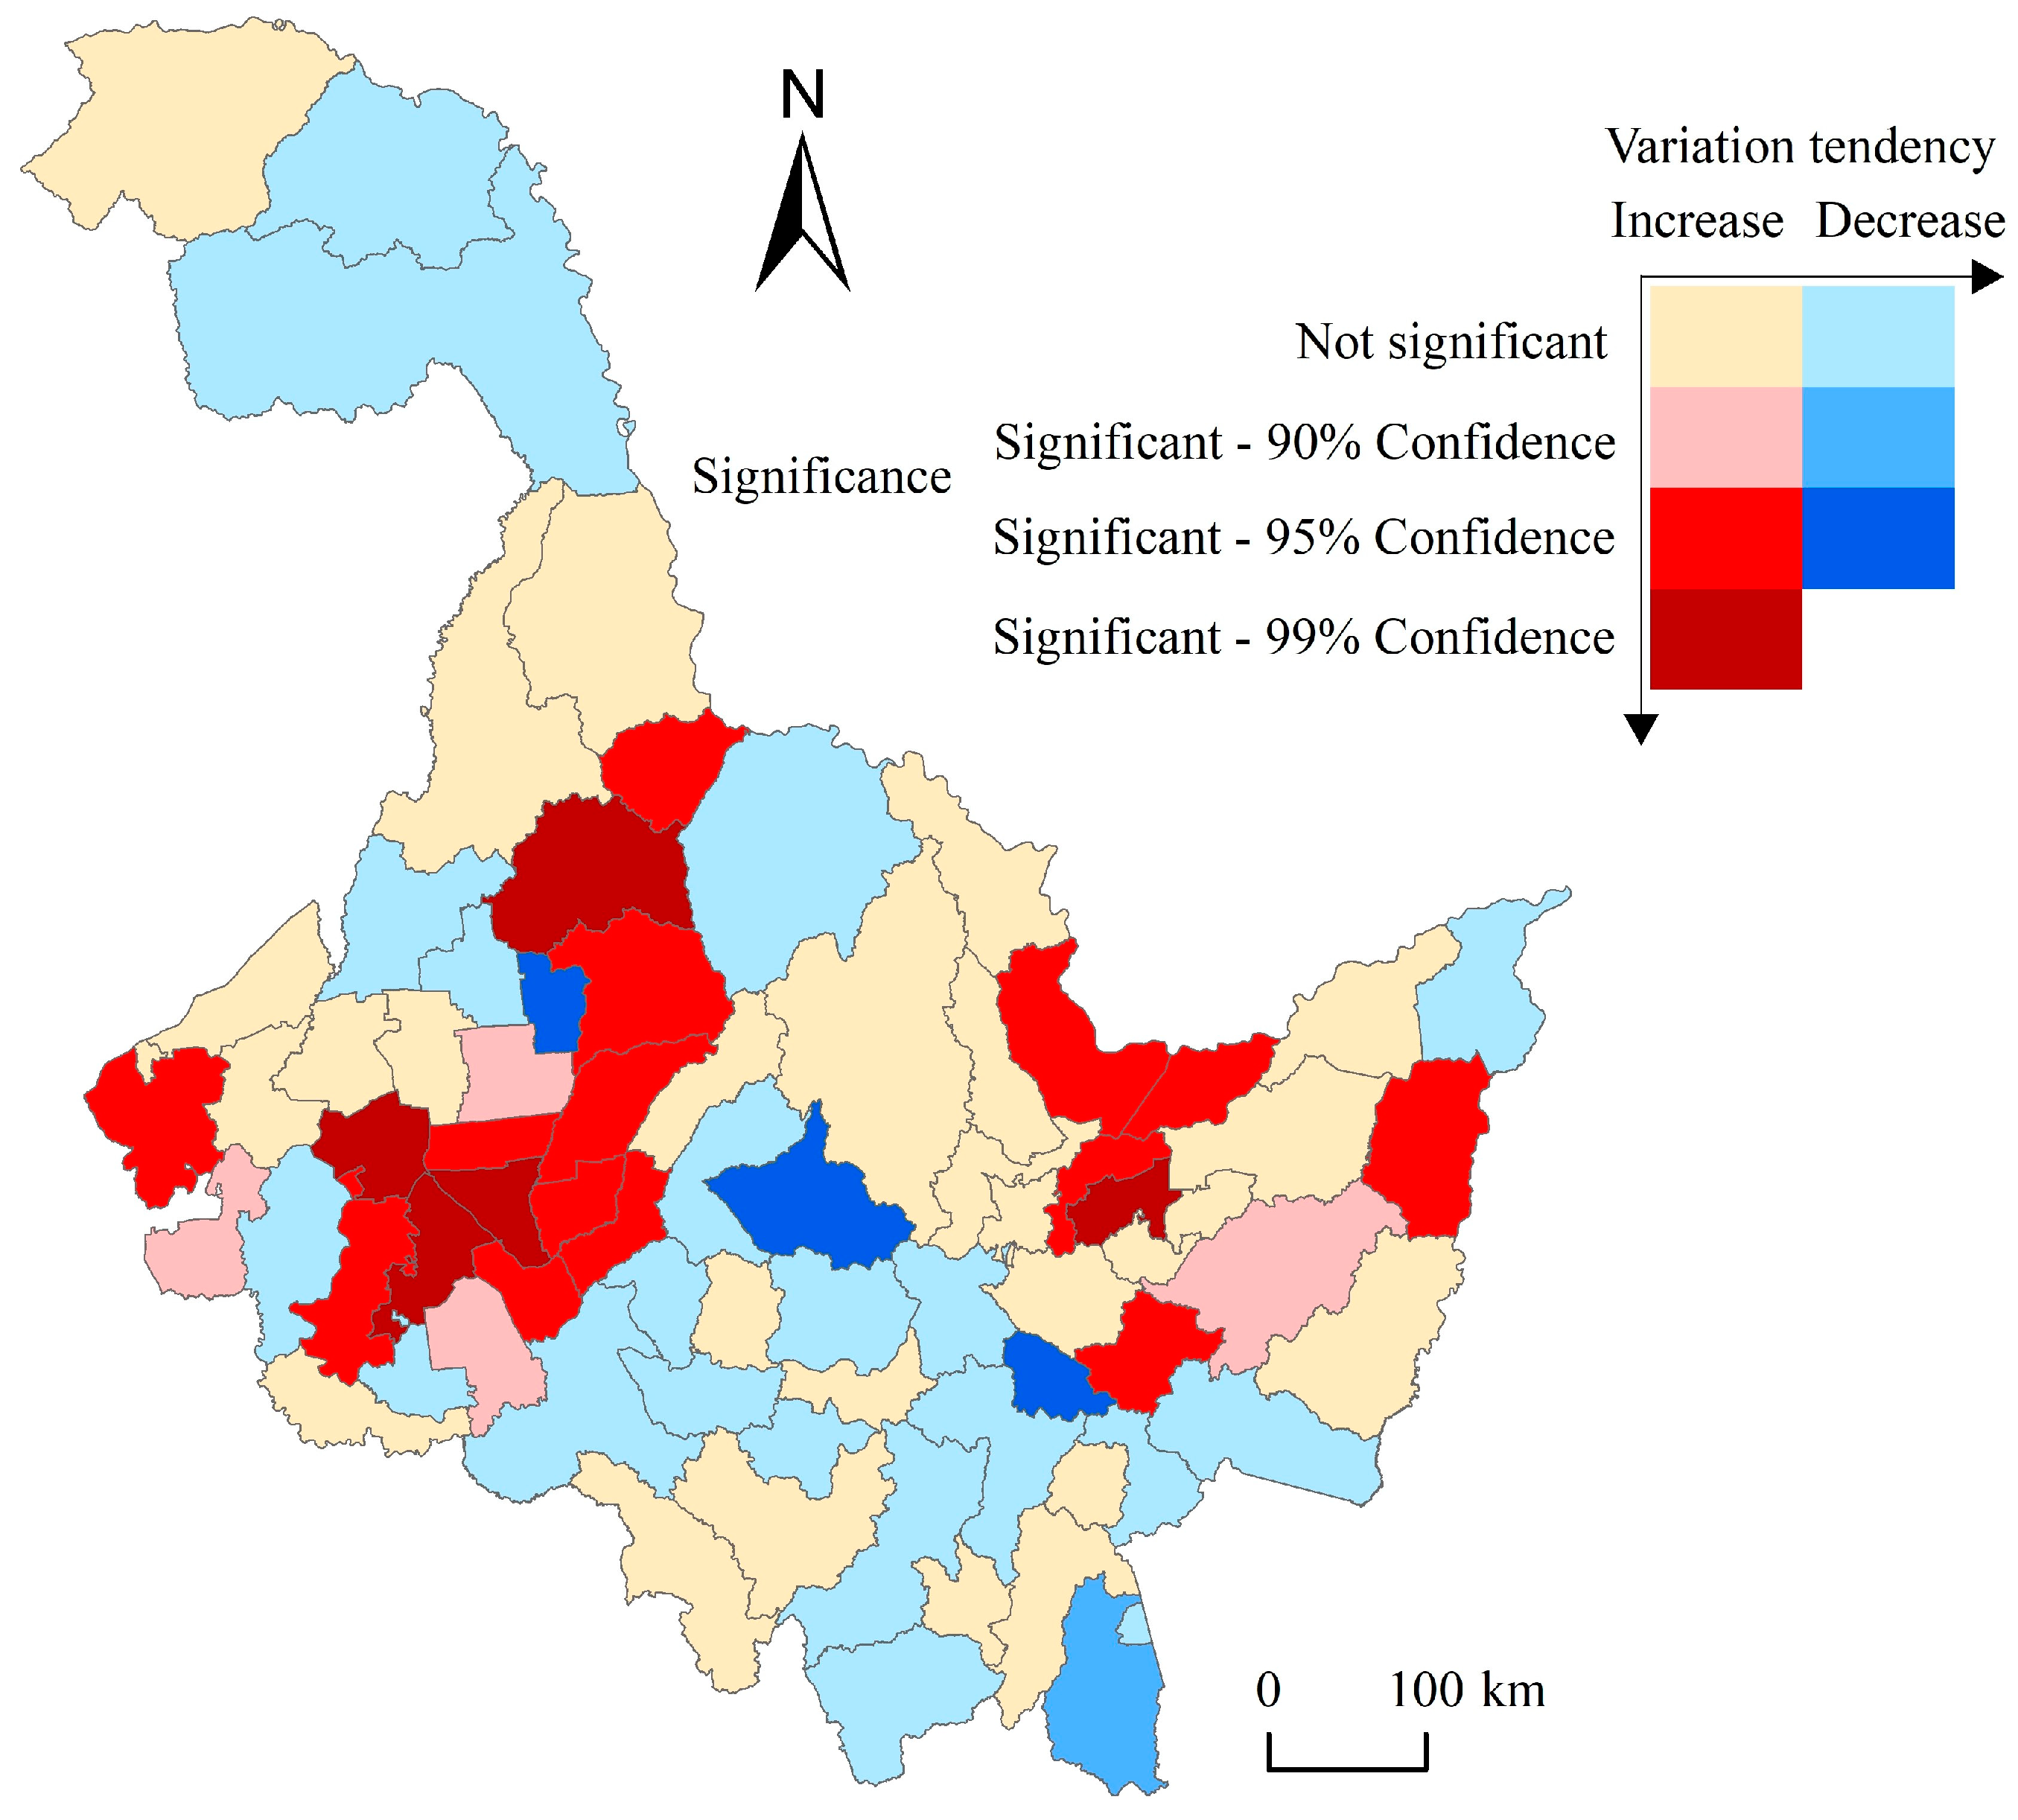
- From 2011 to 2021, there was a significant spatial difference in soybean yield fluctuations in different counties of Heilongjiang Province. Overall, the growth trend of soybean yield in northern counties was higher than that in southern counties. The most significant increase is observed in the northern part of the Lesser Khingan Mountains, the central-northern part of the Songnen Plain, and the Sanjiang Plain [66]. These areas are rich in arable land resources and have a solid foundation for agricultural production. The majority of the low-yield, low-quality, and low-efficiency corn and rice production areas in Heilongjiang Province are concentrated here. At the same time, these areas are also the core regions for promoting the rotation between soybeans and other crops in Heilongjiang Province. In other county-level administrative units, soybean yield changes are not significant due to factors such as planting income, topography, and cultivated land types. Only soybean yields in Kedong, Tieli, Boli and Dongning decreased significantly.
5.2. Temporal Evolution Mechanism of Soybean Production in Heilongjiang Province
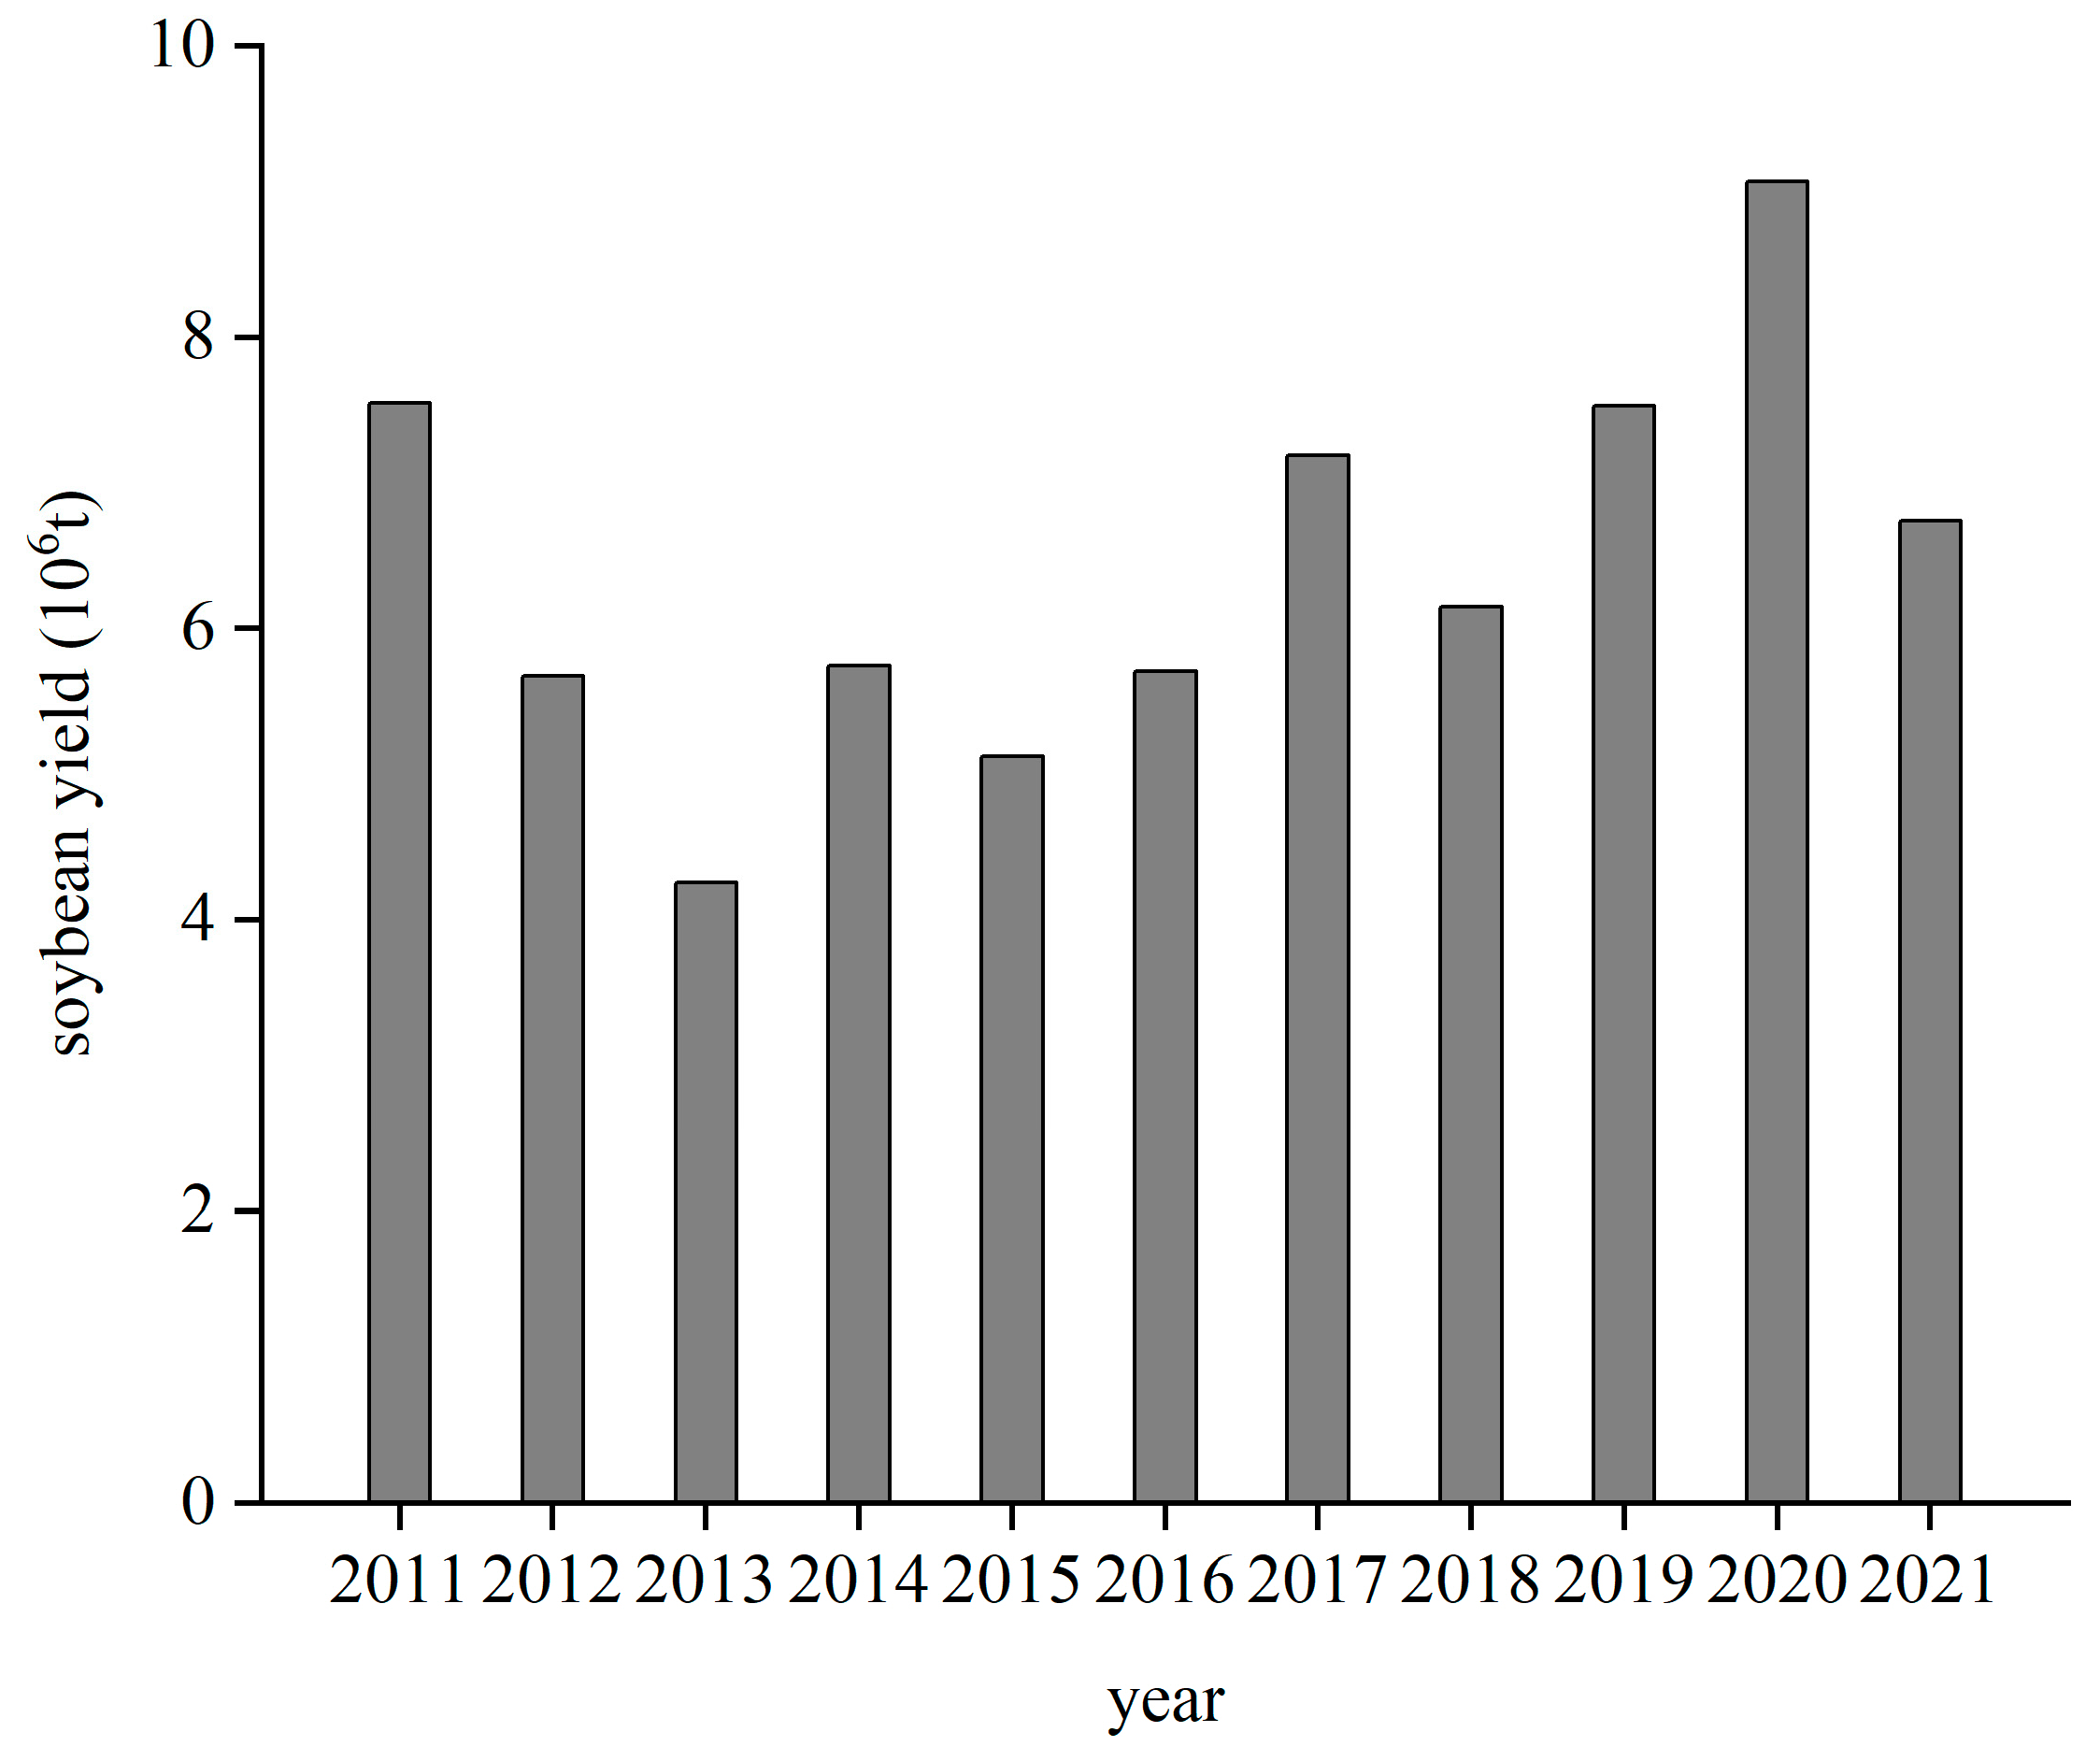
- From 2011 to 2013, the soybean yield in Heilongjiang Province declined year by year, which was caused by factors such as rising soybean planting costs, low comparative returns, crop rotation, international market shocks, and high national grain reserve standards. The production factor cost of soybean cultivation is constantly increasing, and the comparative benefit is lower than those of competitive crops such as rice and maize [67]. Soybean cultivation requires crop rotation to reduce pests and diseases, prevent soil nutrient imbalance, and eliminate the toxic effects of root and microbial secretions. As a result, soybean acreage undergoes periodic reductions [68]. Imported soybeans have the characteristics of low prices and high oil extraction rates, which attract large-scale oilseed processing enterprises to concentrate in coastal areas. This has a crowding-out effect on soybean production in Heilongjiang Province [69]. Although the temporary soybean purchasing and storage policy to some extent guarantees the income of soybean farmers, the national purchasing and storage agencies have high quality requirements for soybeans. Farmers still need to bear the expenses of short-distance transportation, grain losses, accommodation, etc. Therefore, the problem of limited soybean sales still exists [70]. In addition, the precipitation in Heilongjiang Province increased abnormally in the winter of 2012, resulting in snow covering a wide area and persisting for a long time. As a result, severe soil waterlogging occurred in the spring of 2013, and spring plowing activities were severely disrupted [71]. In the summer of 2013, Heilongjiang Province experienced frequent rainfall and insufficient sunlight. Some major soybean-producing areas suffered from floods, which greatly affected soybean production [72].
- In 2014, soybean yield showed a recovery of growth. The weather conditions in 2014 were favorable for soybean planting in Heilongjiang Province. The soil moisture was good, the temperature was normal, and the sunshine was ample. The growth and development of soybeans was better than that in previous years [73]. In the same year, Heilongjiang Province changed its temporary soybean purchasing and storage policy to the soybean target price policy.
- In 2015, due to the impact of various factors, such as the low comparative benefits of soybean cultivation and the import of foreign transgenic soybeans, an increasing number of farmers in Heilongjiang Province switched to planting maize. In addition, the soybean target price policy temporarily did not have a significant impact on the increase in soybean production in Heilongjiang Province, and soybean yield declined [74].
- In 2016 and 2017, the soybean yield in Heilongjiang Province increased. In November 2015, the Ministry of Agriculture and Rural Affairs of China issued guiding opinions on the structural adjustment of maize in the ‘Liandaowan’ areas, which promoted the increase in the soybean planting area in Heilongjiang Province [75]. In March 2016, China officially canceled the temporary maize purchasing and storage policy in the three provinces of Northeast China and the Inner Mongolia Autonomous Region. The cancellation of the temporary purchasing and storage policy led to the expectation of falling maize prices, and some farmers switched to planting soybeans instead. In addition, Heilongjiang Province launched a pilot subsidy for maize-soybean rotation in 2016, which further strengthened farmers’ willingness to plant soybeans.
- In 2018, the soybean yield in Heilongjiang Province decreased. Maize prices continued to rise at the end of 2017, which resulted in a decline in farmers’ interest in planting soybeans. In addition, the northwestern region of Heilongjiang Province suffered from low temperatures and frosty weather in September 2018, which also led to a certain reduction in soybean yields [76].
- In 2019 and 2020, the soybean yield in Heilongjiang Province increased rapidly. In 2019, China launched the second round of the soybean revitalization plan and issued an implementation plan, which clearly stated the goal of increasing the effective supply of soybeans. Since 2018, the difference in producer subsidies between soybeans and maize has widened in Heilongjiang Province. Soybean subsidies far exceed maize subsidies, resulting in a higher income of soybeans than of maize in 2018. Farmers’ enthusiasm for planting soybeans increased, and soybean yield increased in 2019. On the basis of continuing to implement differentiated producer subsidies for maize and soybeans, the weather conditions for soybean cultivation in Heilongjiang Province in 2020 were ideal, resulting in a further increase in soybean yields.
- In 2021, the soybean yield in Heilongjiang Province showed a downward trend. Rising maize prices in 2020 have led to a significant increase in maize profits. Farmers had a strong desire to expand maize planting, which squeezed out part of the soybean planting area [77].
5.3. Discussion on the Differences in Grey Relational Grade of Influencing Factors
5.3.1. Primary Influencing Factors
- Soybeans are crops that prefer light and warmth. Sufficient sunlight and suitable temperature are beneficial to the growth and maturity of soybeans. Due to the short frost-free period, the soybean varieties selected for planting in various regions of Heilongjiang Province are strictly restricted by temperature conditions. The farther north in Heilongjiang Province, the more farmers tend to choose soybean varieties with a shorter growing period and stronger cold-resistant characteristics [78]. The length of the growth period and the accumulated temperature basically determine the unit-yield level of soybeans [63]. Liu and Dai similarly found that temperature and sunlight are the main factors influencing soybean phenology [79].
- The soybean yield in Heilongjiang Province is extremely sensitive to the price ratio of local soybeans to local maize, as well as the price ratio of imported soybeans to local soybeans. The relative prices of local soybeans and local maize directly determine farmers’ planting choices, while price fluctuations in the international soybean market profoundly affect the supply–demand relation of soybeans in Heilongjiang Province. The impacts of these two price ratios on soybean yield in Heilongjiang Province are even higher than those of soybean cultivation income and local soybean prices. The impact intensity of local maize is greater than that of imported soybeans. This is because Heilongjiang Province is located in the inland area. Compared to coastal areas, the transportation time of imported soybeans is longer, and the transportation cost is higher. As a result, the price advantage of imported soybeans is greatly reduced. In addition, the main uses of domestic soybeans and imported soybeans are different, and the substitution relationship is limited. Domestic soybeans are non-transgenic soybeans with a high protein content and are mainly used for soybean food processing. Imported soybeans have advantages in terms of oil extraction rate and are mainly used for oil extraction and feed production [80]. Due to the preference for green food, some consumers in the soybean market prefer higher-priced non-transgenic soybeans, which also enhances the development resilience of local soybeans in Heilongjiang Province [81]. The competition between local maize and local soybeans is very intense. The climatic conditions in Heilongjiang Province are also suitable for maize cultivation, and the comparative profit of maize is generally higher than that of soybeans. Faced with the realistic pressure of rising land transfer prices, farmers pursue higher profits and continuously expand maize cultivation areas, resulting in a decline in soybean yields.
- Imported soybean prices and local maize prices have a greater impact on soybean yield in Heilongjiang than soybean import volume and maize yield. Imported soybean prices and local maize prices directly affect farmers’ planting income, which subsequently affects the soybean yield in Heilongjiang Province by changing farmers’ planting decisions. However, the effect mechanism of soybean import volume and local maize yield on soybean yield in Heilongjiang Province is more complicated, the influence process is more tortuous, and the influence intensity is relatively limited.
- The number of soybean patents and the number of newly established soybean enterprises are also primary factors influencing soybean yield in Heilongjiang Province. The greater the number of soybean patents, the greater the investment in soybean research and the faster the technological progress. Technological innovations in soybean breeding, planting, processing, and other aspects collectively play a significant role in enhancing soybean yields [82]. The increasing number of newly established soybean enterprises indicates a positive development trend in the soybean industry and a strong demand in the soybean market. This stimulates more farmers to engage in soybean cultivation, which subsequently leads to an increase in soybean production in Heilongjiang Province. In addition, the agglomeration of soybean enterprises is the foundation of the soybean industry cluster. The upgrading of the industrial model will lead to many benefits [83], such as external economy, scale economy, and knowledge exchange, promote the revitalization of the soybean industry, and better transform resource advantages into economic advantages.
5.3.2. Secondary Influencing Factors
5.3.3. General Influencing Factors
5.4. Development Suggestions for Soybean Industry in Heilongjiang Province
5.4.1. Cluster Development
5.4.2. Production Optimization
5.4.3. Policy Guidance
5.4.4. Technology Investment
6. Conclusions
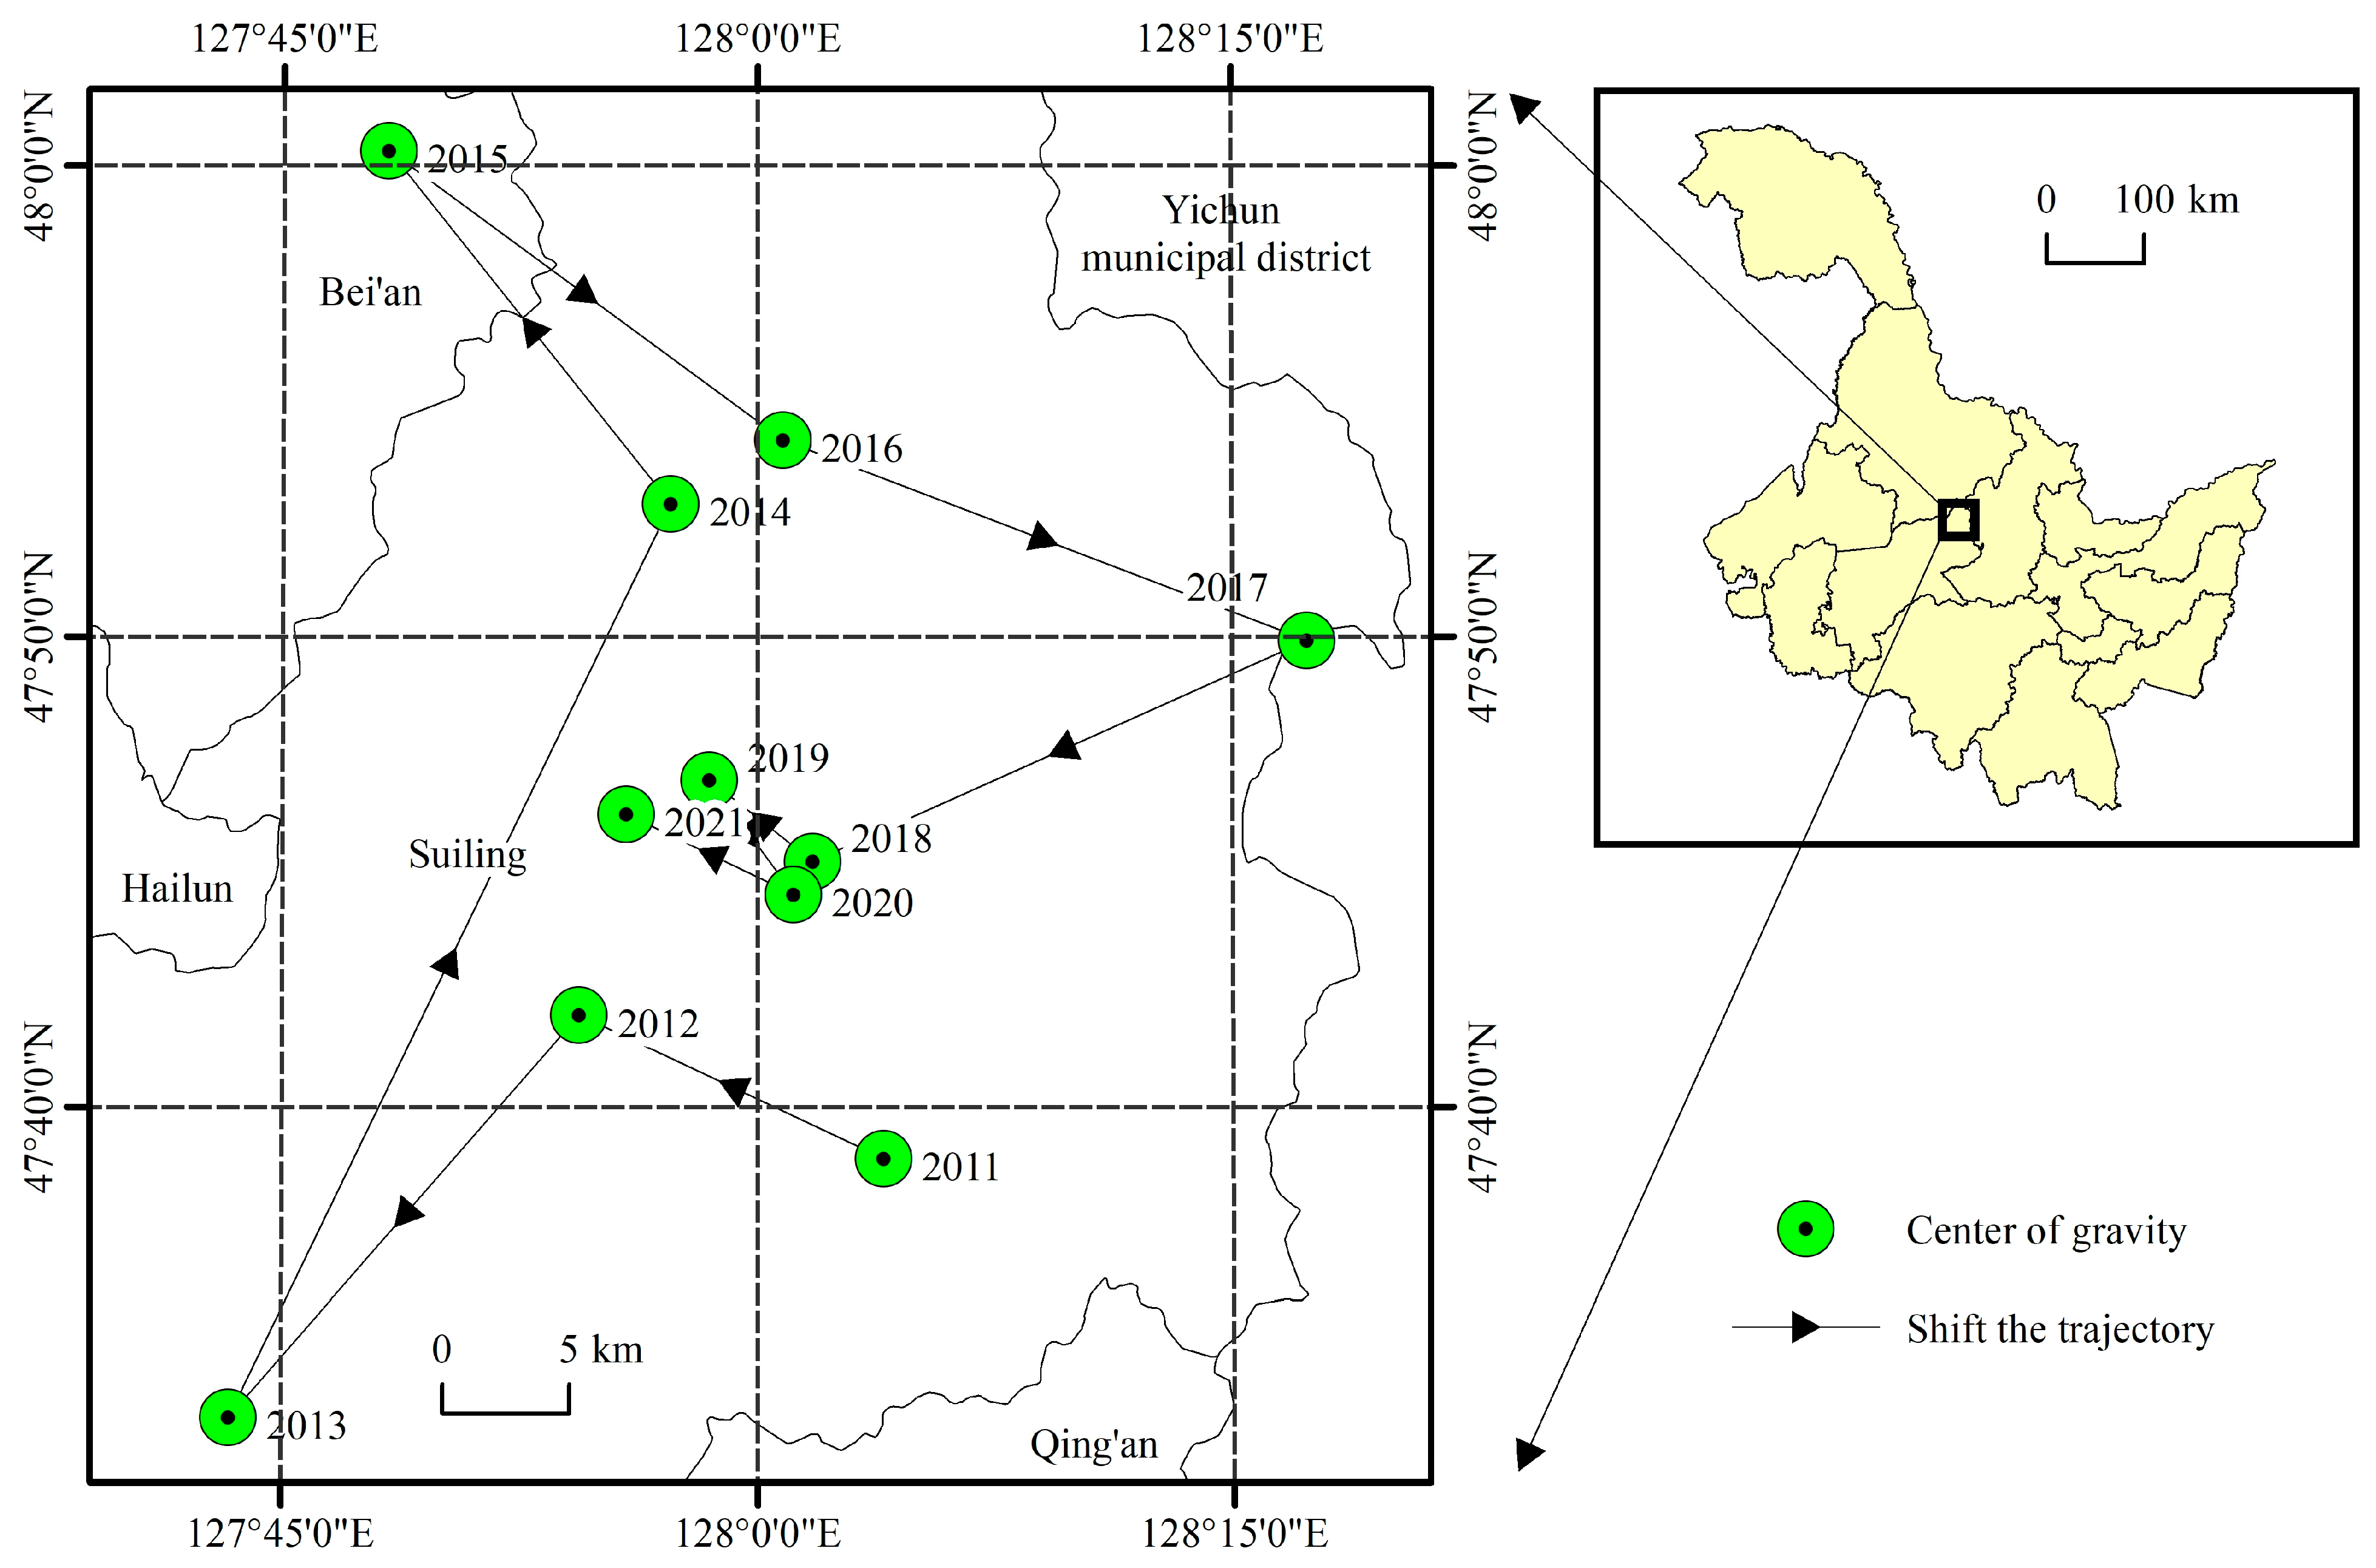
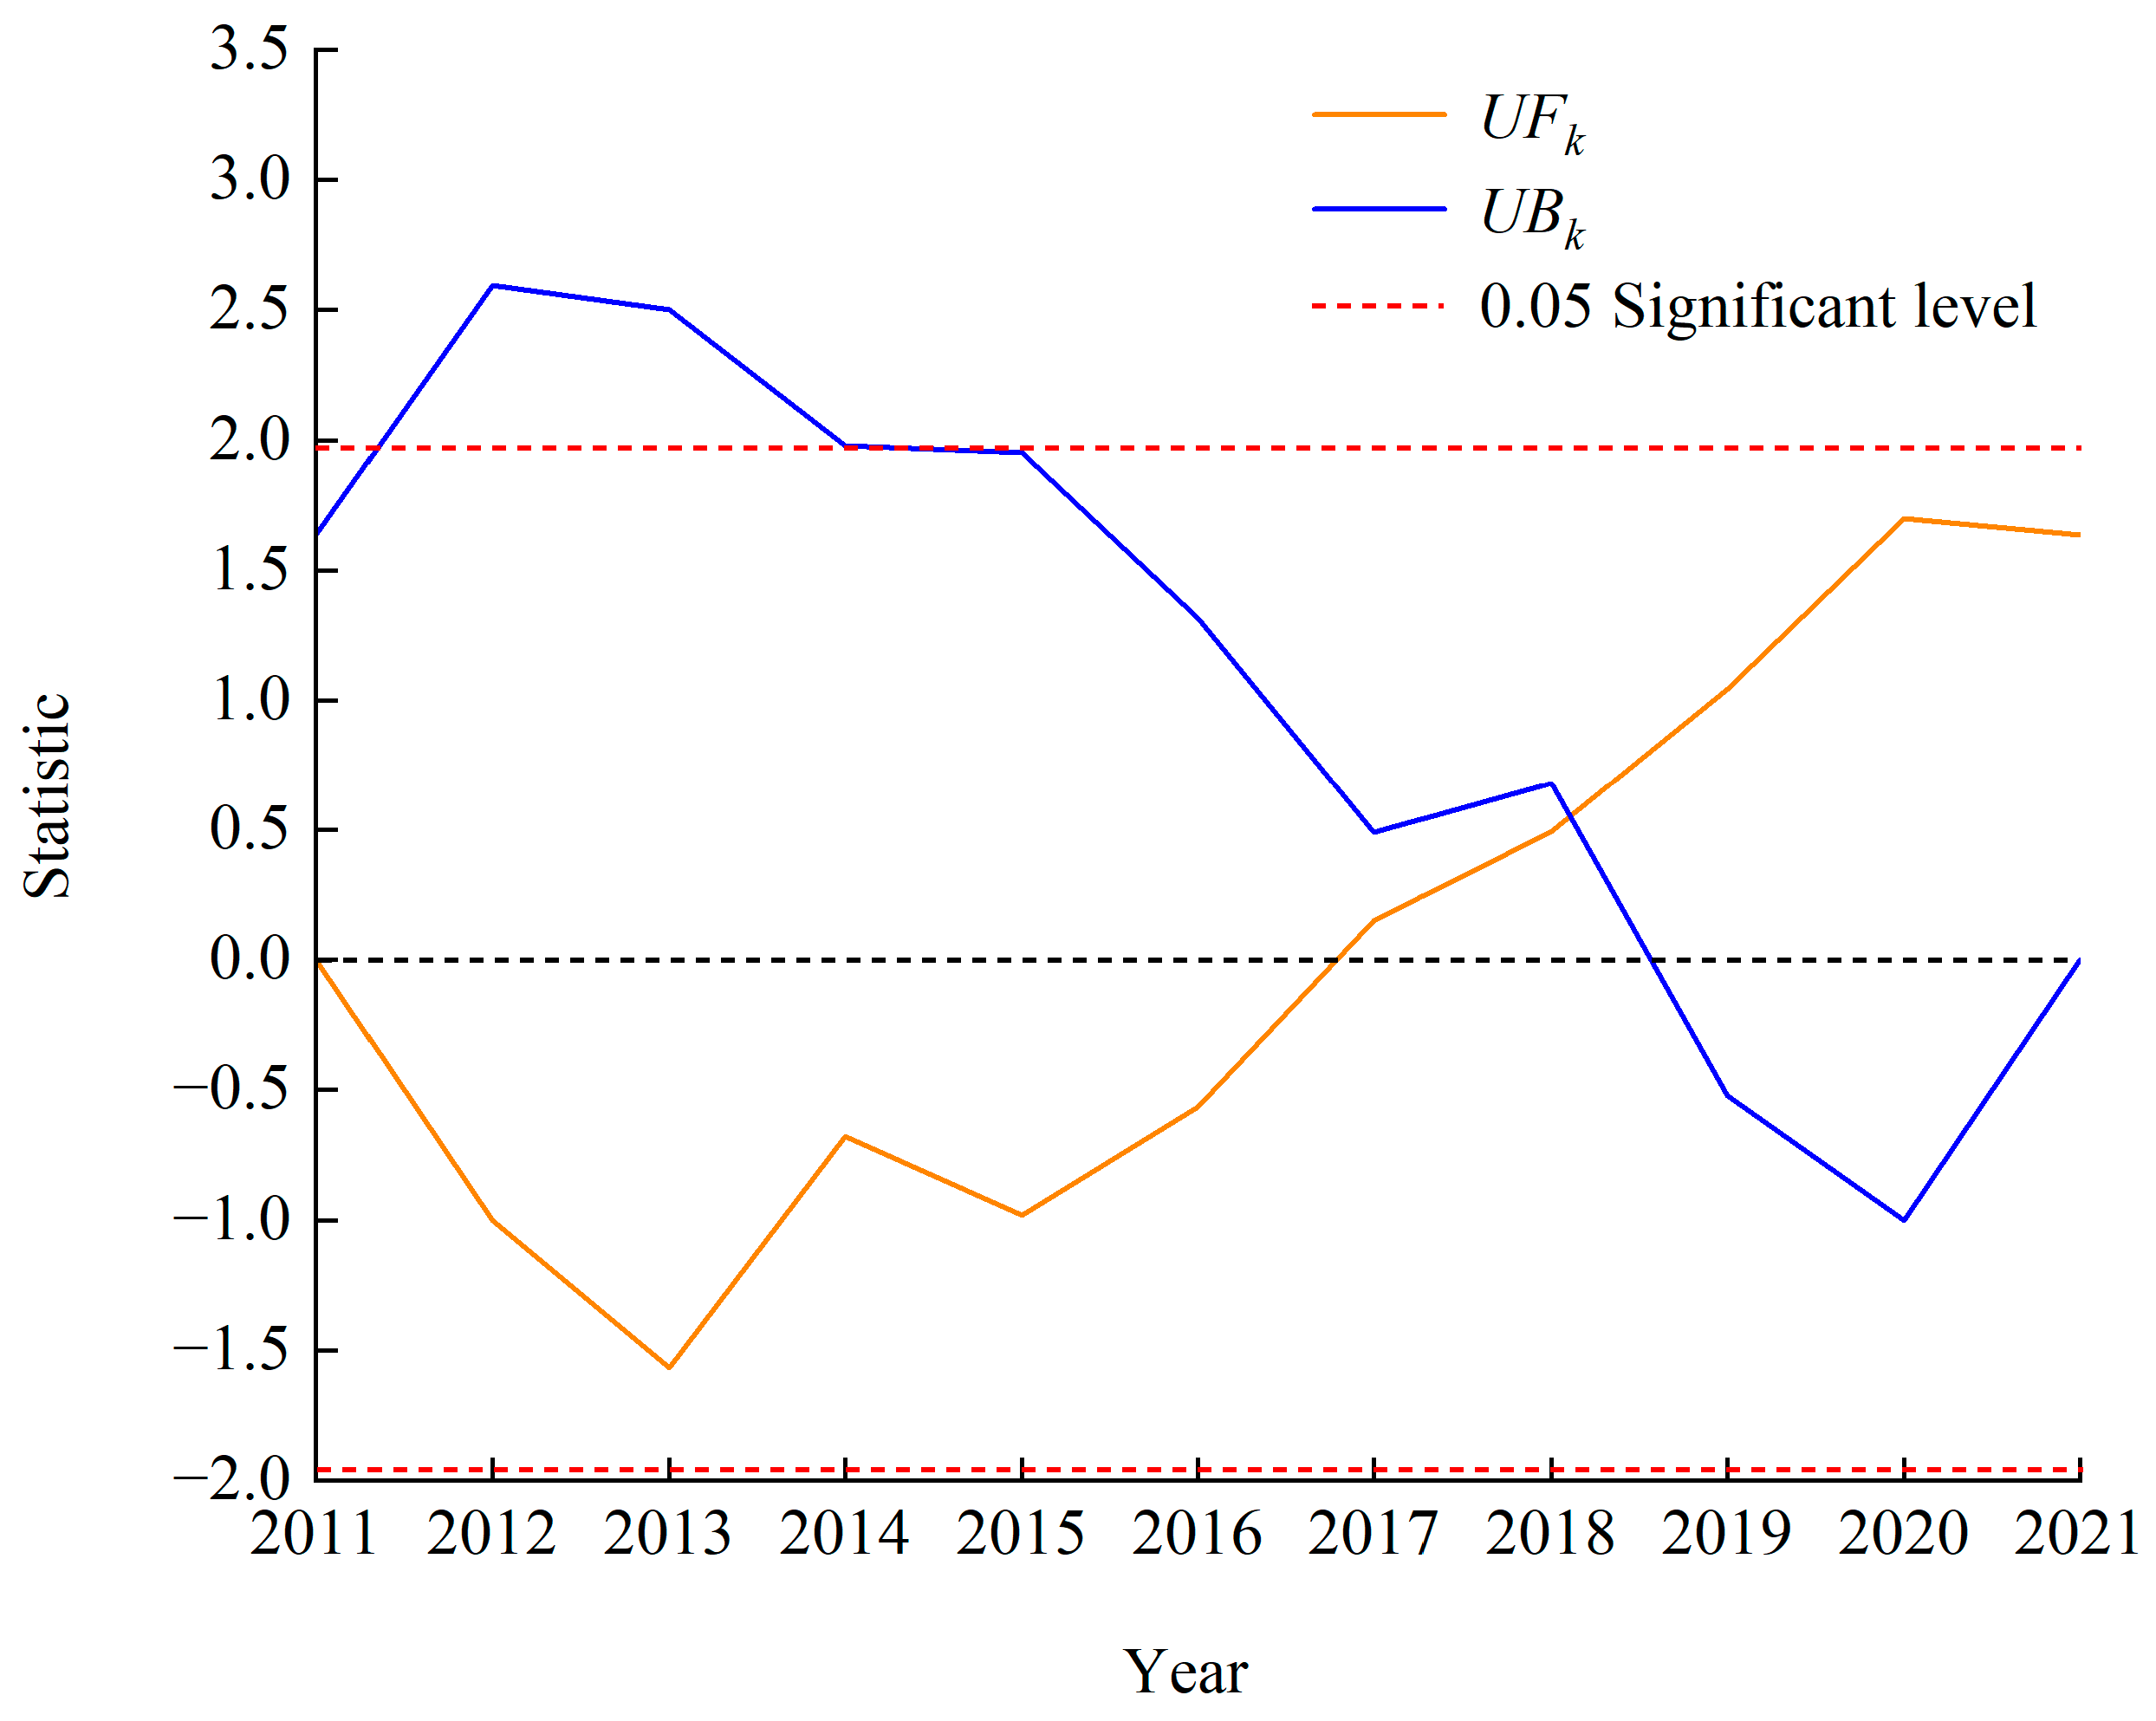
- In terms of the overall spatiotemporal variation, the center of gravity of county-level soybean yield in Heilongjiang Province moved towards the northwest over a distance of 16.82 km from 2011 to 2021. The soybean yield in the province experienced a mutation in approximately 2018, from a downward trend to an upward trend.
- In terms of the spatiotemporal hot spot distribution, the spatiotemporal hot spots of county-level soybean yield in Heilongjiang Province were concentrated along the line from Hailun to Aihui. Specifically, Hailun and Suiling were consecutive hot spots; Bei’an, Wudalianchi, Nenjiang, Aihui, Kedong, and Keshan were intensifying hot spots; Sunwu and Baiquan were sporadic hot spots and Yi’an was a new hot spot.
- In terms of the spatiotemporal agglomeration pattern, the spatiotemporal agglomeration patterns of county-level soybean yield in Heilongjiang Province included only high-high clusters, only low-low clusters, only high-low outliers and multiple types.
- In terms of the time series analysis, the temporal changes in soybean yield in various counties of Heilongjiang Province had obvious regional characteristics. There was no significant change in county-level soybean yield in the following regions: the Greater Khingan Mountains, the southern part of the Lesser Khingan Mountains, the southern part of the Songnen Plain, the Songhua River valley, and the mountainous and hilly areas of southeastern Heilongjiang Province. Meanwhile, the county-level soybean yield in the northern part of the Lesser Khingan Mountains, the central-northern part of the Songnen Plain, and the Sanjiang Plain showed a significant upward trend.
- In terms of the action mode of influencing factors, socioeconomic factors had aftereffects on soybean planting decisions. This year’s soybean production is directly affected by this year’s climatic conditions and natural disasters, as well as by this year’s and last year’s socioeconomic factors.
- In terms of the impact intensity of influencing factors, sunlight hours, the price ratio of local soybeans to local maize, average temperature, the number of soybean patents, the price ratio of imported soybeans to local soybeans, soybean cultivation income, local soybean prices, and the number of newly established soybean enterprises were the primary influencing factors. Precipitation and soybean import volume were secondary factors. The income difference between maize and soybeans, crop-hitting disaster areas, and maize yield were general influencing factors. For physical geographical factors, the impacts of sunlight hours and average temperature on soybean yield were significantly higher than those of precipitation and crop-hitting disaster areas. For socioeconomic factors, compared with scale indicators such as maize yield and soybean import volume, the soybean yield in Heilongjiang Province was more sensitive to the price ratio of local soybeans to local maize, as well as the price ratio of imported soybeans to local soybeans. The impact of these two price ratios on soybean yield in Heilongjiang Province was even higher than those of soybean cultivation income and local soybean prices. Compared to that of imported soybeans, the impact of local maize was stronger. Technology research and industrial development also had a significant positive impact on soybean yield in Heilongjiang Province. The government’s differentiated subsidy policy played an important role in stabilizing soybean production.
Author Contributions
Funding
Data Availability Statement
Acknowledgments
Conflicts of Interest
References
- Liu, Z.; Ying, H.; Chen, M.; Bai, J.; Xue, Y.; Yin, Y.; Batchelor, W.D.; Yang, Y.; Bai, Z.; Du, M.; et al. Optimization of China’s maize and soy production can ensure feed sufficiency at lower nitrogen and carbon footprints. Nat. Food 2021, 2, 426–433. [Google Scholar] [CrossRef]
- Mizuno, H.; Prodöhl, I. Mitsui Bussan and the Manchurian soybean trade: Geopolitics and economic strategies in China’s Northeast, ca. 1870s–1920s. Bus. Hist. 2023, 65, 880–901. [Google Scholar] [CrossRef]
- Hu, C. China’s soybean exports and markets in various countries in the early 20th century. J. Northeast. Norm. Univ. (Philos. Soc. Sci.) 1996, 2, 23–28. (In Chinese) [Google Scholar] [CrossRef]
- Yin, G. Reasons for the decline of soybean export trade in Northeast China (1929–1945). Agric. Archaeol. 2015, 3, 47–53. (In Chinese) [Google Scholar]
- Xie, Y. Evolution of China’s soybean trade pattern and countermeasures. Rural Econ. 2022, 10, 10–17. (In Chinese) [Google Scholar]
- Tang, P.; Chen, Z.; Liu, Z.; Yang, P.; Yao, Y. A study on spatio-temporal change of soybeans distribution in Northeast China using a cross-entropy method. Chin. J. Agric. Resour. Reg. Plan. 2018, 39, 62–73. (In Chinese) [Google Scholar] [CrossRef]
- He, G.; Zhao, Y.; Wang, L.; Jiang, S.; Zhu, Y. China’s food security challenge: Effects of food habit changes on requirements for arable land and water. J. Clean. Prod. 2019, 229, 739–750. [Google Scholar] [CrossRef]
- Chen, Y.; Jiang, Y.; Zhang, Y. Spatio-temporal evolution and influencing factors of soybean production in China. Econ. Geogr. 2022, 42, 87–94. (In Chinese) [Google Scholar] [CrossRef]
- Fares, T.M. Food security and power struggle in the Chinese ‘battle of the beans’. J. Peasant Stud. 2022, 50, 2024–2049. [Google Scholar] [CrossRef]
- Guo, T. Study on Dilemma and Way out of China’s Soybean Production; China Social Sciences Press: Beijing, China, 2017; pp. 5–7. (In Chinese) [Google Scholar]
- Assefa, Y.; Bajjalieh, N.; Archontoulis, S.; Casteel, S.; Davidson, D.; Kovács, P.; Naeve, S.; Ciampitti, I.A. Spatial characterization of soybean yield and quality (amino acids, oil, and protein) for United States. Sci. Rep. 2018, 8, 14653. [Google Scholar] [CrossRef]
- Araújo, M.L.S.d.; Sano, E.E.; Bolfe, É.L.; Santos, J.R.N.; Santos, J.S.d.; Sliva, F.B. Spatiotemporal dynamics of soybean crop in the Matopiba region, Brazil (1990–2015). Land Use Policy 2019, 80, 57–67. [Google Scholar] [CrossRef]
- Shangguan, Y.; Li, X.; Lin, Y.; Deng, J.; Yu, L. Mapping spatial-temporal nationwide soybean planting area in Argentina using Google Earth Engine. Int. J. Remote Sens. 2022, 43, 1725–1749. [Google Scholar] [CrossRef]
- Zhang, Z.; Lu, C. Clustering analysis of soybean production to understand its spatiotemporal dynamics in the North China Plain. Sustainability 2020, 12, 6178. [Google Scholar] [CrossRef]
- Hu, Q.; Xiang, M.; Chen, D.; Zhou, J.; Wu, W.; Song, Q. Global cropland intensification surpassed expansion between 2000 and 2010: A spatio-temporal analysis based on GlobeLand30. Sci. Total Environ. 2020, 746, 141035. [Google Scholar] [CrossRef]
- Cattelan, A.J.; Dall’Agnol, A. The rapid soybean growth in Brazil. OCL-Oilseeds Fats Crops Lipids 2018, 25, D102. [Google Scholar] [CrossRef]
- Song, X.; Hansen, M.C.; Potapov, P.; Adusei, B.; Pickering, J.; Adami, M.; Lima, A.; Zalles, V.; Stehman, S.V.; Di Bella, C.M.; et al. Massive soybean expansion in South America since 2000 and implications for conservation. Nat. Sustain. 2021, 4, 784–792. [Google Scholar] [CrossRef]
- Chen, W.; Zhang, B.; Kong, X.; Wen, L.; Liao, Y.; Kong, L. Soybean production and spatial agglomeration in China from 1949 to 2019. Land 2022, 11, 734. [Google Scholar] [CrossRef]
- Guo, S.; Zhang, Z.; Guo, E.; Fu, Z.; Gong, J.; Yang, X. Historical and projected impacts of climate change and technology on soybean yield in China. Agric. Syst. 2022, 203, 103522. [Google Scholar] [CrossRef]
- Nguyen, H.; Thompson, A.; Costello, C. Impacts of historical droughts on maize and soybean production in the southeastern United States. Agric. Water Manag. 2023, 281, 108237. [Google Scholar] [CrossRef]
- Vogel, J.T.; Liu, W.; Olhoft, P.; Crafts-Brandner, S.J.; Pennycooke, J.C.; Christiansen, N. Soybean yield formation physiology–A foundation for precision breeding based improvement. Front. Plant Sci. 2021, 12, 719706. [Google Scholar] [CrossRef]
- Gawęda, D.; Nowak, A.; Haliniarz, M.; Woźniak, A. Yield and economic effectiveness of soybean grown under different cropping systems. Int. J. Plant Prod. 2020, 14, 475–485. [Google Scholar] [CrossRef]
- Gao, X.; Xie, Y.; Liu, G.; Liu, B.; Duan, X. Effects of soil erosion on soybean yield as estimated by simulating gradually eroded soil profiles. Soil Tillage Res. 2015, 145, 126–134. [Google Scholar] [CrossRef]
- Wang, W.; Liu, A.; Qiang, W. Virtual land trades and external dependences of China’s soybean resources. J. Nat. Resour. 2011, 26, 1139–1147. (In Chinese) [Google Scholar]
- Yang, G. Soybean Industrial Economy in China from Industry Chain Perspective; China Agricultural University Press: Beijing, China, 2016; pp. 52–62+288. (In Chinese) [Google Scholar]
- Huang, G.; Yao, G.; Zhao, J.; Lisk, M.D.; Yu, C.; Zhang, X. The environmental and socioeconomic trade-offs of importing crops to meet domestic food demand in China. Environ. Res. Lett. 2019, 14, 094021. [Google Scholar] [CrossRef]
- Yu, J.; Qiao, J.; Gong, C. Technical progress and technical efficiency analysis of soybean production in China. J. Agrotech. Econ. 2007, 4, 41–47. (In Chinese) [Google Scholar]
- Di, Y.; You, N.; Dong, J.; Liao, X.; Song, K.; Fu, P. Recent soybean subsidy policy did not revitalize but stabilize the soybean planting areas in Northeast China. Eur. J. Agron. 2023, 147, 126841. [Google Scholar] [CrossRef]
- Li, M.; Xiong, T. Dynamic price discovery in Chinese agricultural futures markets. J. Asian Econ. 2021, 76, 101370. [Google Scholar] [CrossRef]
- Sun, J.; Yang, L.; Zhao, F.; Wu, W. Domestic dynamics of crop production in response to international food trade: Evidence from soybean imports in China. J. Land Use Sci. 2020, 15, 91–98. [Google Scholar] [CrossRef]
- Li, Q.; Liu, W.; Du, G.; Faye, B.; Wang, H.; Li, Y.; Wang, L.; Qu, S. Spatiotemporal evolution of crop planting structure in the black soil region of northeast China: A case study in Hailun County. Land 2022, 11, 785. [Google Scholar] [CrossRef]
- Rahman, S.U.; McCoy, E.; Raza, G.; Ali, Z.; Mansoor, S.; Amin, I. Improvement of soybean; A way forward transition from genetic engineering to new plant breeding technologies. Mol. Biotechnol. 2023, 65, 162–180. [Google Scholar] [CrossRef]
- Qin, P.; Wang, T.; Luo, Y. A review on plant-based proteins from soybean: Health benefits and soy product development. J. Agric. Food Res. 2022, 7, 100265. [Google Scholar] [CrossRef]
- Sentelhas, P.C.; Battisti, R.; Câmara, G.M.S.; Farias, J.R.B.; Hampf, A.C.; Nendel, C. The soybean yield gap in Brazil–magnitude, causes and possible solutions for sustainable production. J. Agric. Sci. 2015, 153, 1394–1411. [Google Scholar] [CrossRef]
- Liu, S.; Zhang, P.; Marley, B.; Liu, W. The factors affecting farmers’ soybean planting behavior in Heilongjiang Province, China. Agriculture 2019, 9, 188. [Google Scholar] [CrossRef]
- Nget, R.; Aguilar, E.A.; Cruz, P.C.S.; Reaño, C.E.; Sanchez, P.B.; Reyes, M.R.; Prasad, P.V.V. Overview of farmers’ perceptions of current status and constraints to soybean production in Ratanakiri province of Cambodia. Sustainability 2021, 13, 4433. [Google Scholar] [CrossRef]
- Notice from the Ministry of Agriculture and Rural Affairs of the People’s Republic of China on the issuance of the “Implementation Plan for the Soybean Rejuvenation Plan”. Available online: http://www.moa.gov.cn/nybgb/2019/0201903/201905/t20190525_6315395.htm (accessed on 17 June 2023).
- Warntz, W.; Neft, D. Contributions to a statistical methodology for areal distributions. J. Reg. Sci. 1960, 2, 47–66. [Google Scholar] [CrossRef]
- Li, E.; Coates, K.; Li, X.; Ye, X.; Leipnik, M. Analyzing agricultural agglomeration in China. Sustainability 2017, 9, 313. [Google Scholar] [CrossRef]
- Mann, H.B. Nonparametric tests against trend. Econometrica 1945, 13, 245–259. [Google Scholar] [CrossRef]
- Kendell, M.G. Rank Correlation Methods, 4th ed.; Charles Grrffin: London, UK, 1970; pp. 49–51. [Google Scholar]
- Sneyers, R. On the Statistical Analysis of Series of Observations; World Meteorological Organization: Geneve, Switzerland, 1990; pp. 10–14. [Google Scholar]
- Xu, J. Mathematical Methods in Contemporary Geography, 3rd ed.; Higher Education Press: Beijing, China, 2017; pp. 133–138. (In Chinese) [Google Scholar]
- Wang, J.; Zhao, J.; Li, C.; Zhu, Y.; Kang, C.; Gao, C. The spatial-temporal patterns of the impact of human activities on vegetation coverage in China from 2001 to 2015. Acta Geogr. Sin. 2019, 74, 504–519. (In Chinese) [Google Scholar] [CrossRef]
- Liu, Z.; Ding, Y.; Jiao, Y. Spatiotemporal patterns of precipitation changes and their impacts on food supply in Southwest China from 1988 to 2018: A case study in Yunnan Province. Acta Geogr. Sin. 2021, 76, 2297–2311. (In Chinese) [Google Scholar] [CrossRef]
- Hägerstrand, T. What about people in regional science? Pap. Reg. Sci. Assoc. 1970, 24, 7–21. [Google Scholar] [CrossRef]
- Visualize the space–time Cube. Available online: https://pro.arcgis.com/en/pro-app/3.0/tool-reference/space-time-pattern-mining/visualizing-cube-data.htm (accessed on 3 July 2023).
- Getis, A.; Ord, J.K. The analysis of spatial association by use of distance statistics. Geogr. Anal. 1992, 24, 189–206. [Google Scholar] [CrossRef]
- How Emerging Hot Spot Analysis Works? Available online: https://pro.arcgis.com/en/pro-app/3.0/tool-reference/space-time-pattern-mining/learnmoreemerging.htm (accessed on 8 November 2023).
- Anselin, L. Local indicators of spatial association—LISA. Geogr. Anal. 1995, 27, 93–115. [Google Scholar] [CrossRef]
- How Local Outlier Analysis Works? Available online: https://pro.arcgis.com/en/pro-app/3.0/tool-reference/space-time-pattern-mining/learnmorelocaloutlier.htm (accessed on 8 November 2023).
- Zhang, Q.; Xu, D.; Ding, Y. Spatio-temporal pattern mining of the last 40 years of drought in China based on SPEI index and spatio-temporal cube. Agric. Res. Arid Areas 2021, 39, 194–201. (In Chinese) [Google Scholar] [CrossRef]
- How Multivariate Clustering Works? Available online: https://pro.arcgis.com/en/pro-app/3.0/tool-reference/spatial-statistics/how-multivariate-clustering-works.htm (accessed on 3 July 2023).
- Deng, J. Control problems of grey systems. Syst. Control Lett. 1982, 1, 288–294. [Google Scholar] [CrossRef]
- Jiang, H.; Zhang, W.; Zhang, J.; Duan, J. The spatial pattern of transnational migrants and its influence on FDI in Africa since the 21st century. Geogr. Res. 2021, 40, 725–742. (In Chinese) [Google Scholar] [CrossRef]
- Hu, L.; Ding, Y. Crop Cultivation Science, 2nd ed.; Higher Education Press: Beijing, China, 2019; p. 251. (In Chinese) [Google Scholar]
- Jiang, L.; Li, S.; Li, X.; Zhang, L.; Du, C. Impacts of climate change on development and yield of soybean over past 30 years in Heilongjiang Province. Soybean Sci. 2011, 30, 921–926. (In Chinese) [Google Scholar]
- Wang, C.; Zhao, H.; Feng, N.; Zheng, D.; Liang, X.; Qi, D.; Huang, W. Differences in light and heat utilization efficiency and yield of soybean in two ecological zones and their response to chemical control regulators. Chin. J. Appl. Ecol. 2018, 29, 3615–3624. (In Chinese) [Google Scholar] [CrossRef]
- Yu, Z. Monographs on Crop Cultivation (North of China), 2nd ed; China Agriculture Press: Beijing, China, 2013; pp. 205–207. (In Chinese) [Google Scholar]
- Kong, X. Agricultural Economics, 2nd ed; China Renmin University Press: Beijing, China, 2019; pp. 4–5. (In Chinese) [Google Scholar]
- Du, C.; Gong, L.; Zhang, Z.; Zhao, H.; Wu, S.; Tian, B.; Zhao, F. Characteristics and effects on crop production of heat resources changes in Heilongjiang Province. Chin. J. Eco-Agric. 2018, 26, 242–252. (In Chinese) [Google Scholar] [CrossRef]
- Song, W.; Sun, S.; Wu, T.; Yang, R.; Tian, S.; Xu, C.; Jiang, B.; Yuan, S.; Hou, W.; Wu, C.; et al. Geographic distributions and the regionalization of soybean seed compositions across China. Food Res. Int. 2023, 164, 112364. [Google Scholar] [CrossRef]
- Aubert, C.; Zhu, X. The Changing Role of Soybean in China’s Food System: A Study in Its Production, Processing, Consumption and Trade; China Agriculture Press: Beijing, China, 2002; pp. 154–161. (In Chinese) [Google Scholar]
- Li, X.; Yu, L.; Peng, D.; Gong, P. A large-scale, long time-series (1984-2020) of soybean mapping with phenological features: Heilongjiang Province as a test case. Int. J. Remote Sens. 2021, 42, 7332–7356. [Google Scholar] [CrossRef]
- Pan, T.; Zhang, C.; Kuang, W.; Luo, G.; Du, G.; DeMaeyer, P.; Yin, Z. A large-scale shift of cropland structure profoundly affects grain production in the cold region of China. J. Clean. Prod. 2021, 307, 127300. [Google Scholar] [CrossRef]
- Pei, W.; Fu, Q.; Liu, D.; Li, T.; Cheng, K.; Cui, S. Study of the variation trend, abrupt behavior and relationship between climate and planting structure in a cold region of China: A case study of Heilongjiang Province. J. Water Clim. Chang. 2017, 8, 510–523. [Google Scholar] [CrossRef]
- Yan, H.; Chen, Y.; Ku, H.B. China’s soybean crisis: The logic of modernization and its discontents. J. Peasant Stud. 2016, 43, 373–395. [Google Scholar] [CrossRef]
- Hall, S.J.; Russell, A.E.; Moore, A.R. Do corn-soybean rotations enhance decomposition of soil organic matter? Plant Soil 2019, 444, 427–442. [Google Scholar] [CrossRef]
- Yang, X.; Liu, A.; Jia, P.; Xue, L. Spatial pattern and evolution mechanism of China’s soybean processing plants. J. Nat. Resour. 2019, 34, 1440–1456. (In Chinese) [Google Scholar] [CrossRef]
- Tang, Q. The decrease in soybean planting area and soybean market trend analysis in Heilongjiang Province in 2011. Agric. Outlook 2011, 5, 22–25. (In Chinese) [Google Scholar]
- Zhao, X.; Jiang, Y. Climatic characteristics of low temperature and waterlogging in spring and its influence on spring sowing in northeast China in 2013. J. Northeast Agric. Univ. 2018, 49, 50–57. (In Chinese) [Google Scholar] [CrossRef]
- Duan, W.; He, B.; Nover, D.; Fan, J.; Yang, G.; Chen, W.; Meng, H.; Liu, C. Floods and associated socioeconomic damages in China over the last century. Nat. Hazards 2016, 82, 401–413. [Google Scholar] [CrossRef]
- Wang, X. 2014 Heilongjiang Province soybean market analysis report. Heilongjiang Grain 2015, 5, 34–36. (In Chinese) [Google Scholar]
- Dai, Y. 2015 Heilongjiang Province soybean market analysis report. Heilongjiang Grain 2016, 5, 20–22. (In Chinese) [Google Scholar]
- Liu, S.; Zhang, P.; Liu, W.; He, X. Key factors affecting farmers’ choice of corn reduction under the China’s new agriculture policy in the ‘Liandaowan’ areas, Northeast China. Chin. Geogr. Sci. 2019, 29, 1039–1051. [Google Scholar] [CrossRef]
- Chen, Z.; San, X. 2018 Heilongjiang Province soybean market analysis report. Heilongjiang Grain 2019, 5, 12–15. (In Chinese) [Google Scholar]
- Zheng, Z. Current situation and related suggestions for the domestic soybean market. Heilongjiang Grain 2021, 5, 46–48. (In Chinese) [Google Scholar]
- Tan, Q.; Liu, Y.; Dai, L.; Pan, T. Shortened key growth periods of soybean observed in China under climate change. Sci. Rep. 2021, 11, 8197. [Google Scholar] [CrossRef]
- Liu, Y.; Dai, L. Modelling the impacts of climate change and crop management measures on soybean phenology in China. J. Clean. Prod. 2020, 262, 121271. [Google Scholar] [CrossRef]
- Liu, H. Empirical Research on the Chinese Soybean Industry Security; China Agricultural University Press: Beijing, China, 2016; pp. 33–35. (In Chinese) [Google Scholar]
- National Soybean Industrial Technology System. Research on Sustainable Development Strategy of Modern Agricultural Industry in China (Soybean); China Agriculture Press: Beijing, China, 2016; pp. 50–56. (In Chinese) [Google Scholar]
- Cheng, Y. Supply-side reform and Heilongjiang soybean industry development research. Soybean Sci. 2018, 37, 126–130. (In Chinese) [Google Scholar] [CrossRef]
- Li, E. The formation, evolution and innovative development of agricultural clusters in China: Case of the cluster nature of “Shouguang Mode”. Sci. Geogr. Sin. 2020, 40, 617–627. (In Chinese) [Google Scholar] [CrossRef]
- Gajić, B.; Kresović, B.; Tapanarova, A.; Životić, L.; Todorović, M. Effect of irrigation regime on yield, harvest index and water productivity of soybean grown under different precipitation conditions in a temperate environment. Agric. Water Manag. 2018, 210, 224–231. [Google Scholar] [CrossRef]
- Wang, X.; Si, W.; Feng, X.; Zhao, Q. The impacts of soybean producer subsidies on farmers’ land input decision-making? An empirical analysis based on the data of national fixed observation points in rural areas in China. China Rural Surv. 2023, 1, 20–39. (In Chinese) [Google Scholar] [CrossRef]


| Sample | Inclination β | Zc | Significance |
|---|---|---|---|
| Heilongjiang Province | 220,706.62 | 1.55 | Nonsignificant |
| Sample | Inclination β | Zc | Significance |
|---|---|---|---|
| Cluster 1 | −850.22 | −0.15 | Nonsignificant |
| Cluster 2 | 6486.7 | 2.49 | Significant increase |
| Dimension | Influencing Factors | Symbol | Description | Unit | Relationship |
|---|---|---|---|---|---|
| Climatic condition | Sunlight hours | X1 | Obtained by averaging the sunlight hours of 13 major prefecture-level cities in Heilongjiang Province from May to September. The soybean growing season in Heilongjiang Province is from May to September. | h | + |
| Average temperature | X2 | Obtained by averaging the temperatures of 13 major prefecture-level cities in Heilongjiang Province from May to September. | °C | + | |
| Precipitation | X3 | Obtained by averaging the precipitation of 13 major prefecture-level cities in Heilongjiang Province from May to September. | mm | The closer to 600 mm, the better | |
| Natural disaster | Crops-hitting disaster area | X4 | Area of crops influenced by natural disasters in Heilongjiang Province. Disaster types include drought, floods, hail, freezing and typhoons. | hm2 | − |
| Planting income | Soybean cultivation income | X5 | Obtained by subtracting cash costs from the total output value and adding soybean subsidies, representing the net income per hectare of soybean cultivation in Heilongjiang Province. | yuan/hm2 | + |
| Market condition | Local soybean prices | X6 | Average selling price of local soybeans in Heilongjiang Province each year | yuan/kg | + |
| Technology research | Number of soybean patents | X7 | The number of soybean-related patents filed in Heilongjiang Province each year | unit | + |
| Industrial development | Number of newly established soybean enterprises | X8 | The number of newly established soybean-related enterprises in Heilongjiang Province each year | unit | + |
| International trade | Soybean import volume | X9 | Soybean import volume in Heilongjiang Province each year | t | − |
| Price ratio of imported soybeans to local soybeans | X10 | Average price of imported soybeans in Heilongjiang Province/average price of local soybeans in Heilongjiang Province | % | + | |
| Competitive crop | Maize yield | X11 | Maize yield in Heilongjiang Province each year | t | − |
| Price ratio of local soybeans to local maize | X12 | Average price of local soybeans in Heilongjiang Province/average price of local maize in Heilongjiang Province | % | + | |
| Income difference between maize and soybeans | X13 | Net income per hectare of maize cultivation in Heilongjiang Province–net income per hectare of soybeans cultivation in Heilongjiang Province | yuan/hm2 | − |
| Sequence Type | Average Grey Relational Grade |
|---|---|
| Normal sequence | 0.739 |
| Misaligned sequence | 0.729 |
| Moving smooth sequence | 0.797 |
| Influencing Factors | Grey Relational Grade | Rank |
|---|---|---|
| Sunlight hours X1 | 0.915 | 1 |
| Price ratio of local soybeans to local maize X12 | 0.883 | 2 |
| Average temperature X2 | 0.874 | 3 |
| Number of soybean patents X7 | 0.863 | 4 |
| Price ratio of imported soybeans to local soybeans X10 | 0.847 | 5 |
| Soybean cultivation income X5 | 0.846 | 6 |
| Local soybean prices X6 | 0.834 | 7 |
| Number of newly established soybean enterprises X8 | 0.817 | 8 |
| Precipitation X3 | 0.758 | 9 |
| Soybean import volume X9 | 0.753 | 10 |
| Income difference between maize and soybeans X13 | 0.693 | 11 |
| Crops-hitting disaster area X4 | 0.665 | 12 |
| Maize yield X11 | 0.610 | 13 |
Disclaimer/Publisher’s Note: The statements, opinions and data contained in all publications are solely those of the individual author(s) and contributor(s) and not of MDPI and/or the editor(s). MDPI and/or the editor(s) disclaim responsibility for any injury to people or property resulting from any ideas, methods, instructions or products referred to in the content. |
© 2023 by the authors. Licensee MDPI, Basel, Switzerland. This article is an open access article distributed under the terms and conditions of the Creative Commons Attribution (CC BY) license (https://creativecommons.org/licenses/by/4.0/).
Share and Cite
Wang, T.; Ma, Y.; Luo, S. Spatiotemporal Evolution and Influencing Factors of Soybean Production in Heilongjiang Province, China. Land 2023, 12, 2090. https://doi.org/10.3390/land12122090
Wang T, Ma Y, Luo S. Spatiotemporal Evolution and Influencing Factors of Soybean Production in Heilongjiang Province, China. Land. 2023; 12(12):2090. https://doi.org/10.3390/land12122090
Chicago/Turabian StyleWang, Tianli, Yanji Ma, and Siqi Luo. 2023. "Spatiotemporal Evolution and Influencing Factors of Soybean Production in Heilongjiang Province, China" Land 12, no. 12: 2090. https://doi.org/10.3390/land12122090
APA StyleWang, T., Ma, Y., & Luo, S. (2023). Spatiotemporal Evolution and Influencing Factors of Soybean Production in Heilongjiang Province, China. Land, 12(12), 2090. https://doi.org/10.3390/land12122090