Article

Salary Satisfaction of Employees at Workplace on a Large Area of Planted Land

1
Department of Human Resource Management, School of Business and Management, Jilin University, Changchun 130012, China
2
Northeast Institute of Geography and Agroecology, Chinese Academy of Sciences, Changchun 130102, China
3
College of Forestry, Shenyang Agricultural University, Shenyang 110866, China
*
Author to whom correspondence should be addressed.
Land 2023, 12(11), 2075; https://doi.org/10.3390/land12112075
Submission received: 18 September 2023 / Revised: 14 November 2023 / Accepted: 16 November 2023 / Published: 18 November 2023

Abstract

:
Salary satisfaction (SS) perception by employees can be affected by psychological impacts from the workplace setting. Landscape attributes of green and blue spaces (GBS) may account for this effect, but relevant evidence is rarely verified. In this study, a total of 56 Chinese industrial parks were chosen as study sites, where employee satisfaction was assessed by rating facial expression scores (happy, sad, and neutral emotions) in photos obtained from social networks (Sina Weibo and Douyin). The structures of the GBSs were characterized remotely by largeness of size, height, and visible ratio of green view (GVI) in a 2 km radius buffer area around the workplace. Street view images from Baidu map were selected for estimating GVI using a pre-trained deep learning model and botanical experts evaluating woody plants’ diversity. The results indicated that SS can be estimated with the maximum likelihood analysis model against the happy score, which ranged within 8.37–18.38 (average: 13.30 ± 2.32) thousand RMB. A regression model indicated SS was lowered by a larger green space area in agreement with a reduced happy score. Further, sad scores in highland areas with tall plants and a strong depression on the happy score was associated with a greater plant diversity. Interesting from this study, the designed apparent size of green space should be considered in green space construction near a workplace to prevent perceptional decline towards SS, while blue space is irrelevant in this relationship. Similarly, the diversity of woody plants should be planned to control its negative impact on the perception of positive emotions, with plant diversity beyond a comfortable level perhaps further decreasing SS.

1. Introduction

Industrial parks account for an inevitable proportion of built-up lands in municipal regions [1,2]. An industrial park is not only a collection of corporations that shoulder regional household incomes, but also an activated source of regional heat and pollutant emissions [2]. Urban landscapes with industrial parks are usually surrounded with a planned level of surrounding green-blue spaces (GBS) to mitigate environmental contamination, which can vary in density [3,4]. Employees are major users of GBSs at workplaces [5], and nearly ~40% of them may spend time outdoors with GBSs [6]. As a part of urban nature, GBSs at workplace can be experienced as an infrastructure that provides ecosystem services and natural elements to reduce the mental stress of workers [7,8,9]. For example, office employees reported that they can perceive stress reduction at workplaces when accessing a GBS in an open outdoor space [7,8,10]. The reduced noisiness of GBSs near a workplace may influence the overall perception of employee well-being [7,11]. Thus, it is worthy to determine the mechanisms for promoting mental health and well-being through the landscape planning of GBS near workplaces.
People perceive the natural and planned world in a variety of ways. An overall configuration of GBSs is more perceptible as a mental health promotion than any single landscape metric [12,13]. For community-level landscapes, the aggregation of neighborhood GBSs has a greater impact on social cohesion and perceived happiness than any specific metrics such as building size, complexity, and fragmentation [14]. Agglomerated public-space landscapes and associated GBSs (e.g., ≤9 ha) that overlap a dense road network can be perceived as benefits by people for cooling comfort and promoted mental well-being [12,15,16]. Urban park visitors perceive mental well-being due to the awareness of experiences with landscape metrics of largeness [17,18], elevation [19,20], and location [21]. The human–biodiversity interaction may account for these benefits through delivering an experience with various species in nature that provide gains in perceived well-being [22]. Plant biodiversity in green spaces likewise affect subjective well-being [23,24]. Species diversity in blue spaces was also reported by perceived stress reduction [25,26]. The current methodology for assessing plant diversity in urban GBSs includes in situ investigation [27], evaluation from a tree inventory [28], and a literature review [24]. The geographical range of diversity in GBSs has been investigated from a local stand to national [24] and global scales [28]. However, the range of human population for subjects’ sampling has not matched these investigative scales. This is mainly because of limits in conventional methodology for data collection to assess mental perception.
The green view index (GVI) was created to evaluate the visible proportion to account for the dose of green nature in a street view [29,30]. It is a flexible parameter that can be estimated using images such as street view images [31,32]. Deep learning as a method has been well established for rating GVI from street view photos taken at locations around urban ecological infrastructures [30,33]. These, in conjunction with place-based coordinates, can be used to locate points of interest (POI) in urban surface features. The ability to integrate programed data collection (e.g., crawling) is helpful for efficiently pooling a set of digital photos, which can be further combined with plant diversity data. The urban nature that residents can sense (e.g., through touch, sound, smell, sight, and maybe taste) is a way of perceiving GBS. These perceptions can vary by location and level of urban greening. A street view photo that can be used for rating GVI can also be a source of plant diversity data that accounts for the green color. To our knowledge, these novel techniques have rarely been used for detecting the possible driving forces of GBSs that affect the mental well-being of employees in industrial parks.
The Stress Reduction Theory (SRT) indicates that an experience with nature can reduce mental stress and evoke a restoration [34]. This suggests that highly stressed people, such as employees, are a typical population who can gain perceived restoration from stress reduction. A continuous expenditure of direct attention through work affairs results in mental fatigue and a perceivable decline in well-being [35,36]. The Attention Recovery Theory (ART) asserts that exposure to natural environments encourages more effortless brain function, thereby allowing it to recover and replenish its directed attention capacity [37,38]. According to these two theories, people who are frequently exposed to GBSs can obtain promoted health and well-being [39,40]. Exposure to GBSs means a closeness with nature, which has several benefits for visitors, including but not limited to better social interaction [41], solid social cohesion [42], improvements in psychological state [18,21,41], and improved physical health [43]. These benefits result from ecosystem services provided by GBSs through mitigating air pollution [44,45,46], cooling the surrounding temperature [47], and adjusting the regional climate [19]. Studies using facial expression scores have fully identified these positive effects with more details about the involvement of driving forces, such as landscape metrics [17,18,20,21], plant diversity [24], regional climate [19,48,49], and air quality [44,45,46]. These parameters are also recommended for testing the SRT and ART effects on the emotional perceptions of employees exposed to GBSs at their workplace.
Salary satisfaction results from perceptions against depression or disparity about salary, which is a critical issue that attracts concerns in the evaluation of employees’ work quality [50,51]. Salary dissatisfaction is evoked from the accumulation of negative emotions in association with job insecurity [52,53]. Dissatisfaction about salary may even lead to serious psychological disorders and mental diseases [51,54,55]. Conventional evaluations of salary satisfaction depend mainly on data collected from questionnaire-based surveys that are highly labor- and time-dependent [56,57]. This methodology has several limits that hinder the estimation accuracy from a desired level. Firstly, human bias cannot be avoided when a subject is reporting with a direct attention either by their inability to accurately rank and sometimes though paid respondents that just complete the work with little thought for answering [34]. Occupation-related mental fatigue is a common response of employees which highly impacts their subjective well-being and satisfaction about income [35,36]. Secondly, workers may inhibit their true feelings and concerns by subjective self-reserves according to the norms and values required in a group [34]. In a cohort of workers, everyone can clearly recognize the individual role in a project and attach subjective well-being to the cohesion with leadership [36,58]. In this social relationship frame, self-reported scores by employees are of high suspicion for their accuracy. Finally, many questionnaires have been designed and used without a formal process of validation [59]. Because of these drawbacks, questionnaire-based surveys are a challenge for collecting useful for data in a large-scale investigation with a big cohort of subjects recruited. This is a reason why most of the current studies using questionnaires can draw conclusions from one or a small number of industrial parks [7,8,9]. It is necessary to employ new methods and techniques for data collection, such as the evaluation of salary satisfaction.
Salary satisfaction results from emotions towards occupational experiences. Emotion is variable and fluctuates following subjective perceptions towards work affairs that may impact employees’ perceptions and reduce their salary satisfaction [60]. Efforts have been made to quantify emotional responses to salary satisfaction [60,61,62]. Compared to self-reported emotional state, workers expose their emotions more directly through facial expressions [63,64]. Facial photos or selfies are the major sources of facial expression data which can be used for assessing spontaneous emotions (facial expressions exposed without awareness of being photographed) [65,66,67] or posed emotions (facial expressions exposed with a conscious intention) [19,44,45]. Self-reported perceptions can unlikely be spontaneous with regard to self-reported perceptions of salary, because the respondent is fully conscious about purpose and consequence when giving a reply [56,68,69]. When emotions are exposed without any clear guidance, they can be characterized to be spontaneous. These together suggest that salary satisfaction can be estimated by modeling against facial expression scores. Spontaneous expressions are recommended firstly as independent variables for estimation, but posed emotions can also be used if the intention to pose a face is irrelevant from the awareness of its use in an academic study.
Current lives are closely twisted with time spent on social networks (SNs), where users express their emotions by posting facial photos towards life episodes [70,71]. An SN user can choose to post photos in accordance with geographical information at the check-in location. This activates a probability for further analysis by matching data derived from the photo and the real-time location [63,64]. As a type of SN user, employees also have a habit to use twitter micro-blogs on SNs to expose their sentiments towards working affairs [72]. Hence, a big number of workers’ facial photos have been pooled on SNs, which can be used to quantify sentiments therein, estimate salary satisfaction, and perform regression against the landscape metrics of GBSs at workplaces. To the best of our knowledge, it is very rare to document a study that analyzes all these responses and detects their relationships.
In this study, east China was selected as the study area, where a total of 56 industrial parks were chosen as study plots. Salary satisfaction was evaluated using model regression against facial expression scores. The regional GBS landscape was analyzed remotely using the digital data of satellite imageries, and GVI and plant diversity were analyzed using data crawling, deep learning, and artificial recognition. Our objective was to model salary satisfaction using the rated facial expression scores of employees. We also aimed to detect regressed levels of facial expression scores and salary satisfaction against the driving forces of combined GBS landscape metrics, GVI, and visual plant diversity using regressing models.

2. Materials and Methods

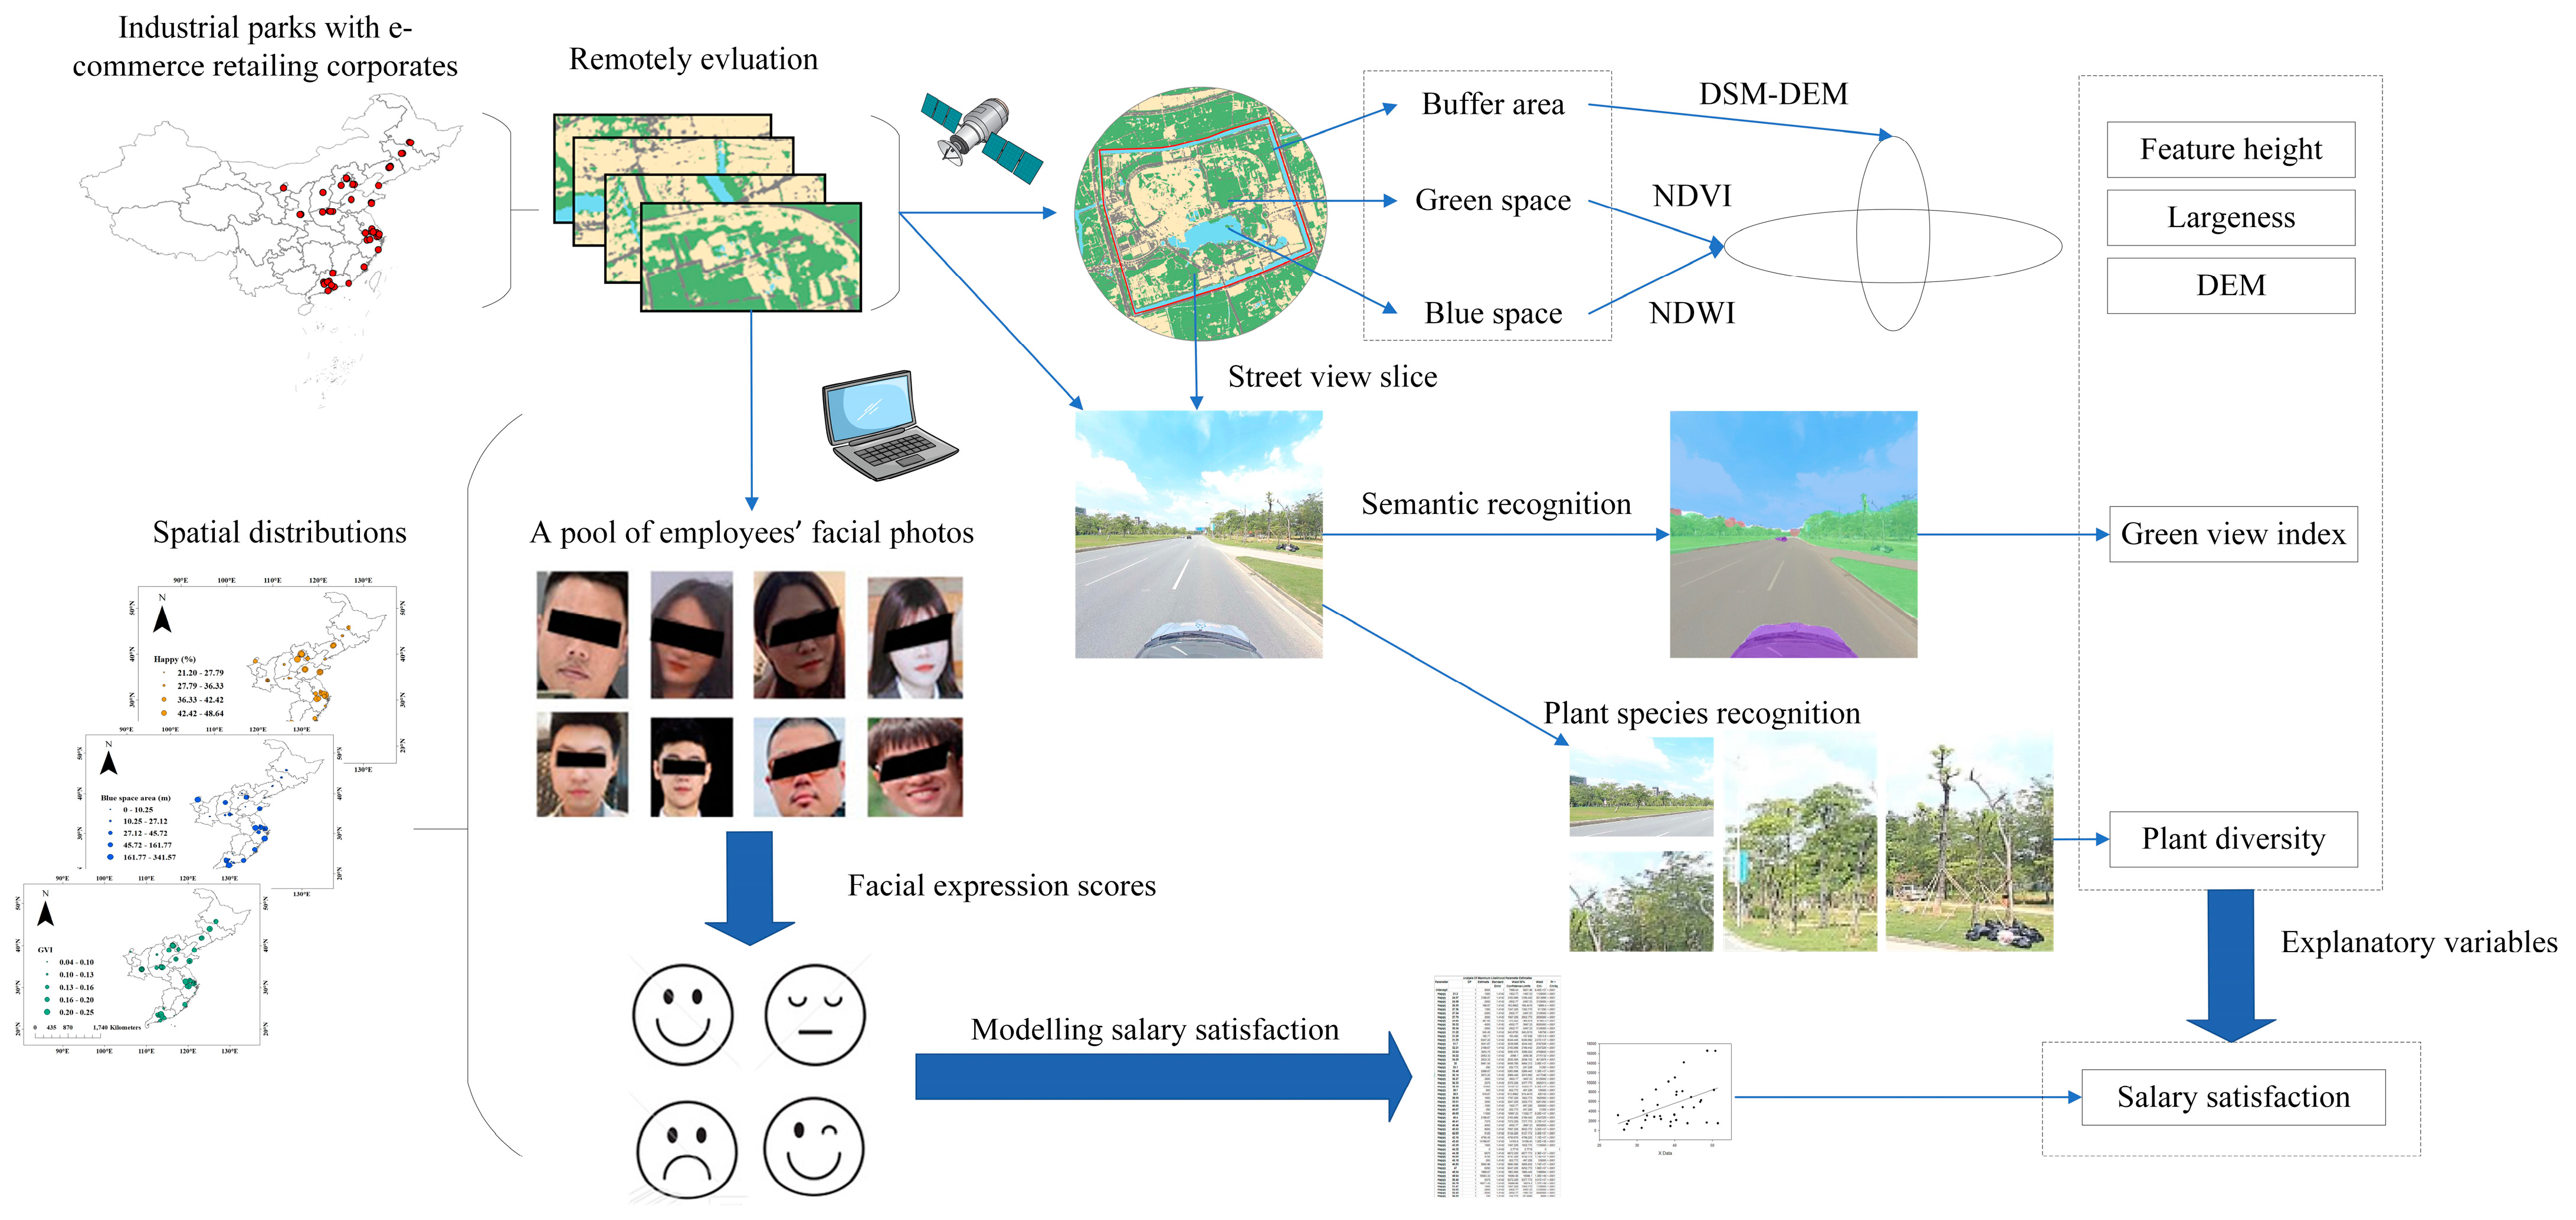
2.1. Study Design and Layout

The study layout and explanatory and dependent variables are all shown in Figure 1. Industrial parks with business corporations were selected as the study plots across an area of east China. Landscape metrics for GBSs in industrial parks were chosen as the explanatory variables, which were evaluated remotely using satellite imageries. The spatial range of every industrial park was framed to a buffer area, wherein landscape metrics were evaluated for green space, blue space, and the general buffer zone containing all surface features. Plant diversity was recognized artificially by a professional group of botanical experts for evaluating GVI. Dependent variables were chosen as exposed emotions assessed through facial expression scores and recruitment wage. Facial photos were obtained from a social network platform at the locations of the objective industrial parks on working days. Facial expressions were recognized and rated with emotional scores. Hence, the recruitment wage was modelled against the facial expression scores, which resulted in evaluations of salary satisfaction. The estimated values of salary satisfaction were further regressed against all the landscape metrics as explanatory variables.

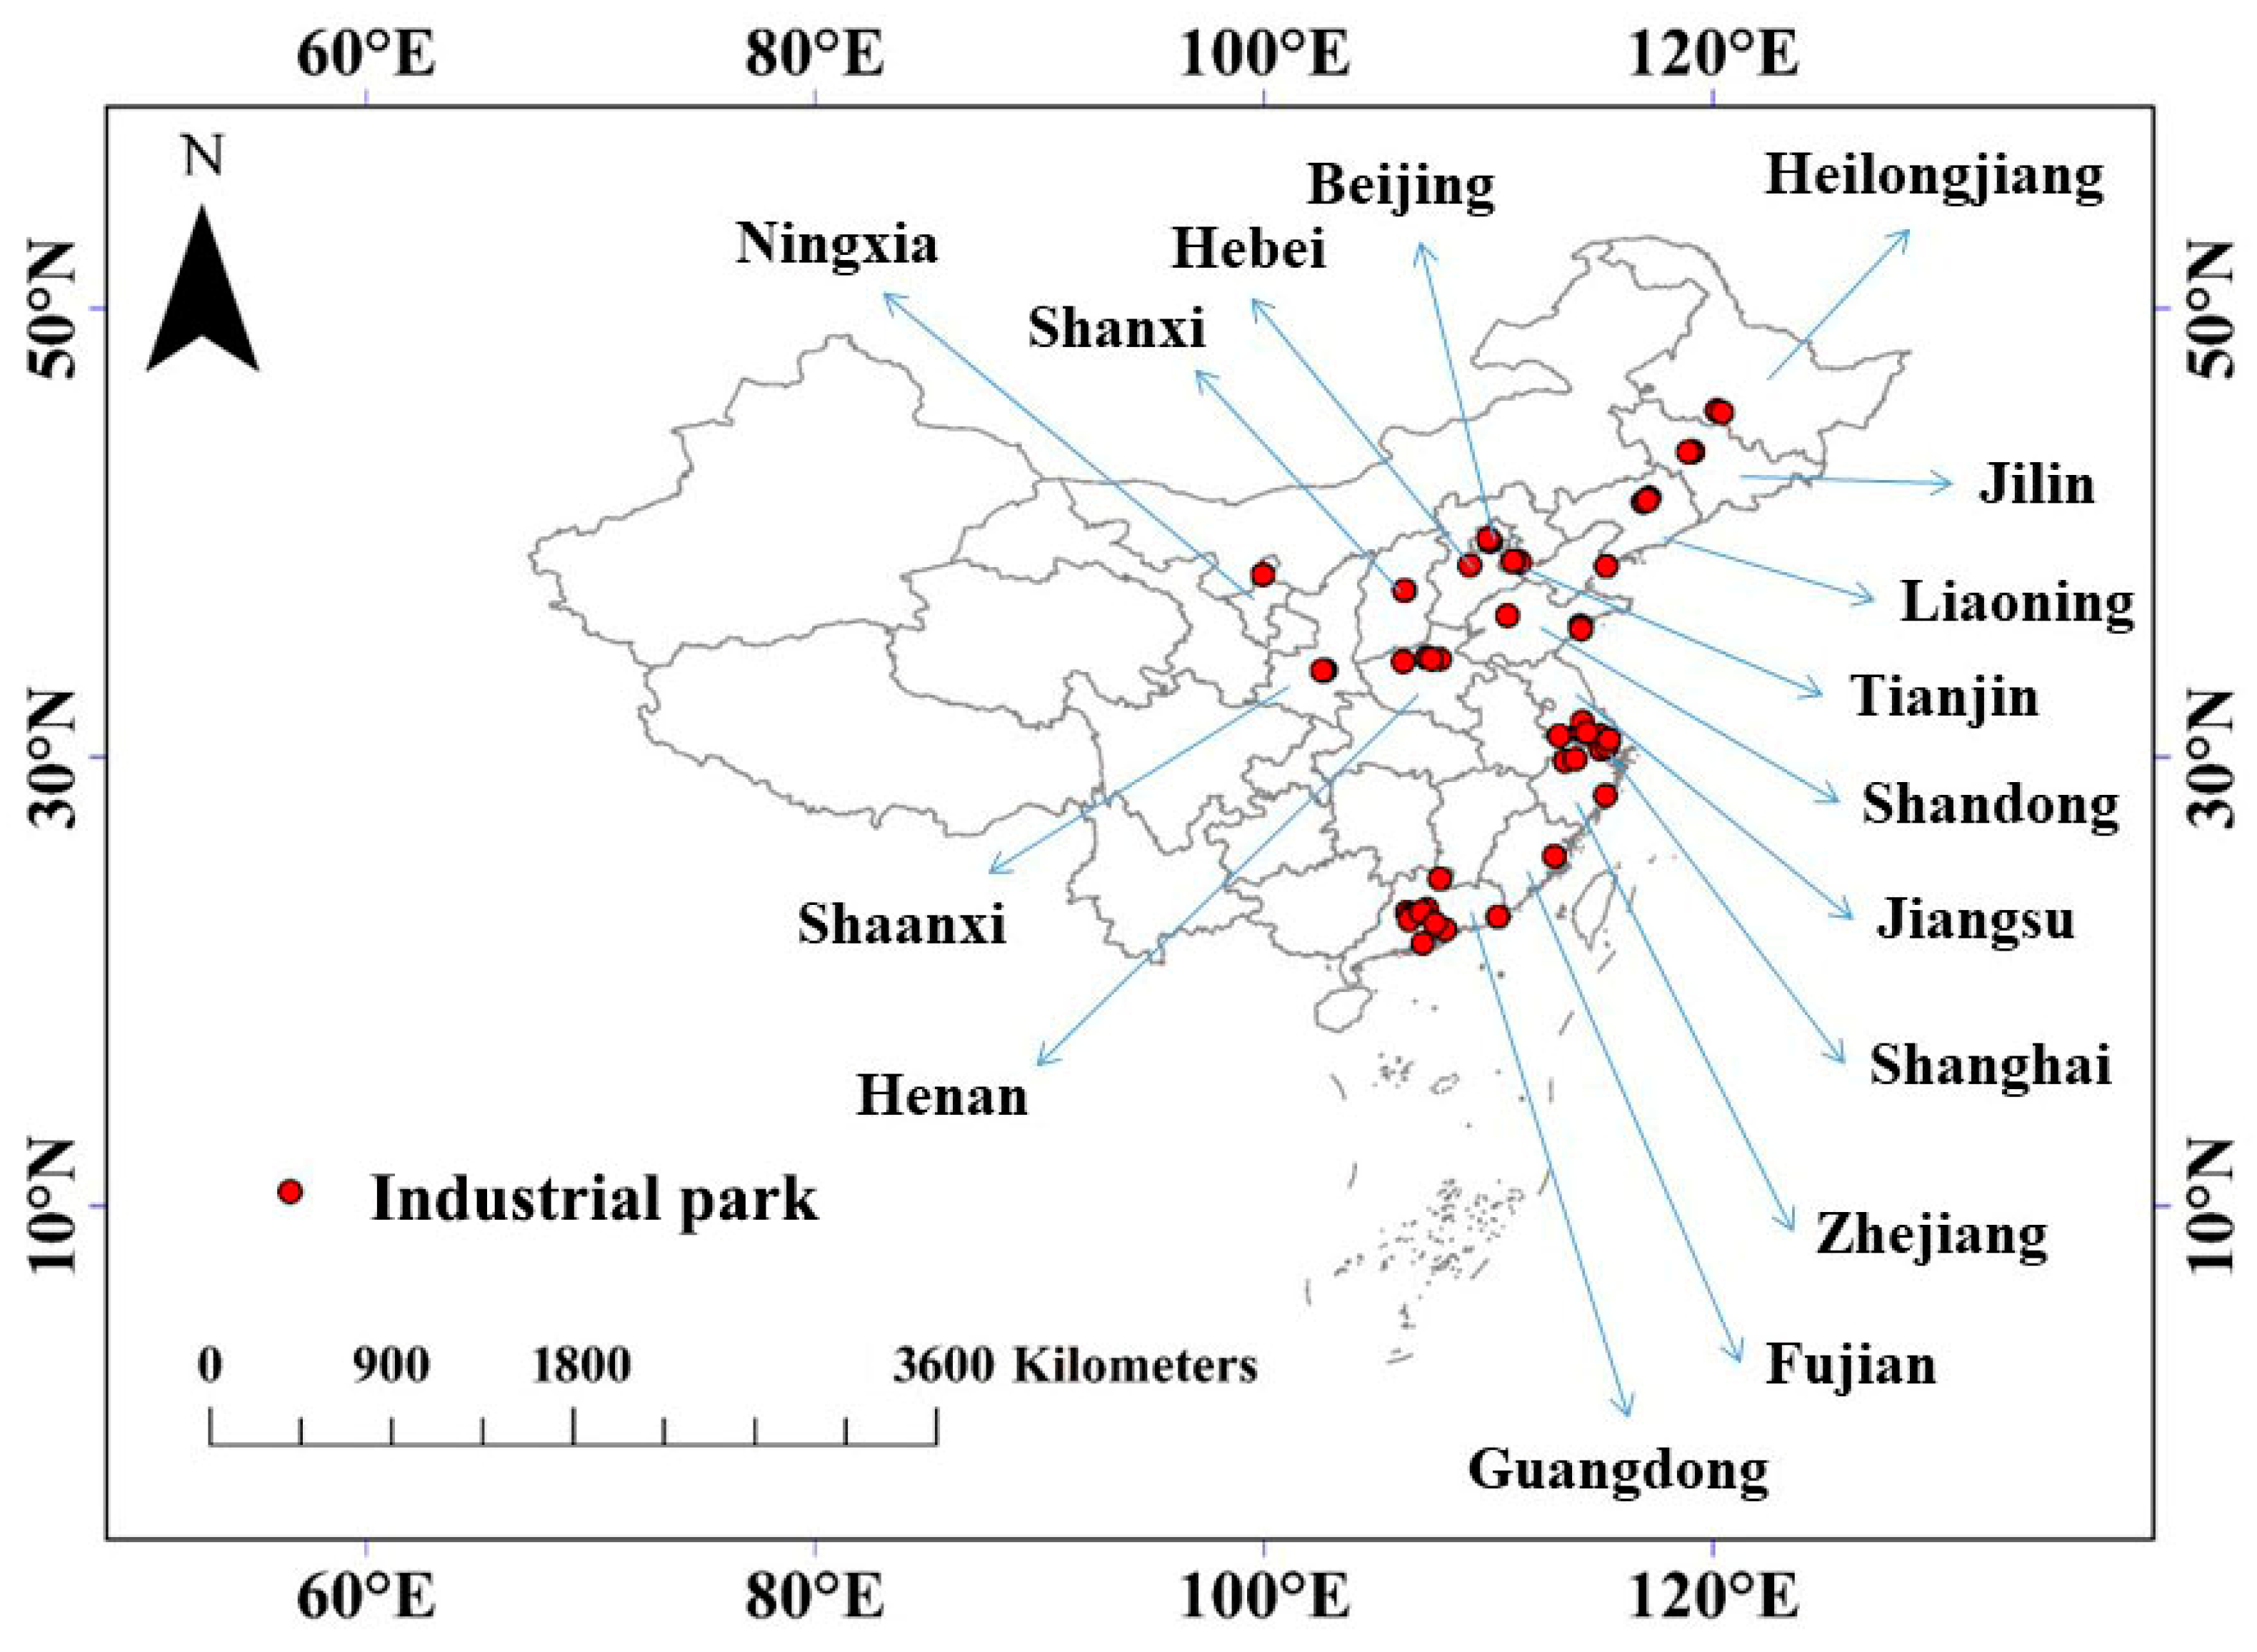
2.2. Study Area and Sampling Plots

East China was chosen as the study area, where a total of 56 industrial parks were selected from 16 provincial regions (3 municipalities of Beijing, Tianjin, and Shanghai and 13 provinces of Ningxia, Shanxi, Hebei, Heilongjiang, Jilin, Liaoning, Shandong, Jiangsu, Zhejiang, Fujian, Guangdong, Henan, and Shaanxi). Figure 2 shows the spatial distributions of the locations for the 56 industrial parks. The specific names and coordinates are shown in Table 1. Cities in east China have experienced fast urbanization in recent decades, and they account for the major body of gross domestic product (GDP) in China [44,45]. According to Meng et al. (2022) [2], most of the chosen industrial parks made a big contribution to regional heat island effects. Local employees may perceive remarkable positive emotions due to the cooling effect [15]. The chosen industrial parks stationed businesses with e-commercial retails, mainly in high-tech and big-scale manufacture industrials. Businesses in these industrial parks also recruited positions with high levels of wage in their host regions.

2.3. Facial Images and Emotional Scores

The ethical norm for employing facial photos of human subjects was reviewed and approved by the Ethic Review Committee of Ice and Snow Tourism Resorts Equipment and Intelligent Service Technology, Ministry of Culture and Tourism of The People’s Republic of China. All photos were obtained from open twitters on social networks, which were posted to the public with full awareness of their users. Human-related data were obtained and analyzed only as numeric values that were used in this study without any consent or permission to be released to any third parties, to avoid the potential release of biological information attached to the subjects’ faces and their personal privacy.
A rule was set for selecting industrial parks that the number of employees’ facial photos had to be at least 100 during working times in the days from 1 January 2020 to 31 July 2023. Thus, the period for photo searching was as long as 3.58 years, which is much longer than most of the current studies collecting photos from urban parks [19,21,24,45]. This procedure was conducted due to three reasons. Firstly, photos taken by people at workplaces during working times were much fewer than those taken in open urban parks, and the collection period was long enough that the number of photos could be met. Secondly, we aimed to conduct a national investigation that covered a geographical range of most provinces or municipalities in east China, and the number of photos for a single industrial park should be more than 100 according to current evidence [18,45,48]. Any shorter time of photo collection failed to fulfill the total number of photos. Finally, most times during 2020–2022 fell in episodes of the COVID-19 pandemic, which reduced the number of workers in industrial parks due to lockdowns.
Sina Weibo (or namely Chinese twitter) [73] and Douyin (also being aware of Chinese Tik Tok) [74] were used as social networks for photo collection. Sina Weibo is a twittering platform where photos could be obtained from the micro-blogs of users with the time and place exposed when the photos were posted [63,64]. Douyin is an online platform where users share short videos on their private pages but open updates where date and place are also available (if no privacy ban was set by the user). Micro-videos downloaded from Douyin were evenly cut to 10–20 sliced photos according to the total time used. In this study, all targeted photos that were documented had to follow all of the following rules:
(1)
All photos had to be taken at the places in any IP listed in Table 1 and the time had to be from 08:00 a.m. to 21:00 p.m. from Monday to Friday every week, excluding holidays and sudden events.
(2)
A photo had to contain at least one intact human face with all sensing organs fully exposed.
(3)
Any photos with extremely high and low ages of people, who looked too young (e.g., toddlers and infants) or too old (e.g., senior citizens with visible disabilities), were excluded, because these people were unlikely workers.
The photos were firstly cropped to make sure only a face of one person left therein, which accounted for about 75% of the whole projected area. Thereafter, the photos were rotated to make the nose axis vertical to the horizontal line to ensure a high recognition rate by the software [45,66,67]. All the prepared photos (initial n = 5600, 100 photos per IP) were sent to be analyzed for facial expression scores. The FireFACE ver 1.0 software (Hainan Guanzhong A&F Inc., Sanya, China) was used to rate happy, sad, and neutral emotional scores with the positive response index (i.e., happy score minus sad score) calculated. This instrument has been validated to identify that its recognition accuracies for happy and sad emotional scores can be fully accepted in comparison to all similar instruments [75]. The FireFACE ver 1.0 software has been successfully used in studies testing the facial expression scores of visitors experiencing GBSs in urban parks at multiple geographical scales [21,24,44,45].
Finally, a total of 973 photos failed to be recognized by the software, leaving another 4627 photos successfully rated for emotional scores. The recovery rate of available recognitions was 82.63%. As it is shown in Table 1, the generated dataset contained a data pool of photo numbers to range within 40–98 individuals per industrial park with an average of 82.63 ± 8.68 (±standard error) individuals and a coefficient of variance (CV) of 0.11. Even the minimum number of photos per industrial park was similar or higher than that in other studies (>40) at regional scales [20,48,49,76]. Overall, our facial expression scores can be accepted for further analysis.

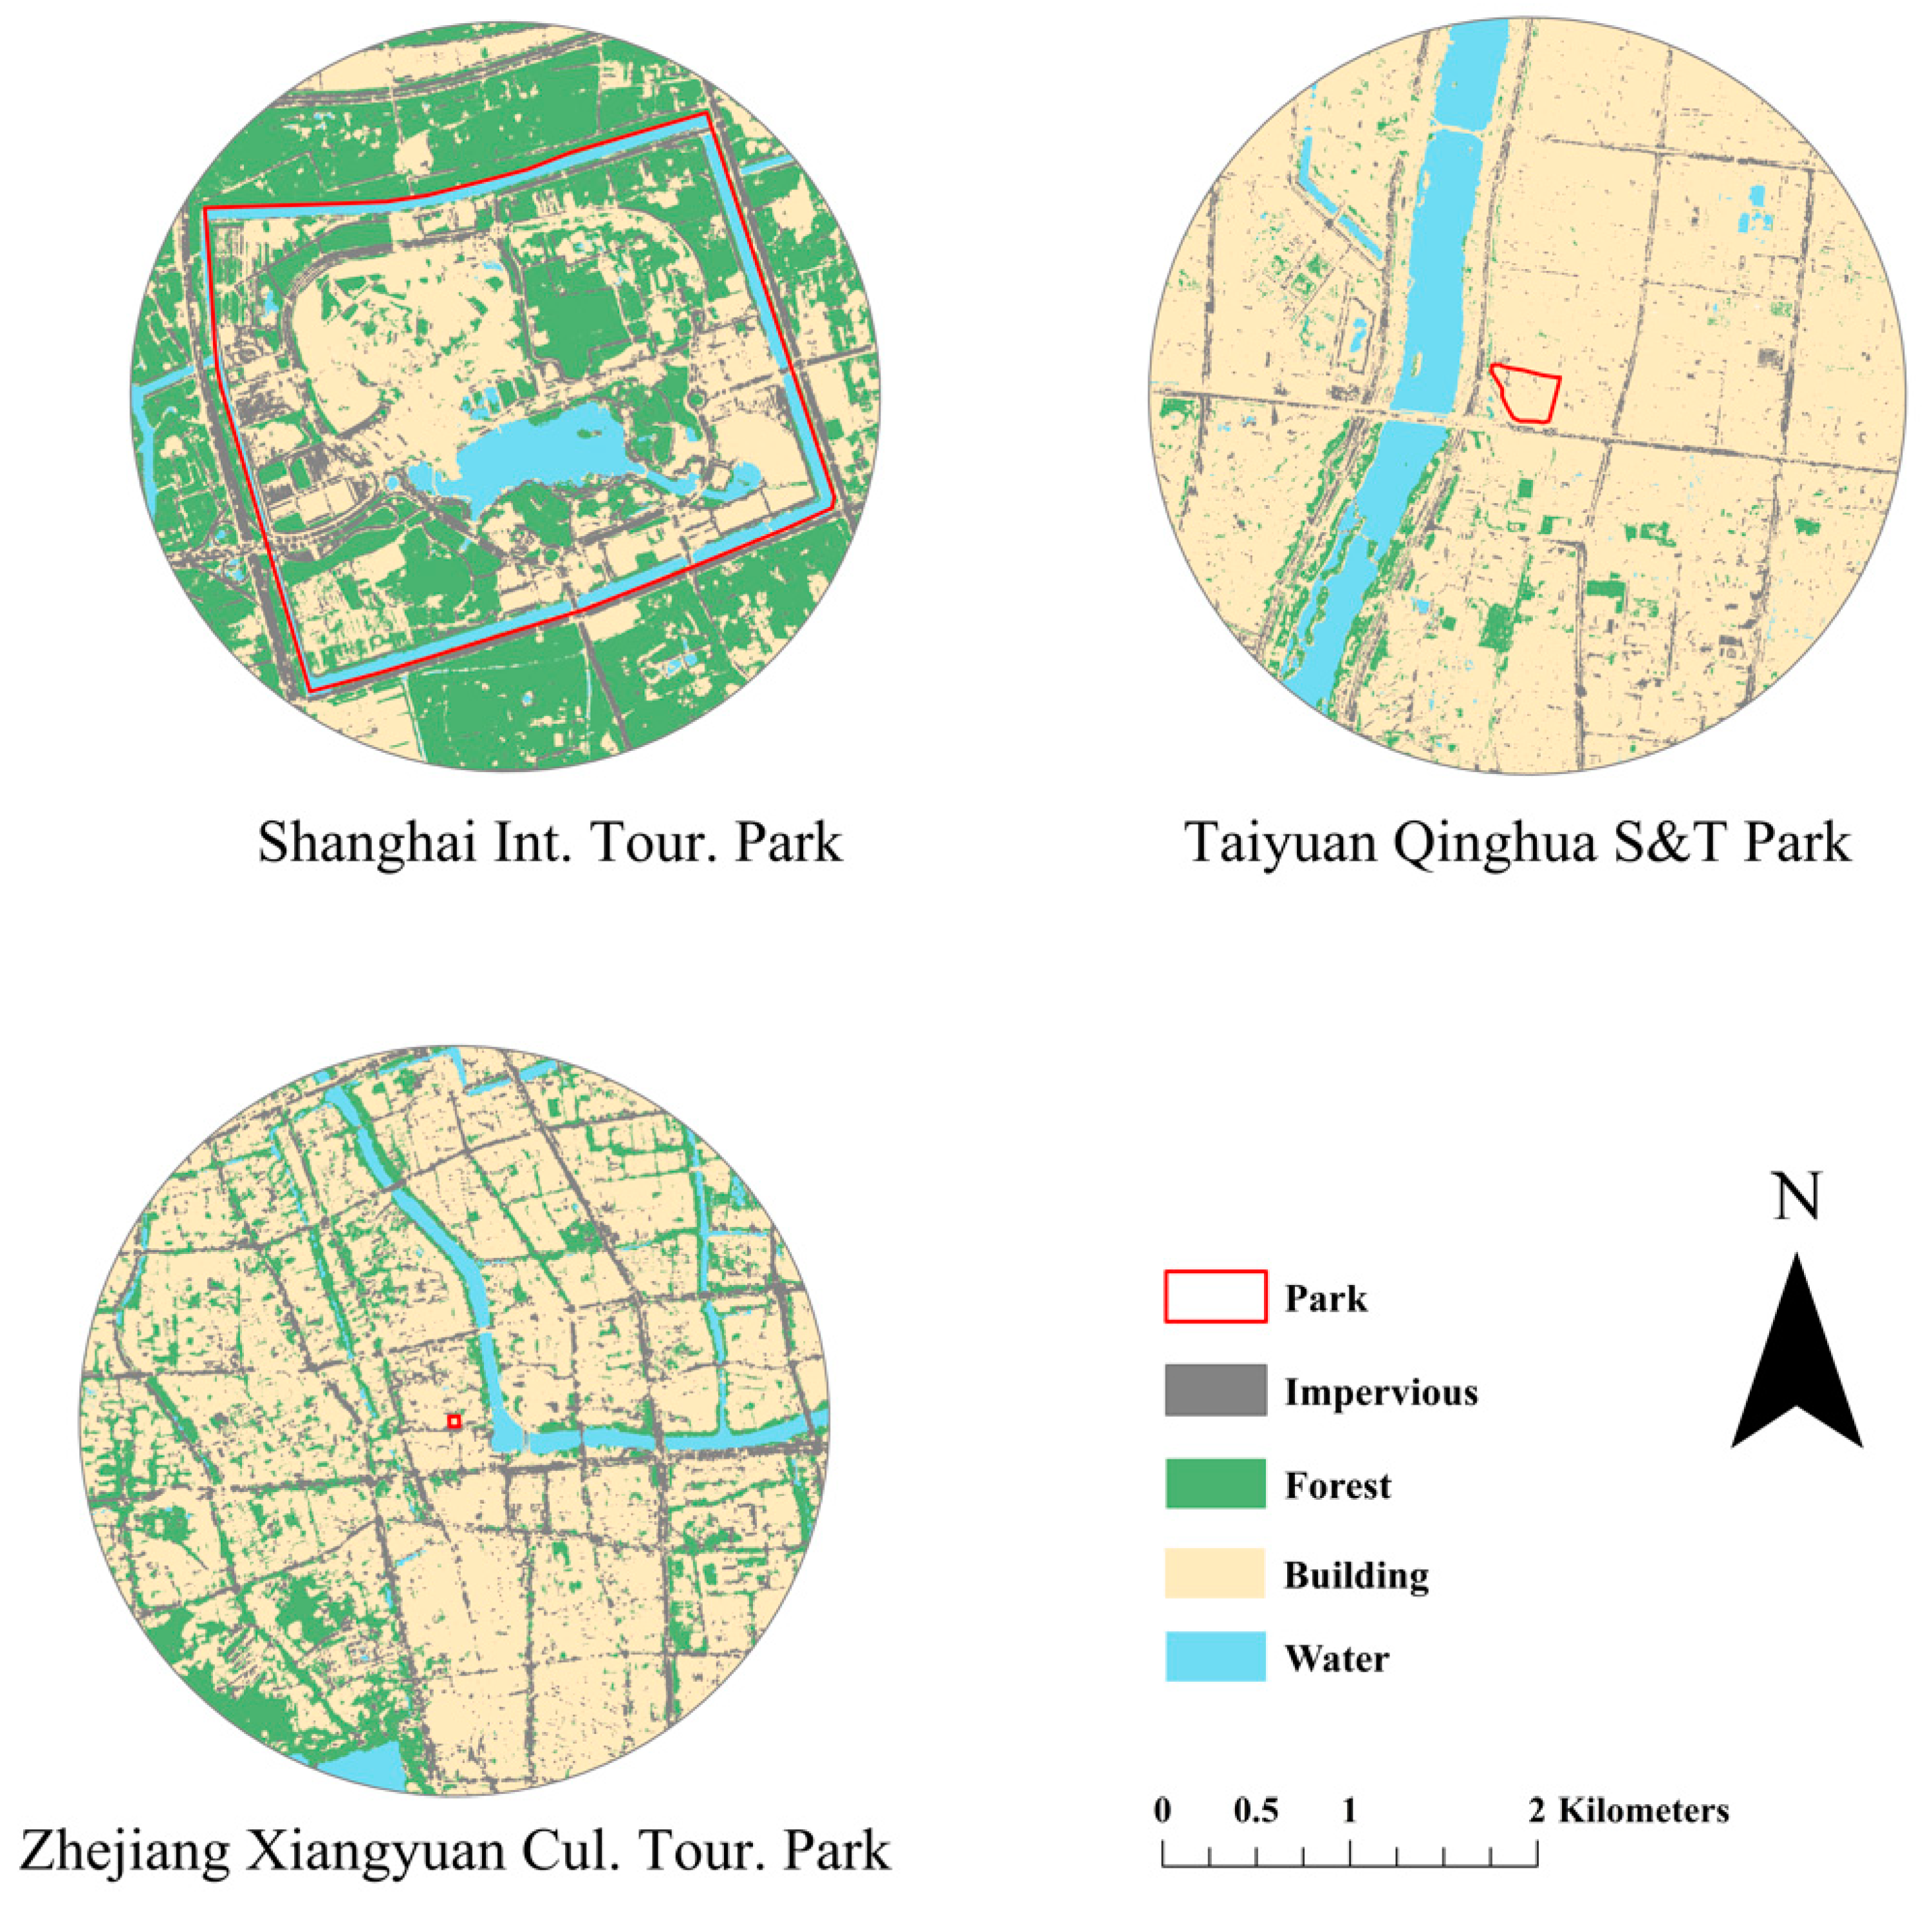
2.4. Remote Evaluation of Green and Blue Space Landscape Metrics

All the industrial parks were outlined in ArcGIS software (version 10.2, Esri-Branch, Shanghai, China). Shanghai International Tourism Park had the largest radius of an approximate square (~2 km) and Zhejiang Xiangyuan Cultural Tourism Park had the lowest (~30 m). A buffer area was set for every industrial park area with a circling buffer in a radius of 2 km, as this is used as a common geographical criterion for outlining GBS areas (Figure 3).
Landsat 8 OLI satellite imageries (30 m × 30 m) were used for the GBS landscape analysis. Green space area was evaluated as the largeness of the normalized difference vegetation index (NDVI) that was calculated as [77,78]:
N D V I = B a n d n i B a n d r e d B a n d n i + B a n d r e d
where Bandni and Bandred are surface reflections at the near-infrared and red bands, respectively. Blue space area was evaluated as the largeness of the normalized difference water index (NDWI) that was calculated as [79]:
N D W I = B a n d g r e e n B a n d n i B a n d g r e e n + B a n d n i
where Bandgreen is the surface reflection at the green band. Elevation was evaluated using the data of the digital elevational model (DEM) from the Aster GDEM 30M map [80]. The height of the tallest surface feature was evaluated using the data of the digital surface model (DSM) using the AW3D30 DSM map [81].The heights of the mapped surface features were evaluated from the averages of a layer superimposing the DSM data onto the DEM data [82].

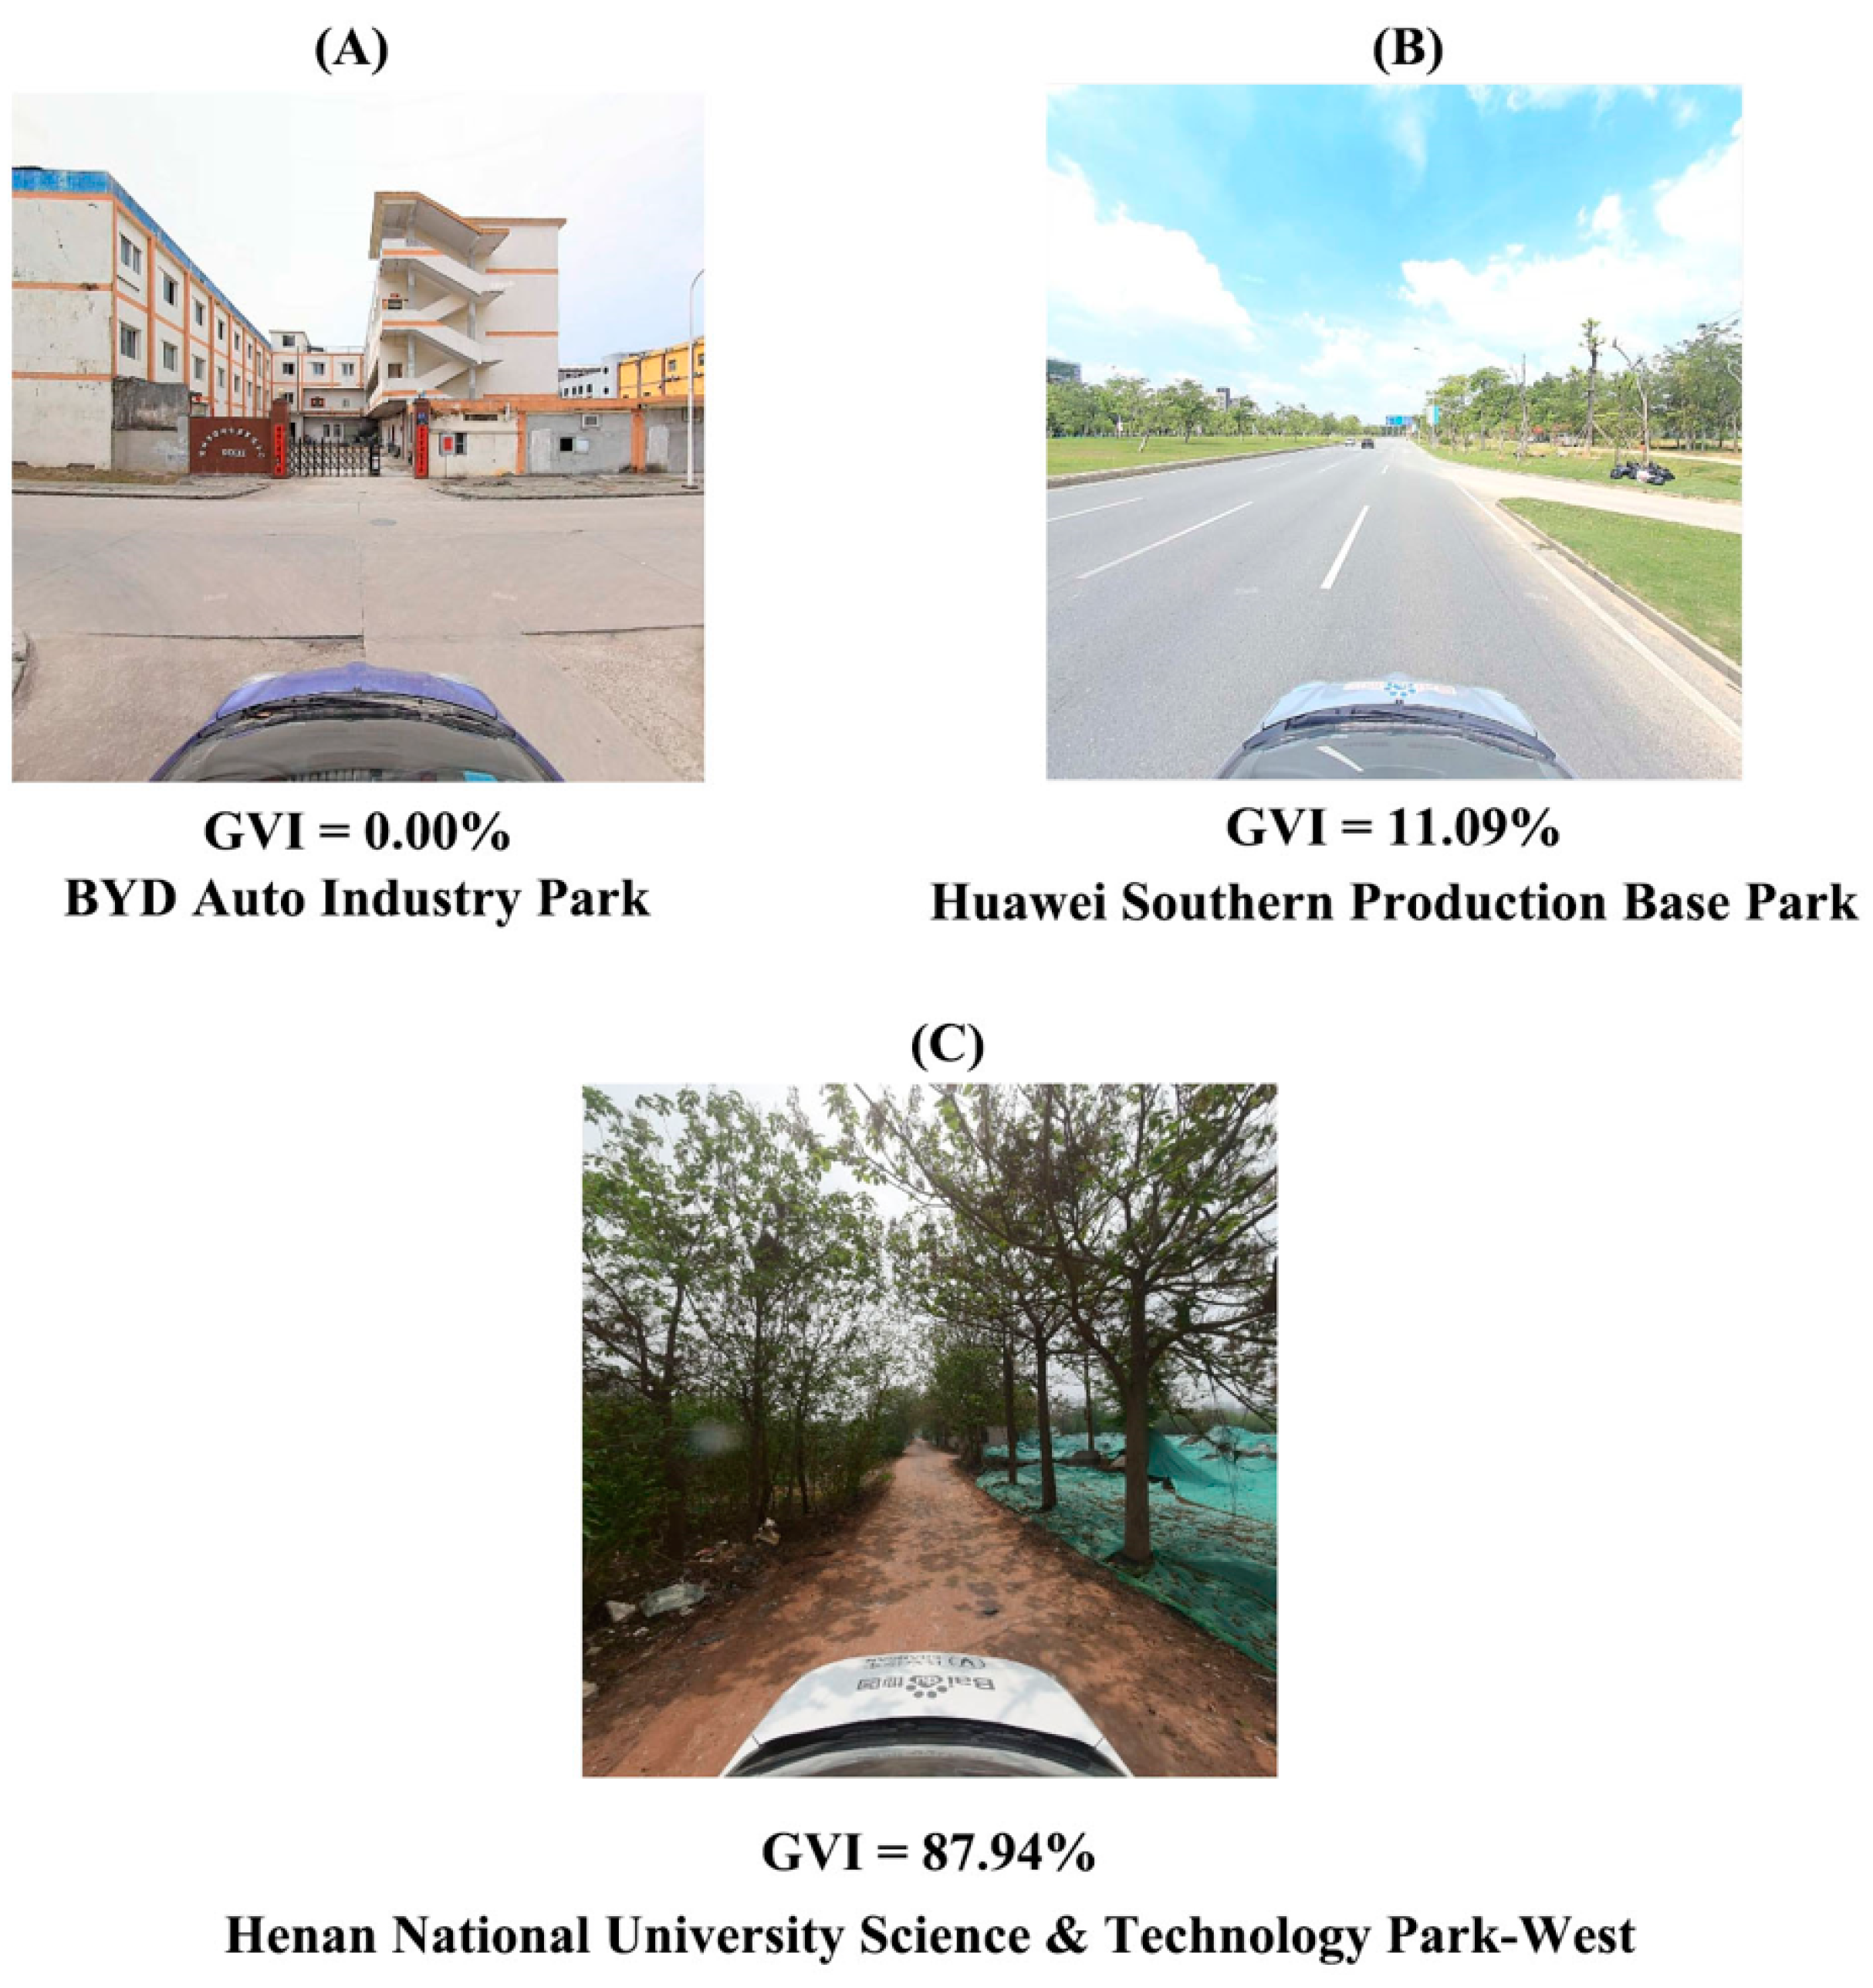
2.5. Green View Index and Plant Diversity Evaluation

A total of 100 street view photos were obtained from the buffer area of an industrial park. Street view images were the source for evaluating GVI, which were obtained from the Baidu application programming interface (API) [83]. As described above, the buffer areas had a radius of 2 km, resulting in an area of 12.56 km2. There was a probability of ~25% for successfully matching a coordinate and a photographed image in the Baidu map street-view [84]. At least 400 grids were set in a buffer to expect that a hundred out of them could be crawled through API to match a host location with existing street view images. Therefore, a grid had an area of 3.14 ha, wherein a street view image was expected to be obtained from coordinates.
Deep learning was developed using Python 3.6 (Python Software Foundation, Python, Beaverton, ON, USA). We employed deep learning to train the machine recognizing pixels occupied by green plants (leaves, needles, twigs, and crowns, etc.) based on an initial dataset of cityscapes [85]. A total of 2000 street view images were downloaded randomly by coordinates in grids with a radius of 3.5 km2 arranged across the municipal area of the host city where an objective IP was constructed. A convolutional neural network was used to train the machine, recognizing the semantic tags of objectives in a street image. The DeepLabV3+ model was employed for dividing objectives through recognizing and categorizing every pixel by the major network from the residual network-101 (ResNet-101). The trained program was coded to an application (Pycharm, Praha, Czech Republic), which was validated to recognize objective pixels as a part of green organs in a plant with an accuracy over 85% [75]. All the GVI values estimated from a buffer area were averaged for the host industrial park. Thereafter, the application was run for recognizing GVI in every street view image, which ranged from 0.00% to 87.94% with a median of about 11.00% (Figure 4).
All the images that were successfully analyzed for GVI were sent to a professional botanical group with one teacher and four undergraduates. All the plant species were recognized visually by two of the undergraduates, and after the two agreed with each other for recognizing all species, the teacher made the final determination. Due to the limit of resolution, only trees and shrubs were recognized, and these two plant types are also major botanical drivers that can cause visitors’ attention and result in emotional perceptions [24]. The general level of GVI varied to a large extent (Figure 4), leading to some images containing no plants while others contained a rich amount. Finally, a total of 5250 photos were successfully recognized to contain at least one plant species (recovery: 93.75%). Plant species diversity was quantified through two equations, namely the Simpson’s diversity index (Simpson index) and the Shannon–Wiener diversity index (Shannon index) [24]:
S i m p s o n   i n d e x = 1 i = 1 S p i 2
S h a n n o n   i n d e x = 1 × i = 1 S p i l n p i
where pi is the proportion of species i relative to the total number of all species up to the final species S and lnpi is the natural logarithm of the proportion pi of species i. Again, all variables assessing plant diversity were averaged as a mean for the host IP.

2.6. Recruitment Wage and Salary Satisfaction

In this study, we put forth a simple but efficient equation for quantifying the salary satisfaction (SS) of employees in industrial parks:
S S = × V a r y i + I
where is the estimate of the maximum likelihood parameter that needs to be estimated; Var(yi) is the variance model of emotional response yi; expression scores for happy, sad, and neutral emotions can be assigned with i = 1, 2, and 3, respectively, assuming a visible face harboring salary satisfaction can be assessed based on a mixture of scores for three basic component emotions; and I′ is the intercept value in the model for analyzing the maximum likelihood of parameters.
A generalized linear model (GLM) was defined as classes from an extension of traditional linear models that allow for the mean of a population to depend on a linear predictor through a nonlinear link function and allows the response probability distribution to be any member of an exponential family of distributions [86]. According to histogram analyses (Figure S1), happy scores showed a normal distribution pattern, and sad scores and recruitment wage (RW) both showed approximate patterns with positive values in skewness by about ~35%. Hence, a normal regression model was employed from the GLM family to estimate salary expectation against perceived happy, sad, and neutral emotional scores [87]:
V a r y i = V ( μ i ) w i
where the variance of the response yi [Var(yi)] depends on the mean μ through a variance function V; Ø is a dispersion parameter which needs to be estimated; wi is a known weight for each observation; and μi is the expected value of yi, which are formulized as:
μ i = x i β
y i = x i β + ε i
where the quantity xi is a column vector of the covariates for the observation i that is the number of explanatory variables; the vector of unknown coefficients β is estimated by at least squares fit to the data y; and εi is assumed to be an independent and normal random variable with zero mean and constant variance.

2.7. Data Analysis and Statistics

SAS software (ver. 9.4, SAS Statistics Institute, Cary, NC, USA) was used for the data analysis and statistics. Data from explanatory variables (landscape metrics, GVI, and plant diversity indexes) were shown as spatial distribution patterns. RW and salary satisfaction were grouped to show their distribution patterns. Emotional scores (happy, sad, neutral, PRI) were ranked to make a distribution-free dataset [88], which can be regressed without statistical limits using general linear modeling (GLM) models [19,21,44,67]. Spearman correlation was used to detect relationships between pairs of facial expression scores. The satisfied wage was estimated with the maximum likelihood parameter method (using Genmod procedure in SAS) using the normal-likely algorithm converged in the GLM model. Estimates could be accepted for further correlation only when the Wald Chi-square (ChiSq) was large enough to make sure the Pr (>ChiSq) was lower than 0.05. Linear correlation was used to bridge the relationship between emotional scores and RW for scattered significant estimates, with all negative estimates excluded to meet the objective logistic recognition (no one would expect a wage with a negative amount). The multivariate linear regression (MLR) model was employed using a backward regressing manner, with all variables entered and eliminated until significant parameter estimates were left (p < 0.05). Dependent variables were chosen as the four emotional scores and salary satisfaction.

3. Results

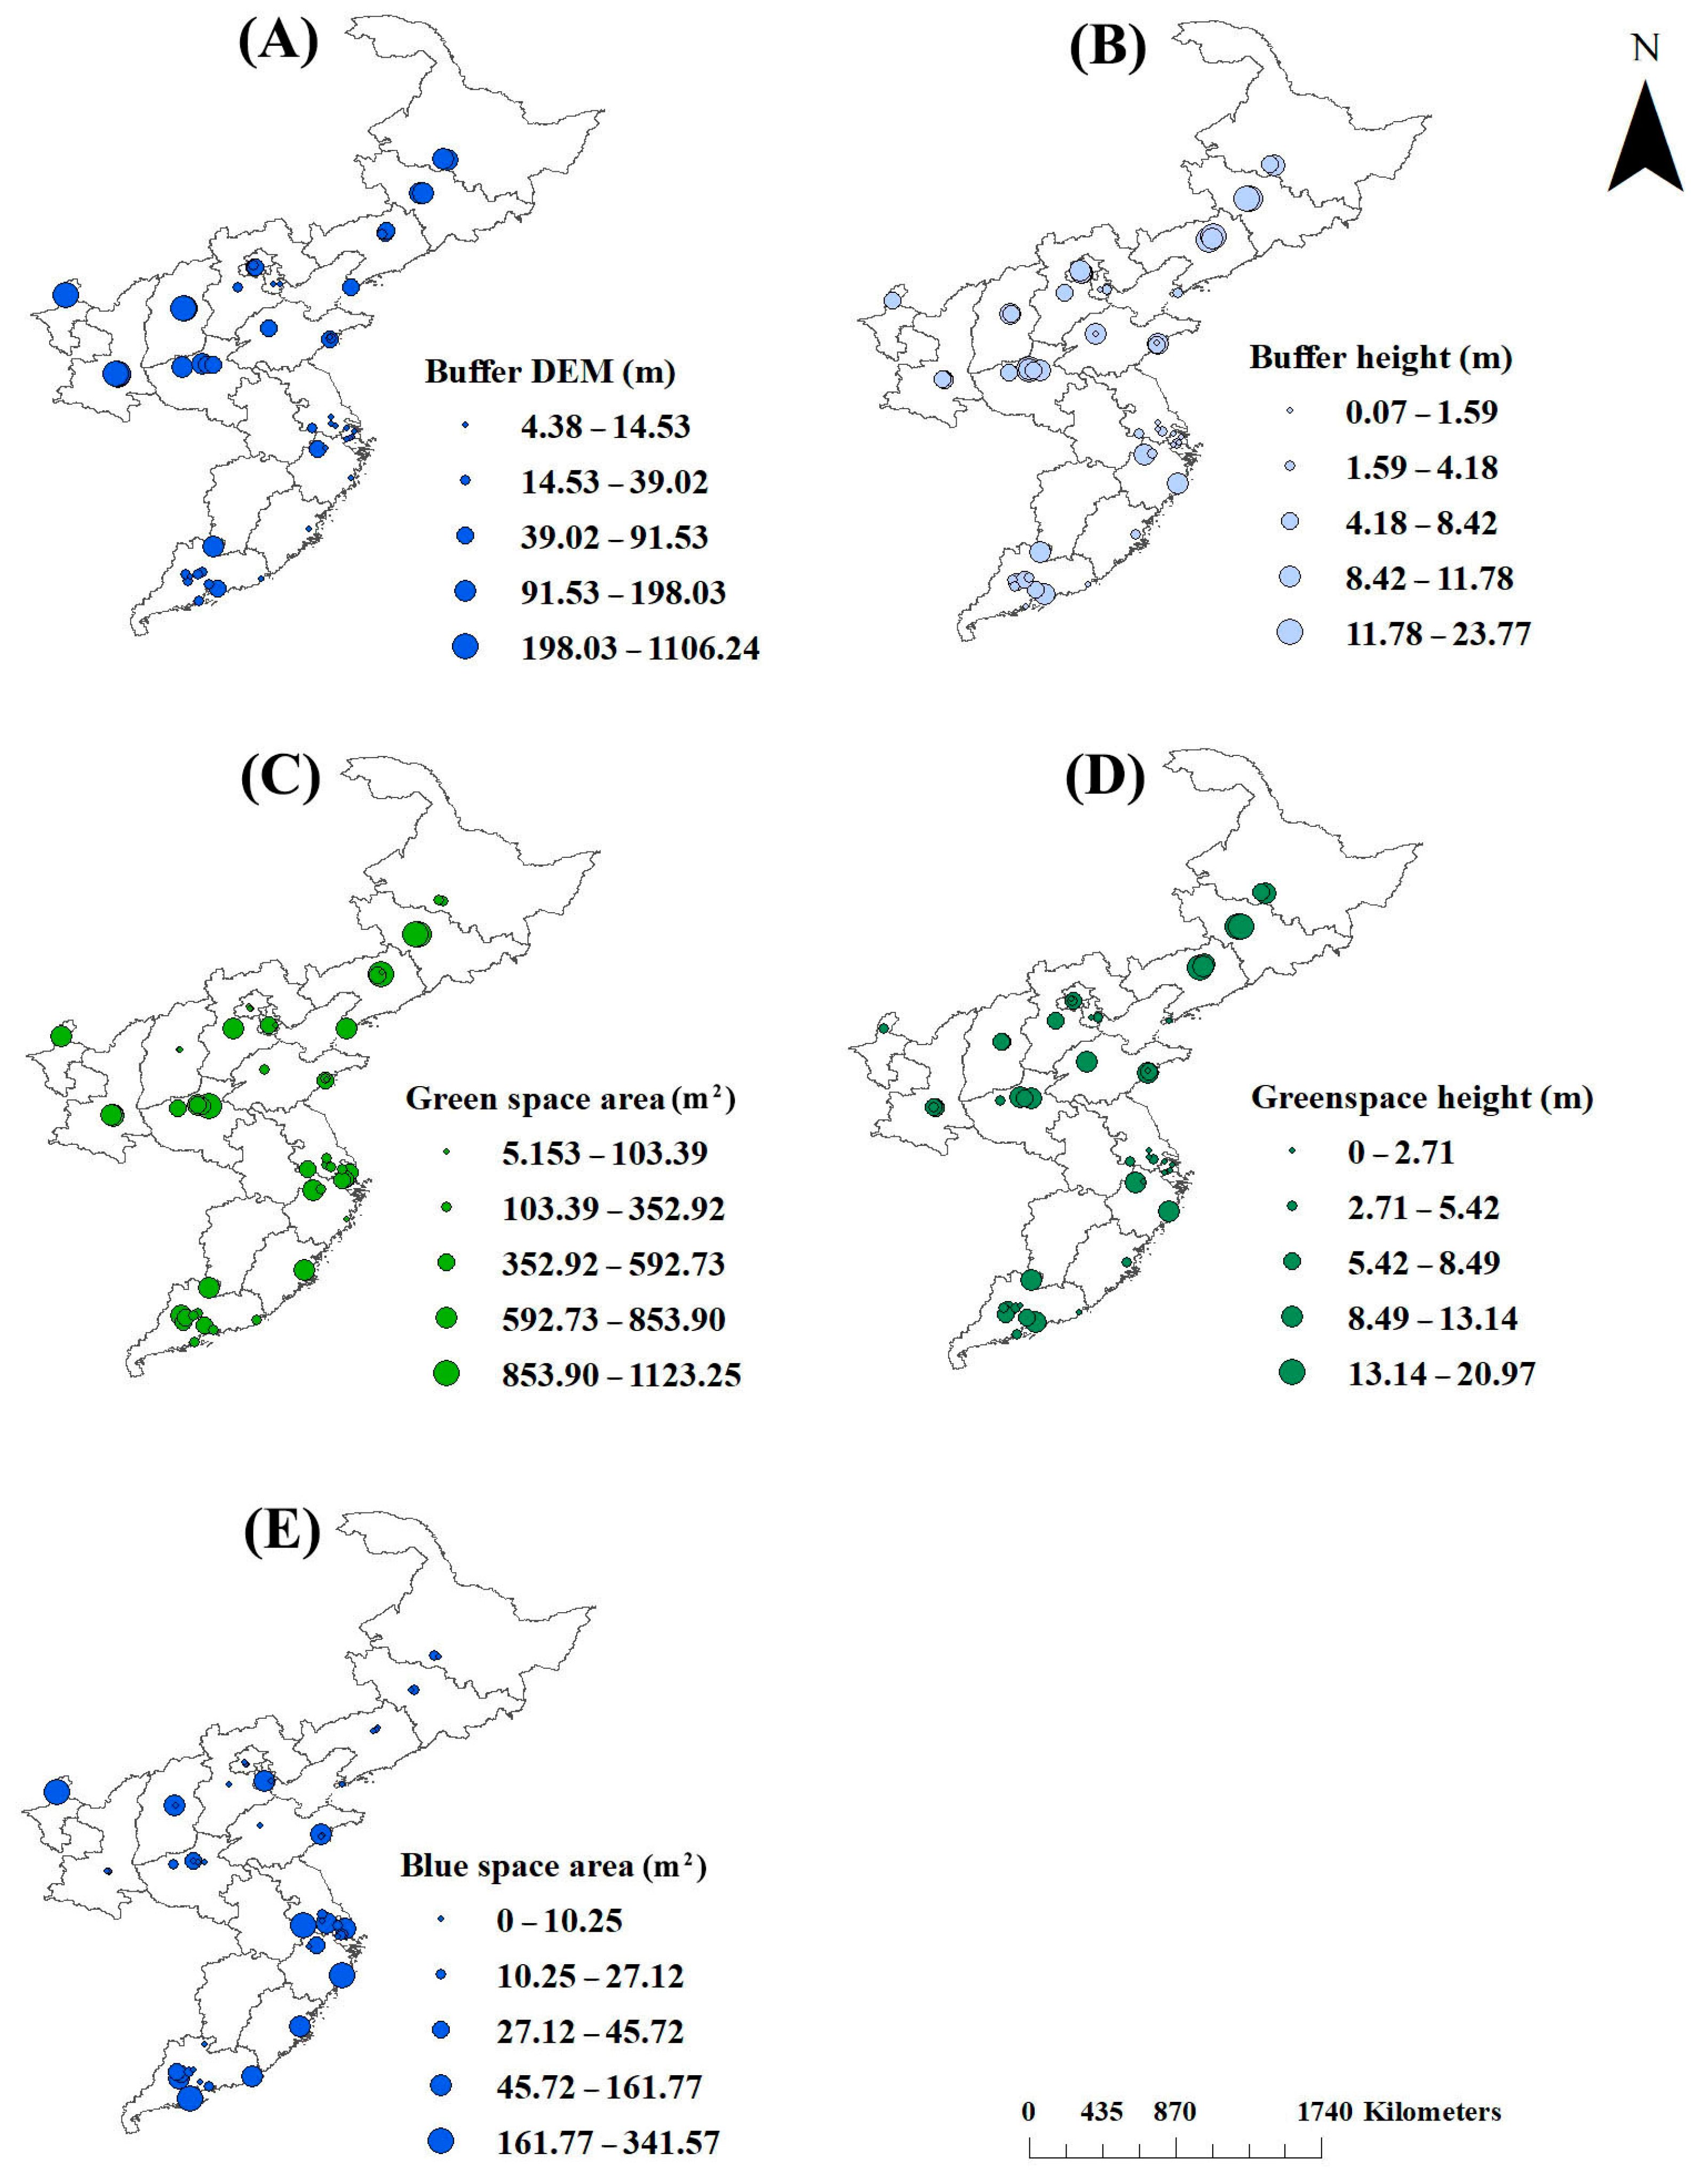
3.1. Spatial Distributions of Landscape Metrics

As it is shown in Figure 5, the industrial parks constructed in Hebei, Jiangsu, Shanghai, and Guangdong were generally located at lower elevations than those in other regions (Figure 5A). The surface features were generally taller in buffer areas of industrial parks located in northeast China (Heilongjiang, Jilin, and Liaoning), north China (Beijing, Henan, Shanxi, and Shaanxi), and parts of Zhejiang and Guangdong (Figure 5B) than those in the other industrial parks. The feature height was lower in buffer areas of industrial parks in Jiangsu, Shanghai, and parts of Guangdong than that in other regions. Green space area mainly ranged within 350–800 m2 per industrial park, with obvious smaller ones located in Heilongjiang, Beijing, Shanxi, Shandong, Jiangsu, and Guangdong (Figure 5C). Green space height was generally lower in south China such as in regions of Jiangsu, Shanghai, Fujian, and Guangdong (Figure 5D). Blue space area was generally larger in southern parts of China than in the north, with occasional large areas of about ~200 m2 per industrial park in Ningxia, Shanxi, and Tianjin (Figure 5E).

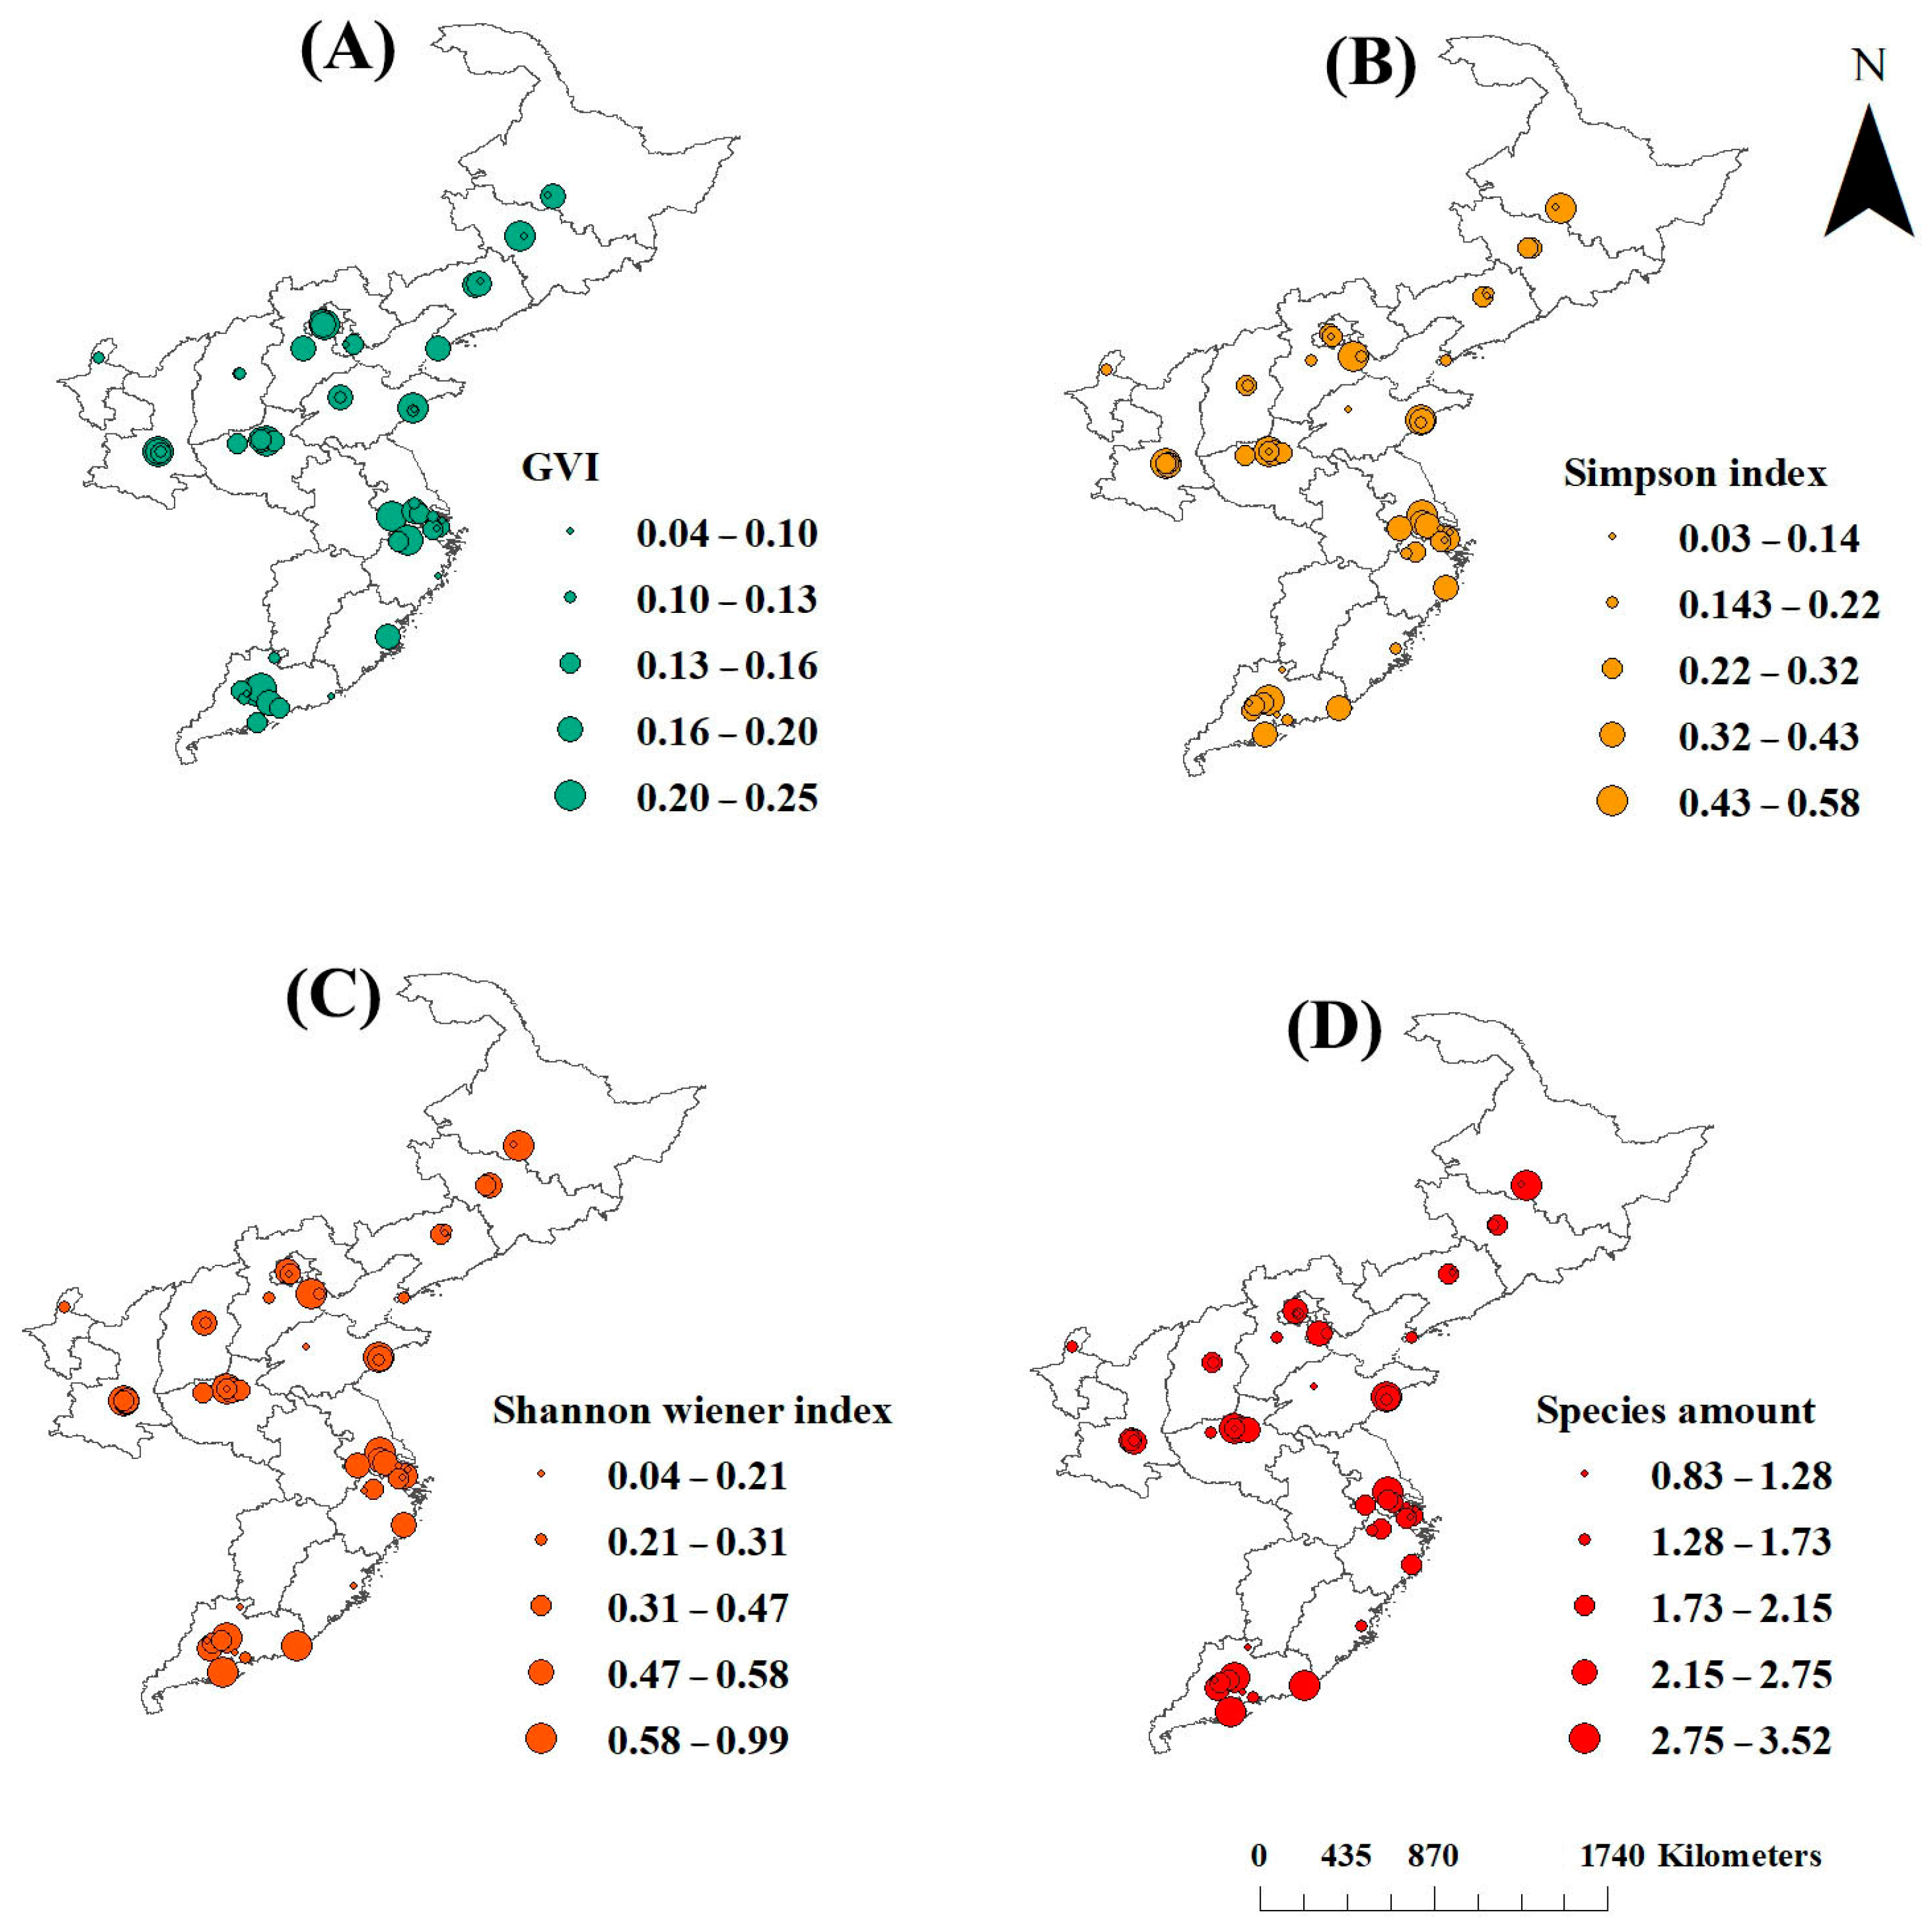
3.2. Spatial Distributions of GVI and Plant Diversity

GVI ranged within 0.16–0.20 with occasionally lower values in buffer areas of industrial parks concentrated in parts of Jiangsu, Shanghai, and Guangdong (Figure 6A). Both the Simpson and Shannon indexes showed alternative high and low levels along the north–south geographical gradient (Figure 6B,C). The buffer areas of industrial parks had lower diversity indexes in southern Liaoning, western Shandong, Fujian, and parts of Guangdong. These regions also contained industrial parks whose buffer areas were found to have fewer species amounts (Figure 6D).

3.3. Spatial Distributions of Facial Express Scores

Employees showed faces with high happy scores (up to ~50%) in industrial parks in three general agglomerations in north China (Hebei, Beijing, and Tianjin), east China (Jiangsu, Shanghai, and Zhejiang), and south China (Guangdong) (Figure 7A). In contrast, these regions were also more common with low sad scores (Figure 7B). Extremely high sad scores (up to ~20%) were found in industrial parks located in Shaanxi, Henan, Liaoning, and eastern Zhejiang. Neutral scores showed a similar distribution pattern with sad scores (Figure 7C). Again, high PRI scores were found to agglomerate in industrial parks around Beijing, Shanghai, and Guangdong (Figure 7D).
Spearman correlation indicated that happy score was negatively related to sad and neutral scores, but had a positive relationship with PRI score (Table 2). Sad score had a positive relationship with neutral score, but a negative relationship with PRI score. Neutral score also had a negative relationship with PRI score.

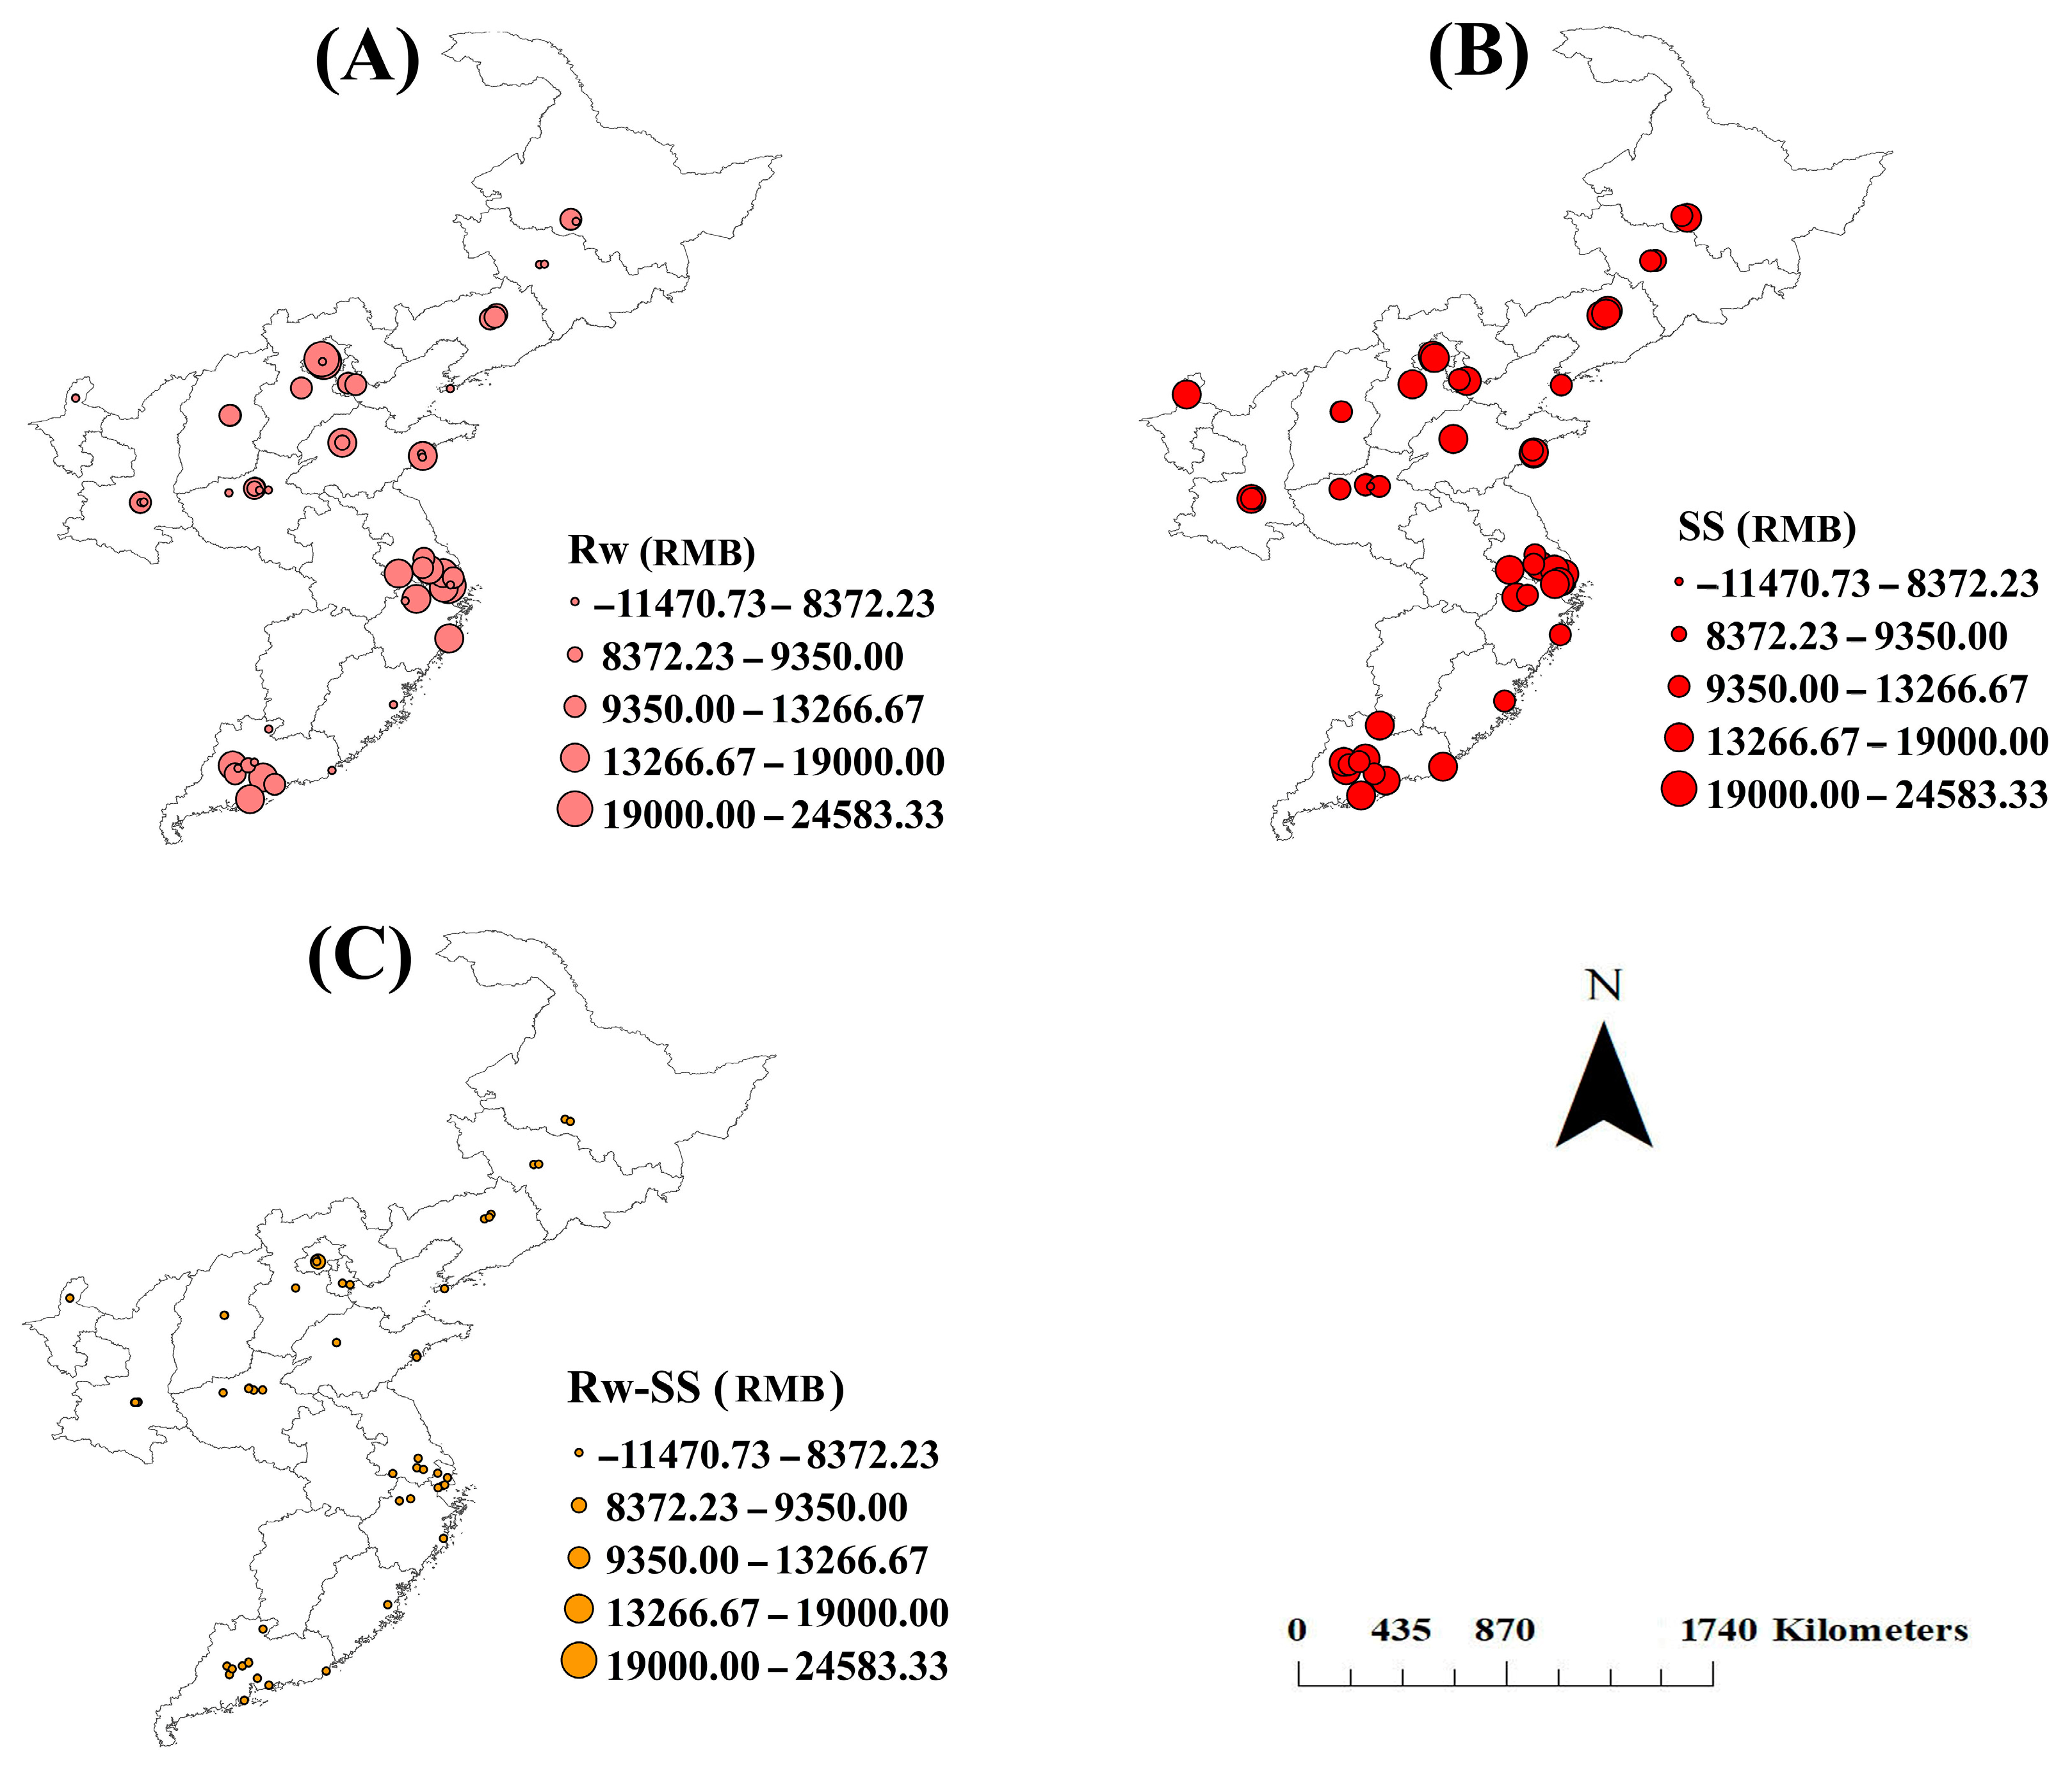
3.4. Salary Satisfaction Estimate and Spatial Distribution

According to GLM regression, the I’ for salary satisfaction was estimated to be RMB 8000 with Wald 95% confidence limits within 7998.04–8001.96. Facial expression scores for happy, sad, and neutral emotions were all input to GLM, regressing recruitment wage, and only happy scores were retained to obtain a series of significant estimates of the maximum likelihood parameters. A total of 53 parameters were estimated to be significant, but 18 of them were estimated to be negative values, which had to be excluded from further analysis under the rule following a general logistic recognition. As a result, salary satisfaction can be estimated as:
S S = 278.8796 x H a p p y 5540.2669 + 8000
where xHappy is the input variable of the observed happy scores that resulted in positive estimates (n = 35). The coefficient determination was 46.76% with the probability of significance of 0.0046, both indicating a highly linear distribution of data.
As it is shown in Figure 8, the published recruitment wage was higher in industrial parks located in agglomerated regions around Beijing, Shanghai, and Guangdong (Figure 8A). However, estimated salary satisfaction showed a distribution pattern with a much higher homogeneity (Figure 8B). Most salary satisfaction values ranged around RMB 19,000 and some lower values around RMB 9000 distributed in industrial parks in northern regions and eastern Zhejiang and Fujian.
National 863 Central Software Park was the only industrial park where corporates paid salaries as high as the satisfactory levels (RMB 742.12) in central China (in Zhengzhou Henan) (Figure 8C). In Shanghai, businesses in three industrial parks paid satisfactory salaries, i.e., Jiading Industry Development Park (RMB 38.43), Shanghai Chemical Industry Park (RMB 7875.70), and Shanghai Fine Chemical Engineering Industry Park (RMB 5359.31). Only one industrial park’s corporates provided satisfactory salaries (RMB 1645.31) in Jiangsu, which was Jiangsu Tianmu Lake Tourism Joint Stock Company Park. Two industrial parks were found with satisfactory salaries in Zhejiang, which were Zhejiang Xiangyuan Cultural Tourism Inc. Park (RMB 5045.93) and Zhejiang Haizheng Medine Industry Inc. Park (RMB 3133.19). Sihui Fine Chemical Industry Park was the only industrial park with a satisfactory salary (RMB 2237.69) in Guangdong.

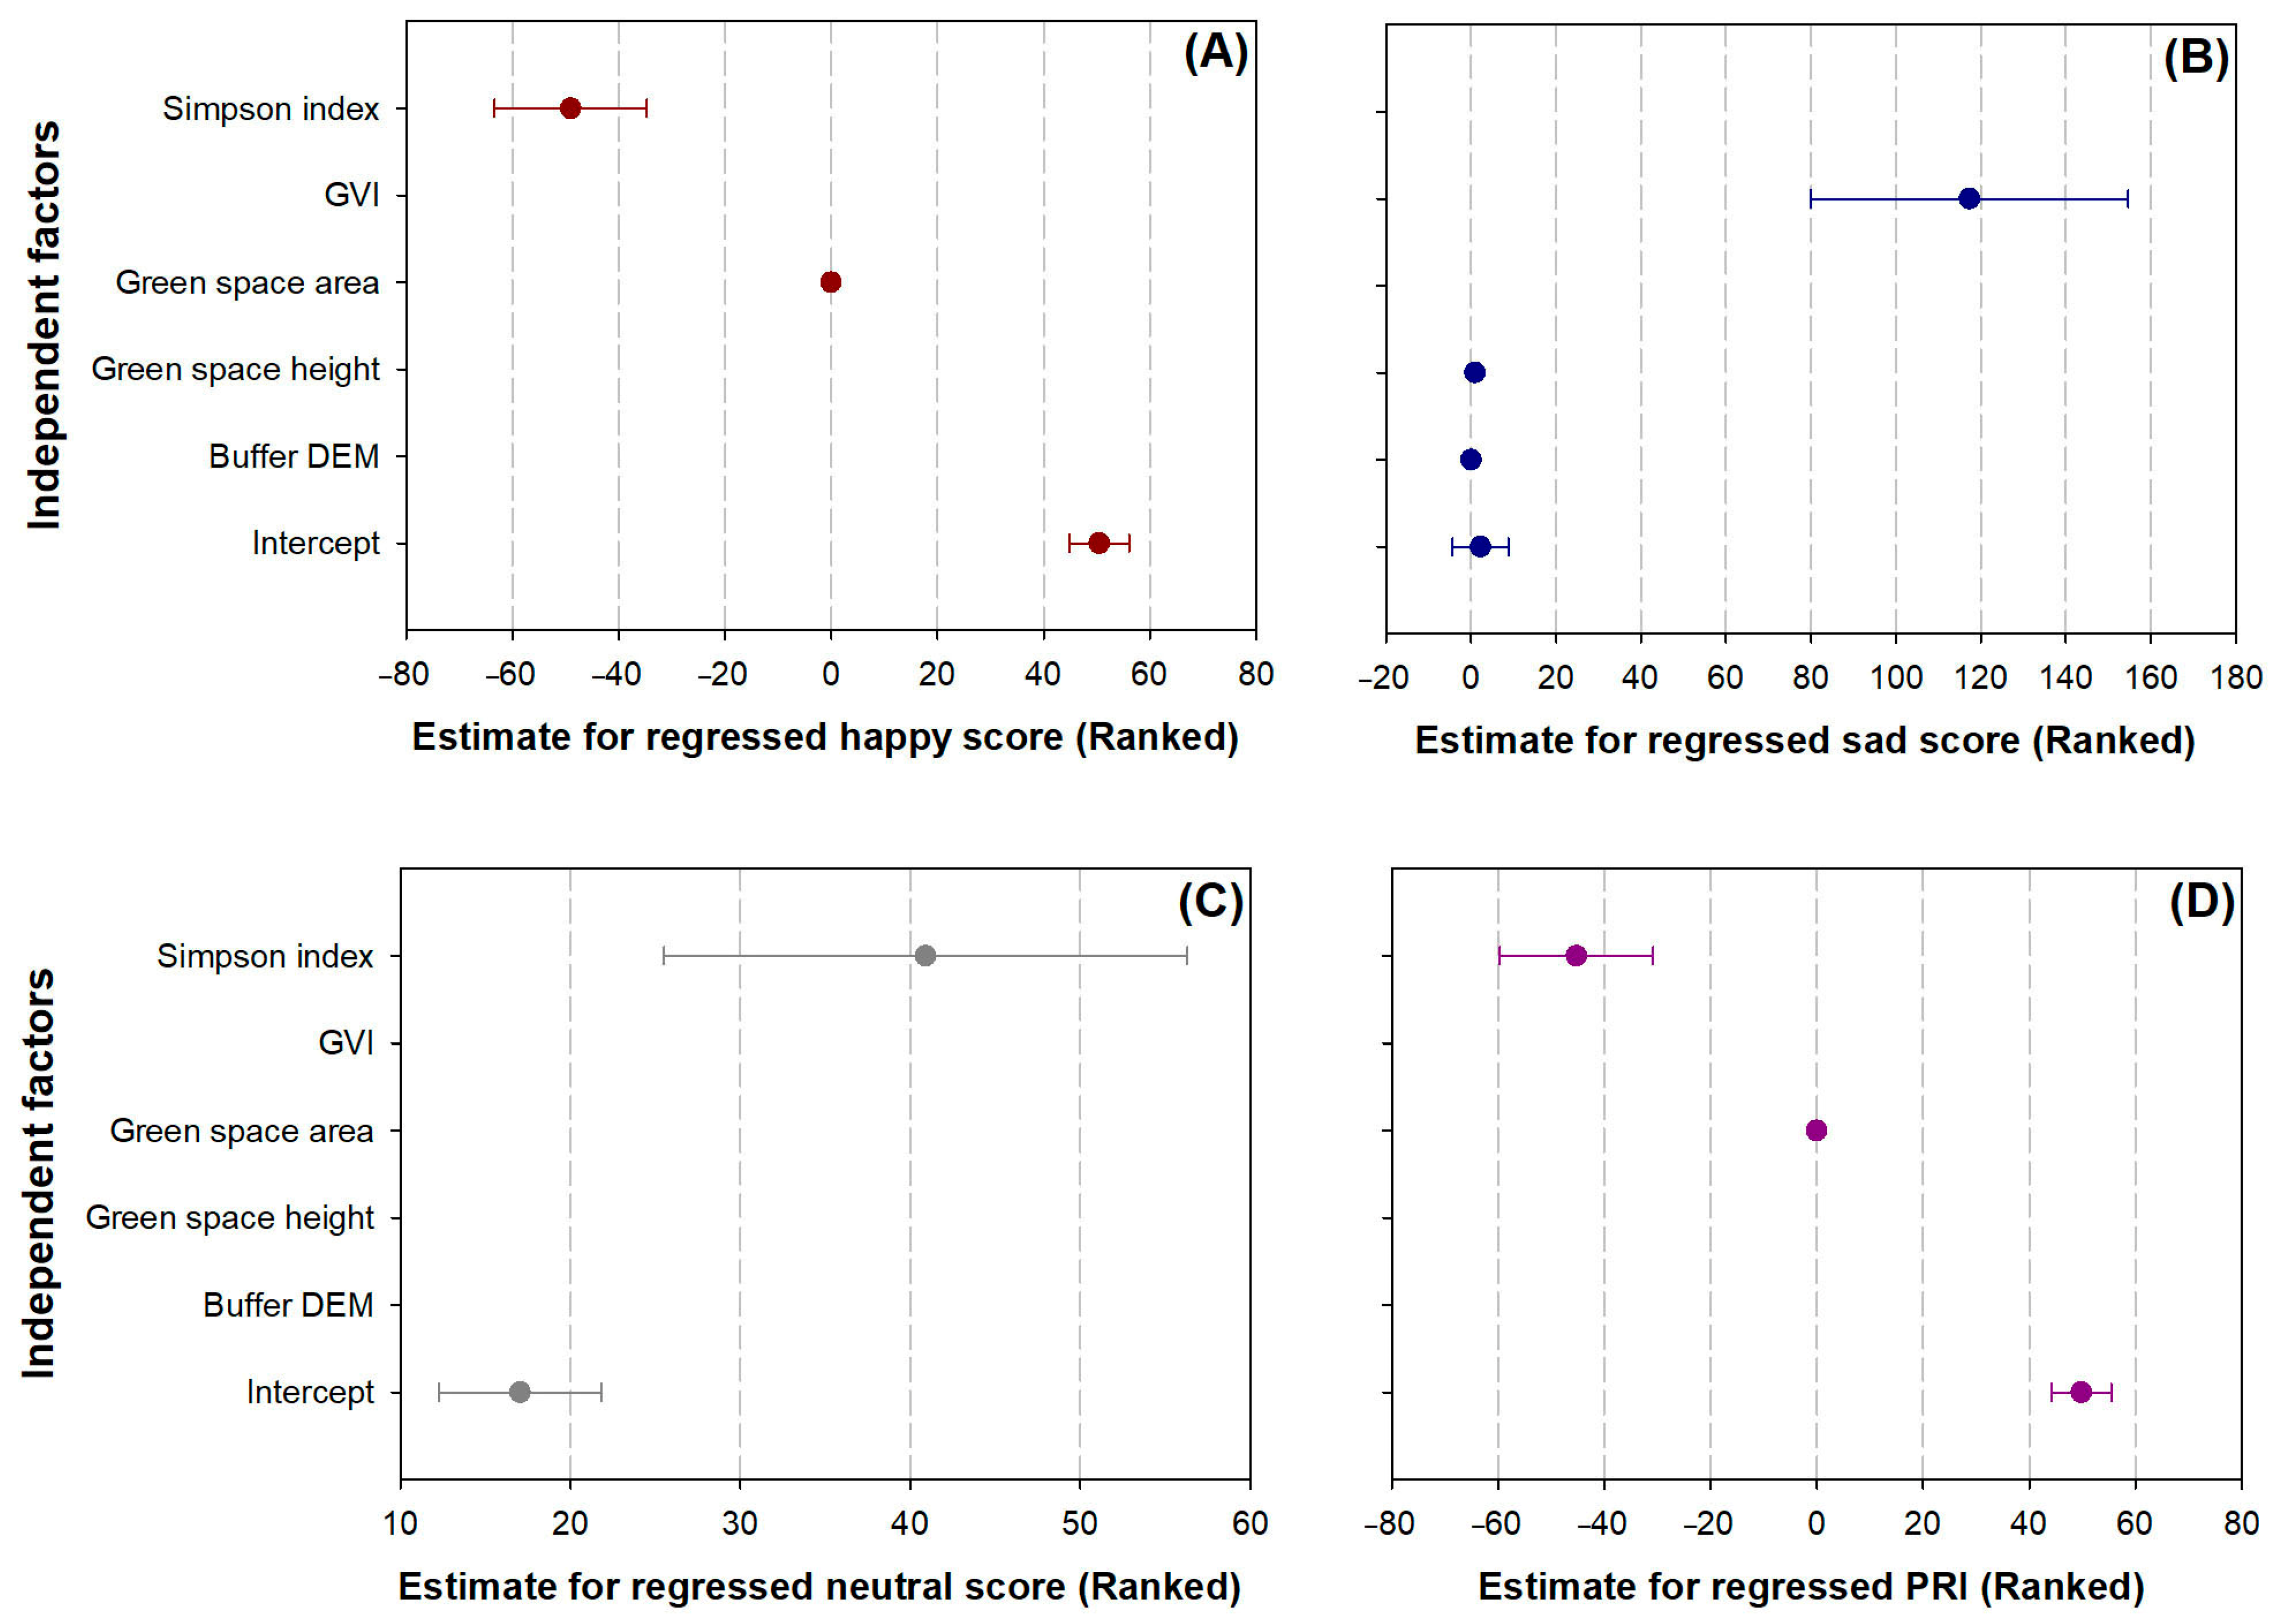
3.5. Driving Forces on Facial Expression Scores and Salary Satisfaction

The MLR model indicated that the ranked happy scores could be regressed against negative contributions from green space area (parameter estimate [PE]: −0.0182 ± 0.0068; p = 0.0095) and Simpson index (PE: −49.0174 ± 14.3506; p = 0.0012), with a positive PE (+50.4651 ± 5.5771; p < 0.0001) for modeling intercepts (Figure 9A). In contrast, both factors of buffer area elevation and surface feature height in green space showed tiny positive contributions to ranked sad scores (PEs: 0.01934 ± 0.0088 [p = 0.0321] and 0.9181 ± 0.4226 [p = 0.0344], respectively), which was highly regressed against GVI with a large contribution (PE: 117.2966 ± 37.3032; p = 0.0027) (Figure 9B). The Simpson index was the only factor that had a positive contribution (PE: 40.8964 ± 15.3864; p = 0.0103) to the regression of the ranked neutral scores (intercept, PE: 17.0373 ± 4.7830; p = 0.0008) (Figure 9C). Again, both green space area and the Simpson index showed negative contributions to the regression of the ranked PRI scores (PEs: −0.0191 ± 0.0068 [p = 0.0072] and −45.2491 ± 14.4802 [p = 0.0029], respectively) (intercept, PE: 49.8121; p < 0.0001) (Figure 9D).
The green space area was the only factor that contributed to the regression of salary satisfaction with a PE of −0.0202 ± 0.0072 (p = 0.0071), while the intercept had a PE of 37.6195 ± 3.8521 (p < 0.0001) (Figure 10).

4. Discussion

4.1. Estimation of Salary Satisfaction

Employee satisfaction is important for organizational well-being and responsible for decreased turnover [54]. Expectations for a higher salary are associated with career satisfaction, which was reported by international enterprise professionals [51], subway workers [56], humanitarian workers [52], and clinical social workers [54,89]. Satisfaction about salary was also reported to be associated with job satisfaction by public hospital doctors [90], treated school teachers [69], and market access professionals [68]. These types of studies mainly consider that demographical effects are the major driving force that impose impacts employees’ satisfactions on salaries [68,69]. Other explanatory factors have occasionally been reported from aspects in skillful fields, e.g., years in practice, education background, and specialty for hospital physicians [90]. The current estimation of salary satisfaction is limited to workers from a narrow range of occupational types. To break this restriction, Sanchez-Gomez, Breso, and Giorgi [57] tried to put forward a model to predict salary gain against quantified emotional intelligence (EI). They found that combined increases in both EI and emotional repair capacity together attributed to a higher level of salary. This study initiated the probability to predict salary satisfaction by modeling the emotional performance of an employee. However, technical limits in emotional data collection existed in this study and in those without novel instruments.
Our study employed a novel methodology using inter-disciplinary pieces of technique and knowledge for estimating salary satisfaction. In this study, emotional scores were employed as explanatory variables that were used for modeling salary satisfaction. About this, one may argue that salary satisfaction is perceived in response to recruitment wage, hence, the estimation against emotional scores did not have any applicative meaning. This argument fails to consider that salary satisfaction cannot be directly reflective following awareness of recruitment wage, unless through perceiving various emotions. That is why our salary satisfaction was estimated against all types of emotional scores. We also considered the condition that significant estimates may fluctuate to be either positive or negative values, which had to be screened to remove negative values to meet the common sense before being modeled by another linear correlation. This process was achieved using statistics that other studies took into account for estimating salary satisfaction value [91,92]. Therefore, our estimation of salary satisfaction was accurate at least to a greater extent than others in the current methodology.

4.2. Facial Expression Scores of Employees in Industrial Parks

In our study, the emotional states of employees were quantified through facial photos that were posted by social network users. This type of emotional data may suffer queries about unavailability to reflect real-time subtle emotions, because facial emotions are mostly posed with prepared or intended sentiments [71]. We argue that this is not the issue that determines the accuracy of our results. All the photos were collected from twitters posted by people exposed to GBSs at workplaces, which has been identified to be a moderate psychological stimulation that can evoke sentiment response through perceiving changes in landscape metrics [18], regional meteorology [19,48], and atmospheric pollution [44,45]. The magnitude to which an employee posed emotions was elicited by the same source of psychological hints, even though they knew what emotions they intended to pose. Secondly, the intended emotions were posed to a camera, but subjects can rarely be aware that their faces will be taken as a source in an academic study. That is, the intention to pose sentiments had no relevance to any existing dataset used for testing facial emotions. Hence, the results will not be affected by the subjects’ intentions, no matter whether they meant to do so or not. Finally, we controlled our subjects to be a group of employees who were targeted at working times in workplaces, which can mostly control the systematic errors in big social network data caused by individuals’ intentions. Overall, it is acceptable to employ facial photos as a source of emotional data from social networks.
Our facial expression scores showed a spatial pattern that positive sentiments were exposed in agglomerated regions around Beijing, Shanghai, and Guangzhou. These three core regions are also three biggest metropolises of China, with huge residential populations (>15 million) and large areas of built-up lands. According to findings unraveled in urban parks [21,63], places with crowded populations on highly urbanized lands tend to evoke more negative sentiments of visitors, which disagree with our results. However, other national-scale studies have revealed that people would be likely to pose more smiles or positive emotions in municipal regions where the total product was high in retailing sales [44,45]. Activated retail records precondition high incomes for local households, hence, people tended to look happier than those from regions with smaller retailing markets.
Because of the negative relationship between happy and sad scores, their spatial distributions also showed contrasting patterns. Similar spatial patterns between happy and PRI scores suggest that employees generally showed more positive emotions (20–60%) than negative ones (10–25%). Although neutral scores also had a negative relationship with happy scores, their spatial distribution patterns were not different to the extent as those between happy and sad scores. We found that, in three agglomerated regions with high positive sentiments, neutral scores were exposed in industrial parks alternatively with high happy scores. These suggest that employees tended to post neutral emotions when they felt not so happy to make a smile. Regarding that neutral scores were positively correlated with sad scores, parts of exposed neutralities may be an exterior performance of sadness.

4.3. Driving Forces When Being Exposed to Green Spaces

It is surprising to find that exposure to green space caused totally negative emotional consequences perceived by employees. Plant diversity quantified by the Simpson index was perceived as a trigger of neutral emotions or parts of drivers that depressed positive emotions. These are totally against previous findings in the urban parks of China [24] and private gardens of Germany and New Zealand [93]. Our findings also disagree with the nature of ART and SRT, and their former theory of Biophilia hypothesis. We surmise that this contradiction results from the different ways to experience exposure to green space. People visit parks and gardens without necessary stressful burdens, hence, their attention are easily attached to the focus on plant biodiversity. In contrast, employees were concerned with affairs at working time when they perceived heavy mental stresses deeply in their work. Deeply stressed cohorts of people may not find it easy to recover with an experience with nature. The diversity of plant species is far away from workers’ concerned interests, hence they showed more neutral faces. A view with highly diverse species may make workers consider a hint of attention transfer, which was perceived as a negative contribution to exposed happiness.
The elevation of the location of the industrial park was found to have a contribution to exposing sadness, which disagrees with findings for visitors of tropical forest parks with degraded ecological states [19]. Again, a visit to an urban park is unlikely or rarely attached to the necessity of preconditioned mental burdens; hence, a high elevation in a subtropical mountain would be accompanied with higher wind velocities that bring thermal comfortable feelings. However, the high elevation of an industrial park can make workers notice more harsh conditions for everyday accessibility to the workplace. This surmise was reasonable, because industrial parks located at high elevations (200–1000 m a.s.l.) were mostly located in montane regions whose host cities were subjected to a terrain with moderate to low elevations, such as industrial parks located in Heilongjiang, Shanxi, Shaanxi, and Ningxia.
Both GVI and green space height both contributed to the effects that caused an upregulation of exposed sadness, suggesting that employees disliked landscapes with a high ratio of seen greenness provided by groups of tall plants at their workplaces. It has been found that the height of plants accounts for a large proportion of GVI in urban green space [94]. Although tall plants are responsible for a high GVI, they may be perceived as a trigger of negative emotions due to their intervention of expected openness but upregulated enclosure in workers’ views. According to He et al. [95], an urban view with attributes of low openness but a high enclosure can be a trigger of unstable senses. Green space with tall plants also means a larger understory space where more shrub diversity can be easily seen [24], which is also has a depressing effect on exposed smiles.
The area of green space was perceived as a depression against posted smiles, hence performed as a sole facet that reduced salary satisfaction. This totally fails to concur with previous findings that have demonstrated a positive relationship between green space largeness and positive emotions [16,17,18,20]. Continuous to the above discussed contents, a large area of green space is associated with a higher chance of experiencing more plant species, which did not benefit the perceptions of positive emotions as joint effects with plant diversity. In industrial parks where the areas for workplaces were fixed to a geographical range in a radius of ≤2 km, larger areas of green spaces meant a longer distance of path between constructions which impacted accessibility to the workplace.

4.4. Applicative Meaning of This Study

The whole process and way that we estimated salary satisfaction can be referred to by further studies that aim to assess salary satisfaction against employees’ emotional performances. The synthesis of data collection through remote sensing, online crawling, and deep learning can be strengthened by more skillful manipulations to harvest a more accurate dataset.
Among the 56 industrial parks, 8 of them were found to have corporates that could provide salaries meeting employees’ satisfactions. Among them, three were in chemical industry and two were in tourism; hence, these two types of industries were gaining decent profits and had capacities to recruit with high wages. The highest difference between recruitment wage and salary satisfaction (RMB 7875.70) was also provided by an industrial park engaging in the chemical industry, namely the Shanghai Chemical Industry Park. The other chemical industry park in Shanghai (Shanghai Fine Chemical Engineering Industry Park) also provided salaries with a high recovery from the difference of recruitment wage and salary satisfaction (RMB 5359.31). Hence, the chemical industry was identified as paying higher salaries for employees than other industries. On the other hand, among the eight industrial parks, six were located in regions around Shanghai, including those in Zhejiang and Jiangsu, which suggest corporations in industrial parks of this area were certified to provide high salaries. These findings can be referred to by coming investments in industrial park construction in China.
Our results about the driving forces of landscape metrics and plant diversity corrected a common recognition that more green space may be better at the workplace. According to our findings, an industrial park should be constructed with a small green space decorated in dwarf plants with a low number of species. This would avoid the impairment of positive sentiments in workers and reduce their perceptions of low satisfaction about monthly salaries. This manner of industrial park landscape construction will be referred to by labor management for controlling wage cost through controlling high-income desires.

4.5. Limits of This Study

Our study has three limitations:
Firstly, the time of the study fell in the COVID-19 pandemic, which modified the real-time situation at workplaces and changed workers’ perceptions with uncertain consequences. Further work should be conducted in ordinary times to avoid unknown interventions on results by sudden social hotspot events.
Secondly, our methodology to estimate salary satisfaction can be validated in cooperation with self-reported expectations. It is a novelty for our study to publish the new methodology and it is obligated for following studies to validate and optimize the methods.
Finally, it will be better if all industrial parks were controlled to have large walled areas to fully make sure exposure to GBSs occurred at workplaces.

5. Conclusions

To overcome the shortcomings in surveys of salary satisfaction in former studies, we employed a novel methodology for evaluation by modeling against emotional scores rated from facial photos obtained from social networks. Green and blue spaces at workplaces were taken as possible restorative settings that may benefit the emotional perceptions of employees and increase their salary satisfaction. Online data crawling and deep learning were used to obtain street view photos of streets around industrial parks that were used as a parameter for the independent variables. This was also a cutting-edge trial to evaluate the data used for modeling salary satisfaction. Our findings showed that exposure to blue space had no effect on facial emotion scores, and green space exposure with diverse plant species were together indicated to reduce employees’ satisfactions towards their salaries. With an aim to control expected wage and increase salary satisfaction, an industrial park should be constructed at lower elevations with a small area of green space without too many tall plants and too diverse plant species. Green space should be designed at a distance from paths with frequent visitors to decrease green view index and avoid perceptions of sadness. The chemical industry was identified as being able to pay monthly salaries meeting expectations, and regions around Shanghai had a high probability of harboring industrial parks with high wages.

Supplementary Materials

The following supporting information can be downloaded at: https://www.mdpi.com/article/10.3390/land12112075/s1, Figure S1. Histogram analyses for data distributions of happy (A), sad (B), and recruitment wage (salary) (C).

Author Contributions

Conceptualization, Y.S.; methodology, Y.S., Y.L. and L.M.; software, L.M. and Y.L.; validation, Y.S., L.M. and X.M.; formal analysis, Y.S. and X.M.; investigation, X.M., L.M. and Y.L.; resources, L.M. and Y.L.; data curation, L.M. and Y.L.; writing—original draft preparation, X.M.; writing—review and editing, Y.S.; visualization, L.M.; supervision, Y.S.; project administration, Y.S.; funding acquisition, Y.S. All authors have read and agreed to the published version of the manuscript.

Funding

This research was funded by the National Social Science Fund of China (grant number: 18CGL020).

Data Availability Statement

Not applicable.

Acknowledgments

Editors and reviewers are warmly acknowledged for their essential contributions to the outcome of the current version. Dr. Yuxiang Sun is warmly acknowledged for his insightful comments on an earlier edition of this article. Prof. Richard J. Hauer is warmly acknowledged for his edits to promote the use of English language for the final edition.

Conflicts of Interest

The authors declare no conflict of interest.

References

  1. Park, J.I.; Kim, J.O. Does industrial land sprawl matter in land productivity? A case study of industrial parks of South Korea. J. Clean. Prod. 2022, 334, 130209. [Google Scholar] [CrossRef]
  2. Meng, Q.; Hu, D.; Zhang, Y.; Chen, X.; Zhang, L.; Wang, Z. Do industrial parks generate intra-heat island effects in cities? New evidence, quantitative methods, and contributing factors from a spatiotemporal analysis of top steel plants in China. Environ. Pollut. 2022, 292, 118383. [Google Scholar] [CrossRef]
  3. Xiao, X.D.; Dong, L.; Yan, H.N.; Yang, N.; Xiong, Y.M. The influence of the spatial characteristics of urban green space on the urban heat island effect in Suzhou Industrial Park. Sustain. Cities Soc. 2018, 40, 428–439. [Google Scholar] [CrossRef]
  4. Xiao, X.D.; Zhang, L.L.; Xiong, Y.M.; Jiang, J.Y.; Xu, A.Q. Influence of spatial characteristics of green spaces on microclimate in Suzhou Industrial Park of China. Sci. Rep. 2022, 12, 9121. [Google Scholar] [CrossRef]
  5. Xie, X.H.; Zhou, H.Z.; Gou, Z.H. Dynamic real-time individual green space exposure indices and the relationship with static green space exposure indices: A study in Shenzhen. Ecol. Indic. 2023, 154, 110557. [Google Scholar] [CrossRef]
  6. Lottrup, L.; Stigsdotter, U.K.; Meilby, H.; Corazon, S.S. Associations between use, activities and characteristics of the outdoor environment at workplaces. Urban For. Urban Green. 2012, 11, 159–168. [Google Scholar] [CrossRef]
  7. Maric, J.; Aleksandra, D.; Antonic, B.; Furundzic, D.; Parezanin, V. The Effects of Open Space on Reducing Workplace Stress: Case Study of Business Park in the Post-Socialist Urban Setting. Sustainability 2021, 13, 336. [Google Scholar] [CrossRef]
  8. Lottrup, L.; Grahn, P.; Stigsdotter, U.K. Workplace greenery and perceived level of stress: Benefits of access to a green outdoor environment at the workplace. Landsc. Urban Plan. 2013, 110, 5–11. [Google Scholar] [CrossRef]
  9. Gilchrist, K.; Brown, C.; Montarzino, A. Workplace settings and wellbeing: Greenspace use and views contribute to employee wellbeing at peri-urban business sites. Landsc. Urban Plan. 2015, 138, 32–40. [Google Scholar] [CrossRef]
  10. Siba, M.A.J.a.; Maruthaveeran, S.; Ujang, N. Investigating the use and constraints associated with green outdoor environment at workplaces: What do the office employees in Kuala Lumpur say? Urban For. Urban Green. 2020, 51, 126692. [Google Scholar] [CrossRef]
  11. Mangone, G.; Capaldi, C.A.; van Allen, Z.M.; Luscuere, P.G. Bringing nature to work: Preferences and perceptions of constructed indoor and natural outdoor workspaces. Urban For. Urban Green. 2017, 23, 1–12. [Google Scholar] [CrossRef]
  12. Ha, J.; Kim, H.J.; With, K.A. Urban green space alone is not enough: A landscape analysis linking the spatial distribution of urban green space to mental health in the city of Chicago. Landsc. Urban Plan. 2022, 218, 104309. [Google Scholar] [CrossRef]
  13. Sun, Y.X.; Meng, Q.Y.; Sun, Z.H.; Zhang, J.H.; Zhang, L.L. Assessing the impacts of grain sizes on landscape pattern of urban green space. In Applied Optics and Photonics China (AOPC)—Optical Sensing and Imaging Technology and Applications; Proceedings of SPIE: Beijing, China, 2017; Volume 10462, p. 10462. [Google Scholar]
  14. Wang, X.R.; Ouyang, L.B.; Lin, J.; An, P.F.; Wang, W.J.; Liu, L.; Wu, L.F. Spatial Patterns of Urban Green-Blue Spaces and Residents’ Well-Being: The Mediating Effect of Neighborhood Social Cohesion. Land 2023, 12, 1454. [Google Scholar] [CrossRef]
  15. Yan, L.; Jia, W.X.; Zhao, S.Q. The Cooling Effect of Urban Green Spaces in Metacities: A Case Study of Beijing, China’s Capital. Remote Sens. 2021, 13, 4601. [Google Scholar] [CrossRef]
  16. Huang, S.Y.; Zhu, J.J.; Zhai, K.B.; Wang, Y.; Wei, H.X.; Xu, Z.H.; Gu, X.R. Do Emotional Perceptions of Visible Greeneries Rely on the Largeness of Green Space? A Verification in Nanchang, China. Forests 2022, 13, 1192. [Google Scholar] [CrossRef]
  17. Liu, P.; Liu, M.N.; Xia, T.T.; Wang, Y.T.; Guo, P. The Relationship between Landscape Metrics and Facial Expressions in 18 Urban Forest Parks of Northern China. Forests 2021, 12, 1619. [Google Scholar] [CrossRef]
  18. Zhang, J.; Yang, Z.; Chen, Z.; Guo, M.; Guo, P. Optimizing Urban Forest Landscape for Better Perceptions of Positive Emotions. Forests 2021, 12, 1691. [Google Scholar] [CrossRef]
  19. He, Q.; Wang, Y.; Qiu, Q.; Su, Y.; Wei, H.X.; Li, J.Y. Posted Sentiments toward Experiences in Degraded Forests Are Shaped Jointly by Landscape Structure and Microclimate. Ecosyst. Health Sustain. 2023, 9, 0004. [Google Scholar] [CrossRef]
  20. Li, H.Y.; Peng, J.X.; Jiao, Y.; Ai, S.S. Experiencing Urban Green and Blue Spaces in Urban Wetlands as a Nature-Based Solution to Promote Positive Emotions. Forests 2022, 13, 473. [Google Scholar] [CrossRef]
  21. Wei, H.; Hauer, R.J.; Sun, Y.; Meng, L.; Guo, P. Emotional perceptions of people exposed to green and blue spaces in forest parks of cities at rapid urbanization regions of East China. Urban For. Urban Green. 2022, 78, 127772. [Google Scholar] [CrossRef]
  22. Fisher, J.C.; Dallimer, M.; Irvine, K.N.; Aizlewood, S.G.; Austen, G.E.; Fish, R.D.; King, P.M.; Davies, Z.G. Human well-being responses to species’ traits. Nat. Sustain. 2023, 6, 1219–1227. [Google Scholar] [CrossRef]
  23. De Rito, M.; Auer, A.; Mikkelsen, C.; Herrera, L. Linking Farmers’ Perception of Biodiversity, Subjective Well-being and Conservation in the Tandilia System in the Southern Pampas of Argentina. Conserv. Soc. 2022, 20, 336–344. [Google Scholar] [CrossRef]
  24. Wei, H.; Zhang, J.; Xu, Z.; Hui, T.; Guo, P.; Sun, Y. The association between plant diversity and perceived emotions for visitors in urban forests: A pilot study across 49 parks in China. Urban For. Urban Green. 2022, 73, 127613. [Google Scholar] [CrossRef]
  25. Luisetti, T.; Schratzberger, M. Including biological diversity in natural capital accounts for marine biodiversity conservation and human well-being. Biodivers. Conserv. 2023, 32, 405–413. [Google Scholar] [CrossRef]
  26. Higgins, S.L.; Thomas, F.; Goldsmith, B.; Brooks, S.J.; Hassall, C.; Harlow, J.; Stone, D.; Völker, S.; White, P. Urban freshwaters, biodiversity, and human health and well-being: Setting an interdisciplinary research agenda. Wiley Interdiscip. Rev.-Water 2019, 6, e1339. [Google Scholar] [CrossRef]
  27. Yang, S.T.; Li, C.J.; Lou, H.Z.; Luo, Y.; Wang, P.F.; Zhang, J.; Li, X.; Wu, X. The Impact of Urban Expansion on Plant Diversity Change in Karst Regions of Southwest China. Chin. Geogr. Sci. 2022, 32, 493–505. [Google Scholar] [CrossRef]
  28. Ma, B.Q.; Hauer, R.J.; Wei, H.X.; Koeser, A.K.; Peterson, W.; Simons, K.; Timilsina, N.; Werner, L.P.; Xu, C. An Assessment of Street Tree Diversity: Findings and Implications in the United States. Urban For. Urban Green. 2020, 56, 126826. [Google Scholar] [CrossRef]
  29. Fukuda, T.; Inoue, K.; Yabuki, N. PhotoAR+DR2016 Integrating Automatic Estimation of Green View Index and Augmented and Diminished Reality for Architectural Design Simulation. In Proceedings of the 35th International Conference on Education and Research in Computer Aided Architectural Design in Europe (eCAADe), Rome, Italy, 20–22 September 2017; pp. 495–502. [Google Scholar]
  30. Zhang, J.H.; Hu, A.Q. Analyzing green view index and green view index best path using Google street view and deep learning. J. Comput. Des. Eng. 2022, 9, 2010–2023. [Google Scholar] [CrossRef]
  31. Wang, W.J.; Tian, P.L.; Zhang, J.H.; Agathokleous, E.; Xiao, L.; Koike, T.; Wang, H.M.; He, X. Big data-based urban greenness in Chinese megalopolises and possible contribution to air quality control. Sci. Total Environ. 2022, 824, 153834. [Google Scholar] [CrossRef] [PubMed]
  32. Zhang, L.Q.; Tan, P.Y.; Richards, D. Relative importance of quantitative and qualitative aspects of urban green spaces in promoting health. Landsc. Urban Plan. 2021, 213, 104131. [Google Scholar] [CrossRef]
  33. Li, X.J. Examining the spatial distribution and temporal change of the green view index in New York City using Google Street View images and deep learning. Environ. Plan. B-Urban Anal. City Sci. 2021, 48, 2039–2054. [Google Scholar] [CrossRef]
  34. Kaplan, R.; Kaplan, S. The Experience of Nature: A Psychological Perspective; Cambridge University Press: New York, NY, USA, 1989; pp. 194–197. [Google Scholar]
  35. de Vries, J.D.; van Hooff, M.L.M.; Geurts, S.A.E.; Kompier, M.A.J. Process evaluation of the receipt of an exercise intervention for fatigued employees: The role of exposure and exercise experiences. Eur. J. Work Organ. Psychol. 2021, 30, 753–769. [Google Scholar] [CrossRef]
  36. Rudolph, C.W.; Breevaart, K.; Zacher, H. Disentangling Between-Person and Reciprocal Within-Person Relations Among Perceived Leadership and Employee Well-Being. J. Occup. Health Psychol. 2022, 27, 441–450. [Google Scholar] [CrossRef] [PubMed]
  37. Ulrich, R.S.; Simons, R.F.; Losito, B.D.; Fiorito, E.; Miles, M.A.; Zelson, M. Stress recovery during exposure to natural and urban environments. J. Environ. Psychol. 1991, 11, 201–230. [Google Scholar] [CrossRef]
  38. Ohly, H.; White, M.P.; Wheeler, B.W.; Bethel, A.; Ukoumunne, O.C.; Nikolaou, V.; Garside, R. Attention Restoration Theory: A systematic review of the attention restoration potential of exposure to natural environments. J. Toxicol. Environ. Health Part B 2016, 19, 305–343. [Google Scholar] [CrossRef]
  39. WHO Regional Office for Europe. Green and Blue Spaces and Mental Health: New Evidence and Perspectives for Action. Available online: https://apps.who.int/iris/bitstream/handle/10665/342931/9789289055666-eng.pdf (accessed on 12 August 2023).
  40. Boers, S.; Hagoort, K.; Scheepers, F.; Helbich, M. Does Residential Green and Blue Space Promote Recovery in Psychotic Disorders? A Cross-Sectional Study in the Province of Utrecht, The Netherlands. Int. J. Environ. Res. Public Health 2018, 15, 2195. [Google Scholar] [CrossRef] [PubMed]
  41. de Bell, S.; Graham, H.; Jarvis, S.; White, P. The importance of nature in mediating social and psychological benefits associated with visits to freshwater blue space. Landsc. Urban Plan. 2017, 167, 118–127. [Google Scholar] [CrossRef]
  42. Kindermann, G.; Domegan, C.; Britton, E.; Carlin, C.; Mashinchi, M.I.; Ojo, A. Understanding the Dynamics of Green and Blue Spaces for Health and Wellbeing Outcomes in Ireland: A Systemic Stakeholder Perspective. Sustainability 2021, 13, 9553. [Google Scholar] [CrossRef]
  43. Geneshka, M.; Coventry, P.; Cruz, J.; Gilbody, S. Relationship between Green and Blue Spaces with Mental and Physical Health: A Systematic Review of Longitudinal Observational Studies. Int. J. Environ. Res. Public Health 2021, 18, 9010. [Google Scholar] [CrossRef] [PubMed]
  44. He, Q.; Wang, Y.; Qiu, Q.; Su, Y.; Wang, Y.; Wei, H.X.; Li, J.Y. Joint effects of air PM2.5 and socioeconomic dimensions on posted emotions of urban green space visitors in cities experiencing population urbanization: A pilot study on 50 cities of East China. Sci. Total Environ. 2023, 861, 160607. [Google Scholar] [CrossRef]
  45. Wang, X.; Meng, L.; Liu, Y.; Wei, H. Facial Expressions of Urban Forest Visitors Jointly Exposed to Air Pollution and Regional Climate. Forests 2023, 14, 1571. [Google Scholar] [CrossRef]
  46. Zhang, J.; Yang, Z.; Sun, Y.X.; Xu, Z.H.; Hui, T.F.; Guo, P. Experiencing urban forests for mitigation of negative emotions of people exposed to seasonal PM2.5 in Northeast China. J. For. Res. 2023, 34, 1245–1261. [Google Scholar] [CrossRef]
  47. Pan, Z.W.; Xie, Z.Y.; Wu, L.Y.; Pan, Y.; Ding, N.; Liang, Q.S.; Qin, F. Simulation of Cooling Island Effect in Blue-Green Space Based on Multi-Scale Coupling Model. Remote Sens. 2023, 15, 2093. [Google Scholar] [CrossRef]
  48. Li, H.Y.; Wang, X.G.; Wei, H.X.; Xia, T.T.; Liu, M.N.; Ai, S.S. Geographical Distribution and Driving Meteorological Forces of Facial Expressions of Visitors in Urban Wetland Parks in Eastern China. Front. Earth Sci. 2022, 10, 781204. [Google Scholar] [CrossRef]
  49. Mao, B.; Liang, F.; Li, Z.Z.; Zheng, W.Q. Microclimates Potentially Shape Spatial Distribution of Facial Expressions for Urban Forest Visitors: A Regional Study of 30 Parks in North China. Sustainability 2022, 14, 1648. [Google Scholar] [CrossRef]
  50. Pamuk, O. Work-related stress in apparel employees. Tekstil 2007, 56, 627–632. [Google Scholar]
  51. Shu, K.Y. The effect of cognitive behavioral therapy on the release of interpersonal stress. Work-A J. Prev. Assess. Rehabil. 2021, 69, 625–636. [Google Scholar] [CrossRef]
  52. Sultana, N.; Asaduzzaman, M.; Siddique, A.; Khatun, H.; Bari, F.S.; Islam, M.N.; Tabassum, A.; Mondol, A.S.; Sayem, A.; Abdullah, A.Y.M.; et al. Job insecurity and mental health related outcomes among the humanitarian workers during COVID-19 pandemic: A cross-sectional study. BMC Psychol. 2022, 10, 265. [Google Scholar] [CrossRef]
  53. Lai, G.C.; Taylor, E.V.; Haigh, M.M.; Thompson, S.C. Factors Affecting the Retention of Indigenous Australians in the Health Workforce: A Systematic Review. Int. J. Environ. Res. Public Health 2018, 15, 914. [Google Scholar] [CrossRef]
  54. Yun, J.; Zerden, L.D.; Cuddeback, G.; Konrad, T.; Pathman, D.E. Overall Work and Practice Satisfaction of Licensed Clinical Social Workers in the National Health Service Corps Loan Repayment Program. Health Soc. Work 2021, 46, 9–21. [Google Scholar] [CrossRef] [PubMed]
  55. Lehr, D.; Hillert, A.; Keller, S. What Can Balance the Effort? Associations between Effort-Reward Imbalance, Overcommitment, and Affective Disorders in German Teachers. Int. J. Occup. Environ. Health 2009, 15, 374–384. [Google Scholar] [CrossRef] [PubMed]
  56. Abri, M.; Vosoughi, S.; Abolghasemi, J.; Rahimi, J.; Ebrahimi, H. The effect of job security on safety behavior with the moderating role of salary: A structural equation model. Int. J. Occup. Saf. Ergon. 2022, 28, 1732–1737. [Google Scholar] [CrossRef]
  57. Sanchez-Gomez, M.; Breso, E.; Giorgi, G. Could Emotional Intelligence Ability Predict Salary? A Cross-Sectional Study in a Multioccupational Sample. Int. J. Environ. Res. Public Health 2021, 18, 1322. [Google Scholar] [CrossRef] [PubMed]
  58. Brooks, S.K.; Greenberg, N. Non-deployment factors affecting psychological wellbeing in military personnel: Literature review. J. Ment. Health 2018, 27, 80–90. [Google Scholar] [CrossRef]
  59. Aert, R.; Honnay, O.; Van Nieuwenhuyse, A. Biodiversity and human health: Mechanisms and evidnece of the positive health effects of diversity in nature and green spaces. Br. Med. Bull. 2018, 127, 5–22. [Google Scholar] [CrossRef]
  60. Yao, L.X.; Gao, J.; Chen, C.Y.; Mu, D. How Does Emotional Labor Impact Employees’ Perceptions of Well-Being? Examining the Mediating Role of Emotional Disorder. Sustainability 2019, 11, 6798. [Google Scholar] [CrossRef]
  61. Buruck, G.; Dorfel, D.; Kugler, J.; Brom, S.S. Enhancing Well-Being at Work: The Role of Emotion Regulation Skills as Personal Resources. J. Occup. Health Psychol. 2016, 21, 480–493. [Google Scholar] [CrossRef]
  62. Lahat, L.; Ofek, D. Emotional Well-being Among Public Employees: A Comparative Perspective. Rev. Public Pers. Adm. 2022, 42, 31–59. [Google Scholar] [CrossRef]
  63. Wei, H.X.; Hauer, R.J.; Chen, X.; He, X.Y. Facial Expressions of Visitors in Forests along the Urbanization Gradient: What Can We Learn from Selfies on Social Networking Services? Forests 2019, 10, 1049. [Google Scholar] [CrossRef]
  64. Wei, H.X.; Hauer, R.J.; Zhai, X.Q. The Relationship between the Facial Expression of People in University Campus and Host-City Variables. Appl. Sci. 2020, 10, 1474. [Google Scholar] [CrossRef]
  65. Wei, H.; Hauer, R.J.; Guo, S. Daytime dynamic of spontaneous expressions of pedestrians in an urban forest park. Urban For. Urban Green. 2021, 65, 127326. [Google Scholar] [CrossRef]
  66. Wei, H.X.; Hauer, R.J.; He, X.Y. A forest experience does not always evoke positive emotion: A pilot study on unconscious facial expressions using the face reading technology. For. Policy Econ. 2021, 123, 102365. [Google Scholar] [CrossRef]
  67. Wei, H.; Ma, B.; Hauer, R.J.; Liu, C.; Chen, X.; He, X. Relationship between environmental factors and facial expressions of visitors during the urban forest experience. Urban For. Urban Green. 2020, 53, 126699. [Google Scholar] [CrossRef]
  68. Carvajal, M.J.; Peeples, P.; Popovici, I. A Probe into the Wages and Salaries of Health Economics, Outcomes Research, and Market Access Professionals. Appl. Health Econ. Health Policy 2019, 17, 741–751. [Google Scholar] [CrossRef]
  69. de Ree, J.; Muralidharan, K.; Pradhan, M.; Rogers, H. Double for Nothing? Experimental Evidence on an unconditional teacher salary increase in Indonesia. Q. J. Econ. 2018, 133, 993–1039. [Google Scholar] [CrossRef]
  70. Giuntini, F.T.; Ruiz, L.P.; Kirchner, L.D.; Passarelli, D.A.; Dos Reis, M.D.D.; Campbell, A.T.; Ueyama, J. How Do I Feel? Identifying Emotional Expressions on Facebook Reactions Using Clustering Mechanism. IEEE Access 2019, 7, 53909–53921. [Google Scholar] [CrossRef]
  71. Svoray, T.; Dorman, M.; Shahar, G.; Kloog, I. Demonstrating the effect of exposure to nature on happy facial expressions via Flickr data: Advantages of non-intrusive social network data analyses and geoinformatics methodologies. J. Environ. Psychol. 2018, 58, 93–100. [Google Scholar] [CrossRef]
  72. Lin, Y.; Wood, S.A.; Lawler, J.J. The relationship between natural environments and subjective well-being as measured by sentiment expressed on Twitter. Landsc. Urban Plan. 2022, 227, 104539. [Google Scholar] [CrossRef]
  73. Sina Weibo. Weibo, New Things Everyday Everytime. Available online: https://weibo.com/ (accessed on 11 August 2023).
  74. Douyin. Douyin, Records of Good Memories in Lives. Available online: https://www.douyin.com/ (accessed on 11 August 2023).
  75. Guan, H.M.; Wei, H.X.; Hauer, R.J.; Liu, P. Facial expressions of Asian people exposed to constructed urban forests: Accuracy validation and variation assessment. PLoS ONE 2021, 16, e0253141. [Google Scholar] [CrossRef]
  76. Yu, F.; Deng, J.F.; Ding, X.G.; Ma, H.Y. Interpolated Stand Properties of Urban Forest Parks Account for Posted Facial Expressions of Visitors. Sustainability 2022, 14, 3817. [Google Scholar] [CrossRef]
  77. Estoque, R.C.; Murayama, Y. Classification and change detection of built-up lands from Landsat-7 ETM+ and Landsat-8 OLI/TIRS imageries: A comparative assessment of various spectral indices. Ecol. Indic. 2015, 56, 205–217. [Google Scholar] [CrossRef]
  78. Ke, Y.; Im, J.; Lee, J.; Gong, H.; Ryu, Y. Characteristics of Landsat 8 OLI-derived NDVI by comparison with multiple satellite sensors and in-situ observations. Remote Sens. Environ. 2015, 164, 298–313. [Google Scholar] [CrossRef]
  79. Li, Y.J.; Sun, Y.X.; Zhao, Y.; Wang, Y.; Cheng, S.P. Mapping seasonal sentiments of people visiting blue spaces in urban wetlands: A pilot study on inland cities of China. Front. Ecol. Evol. 2022, 10, 969538. [Google Scholar] [CrossRef]
  80. NASA EarthData. Available online: https://search.earthdata.nasa.gov/search/?ac=true&m=0.0703125!0!2!1!0!0%2C2 (accessed on 9 July 2023).
  81. Japan Aerospace Exploration Agency. ALOS World 3D—30 m. Available online: https://portal.opentopography.org/datasetMetadata?otCollectionID=OT.112016.4326.2 (accessed on 10 July 2023).
  82. Schirpke, U.; Tasser, E.; Tappeiner, U. Predicting scenic beauty of mountain regions. Landsc. Urban Plan. 2013, 111, 1–12. [Google Scholar] [CrossRef]
  83. Baidu. Baidu Intelligent Cloud, Application Programming InterFace Center. Available online: https://cloud.baidu.com/doc/API/index.html (accessed on 12 August 2023).
  84. Baidu. Baidu Map. Available online: https://map.baidu.com/ (accessed on 12 August 2023).
  85. Cityscapes Dataset. Semantic Understanding of Urban Street Scenes. Available online: https://www.cityscapes-dataset.com/ (accessed on 12 August 2023).
  86. Nelder, J.A.; Wedderburn, R.W.M. Generalized Linear Models. J. R. Stat. Soc. Ser. A 1972, 135, 370–384. [Google Scholar] [CrossRef]
  87. SAS Institute Inc. The Genmod Procedure. In SAS/STAT 14.3—User’s Guide; SAS Institute Inc.: Cary, NC, USA, 2017; pp. 3165 + 3312. [Google Scholar]
  88. Conover, W.J.; Iman, R.L. Rank transformations as a bridge between parametric and nonparametric statistics. Am. Stat. 1981, 35, 124–129. [Google Scholar]
  89. Quinn, A.; Ji, P.S.; Nackerud, L. Predictors of secondary traumatic stress among social workers: Supervision, income, and caseload size. J. Soc. Work 2019, 19, 504–528. [Google Scholar] [CrossRef]
  90. Zhang, C.Y.; Liu, Y.L. The salary of physicians in Chinese public tertiary hospitals: A national cross-sectiona and follow-up study. BMC Health Serv. Res. 2018, 18, 661. [Google Scholar] [CrossRef] [PubMed]
  91. Xiong, G.X.; Wang, X.T.; Li, A.M. Leave or Stay as a Risky Choice: Effects of Salary Reference Points and Anchors on Turnover Intention. Front. Psychol. 2018, 9, 686. [Google Scholar] [CrossRef]
  92. Pouliakas, K. Pay Enough, Don’t Pay Too Much or Don’t Pay at All? The Impact of Bonus Intensity on Job Satisfaction. Kyklos 2010, 63, 597–626. [Google Scholar] [CrossRef]
  93. Samus, A.; Freeman, C.; Dickinson, K.J.M.; Van Heezik, Y. Relationships between nature connectedness, biodiversity of private gardens, and mental well-being during the COVID-19 lockdown. Urban For. Urban Green. 2022, 69, 127519. [Google Scholar] [CrossRef]
  94. Xiao, L.; Wang, W.J.; Ren, Z.B.; Fu, Y.; Lv, H.L.; He, X.Y. Two-city street-view greenery variations and association with forest attributes and landscape metrics in NE China. Landsc. Ecol. 2021, 36, 1261–1280. [Google Scholar] [CrossRef]
  95. He, J.; Zhang, J.; Yao, Y.; Li, X. Extracting human perceptions from street view images for better assessing urban renewal potential. Cities 2023, 134, 104189. [Google Scholar] [CrossRef]
Figure 1. Layout and design the study. Abbreviations: DSM, digital surface model; DEM, digital elevation model; NDVI, normalized difference vegetation index; and NDWI, normalized difference water index.
Land 12 02075 g001
Figure 2. Spatial distributions of industrial parks across a geographical range of East China.
Land 12 02075 g002
Figure 3. The illustration of buffer areas in a circle with a radius of 2 km for industrial parks with the largest (Shanghai Int. Tour. Park), medium (Taiyuan Qinghua S&T Park), and minimum (Zhejiang Xiangyuan Cul. Tour. Park) areas.
Land 12 02075 g003
Figure 4. Typical views in Baidu street view images with green view indexes (GVIs) variation from 0.00% (A) through a median of 11.09% (B) to 87.94% (C). All images are randomly crawled at coordinates of grids (3.14 ha) from a 2 km radius buffer area surrounding an industrial park in China.
Land 12 02075 g004
Figure 5. Spatial distributions of elevation (DEM) (A) and surface feature height (B), area (C) and height of green spaces (D), and blue space area (E) in buffer areas of industrial parks of East China.
Land 12 02075 g005
Figure 6. Spatial distributions of green view index (GVI) (A), Simpson diversity index (B), Shannon Wiener diversity index (C), and plant species amount (D) in buffer areas of industrial parks of East China.
Land 12 02075 g006
Figure 7. Spatial distributions of facial expression scores for happy (A), sad (B), neutral (C), and PRI scores (D) of employees in industrial parks of east China.
Land 12 02075 g007
Figure 8. Spatial distributions of values for recruitment wage (Rw) (A), salary satisfaction (SS) (B), and their difference (Rw-SS) (C) in industrial parks of East China.
Land 12 02075 g008
Figure 9. Multivariate linear regression (MLR) models of ranked scores for happy (A), sad (B), and neutral (C) emotions as well as PRI (D) for employees against combined explanatory factors of elevation (Buffer DEM), surface feature height in green space (Green space height), green space area, GVI, and Simpson index in buffer areas of industrial parks. Dots present significant parameter estimates (p < 0.05) for independent factors with error bars marking standard errors.
Land 12 02075 g009
Figure 10. The MLR model of salary satisfaction for employees against combined explanatory factors of elevation (Buffer DEM), surface feature height in green space (Green space height), green space area, GVI, and Simpson index in buffer areas of industrial parks. Dots present significant parameter estimates (p < 0.05) for independent factors with error bars marking standard errors.
Land 12 02075 g010
Table 1. List of industrial parks with names, coordinates, and numbers of posed employees’ photos.
OrderIndustrial Park NameLongitude (°)Latitude (°)Photo No.
1Harbin S&T 1 Innov. 2 Park126.46845.81795
2Great Northern Wilderness Park126.68745.73392
3Changchun Beihu S&T Park125.39043.98487
4Changchun Railway Traffic Indus. 3 Park125.19043.96784
5Shenyang Institute of Engineering S&T Park123.43941.92557
6Tiexi 1905 Innov. Cultural Park123.37341.81488
7Shenyang Chem. Indus. Park123.17641.74248
8Sany Heavy Inc. 4 Park (Beijing)116.28740.08971
9Beijing Qinghua S&T Park116.32539.99398
10Zhongguancun S&T Park116.37139.99296
11Tianjin Free Trade Pilot Zone Dongli Aviation Indus. Park117.37339.10386
12Tianjin Coastal S&T Park117.67939.05085
13Hebei Univ. 5 S&T Park115.45738.91593
14Dalian Software Park121.53938.88392
15Ningxia Built Materials Group Shares Inc. Park106.23638.49774
16Taiyuan Qinghua S&T Park112.54037.79589
17National Torch Plan Software Indus. Base Shanxi Software Park112.56237.79381
18Jinan Int. Biol. 6 Med. 7 Park117.12936.68093
19Qilu Software Park117.12736.67197
20Qingdao Int. Academician Harbor Intelligent Manufacture Park120.36436.21897
21Qingdao Haier S&T Inc. Park120.42236.13296
22Qingdao Software Park120.40936.07691
23National 863 Central Software Park113.55734.81791
24Henan E-Commerce Indus. Park113.53834.80382
25Henan National Univ. S&T Park-West113.53834.79386
26Henan Agr. 8 High-Tech. S&T Park 114.10934.73787
27Henan Communication Indus. Park113.74734.73079
28Luoyang Hengsheng S&T Park112.49434.62640
29Ancient Steel Mill Design Creativity Indus. Park109.01734.24791
30Xi’an Qinghua S&T Park108.87934.22875
31Xidian Univ. S&T Park108.90134.22783
32Xi’an Software Park108.87634.22586
33Xi’an Jiaotong Univ. National Univ. S&T Park108.99734.22490
34Zhangjiagang Tariff-Free Sci. 9 Innov. Park120.46431.93881
35Meicun Indus. Central Park120.41431.55294
36National Auto-Parts (Suzhou) Production Base120.68131.47883
37Jiading Indus. Dev. 10 Park121.26431.33289
38Jiangsu Tianmu Lake Tourism Joint Stock Company Park119.43031.31791
39Shanghai Int. Tourism Park121.66231.14489
40Shanghai Xinghuo Dev. Area 121.55030.85578
41Shanghai Chem. Indus. Park121.46230.81577
42Shanghai Fine Chem. Eng. Ind. Park121.28130.73283
43Zhejiang Xiangyuan Cultural Tourism Inc. Park120.15430.27857
44Hangzhou Tianmu Mountain Med. Inc. Park119.70130.19267
45Zhejiang Haizheng Med. Indus. Inc. Park121.49928.66252
46Fuzhou High Tech Area Three Innovations Indus. Park119.22425.94948
47Shilong Indus. Transfer Park114.12024.94686
48Guangzhou Mingzhu Indus. Park113.53423.59377
49Oversea Chinese S&T Indus. Park113.27923.45991
50Sihui Fine Chem. Indus. Park 112.65423.45381
51Asian Alumium Indus. City112.86323.34095
52Shantou Haojiang District Nanshan Bay Indus. Park 116.70723.25679
53Zhaoqing Jintao Indus. Park112.75523.11181
54Huawei Southern Production Base Park113.89522.95987
55BYD Auto Indus. Park114.36422.68197
56Qing Bay Indus. Park113.35822.07484
1 S&T, science and technology; 2 Innov., innovation; 3 Indus., industry; 4 Inc., incorporated; 5 Univ., university; 6 Boil., biology; 7 Med., medicine; 8 Agr., agriculture; 9 Sci., science; and 10 Dev., development.
Table 2. Correlations between pairs of facial expression scores.
VariablesCoefficientsHappySadNeutralPRI
HappyR1−0.6858−0.89920.9693
P <0.0001<0.0001<0.0001
SadR 10.2983−0.8437
P 0.0256<0.0001
NeutralR 1−0.7640
P <0.0001
PRIR 1
P
Disclaimer/Publisher’s Note: The statements, opinions and data contained in all publications are solely those of the individual author(s) and contributor(s) and not of MDPI and/or the editor(s). MDPI and/or the editor(s) disclaim responsibility for any injury to people or property resulting from any ideas, methods, instructions or products referred to in the content.

