
Monitoring Seasonal Fluctuations in Saline Lakes of Tunisia Using Earth Observation Data Processed by GRASS GIS


Abstract
:1. Introduction
1.1. Background
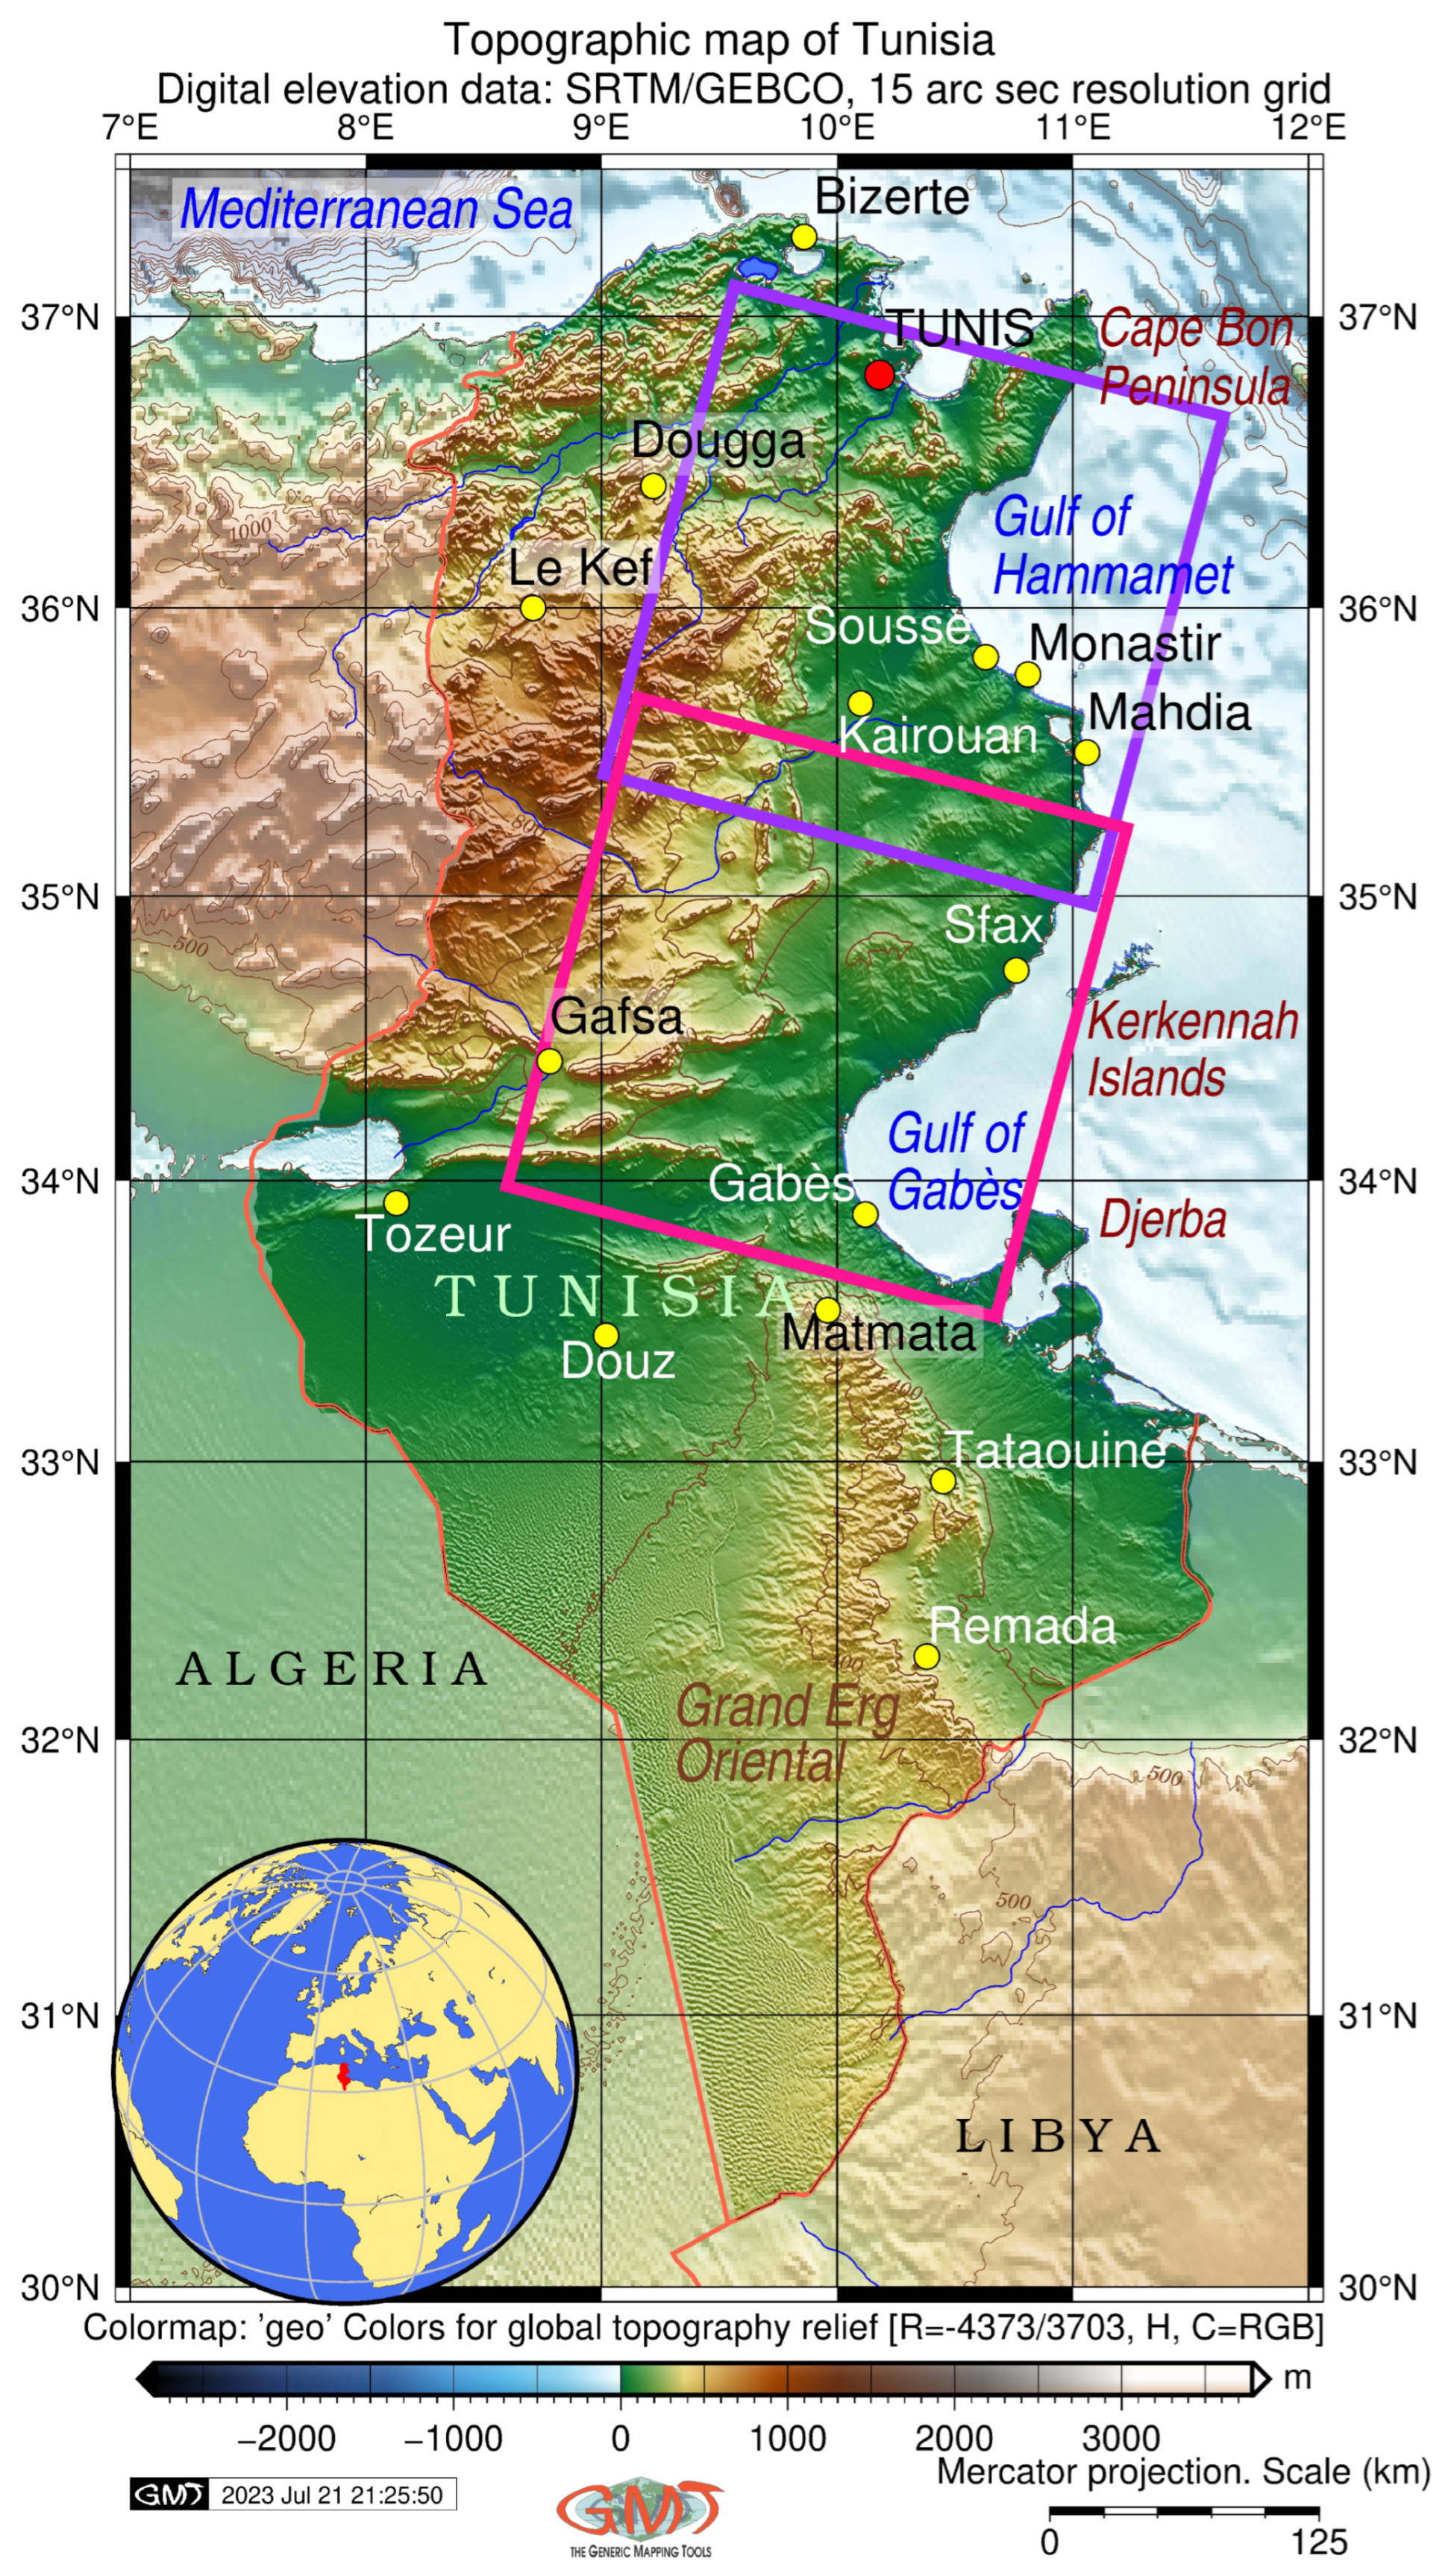
1.2. Study Area
2. Materials and Methods
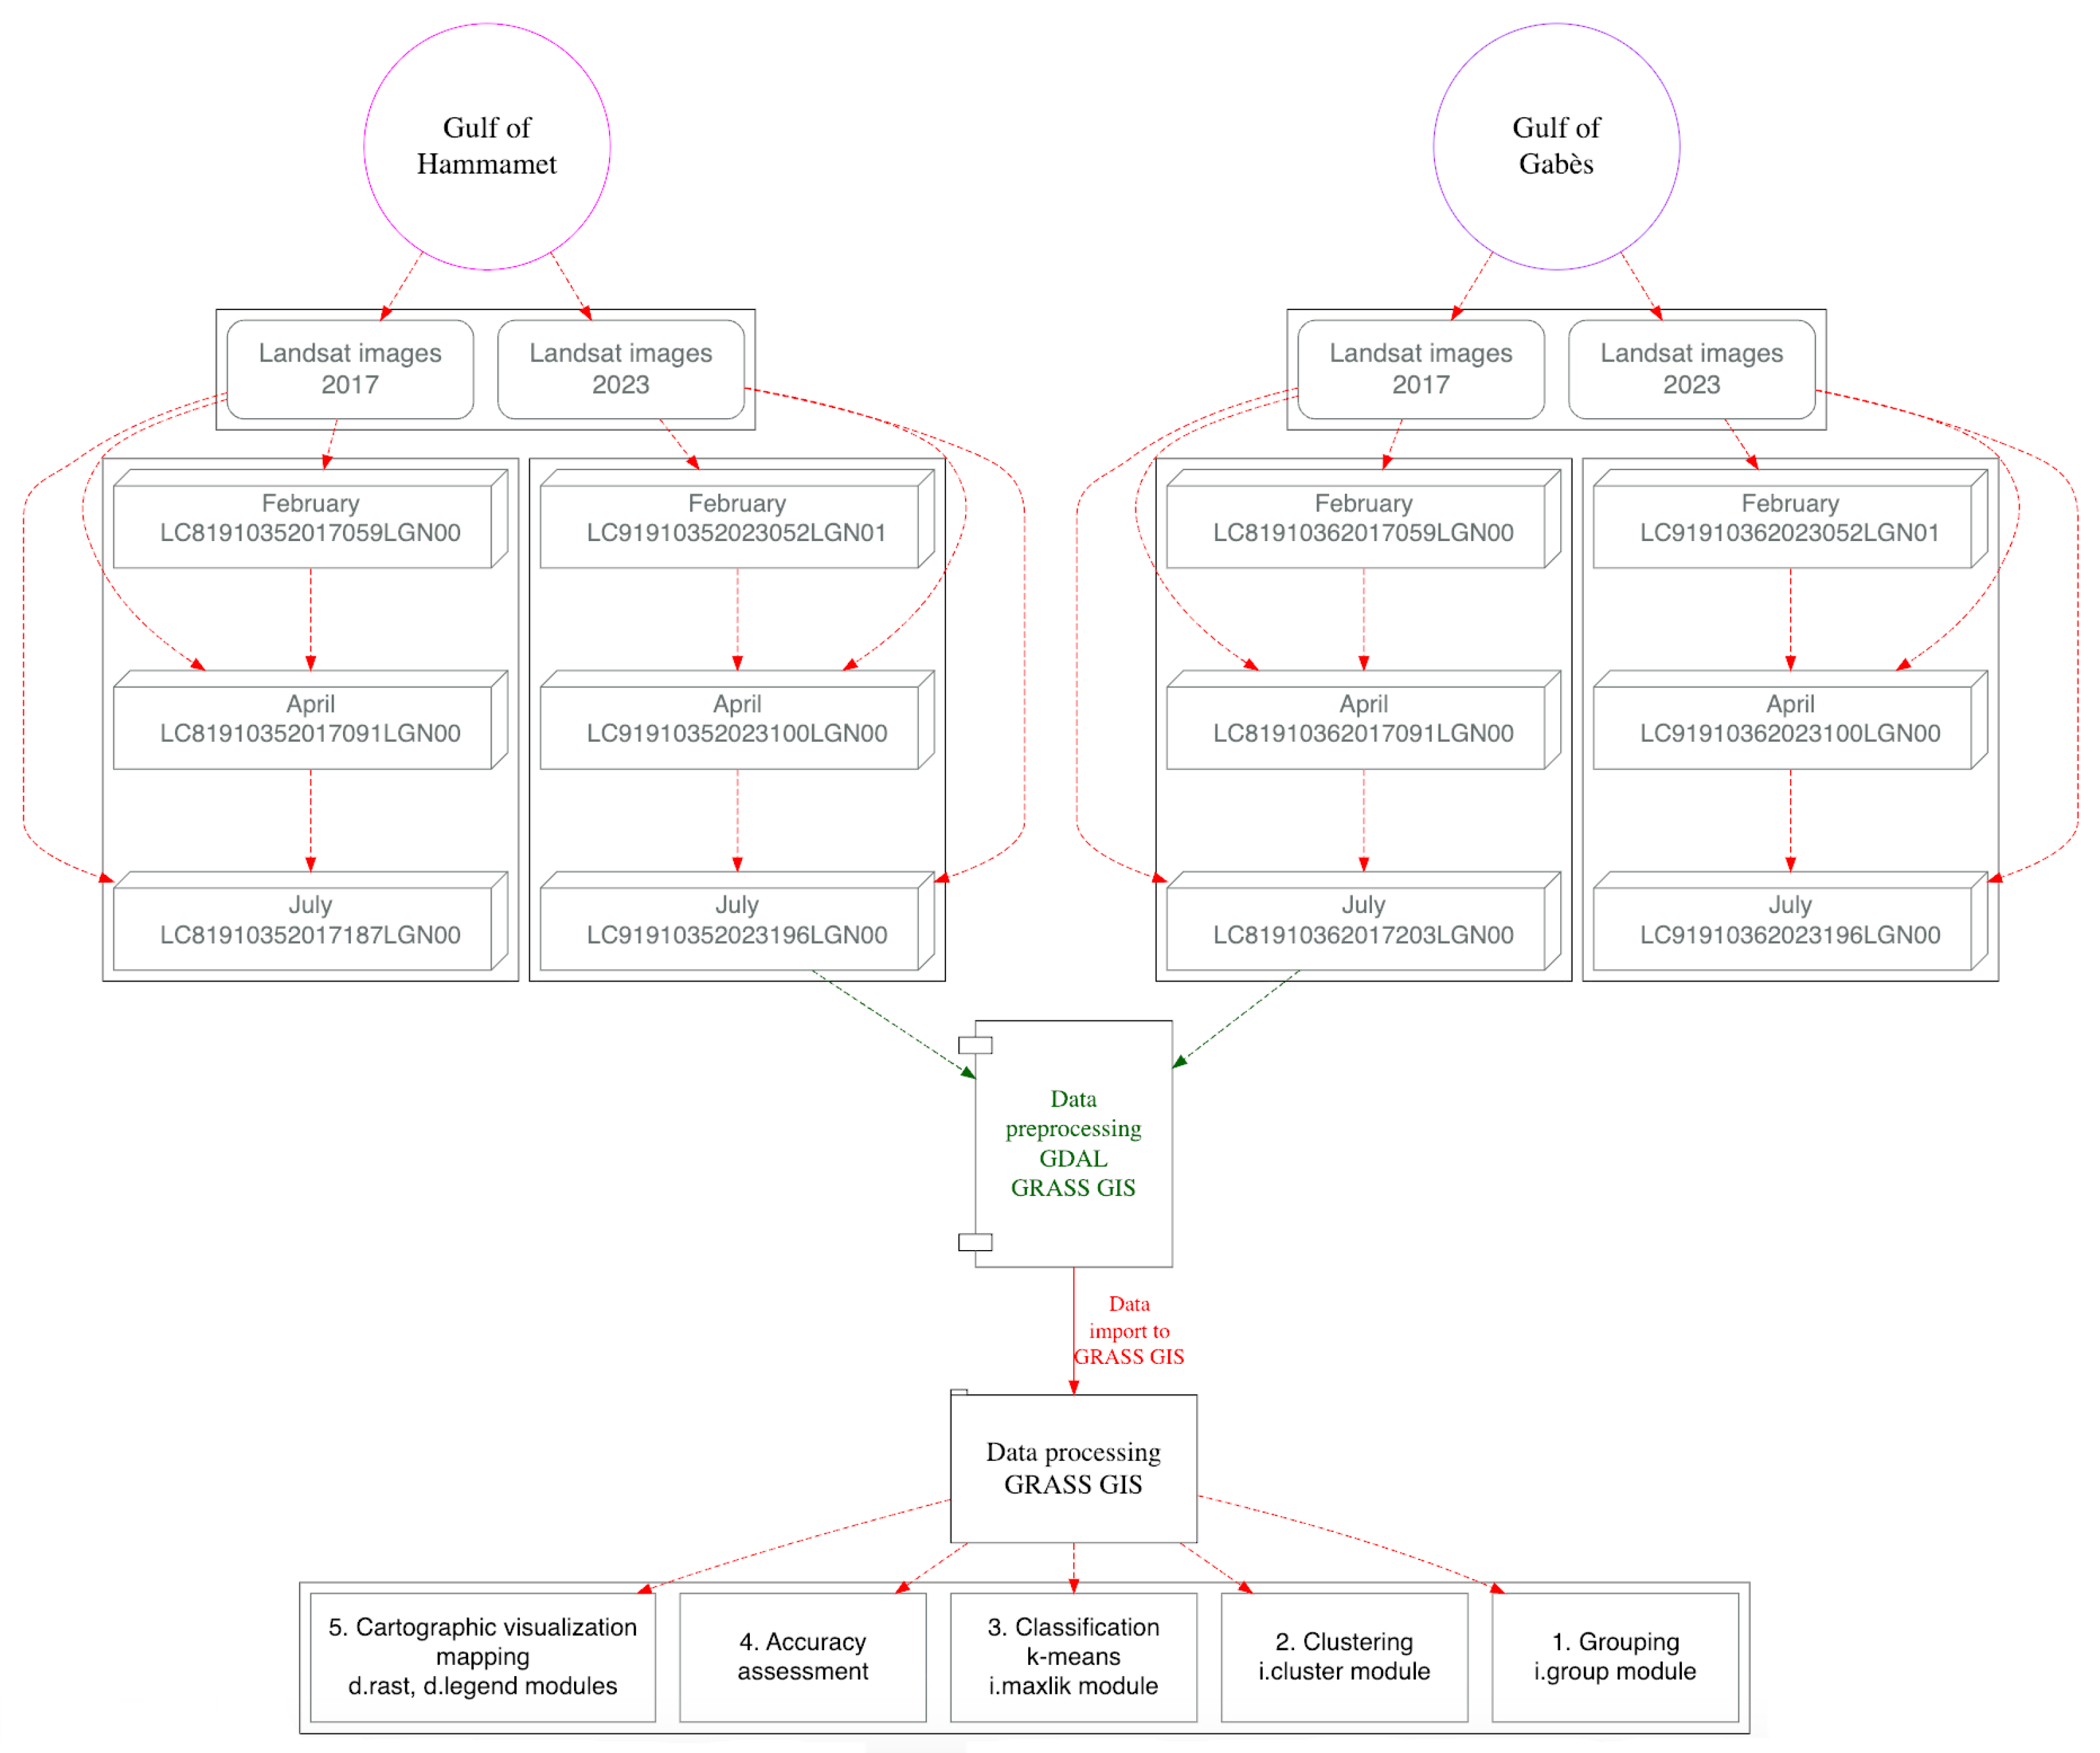
2.1. Data
2.2. Methods
2.2.1. Data Preprocessing
- Inherent modules for image processing, analysis, spatial modelling, and visualization, graphical plotting and maps production;
- Streamlining and automating a series of duplicated tasks through scripts for iterated processing of different images as a time series of Landsat 8-9 OLI/TIRS data;
- Diversified process of segmented data handling through a programming approach that enables the breakdown of the workflow into a set of individual commands and the catching and cleaning of data errors before mapping.
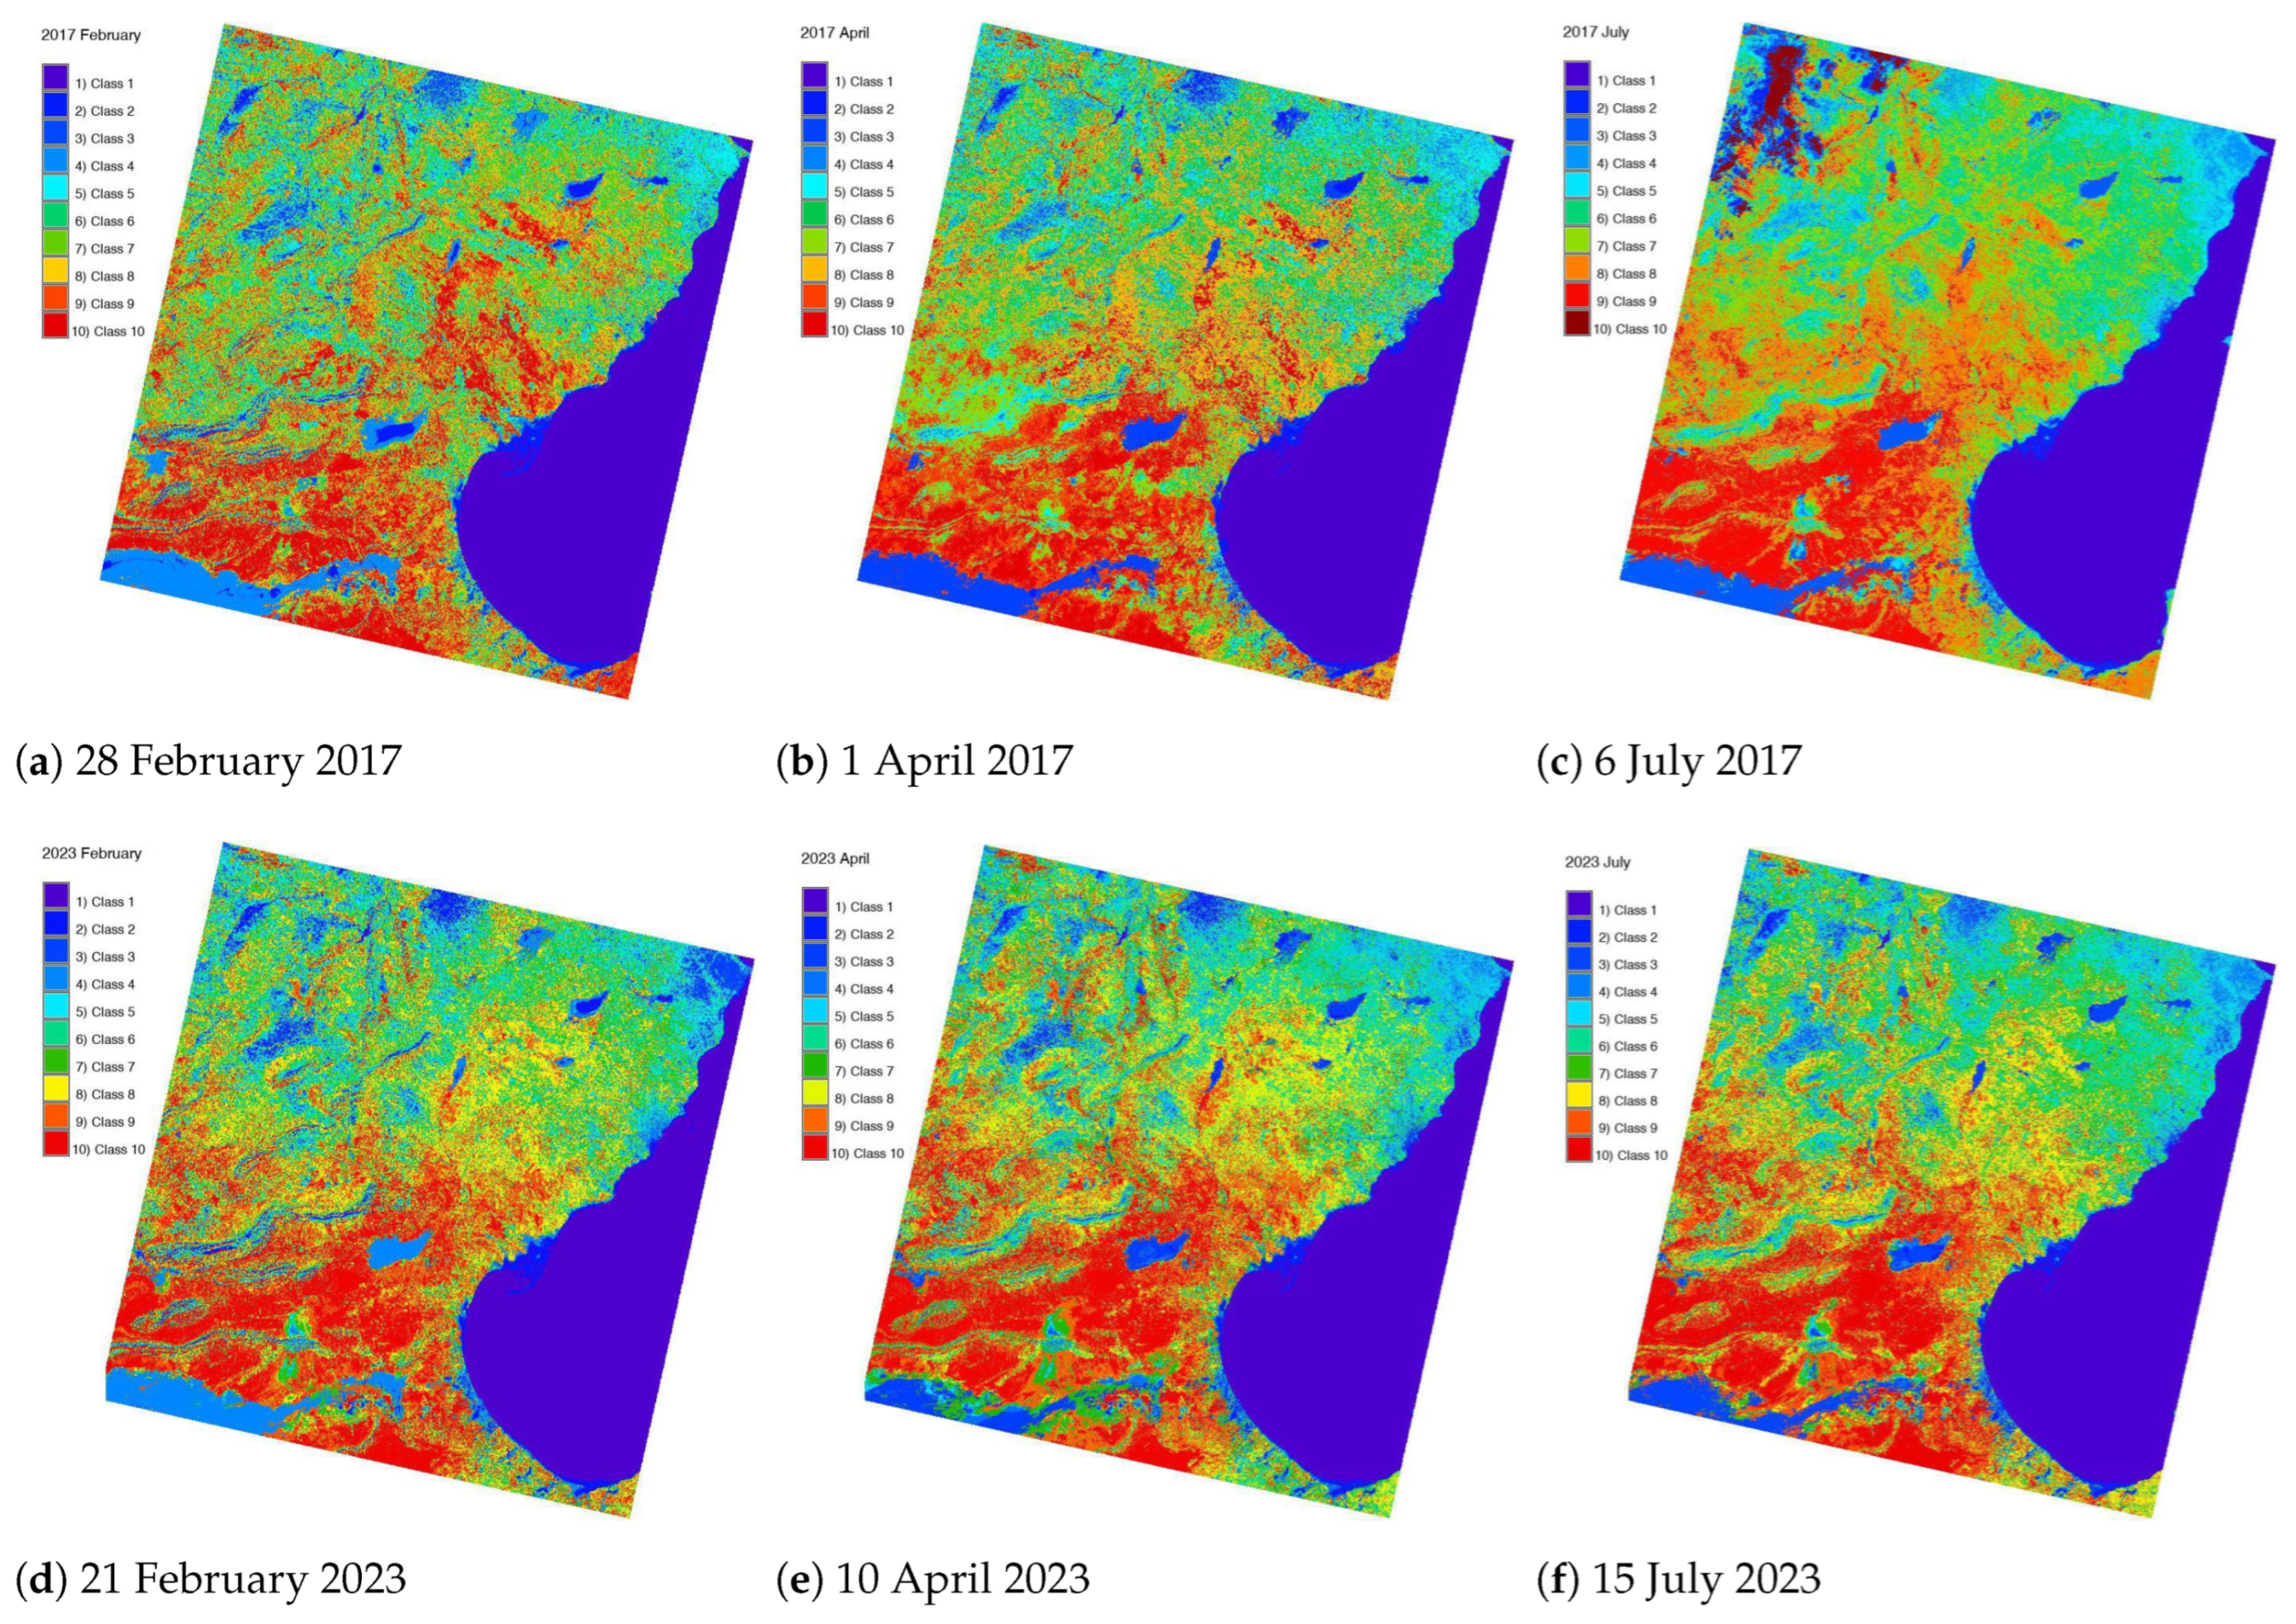
2.2.2. Data Clustering
2.2.3. Image Classification
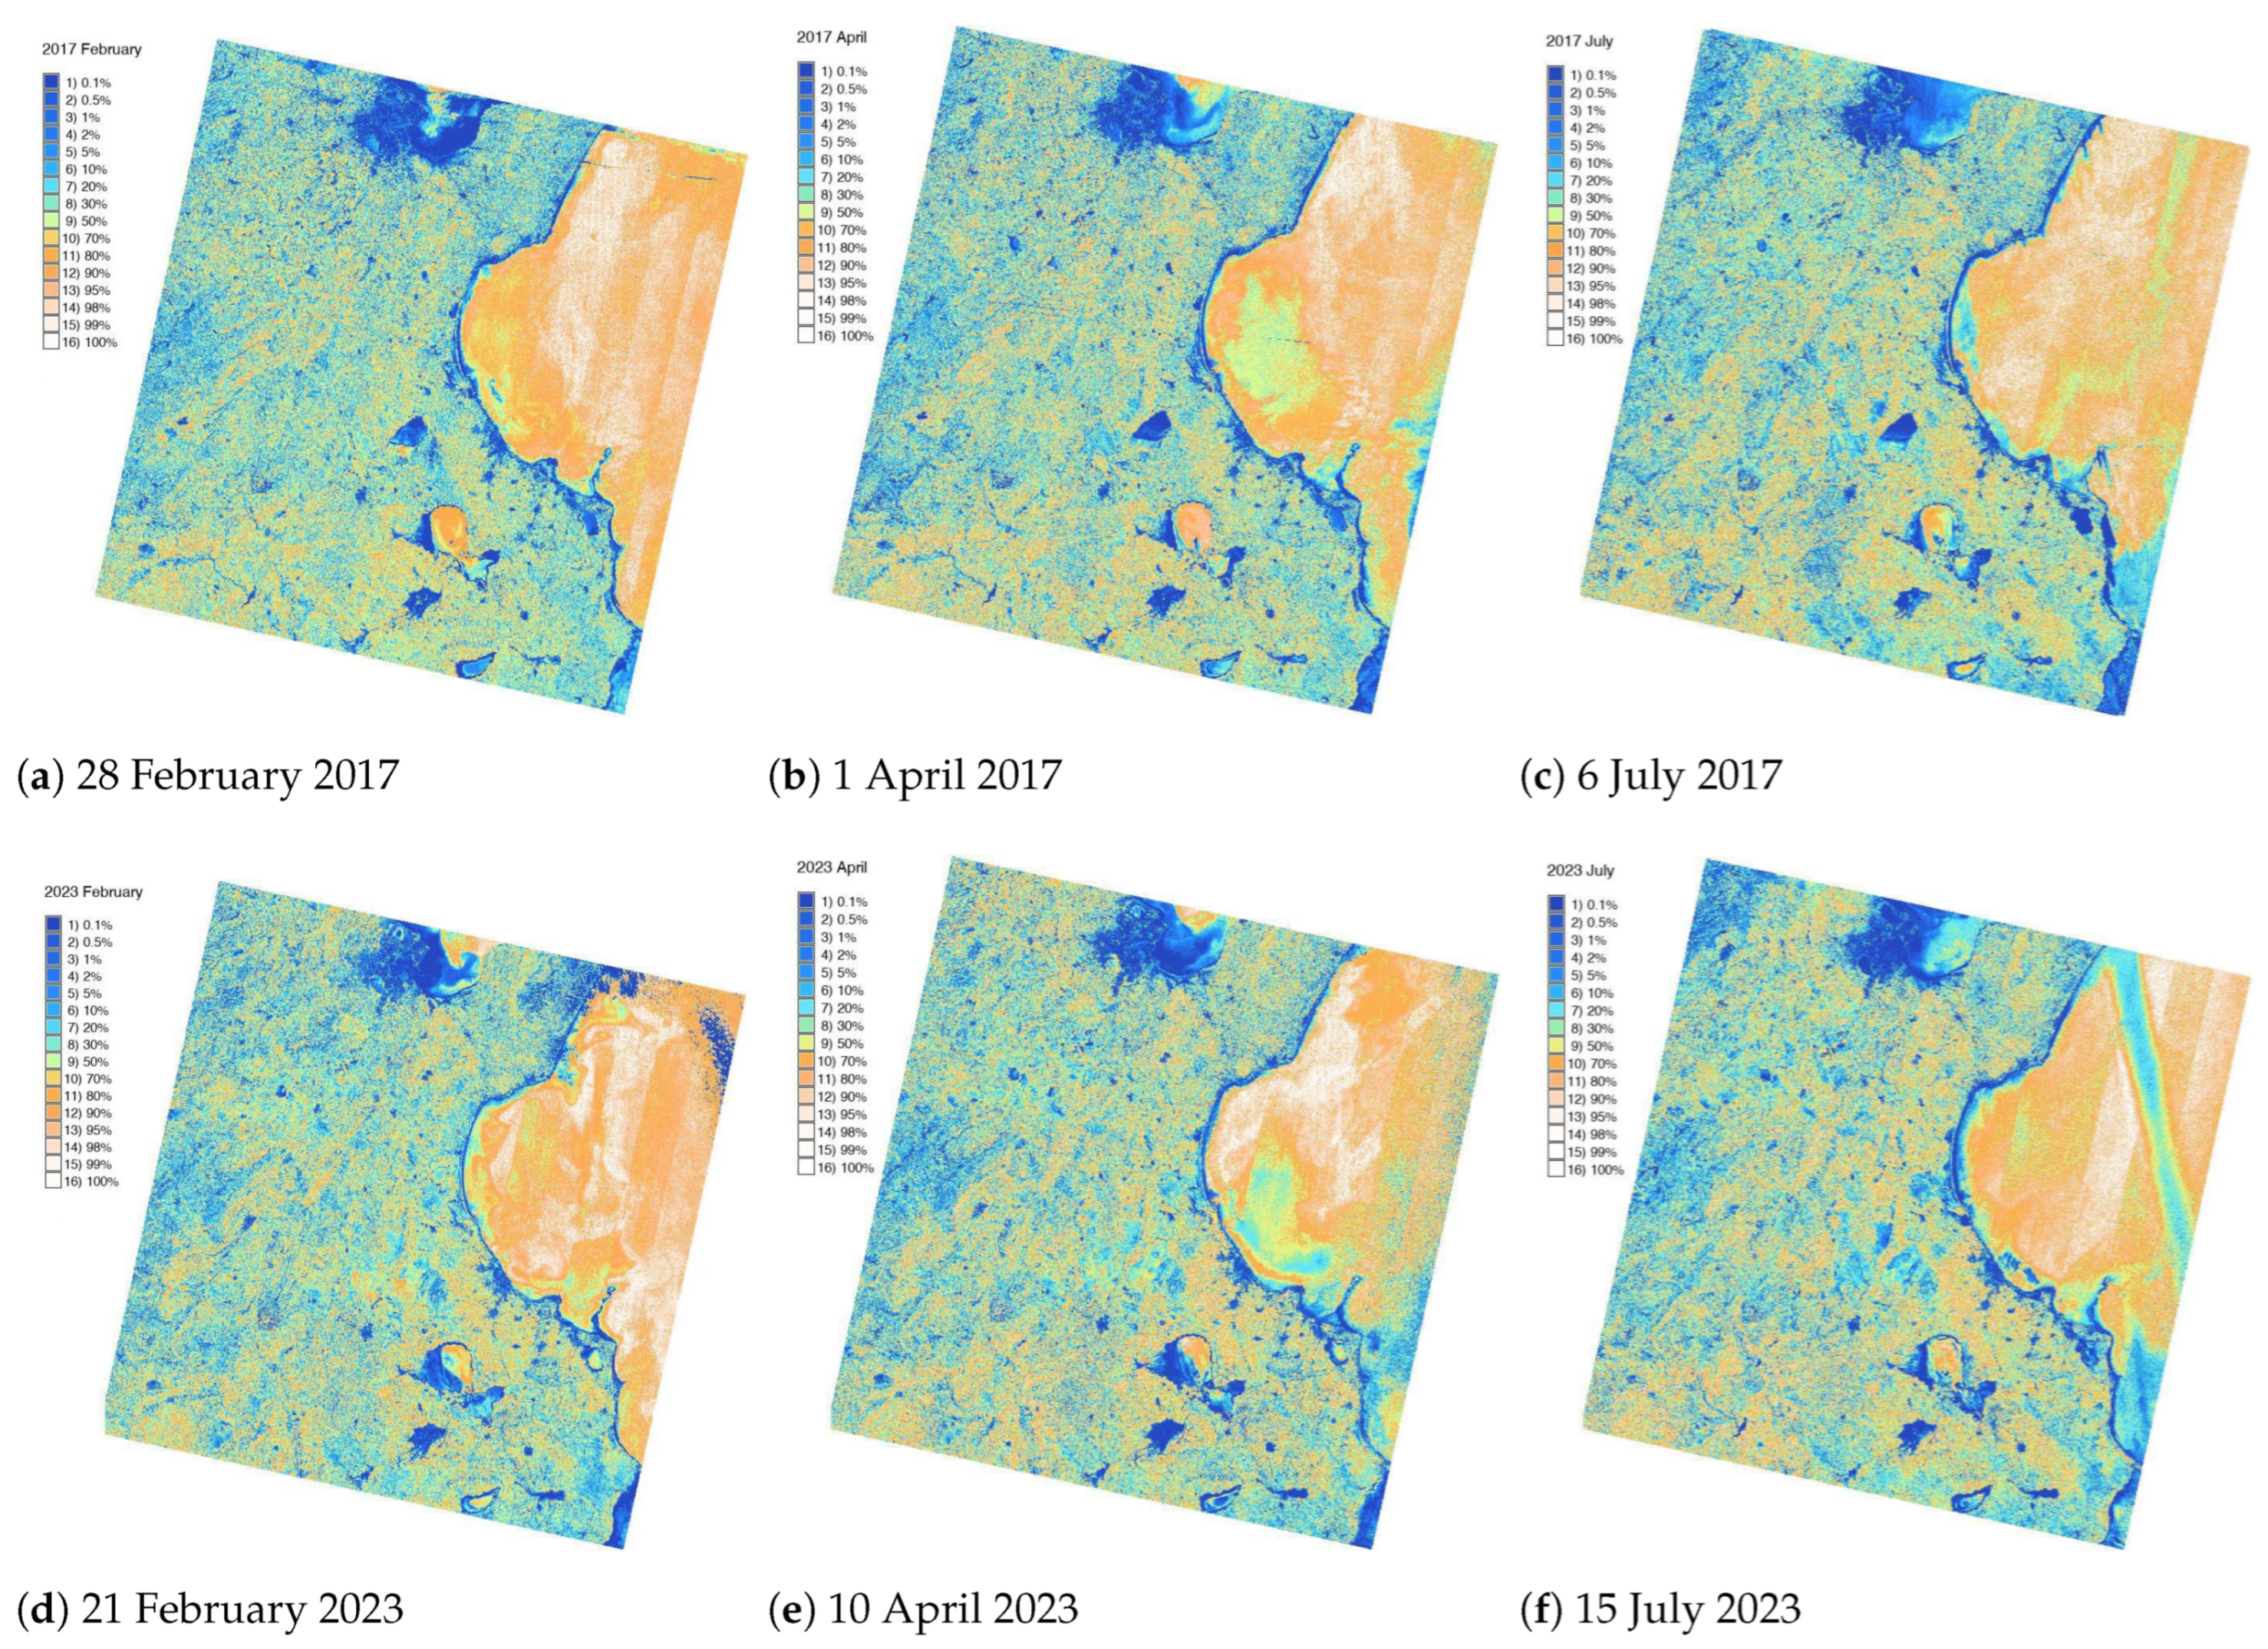
2.2.4. Accuracy Analysis
2.2.5. Mapping
- ‘r.import’ used for data import via the embedded GDAL library; the extent and resolution were adjusted to the region of the Landsat scenes;
- ‘g.list’ for listing imported raster data type by the search pattern of GRASS GIS;
- ‘g.region’ for defining the computational extent of the region to match the scenes;
- ‘i.cluster’ for clustering the raster Landsat images using k-means algorithm;
- ‘i.maxlik’ for unsupervised image classification using maximum likelihood method;
- ‘d.mon’ for displaying visualisation and cartographic plotting;
- ‘r.colors’ for adjusting the colour palette according to the land cover types;
- ‘d.rast’ for mapping the image in the active graphics frame;
- ‘d.legend’ for adding the colour legend with textual notations;
- ‘d.out.file’ for data export to the conventional formats (JPG).
3. Results and Discussion
4. Conclusions
4.1. Summary
4.2. Recommendations
- 1.
- Make the initial study similar to the image processing workflow in this report, but also use other GRASS GIS modules applied for processing the target dates. For example, a useful approach is segmentation by ‘i.segment’.
- 2.
- Due to the dynamics of plant phenology in different months, the period of image capture should be identical to evaluate the changes for each image. For example, correct comparison can be performed using images taken for a specific month, e.g., January, in a sequence of several years. Alternatively, use several identical months for two years, as presented in this study.
- 3.
- Cloudiness varies a lot in different images. It is necessary to use a cloud-free series of images as a reliable input dataset. While, in this study, 10% cloud coverage was applied, the modified parameters optimised with different cloud content can be tested and applied with decreased cloud coverage. The use of the ‘i.landsat.acca’ module of the GRASS GIS enables Automatic Cloud Cover Assessment (ACCA) for a quick evaluation of image quality and suitability.
- 4.
- Process other datasets in addition to the Landsat, e.g., Advanced Spaceborne Thermal Emission and Reflection Radiometer (ASTER) images. ASTER data can be processed using special modules of ‘i.aster.toar’, similar to the ‘i.landsat.toar’. The main advantage of ASTER is a higher resolution with a pixel size of 15 m compared to the 30 m Landsat.
- 5.
- For mapping, take satellite images from the USGS on diverse dates to evaluate spatio-temporal dynamics and perform mapping based on images captured on different seasonal periods to compare the difference in salinisation between the lakes.
- 6.
- The commercial GIS currently available on the market typically have license. Therefore, one can take open-source GIS software such as QGIS or GRASS GIS, which have effective tools and extended functionality which are used for for RS and cartographic workload.
- 7.
- Evaluate the integral effects from various factors that might cause land cover changes, i.e., the heat from the increased temperature, decreased precipitation and high evaporation lead to desertification of landscapes.
- 8.
- The access to groundwater and the geographic location of the landscapes affect the response of vegetation. For instance, closeness to the desert or coastal areas affect differently the patterns of plants in the landscapes.
- 9.
- For analysis of vegetation health and vigour, the computation of the NDVI or other vegetation indices is a useful means of environmental assessment. In GRASS GIS, vegetation indices can be automatically calculated using the embedded formulae adjusted to the bands of the image. For example, NIR and Red channels correspond to bands 5 and 4 for the Landsat 8-9 OLI/TIRS, and to bands 4 and 3 for older Landsat 7 ETM+ images.
- 10.
- Changes in land cover types within certain limits indicate landscape dynamics as a response to the environmental and climate effects and processes. Moreover, it may indicate the cumulative effects of several factors on soil-vegetation conditions, including both climate–environmental processes and anthropogenic activities.
4.3. Concluding Remarks
Funding
Institutional Review Board Statement
Informed Consent Statement
Data Availability Statement
Acknowledgments
Conflicts of Interest
Abbreviations
| ACCA | Automatic Cloud Cover Assessment |
| ASTER | Advanced Spaceborne Thermal Emission and Reflection Radiometer |
| AVHRR | Advanced Very High Resolution Radiometer |
| CSV | Comma-Separated Values |
| DEM | Digital Elevation Model |
| ERDAS | Earth Resources Data Analysis System |
| FAO | Food and Agriculture Organization |
| GEBCO | General Bathymetric Chart of the Oceans |
| GDAL | Geospatial Data Abstraction Library |
| GMT | Generic Mapping Tools |
| GIS | Geographic Information System |
| GUI | Graphical User Interface |
| GRASS | Geographic Resources Analysis Support System |
| Landsat OLI/TIRS | Landsat Operational Land Imager and Thermal Infrared Sensor |
| LiDAR | Light Detection and Ranging |
| MODIS | Moderate Resolution Imaging Spectroradiometer |
| NASA | National Aeronautics and Space Administration |
| NIR | Near-infrared |
| RGB | Red Green Blue |
| RS | Remote Sensing |
| SPOT | Satellite Pour l’Observation de la Terre |
| SWIR | Short-wave infrared (SWIR)-1 |
| USGS | United States Geological Survey |
References
- Boussetta, A.; Niculescu, S.; Bengoufa, S.; Zagrarni, M.F. Spatio-temporal analysis of shoreline changes and erosion risk assessment along Jerba island (Tunisia) based on remote-sensing data and geospatial tools. Reg. Stud. Mar. Sci. 2022, 55, 102564. [Google Scholar] [CrossRef]
- Jones, A.R.; Millington, A. Spring mound and aioun mapping from Landsat TM imagery in south-central Tunisia. Remote Sens. Resour. Dev. Environ. Manag. 1986, 2, 607–613. [Google Scholar]
- Pontanier, R.; Le Floc’h, E.; Floret, C. La désertisation en Tunisie présaharienne. Rev. Des. Mondes Musulmans Méditerranée 1986, 41, 291–326. [Google Scholar] [CrossRef]
- Lemenkova, P.; Debeir, O. Recognizing the Wadi Fluvial Structure and Stream Network in the Qena Bend of the Nile River, Egypt, on Landsat 8-9 OLI Images. Information 2023, 14, 249. [Google Scholar] [CrossRef]
- Yaiche Achour, H.; Saadi, S.A. Chapter 18 - African salt lakes: Distribution, microbial biodiversity, and biotechnological potential. In Lakes of Africa; El-Sheekh, M., Elsaied, H.E., Eds.; Elsevier: Amsterdam, The Netherlands, 2023; pp. 501–525. [Google Scholar] [CrossRef]
- Monget, J.M.; Cano, D.; Bénard, M.; Bardinet, C. Télédétection par Météosat des paysages d’Algérie et de Tunisie: Contours et classification des unités physiques dans l’albédo moyen de Mai 1979. Méditerranée 1985, 54, 95–105. [Google Scholar] [CrossRef]
- Lemenkova, P.; Debeir, O. Satellite Image Processing by Python and R Using Landsat 9 OLI/TIRS and SRTM DEM Data on Côte d’Ivoire, West Africa. J. Imaging 2022, 8, 317. [Google Scholar] [CrossRef] [PubMed]
- Campos, J.C.; Brito, J.C. Mapping underrepresented land cover heterogeneity in arid regions: The Sahara-Sahel example. ISPRS J. Photogramm. Remote Sens. 2018, 146, 211–220. [Google Scholar] [CrossRef]
- Savelonas, M.A.; Veinidis, C.N.; Bartsokas, T.K. Computer Vision and Pattern Recognition for the Analysis of 2D/3D Remote Sensing Data in Geoscience: A Survey. Remote Sens. 2022, 14, 6017. [Google Scholar] [CrossRef]
- Boussema, S.B.F.; Allouche, F.K.; Ajmi, R.; Chaabane, B.; Gad, A.A. Assessing and monitoring the effects of land cover changes in biodiversity. Case study: Mediterranean coastal region, Sousse, Tunisia. Egypt. J. Remote Sens. Space Sci. 2023, 26, 185–196. [Google Scholar] [CrossRef]
- Smida, H.; Dassi, L.; Boukhachem, K.; Masrouhi, A. Satellite remote sensing and GIS-based multi-criteria analysis for the assessment of groundwater potentiality in fractured limestone aquifer: Case study of Maknassy Basin, central Tunisia. J. Afr. Earth Sci. 2022, 195, 104643. [Google Scholar] [CrossRef]
- Lemenkova, P.; Debeir, O. Computing Vegetation Indices from the Satellite Images Using GRASS GIS Scripts for Monitoring Mangrove Forests in the Coastal Landscapes of Niger Delta, Nigeria. J. Mar. Sci. Eng. 2023, 11, 871. [Google Scholar] [CrossRef]
- Bryant, R.G. Application of AVHRR to monitoring a climatically sensitive playa. case study: Chott El Djerid, Southern Tunisia. Earth Surf. Process. Landforms 1999, 24, 283–302. [Google Scholar] [CrossRef]
- Li, A.; Song, K.; Chen, S.; Mu, Y.; Xu, Z.; Zeng, Q. Mapping African wetlands for 2020 using multiple spectral, geo-ecological features and Google Earth Engine. ISPRS J. Photogramm. Remote Sens. 2022, 193, 252–268. [Google Scholar] [CrossRef]
- Touhami, I.; Moutahir, H.; Assoul, D.; Bergaoui, K.; Aouinti, H.; Bellot, J.; Andreu, J.M. Multi-year monitoring land surface phenology in relation to climatic variables using MODIS-NDVI time-series in Mediterranean forest, Northeast Tunisia. Acta Oecologica 2022, 114, 103804. [Google Scholar] [CrossRef]
- Rhif, M.; Abbes, A.B.; Martinez, B.; de Jong, R.; Sang, Y.; Farah, I.R. Detection of trend and seasonal changes in non-stationary remote sensing data: Case study of Tunisia vegetation dynamics. Ecol. Inform. 2022, 69, 101596. [Google Scholar] [CrossRef]
- Rebillard, P.; Pascaud, P.; Sarrat, D. Merging Landsat and spaceborne radar data over Tunisia. Adv. Space Res. 1984, 4, 133–138. [Google Scholar] [CrossRef]
- Chouari, W. Contributions of multispectral images to the study of land cover in wet depressions of eastern Tunisia. Egypt J. Remote Sens. Space Sci. 2021, 24, 443–451. [Google Scholar] [CrossRef]
- Vela, A.; Pasqualini, V.; Leoni, V.; Djelouli, A.; Langar, H.; Pergent, G.; Pergent-Martini, C.; Ferrat, L.; Ridha, M.; Djabou, H. Use of SPOT 5 and IKONOS imagery for mapping biocenoses in a Tunisian Coastal Lagoon (Mediterranean Sea). Estuar. Coast. Shelf Sci. 2008, 79, 591–598. [Google Scholar] [CrossRef]
- Liang, S.; Wang, J. Advanced Remote Sensing. Terrestrial Information Extraction and Applications, 2nd ed.; Academic Press: Cambridge, MA, USA, 2019; 1010p. [Google Scholar]
- Leidig, M.; Teeuw, R. Free software: A review, in the context of disaster management. Int. J. Appl. Earth Obs. Geoinf. 2015, 42, 49–56. [Google Scholar] [CrossRef]
- Chen, D.; Shams, S.; Carmona-Moreno, C.; Leone, A. Assessment of open source GIS software for water resources management in developing countries. J. Hydro-Environ. Res. 2010, 4, 253–264. [Google Scholar] [CrossRef]
- Wang, J.; Wu, F. Advances in Cartography and Geographic Information Engineering, 1st ed.; Springer: Singapore, 2021; 638p. [Google Scholar] [CrossRef]
- Li, B.; Shi, X.; Zhu, A.; Wang, C.; Lin, H. New Thinking in GIScience, 1st ed.; Springer: Cham, Switzerland, 2022. [Google Scholar]
- Falaki, M.A.; Ahmed, H.T.; Akpu, B. Predictive modeling of desertification in Jibia Local Government Area of Katsina State, Nigeria. Egypt. J. Remote Sens. Space Sci. 2020, 23, 363–370. [Google Scholar] [CrossRef]
- Al-Djazouli, M.O.; Elmorabiti, K.; Rahimi, A.; Amellah, O.; Fadil, O.A.M. Delineating of groundwater potential zones based on remote sensing, GIS and analytical hierarchical process: A case of Waddai, eastern Chad. GeoJournal 2021, 86, 1881–1894. [Google Scholar] [CrossRef]
- Sesnie, S.E.; Gessler, P.E.; Finegan, B.; Thessler, S. Integrating Landsat TM and SRTM-DEM derived variables with decision trees for habitat classification and change detection in complex neotropical environments. Remote Sens. Environ. 2008, 112, 2145–2159. [Google Scholar] [CrossRef]
- Nkiaka, E.; Nawaz, N.R.; Lovett, J.C. Effect of single and multi-site calibration techniques on hydrological model performance, parameter estimation and predictive uncertainty: A case study in the Logone catchment, Lake Chad basin. Stoch. Environ. Res. Risk Assess. 2018, 32, 1665–1682. [Google Scholar] [CrossRef]
- Kay, A.U.; Fuller, D.Q.; Neumann, K.; Eichhorn, B.; Höhn, A.; Morin-Rivat, J.; Champion, L.; Linseele, V.; Huysecom, E.; Ozainne, S.; et al. Diversification, Intensification and Specialization: Changing Land Use in Western Africa from 1800 BC to AD 1500. J. World Prehistory 2019, 32, 179–228. [Google Scholar] [CrossRef]
- Lemenkova, P. Mapping Wetlands of Kenya Using Geographic Resources Analysis Support System (GRASS GIS) with Remote Sensing Data. Transylv. Rev. Syst. Ecol. Res. 2023, 25, 1–18. [Google Scholar] [CrossRef]
- Kadri, N.; Jebari, S.; Augusseau, X.; Mahdhi, N.; Lestrelin, G.; Berndtsson, R. Analysis of Four Decades of Land Use and Land Cover Change in Semiarid Tunisia Using Google Earth Engine. Remote Sens. 2023, 15, 3257. [Google Scholar] [CrossRef]
- Saidi, S.; Bouri, S.; Ben Dhia, H.; Anselme, B. A GIS-based susceptibility indexing method for irrigation and drinking water management planning: Application to Chebba–Mellouleche Aquifer, Tunisia. Agric. Water Manag. 2009, 96, 1683–1690. [Google Scholar] [CrossRef]
- Anane, M.; Bouziri, L.; Limam, A.; Jellali, S. Ranking suitable sites for irrigation with reclaimed water in the Nabeul-Hammamet region (Tunisia) using GIS and AHP-multicriteria decision analysis. Resour. Conserv. Recycl. 2012, 65, 36–46. [Google Scholar] [CrossRef]
- Lemenkova, P. Mapping Climate Parameters over the Territory of Botswana Using GMT and Gridded Surface Data from TerraClimate. ISprs Int. J. Geo-Inf. 2022, 11, 473. [Google Scholar] [CrossRef]
- Ben Brahim, F.; Boughariou, E.; Bouri, S. Multicriteria-analysis of deep groundwater quality using WQI and fuzzy logic tool in GIS: A case study of Kebilli region, SW Tunisia. J. Afr. Earth Sci. 2021, 180, 104224. [Google Scholar] [CrossRef]
- Bahri, H.; Raclot, D.; Barbouchi, M.; Lagacherie, P.; Annabi, M. Mapping soil organic carbon stocks in Tunisian topsoils. Geoderma Reg. 2022, 30, e00561. [Google Scholar] [CrossRef]
- Mohamed, M.A.E.H.; Moursy, F.I.; Darrag, M.H.; El-Mahdy, M.E.S. Assessment of long-term trends and mapping of drought events in Tunisia. Sci. Afr. 2023, 21, e01766. [Google Scholar] [CrossRef]
- Besser, H.; Dhaouadi, L.; Hadji, R.; Hamed, Y.; Jemmali, H. Ecologic and economic perspectives for sustainable irrigated agriculture under arid climate conditions: An analysis based on environmental indicators for southern Tunisia. J. Afr. Earth Sci. 2021, 177, 104134. [Google Scholar] [CrossRef]
- Hamdi, M.; Goïta, K.; Karaouli, F.; Zagrarni, M.F. Hydrodynamic groundwater modeling and hydrochemical conceptualization of the mining area of Moulares Redeyef (southwestern of Tunisia): New local insights. Phys. Chem. Earth Parts A/B/C 2021, 121, 102974. [Google Scholar] [CrossRef]
- Rafaâ Trigui, M.; Trabelsi, R.; Zouari, K.; Agoun, A. Implication of hydrogeological and hydrodynamic setting on water quality of the Complex Terminal Aquifer in Kebili (southern Tunisia): The use of geochemical indicators and modelling. J. Afr. Earth Sci. 2021, 176, 104121. [Google Scholar] [CrossRef]
- Navarro-Torre, S.; Garcia-Caparrós, P.; Nogales, A.; Abreu, M.M.; Santos, E.; Cortinhas, A.L.; Caperta, A.D. Sustainable agricultural management of saline soils in arid and semi-arid Mediterranean regions through halophytes, microbial and soil-based technologies. Environ. Exp. Bot. 2023, 212, 105397. [Google Scholar] [CrossRef]
- Shoshany, M.; Lavee, H.; Kutiel, P. Seasonal vegetation cover changes as indicators of soil types along a climatological gradient: A mutual study of environmental patterns and controls using remote sensing. Int. J. Remote Sens. 1995, 16, 2137–2151. [Google Scholar] [CrossRef]
- Jendoubi, D.; Hossain, M.S.; Giger, M.; Tomićević-Dubljević, J.; Ouessar, M.; Liniger, H.; Speranza, C.I. Local livelihoods and land users’ perceptions of land degradation in northwest Tunisia. Environ. Dev. 2020, 33, 100507. [Google Scholar] [CrossRef]
- El Ghoul, I.; Sellami, H.; Khlifi, S.; Vanclooster, M. Impact of land use land cover changes on flow uncertainty in Siliana watershed of northwestern Tunisia. Catena 2023, 220, 106733. [Google Scholar] [CrossRef]
- Allouche, F.K.; Delaître, E.; Bousaida, D.O.; Chaari, H. Mapping South Tunisian Landscapes Using Remote Sensing and GIS Applications. Int. J. Environ. Geoinform. 2018, 5, 17–28. [Google Scholar] [CrossRef]
- Ruiz, L.F.C.; Dematte, J.A.M.; Safanelli, J.L.; Rizzo, R.; Silvero, N.E.Q.; Rosin, N.A.; Campos, L.R. Obtaining high-resolution synthetic soil imagery for topsoil mapping. Remote Sens. Lett. 2022, 13, 107–114. [Google Scholar] [CrossRef]
- Harris, R. Satellite remote sensing of the contemporary Arab city. Landsc. Res. 1988, 13, 12–18. [Google Scholar] [CrossRef]
- Biarnès, A.; Bailly, J.S.; Mekki, I.; Ferchichi, I. Land use mosaics in Mediterranean rainfed agricultural areas as an indicator of collective crop successions: Insights from a land use time series study conducted in Cap Bon, Tunisia. Agric. Syst. 2021, 194, 103281. [Google Scholar] [CrossRef]
- Townshend, J.; Quarmby, N.; Millington, A.; Drake, N.; Reading, A.; White, K. Monitoring playa sediment transport systems using thematic mapper data. Adv. Space Res. 1989, 9, 177–183. [Google Scholar] [CrossRef]
- Afrasinei, G.M.; Melis, M.T.; Arras, C.; Pistis, M.; Buttau, C.; Ghiglieri, G. Spatiotemporal and spectral analysis of sand encroachment dynamics in southern Tunisia. Eur. J. Remote Sens. 2018, 51, 352–374. [Google Scholar] [CrossRef]
- Desprats, J.; Raclot, D.; Rousseau, M.; Cerdan, O.; Garcin, M.; Le Bissonnais, Y.; Ben Slimane, A.; Fouche, J.; Monfort-Climent, D. Mapping Linear Erosion Features Using High And Very High Resolution Satellite Imagery. Land Degrad. Dev. 2013, 24, 22–32. [Google Scholar] [CrossRef]
- Amrouni, O.; Hzami, A.; Heggy, E. Photogrammetric assessment of shoreline retreat in North Africa: Anthropogenic and natural drivers. ISPRS J. Photogramm. Remote Sens. 2019, 157, 73–92. [Google Scholar] [CrossRef]
- Jaquet, J.M.; Tassan, S.; Barale, V.; Sarbaji, M. Bathymetric and bottom effects on CZCS chlorophyll-like pigment estimation: Data from the Kerkennah Shelf (Tunisia). Int. J. Remote Sens. 1999, 20, 1343–1362. [Google Scholar] [CrossRef]
- Rampheri, M.B.; Dube, T.; Dondofema, F.; Dalu, T. Progress in the remote sensing of groundwater-dependent ecosystems in semi-arid environments. Phys. Chem. Earth Parts A/B/C 2023, 130, 103359. [Google Scholar] [CrossRef]
- Toujani, A.; Achour, H.; Turki, S.Y.; Faïz, S. Estimating Forest Losses Using Spatio-temporal Pattern-based Sequence Classification Approach. Appl. Artif. Intell. 2020, 34, 916–940. [Google Scholar] [CrossRef]
- Quarmby, N.A.; Townshend, J.R.G. Preliminary analysis of SPOT HRV multispectral products of an arid environment. Int. J. Remote Sens. 1986, 7, 1869–1877. [Google Scholar] [CrossRef]
- Gelebo, A.H.; Kasiviswanathan, K.; Khare, D.; Pingale, S.M. Assessment of spatial and temporal distribution of surface water balance in a data-scarce African transboundary river basin. Hydrol. Sci. J. 2022, 67, 1561–1581. [Google Scholar] [CrossRef]
- Benedetti, R.; Rossini, P.; Taddei, R. Vegetation classification in the Middle Mediterranean area by satellite data. Int. J. Remote Sens. 1994, 15, 583–596. [Google Scholar] [CrossRef]
- Godinho, S.; Surovy, P.; Sousa, A.; Gil, A. Advances in remote-sensing applications in silvo-pastoral systems. Int. J. Remote Sens. 2018, 39, 4565–4571. [Google Scholar] [CrossRef]
- Souissi, D.; Msaddek, M.H.; Zouhri, L.; Chenini, I.; May, M.E.; Dlala, M. Mapping groundwater recharge potential zones in arid region using GIS and Landsat approaches, southeast Tunisia. Hydrol. Sci. J. 2018, 63, 251–268. [Google Scholar] [CrossRef]
- Belhadj-Khedher, C.; Koutsias, N.; Karamitsou, A.; EI-Melki, T.; Ouelhazi, B.; Hamdi, A.; Nouri, H.; Mouillot, F. A Revised Historical Fire Regime Analysis in Tunisia (1985–2010) from a Critical Analysis of the National Fire Database and Remote Sensing. Forests 2018, 9, 59. [Google Scholar] [CrossRef]
- Lemenkova, P.; Debeir, O. R Libraries for Remote Sensing Data Classification by k-means Clustering and NDVI Computation in Congo River Basin, DRC. Appl. Sci. 2022, 12, 12554. [Google Scholar] [CrossRef]
- Fathalli, B.; Castel, T.; Pohl, B. Simulated effects of land immersion on regional arid climate: A case study of the pre-Saharan playa of Chott el-Jerid (south of Tunisia). Theor. Appl. Climatol. 2020, 140, 231–250. [Google Scholar] [CrossRef]
- Abbas, K.; Deroin, J.P.; Bouaziz, S. Monitoring of playa evaporites as seen with optical remote sensing sensors: Case of Chott El Jerid, Tunisia, from 2003 to present. Arab. J. Geosci. 2018, 11, 92. [Google Scholar] [CrossRef]
- Henchiri, M.; Zhang, S.; Essifi, B.; Ouessar, M.; Bai, Y.; Jiahua, Z. Land cover change of arid environment in Tunisia based on analysis of Landsat images. Afr. J. Ecol. 2020, 58, 746–756. [Google Scholar] [CrossRef]
- Berthon, R.; Aubry, A. Les saumures naturelles du sud Tunisien. Rev. Chim. Miner. 1970, 7, 231. [Google Scholar]
- M’nif, A. Valorisation des saumures du sud tunisien. Habilit. Fac. Sc. Tunis 2001. [Google Scholar]
- Gautier, E.F. Le Chott Tigri. Ann. Géogr. 1916, 25, 181–189. [Google Scholar] [CrossRef]
- Ali, M.M.; Abd Ellah, R.G. Chapter 1-History and formation of African Lakes. In Lakes of Africa; El-Sheekh, M., Elsaied, H.E., Eds.; Elsevier: Amsterdam, The Netherlands, 2023; pp. 1–31. [Google Scholar] [CrossRef]
- Mwirichia, R.; Orwa, P. Chapter 9-Diversity of extremophiles in African brine lakes. In Lakes of Africa; El-Sheekh, M., Elsaied, H.E., Eds.; Elsevier: Amsterdam, The Netherlands, 2023; pp. 269–287. [Google Scholar] [CrossRef]
- Blackwelder, E. The lowering of playas by deflation. Am. J. Sci. 1931, s5-21, 140–144. [Google Scholar] [CrossRef]
- Goudie, A.; Wells, G. The nature, distribution and formation of pans in arid zones. Earth-Sci. Rev. 1995, 38, 1–69. [Google Scholar] [CrossRef]
- Abbes, A.; Tlig, S. Tectonique précoce et sédimentation de la série crétacée dans le Bassin des Chotts (Tunisie du Sud). Geol. Mediterr. 1991, 18, 149–161. [Google Scholar] [CrossRef]
- Louhaichi, M.A.; Tlig, S. Tectonique synsédimentaire des séries crétacées post-barremiennes au Nord-Est de la Chaine des Chotts (Tunisie méridionale). Geol. Mediterr. 1993, 20, 53–74. [Google Scholar] [CrossRef]
- Ballais, J.L. La Dépression de la Sebkhet en Noual (Tunisie). Etude Géomorphologique. Ph.D. Thesis, Université de Paris 1, Paris, France, 1972. [Google Scholar]
- Barbieri, R.; Stivaletta, N.; Marinangeli, L.; Ori, G.G. Microbial signatures in sabkha evaporite deposits of Chott el Gharsa (Tunisia) and their astrobiological implications. Planet. Space Sci. 2006, 54, 726–736. [Google Scholar] [CrossRef]
- Swezey, C. Structural controls on Quaternary depocentres within the Chotts Trough region of southern Tunisia. J. Afr. Earth Sci. 1996, 22, 335–347. [Google Scholar] [CrossRef]
- Coque, R. Notes morphologiques sur les grands Chotts tunisiens. Bull. L’association de Geogr. Fr. 1955, 32, 174–185. [Google Scholar] [CrossRef]
- Hammi, H.; Musso, J.; M’nif, A.; Rokbani, R. Tunisian salt lakes evaporation studied by the DPAO method based on solubility phase diagrams. Desalination 2003, 158, 215–220. [Google Scholar] [CrossRef]
- Rodríguez-Caballero, E.; Cantón, Y.; Moussa, M.; Solé-Benet, A. Irrigated land expansion since 1985 in Southern Tunisia. J. Afr. Earth Sci. 2017, 129, 146–152. [Google Scholar] [CrossRef]
- Stevenson, A.C.; Battarbee, R.W. Palaeoecological and documentary records of recent environmental change in Garaet El Ichkeul: A seasonally Saline Lake in NW Tunisia. Biol. Conserv. 1991, 58, 275–295. [Google Scholar] [CrossRef]
- Bryant, R.G.; Sellwood, B.W.; Millington, A.C.; Drake, N.A. Marine-like potash evaporite formation on a continental playa: Case study from Chott el Djerid, southern Tunisia. Sediment. Geol. 1994, 90, 269–291. [Google Scholar] [CrossRef]
- Sahbani, S.; Béjaoui, B.; Benabdallah, S.; Toujani, R.; Fathalli, A.; Zaaboub, N.; Aouissi, J.; Kassouk, Z.; Hamdi, N.; Mbarek, N.B.; et al. Systematic review of a RAMSAR wetland and UNESCO biosphere reserve in a climate change hotspot (Ichkeul Lake, Tunisia). J. Sea Res. 2022, 190, 102288. [Google Scholar] [CrossRef]
- Nigam, S.; Thomas, N.P. The Sahara Desert Hydroclimate and Expanse: Natural Variability and Climate Change. In Encyclopedia of the World’s Biomes; Goldstein, M.I., DellaSala, D.A., Eds.; Elsevier: Oxford, UK, 2020; pp. 201–212. [Google Scholar] [CrossRef]
- Neji, M.; Serbaji, M.M.; Hardy, O.; Chaieb, M. Floristic diversity and vegetation patterns along disturbance gradient in arid coasts in southern Mediterranean: Case of the Gulf of Gabès, southern Tunisia. Arid. Land Res. Manag. 2018, 32, 291–315. [Google Scholar] [CrossRef]
- Baduel, P.R.; Baduel, A.F. Une oasis continentale du Sud-Tunisien. Rev. Des Mondes Musulmans Mediterr. 1984, 38, 153–170. [Google Scholar] [CrossRef]
- Raddadi, A.; Podwojewski, P. Spring mounds of the Nefzaoua oases in Tunisia: Irreversible degradation of exceptional geomorphic structures. J. Arid. Environ. 2022, 205, 104806. [Google Scholar] [CrossRef]
- Kamel, S. Salinisation origin and hydrogeochemical behaviour of the Djerid oasis water table aquifer (southern Tunisia). Arab. J. Geosci. 2013, 6, 2103–2117. [Google Scholar] [CrossRef]
- Neifar, M.; Chouchane, H.; Najjari, A.; El Hidri, D.; Mahjoubi, M.; Ghedira, K.; Naili, F.; Soufi, L.; Raddadi, N.; Sghaier, H.; et al. Genome analysis provides insights into crude oil degradation and biosurfactant production by extremely halotolerant Halomonas desertis G11 isolated from Chott El-Djerid salt-lake in Tunisian desert. Genomics 2019, 111, 1802–1814. [Google Scholar] [CrossRef]
- Hanafi, A.; Jauffret, S. Are long-term vegetation dynamics useful in monitoring and assessing desertification processes in the arid steppe, southern Tunisia. J. Arid. Environ. 2008, 72, 557–572. [Google Scholar] [CrossRef]
- Pausata, F.S.; Gaetani, M.; Messori, G.; Berg, A.; Maia de Souza, D.; Sage, R.F.; deMenocal, P.B. The Greening of the Sahara: Past Changes and Future Implications. One Earth 2020, 2, 235–250. [Google Scholar] [CrossRef]
- Lemenkova, P. A GRASS GIS Scripting Framework for Monitoring Changes in the Ephemeral Salt Lakes of Chotts Melrhir and Merouane, Algeria. Appl. Syst. Innov. 2023, 6, 61. [Google Scholar] [CrossRef]
- Oswald, J.; Harris, S. Chapter 19 - Desertification. In Biological and Environmental Hazards, Risks, and Disasters, 2nd ed.; Hazards and Disasters Series; Elsevier: Boston, MA, USA, 2023; pp. 369–393. [Google Scholar] [CrossRef]
- D’Odorico, P.; Bhattachan, A.; Davis, K.F.; Ravi, S.; Runyan, C.W. Global desertification: Drivers and feedbacks. Adv. Water Resour. 2013, 51, 326–344. [Google Scholar] [CrossRef]
- Wessel, P.; Luis, J.F.; Uieda, L.; Scharroo, R.; Wobbe, F.; Smith, W.H.F.; Tian, D. The Generic Mapping Tools Version 6. Geochem. Geophys. Geosystems 2019, 20, 5556–5564. [Google Scholar] [CrossRef]
- Lemenkova, P. Handling Dataset with Geophysical and Geological Variables on the Bolivian Andes by the GMT Scripts. Data 2022, 7, 74. [Google Scholar] [CrossRef]
- Lemenkova, P. Tanzania Craton, Serengeti Plain and Eastern Rift Valley: Mapping of geospatial data by scripting techniques. Est. J. Earth Sci. 2022, 71, 61–79. [Google Scholar] [CrossRef]
- Lemenkova, P. Console-Based Mapping of Mongolia Using GMT Cartographic Scripting Toolset for Processing TerraClimate Data. Geosciences 2022, 12, 1–36. [Google Scholar] [CrossRef]
- Louhaichi, M.; Gamoun, M.; Hassan, S.; Abdallah, M.A.B. Characterizing Biomass Yield and Nutritional Value of Selected Indigenous Range Species from Arid Tunisia. Plants 2021, 10, 2031. [Google Scholar] [CrossRef]
- Food and Agriculture Organization (FAO). Systèmes d’Utilisation des Terres en Tunisie. Online Resource, 2023. Land Use Systems in Tunisia. Monitoring Pilot Programme in Zaghouan and Medenine. Available online: https://www.fao.org/world-agriculture-watch/our-program/tun/en/ (accessed on 20 September 2023).
- Touhami, I.; Rzigui, T.; Zribi, L.; Ennajah, A.; Dhahri, S.; Aouinti, H.; Elaieb, M.T.; Fkiri, S.; Ghazghazi, H.; Khorchani, A.; et al. Climate change-induced ecosystem disturbance: A review on sclerophyllous and semi-deciduous forests in Tunisia. Plant Biol. 2023, 25, 481–497. [Google Scholar] [CrossRef]
- Khelifa, W.B.; Hermassi, T.; Strohmeier, S.; Zucca, C.; Ziadat, F.; Boufaroua, M.; Habaieb, H. Parameterization of the Effect of Bench Terraces on Runoff and Sediment Yield by Swat Modeling in a Small Semi-arid Watershed in Northern Tunisia. Land Degrad. Dev. 2017, 28, 1568–1578. [Google Scholar] [CrossRef]
- Hammami, O.; Ferchichi, A. Vulnerability of pastoral ecosystems in northwestern Tunisia to climate change. Land Degrad. Dev. 2023, 34, 4680–4689. [Google Scholar] [CrossRef]
- Bounouh, O.; Essid, H.; Tarquis, A.M.; Farah, I.R. Phenology as accuracy metrics for vegetation index forecasting over Tunisian forest and cereal cover types. Int. J. Remote Sens. 2021, 42, 4644–4671. [Google Scholar] [CrossRef]
- Park, T.; Lee, W.K.; Woo, S.Y.; Yoo, S.; Kwak, D.A.; Stiti, B.; Khaldi, A.; Zhen, X.; Kwon, T.H. Assessment of land-cover change using GIS and remotely-sensed data: A case study in Ain Snoussi area of northern Tunisia. For. Sci. Technol. 2011, 7, 75–81. [Google Scholar] [CrossRef]
- Mezned, N.; Dkhala, B.; Abdeljaouad, S. Multitemporal and multisensory Landsat ETM+ and OLI 8 data for mine waste change detection in northern Tunisia. J. Spat. Sci. 2018, 63, 135–153. [Google Scholar] [CrossRef]
- Bayati, M.; Danesh-Yazdi, M. Mapping the spatiotemporal variability of salinity in the hypersaline Lake Urmia using Sentinel-2 and Landsat-8 imagery. J. Hydrol. 2021, 595, 126032. [Google Scholar] [CrossRef]
- Sheng, Y.; Song, C.; Wang, J.; Lyons, E.A.; Knox, B.R.; Cox, J.S.; Gao, F. Representative lake water extent mapping at continental scales using multi-temporal Landsat-8 imagery. Remote Sens. Environ. 2016, 185, 129–141. [Google Scholar] [CrossRef]
- Schröder, T.; Hassanzadeh, E.; Darehshouri, S.; Tajrishy, M.; Schulz, S. Satellite based lake bed elevation model of Lake Urmia using time series of Landsat imagery. J. Great Lakes Res. 2022, 48, 1710–1717. [Google Scholar] [CrossRef]


| Date | Scene ID |
|---|---|
| Gulf of Hammamet region | |
| 15 July 2023 | LC91910352023196LGN00 |
| 10 April 2023 | LC91910352023100LGN00 |
| 21 February 2023 | LC91910352023052LGN01 |
| 06 July 2017 | LC81910352017187LGN00 |
| 01 April 2017 | LC81910352017091LGN00 |
| 28 February 2017 | LC81910352017059LGN00 |
| Gulf of Gabès region | |
| 15 July 2023 | LC91910362023196LGN00 |
| 10 April 2023 | LC91910362023100LGN00 |
| 21 February 2023 | LC91910362023052LGN01 |
| 22 July 2017 | LC81910362017203LGN00 |
| 01 April 2017 | LC81910362017091LGN00 |
| 28 February 2017 | LC81910362017059LGN00 |
Disclaimer/Publisher’s Note: The statements, opinions and data contained in all publications are solely those of the individual author(s) and contributor(s) and not of MDPI and/or the editor(s). MDPI and/or the editor(s) disclaim responsibility for any injury to people or property resulting from any ideas, methods, instructions or products referred to in the content. |
© 2023 by the author. Licensee MDPI, Basel, Switzerland. This article is an open access article distributed under the terms and conditions of the Creative Commons Attribution (CC BY) license (https://creativecommons.org/licenses/by/4.0/).
Share and Cite
Lemenkova, P. Monitoring Seasonal Fluctuations in Saline Lakes of Tunisia Using Earth Observation Data Processed by GRASS GIS. Land 2023, 12, 1995. https://doi.org/10.3390/land12111995
Lemenkova P. Monitoring Seasonal Fluctuations in Saline Lakes of Tunisia Using Earth Observation Data Processed by GRASS GIS. Land. 2023; 12(11):1995. https://doi.org/10.3390/land12111995
Chicago/Turabian StyleLemenkova, Polina. 2023. "Monitoring Seasonal Fluctuations in Saline Lakes of Tunisia Using Earth Observation Data Processed by GRASS GIS" Land 12, no. 11: 1995. https://doi.org/10.3390/land12111995
APA StyleLemenkova, P. (2023). Monitoring Seasonal Fluctuations in Saline Lakes of Tunisia Using Earth Observation Data Processed by GRASS GIS. Land, 12(11), 1995. https://doi.org/10.3390/land12111995