Article

20-Year Ecological Impact Analysis of Shibing Karst World Natural Heritage through Land Use

School of Karst Science, State Engineering Technology Institute for Karst Desertification Control, Guizhou Normal University, Guiyang 550001, China
*
Author to whom correspondence should be addressed.
Land 2023, 12(11), 1978; https://doi.org/10.3390/land12111978
Submission received: 10 October 2023 / Revised: 22 October 2023 / Accepted: 24 October 2023 / Published: 26 October 2023
(This article belongs to the Special Issue Patrimony Assessment and Sustainable Land Resource Management)

Abstract

:
Changes in the spatial pattern of land use are inextricably linked to the ecosystem environment, and the assessment of regional eco-environment quality can help provide sustainable and healthy development strategies for heritage management organizations. In this study, based on RS and GIS technologies, we quantitatively analyzed the characteristics of land use changes in the Shibing Karst World Natural Heritage site from 2000 to 2020, and introduced the regional eco-environment quality assessment index for quantitative factor analysis. The results show that: (1) The heritage site is mainly dominated by forest and shrub, with more aggregated cropland, and impervious surfaces in the buffer zone. The area of shrub has increased during the 20-year period, occupying 12.63% of the total transferred area. Cropland has been basically converted to forest, accounting for more than 60% of the total transferred area, followed by shrubs, which have been basically transferred to ecologically better land types. (2) By analyzing the attitude of motivation, forest, shrub, and water have positive values, while cropland, grassland, and impervious surfaces have negative values. Grassland has the largest absolute value of kinetic attitude, and the smallest is for water. The integrated dynamic attitude is basically maintained at 24%, showing a state of rapid and then stable land category conversion. (3) Over the past 20 years, the regional eco-environment quality index has been stable between 0.68 and 0.71, and shows a trend of rapid growth and stabilization, which is consistent with the comprehensive attitude. The conversion between cropland, forest, and shrubs is the main cause of ecological improvement and deterioration. Overall, the relevant conservation measures at the site and China’s corresponding responses to global climate change have led to a stabilization and increase in the regional ecological quality of the site. The management measures of the relevant authorities have begun to bear fruit, but further promotion of the sustainable development of the site is needed to provide a scientific model for the conservation of other karst heritage sites.

1. Introduction

World heritage is a priceless and irreplaceable asset belonging to all mankind, having “outstanding universal value”, and deserving of special protection. These sites are considered to be the most important protected areas on earth, providing life-sustaining benefits to millions of people around the world [1,2]. World heritage includes cultural heritage, natural heritage, and dual cultural and natural heritage. In 1972, the United Nations Educational, Scientific and Cultural Organization (UNESCO) adopted the Convention Concerning the Protection of the World Cultural and Natural Heritage, which recognizes the outstanding universal value of the world’s natural heritage and requires that it be open to the public, including tourists, and that it be protected, with the aim of promoting the conservation and sustainable use of the world’s natural heritage. However, in recent years, the World Natural Heritage has suffered extensive damage due to earthquakes, tsunamis, soil erosion, and human activities [3,4].
The karst environment is a special geographic landscape in the natural environment, characterized by high ecological sensitivity, low environmental carrying capacity, and small elasticity of disaster tolerance threshold [5,6,7,8]. Karst has a certain distribution in the world, while in China it is mainly distributed in Guizhou Province, Yunnan Province, and other regions, with an area of about 336,000 km2 [9]. The “South China Karst” is a series of World Natural Heritage projects submitted by the Chinese government to the UNESCO World Heritage Committee in batches, and its unique landforms, ecosystems, biodiversity, natural beauty, and evolutionary processes have remarkable global value and significance [10]. It is precisely because of the characteristics of soil vulnerability, hydrological vulnerability, vegetation vulnerability, and humanistic vulnerability of the karst region [11,12] that there is an urgent need to analyze its ecological development and provide a scientific basis for the protection of the common wealth of mankind.
In recent years, scholars have paid attention to the ecological conditions of World Natural Heritage sites from different perspectives. Xiao et al. carried out an evaluation of the impact of the Zhangjiajie Grand Canyon Glass Bridge on the aesthetic value of the Wulingyuan World Natural Heritage site based on the GIS view analysis method [13]. Wang et al. analyzed the perceived willingness of local residents and herders to protect the Kerala World Natural Heritage site based on the perspective of residents’ perception in the community of the heritage site, and determined that community development is a key factor influencing the community’s participation in and support for heritage protection [14]. Zhang et al. introduced a remote sensing eco-index for the in-depth evaluation of the ecological environment quality of a karst World Natural Heritage site and modeled the future development trend, which provides scientific and technological references for the sustainable development of other karst World Natural Heritage sites [15]. Hui et al. constructed a conservation index of heritage value from the perspectives of aesthetics and biodiversity by taking the Xinjiang Tianshan World Natural Heritage site as an example, and provided the heritage management index with a theoretical basis [16]. Sobhani, P. studied the changes in environmental potential and landscape ecology using multi-criteria decision analysis models, fuzzy set theory methods, and mathematical models [17]. In addition, there are quite a number of studies on realizing the ecological environment quality by using remote sensing technology for integrated data collection [18,19,20], three living spaces [21], and landscape patterns [22,23,24,25]. Despite the numerous concerns about World Heritage sites, there have been no studies analyzing the regional ecological environment quality of karst World Natural Heritage sites from the perspective of land type, which in turn is closely related to the development of the regional ecological environment [26].
Based on this, this paper takes the Shibing Karst World Natural Heritage site as the research object. (1) Using Landsat remote sensing images as the data source, we analyzed the transfer of land types in the Shibing Karst World Natural Heritage site over the past 20 years. (2) We simultaneously introduced regional ecological environment quality evaluation factors to evaluate their ecological environment quality. (3) We analyzed the efficiency of ecological contributions through a long-term time series analysis. (4) The results of this study can provide a reference for the ecological environmental protection and sustainable development of other karst World Natural Heritage sites.

2. Materials and Methods

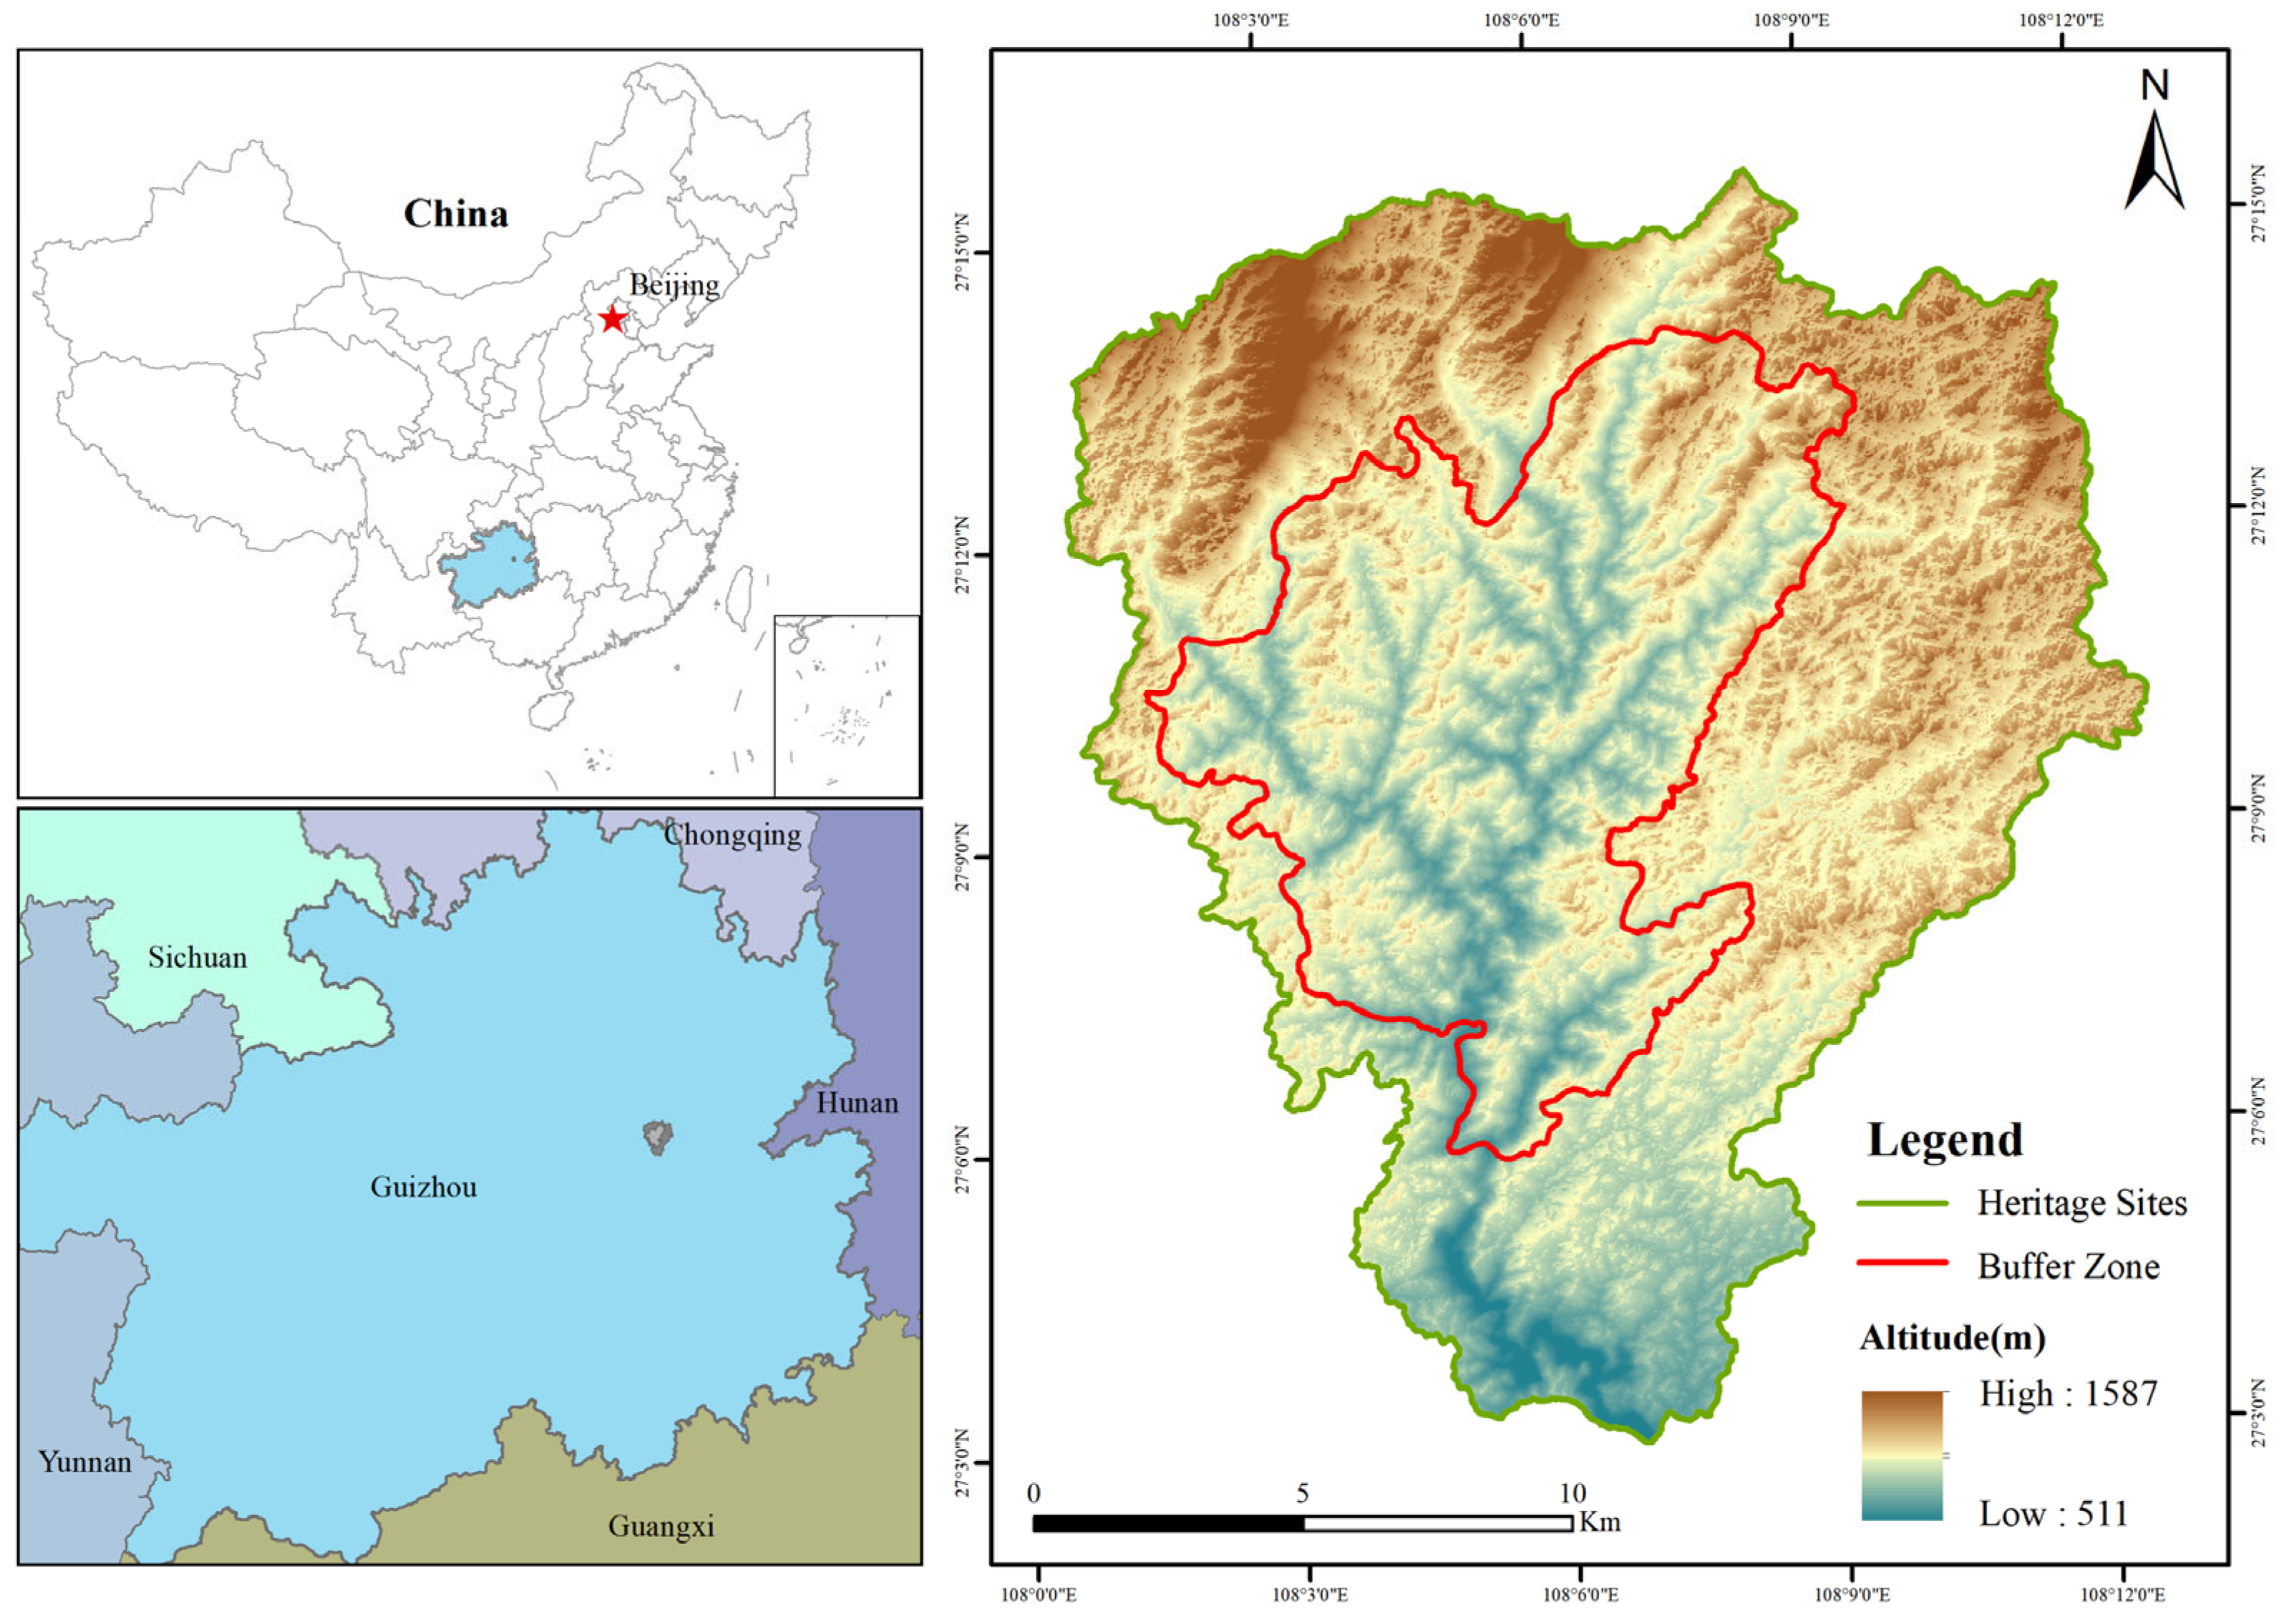
2.1. Overview of the Study Area

The Shibing Karst is one of the series of heritage sites of the South China Karst (Figure 1), located in the north of Shibing County, Guizhou Province, situated in the mountainous slope area in the transition from the eastern edge of China’s Yunnan-Guizhou Plateau to the low hills of western Hunan, i.e., the transition area between the second and the third levels of China’s ladder topography. It is a typical and completely dolomite karst landform developed on ancient and relatively insoluble dolomite, with peak cluster canyon karst being the most typical, and it is the most typical example of a dolomite karst in tropical and subtropical regions around the world. The area of the heritage site is 10,280 hm2 and the area of the buffer zone is 18,015 hm2. Its terrain the terrain is high in the north and low in the south, with the elevation between 526–1576 m, and the overall terrain is broken. The core scenic spots of Yuntai Mountain and Cedar River contain numerous endemic and endangered plants and animals and their habitats, which are native karst ecosystems with the unique attribute of the coexistence of vulnerability and biodiversity, representing the types of South China Karst. This World Natural Heritage site preserves intact dolomite karst stratigraphy, tectonics, geomorphology, caves, underground water systems, and other geological relics, and is an outstanding representative of the world’s tropical and subtropical dolomite karst, which has made a significant contribution to the development of South China Karst [27].

2.2. Data Sources and Pre-Processing

The remotely sensed imagery data for this paper were obtained from the Landsat 5 (TM), Landsat 7 (TM), and Landsat 8 (OLI) datasets provided by the U.S. Geological Survey (https://earthexplorer.usgs.gov/ (accessed on 20 October 2022)). The images collected were all in the third quarter of 2000, 2010, and 2020, with no clouds in the study area and good image quality. The data were first pre-processed by ENVI 5.3 software, including radiometric calibration, atmospheric correction, geometric correction, image mosaicking, and image alignment. Subsequently, a combination of supervised classification and visual interpretation was used to interpret the land use classification with a kappa coefficient of 0.85 and a spatial resolution of 30 m × 30 m.

2.3. Methodology

2.3.1. Land Use Change

In this paper, ArcGIS 10.2 software was used to spatially analyze (intersect, fusion, and statistics) the data of the three periods to obtain the land use situation in each period. Additionally, the spatio-temporal change rule was obtained after superposition. The land use transfer matrix mainly reflects the transformation between different land classes [28]. The formula is:
A i j = A 11 A 12 A 1 n A 21 A 22 A 2 n A n 1 A n 2 A n n
where Ai is the area of the land use type in category i before the transfer, Aj is the area of the land use type in category j after the transfer, and n is the number of land use types.
The attitude of land use dynamics can quantitatively describe the rate of change and trend among different land classes. A single land use momentum attitude reflects the rate of change of a certain land category [29]. The formula is:
K = S t 2 S t 2 S t 2 t 2 t 1 × 100 %
where K represents the attitude of a certain land class in the time period t1t2, and St1 and St2 represent the area of this land class in the time period, respectively. Fluctuations in K reflect the number of cover land classes converted to other land classes.
In addition, the change in the attitude of motivation can also be used to express the overall land change trend with the equation:
S = j = 1 n S i j 2 i = 1 m S i × 1 T × 100 %
where S is the comprehensive land use action attitude in a certain period of time, Si is the area going out to the ith land use type, Sij is the area transformed from the ith land use type to the jth land use type, and T is the length of the study.

2.3.2. Evaluation of Eco-Environment Effects

The regional eco-environment quality index can quantitatively assess the comprehensive eco-environment condition in the region [30]. The regional eco-environment quality index selected in this paper refers to the research results of Li et al. [31] and was re-scored by invited experts (Table 1). The specific formula is:
E V t = R i T A t i = 1 n A t i
where EVt is the eco-environmental quality index in period t, Ati is the land area of category i in period t, Ri is the eco-environmental quality index of land use type i, TAt is the total area of the study area, and N is the total number of land use type classifications.
The ecological contribution is the change in regional ecology caused by a certain land use type change [32], i.e.,
L E I = L E 1 L E 0 × L A T A
where LET is the ecological contribution rate, LE0 and LE1 represent the eco-environmental quality index at the beginning and the end, respectively, LA is the area of the change site, and TA is the total area of the study area.

3. Results and Analysis

3.1. Structural Transformation of Land Use

3.1.1. Land Use Change

By interpreting the land use of the 2000–2020 images of the Shibing Karst and referring to the classification in Table 1, a three-phase land use classification map was obtained (Figure 2). It can be seen that the heritage site is mainly dominated by forests and shrubs, and other land use types such as grassland exist in a few areas. As for the buffer zone, as the peripheral protection circle of the heritage site, there exist more aboriginal people, and in order to ensure their basic production and life, this land use type is mostly dominated by cropland. In the whole study area, forests and shrubs account for the most area, with both accounting for 85% or more from 2000 to 2020. The area of impervious land and water area is the smallest, with a total share of no more than 10%.
In order to further understand the trend of its land use types, we analyzed the area change mapping of the Shibing Karst over a 20-year period (Figure 3). It was found that the land use types within this heritage site had the least change, and the trend was basically the conversion of shrubs and grassland to forest. In the buffer zone, on the other hand, cropland was the main force of the shift to other types. This was mainly due to China’s policies such as returning farmland to forests in response to environmental degradation such as global warming. Overall, the change was mainly in the buffer zone as the main carrier and heritage sites as the secondary carrier.

3.1.2. Transfer Matrix

By analyzing the distribution of land use in the three phases, we found that different land types showed different degrees of spatial location conversion and quantitative changes among them during the 20-year period, so we established a land use transfer matrix (Figure 4). On the whole, the area of forest transferred into and out of other land types basically differed little, reflecting its own ecological stability. The area of shrub increased and basically tended toward the ecologically better forest, occupying 12.63% of the total transferred area. Cropland was basically transferred to forest land, which occupied more than 60% of the total transferred area, followed by shrubs, which were basically transferred to ecologically better land types. The transfer of other land types was basically flat, accounting for about 1%. The largest area transferred was of cropland, and the smallest was of forest land.

3.2. Attitudinal Changes

3.2.1. Single-Movement Attitudes

The three land use types were analyzed by introducing the kinetic attitude Formulas (2) and (3) (Figure 5). The results show that the differences in the attitude of single land use motives during the 20-year period were more significant, with positive values for forest, shrubs, and water, and negative values for cropland, grassland, and impervious surfaces. They also show varying degrees of increase or decrease. During the period of 2000–2010, when the heritage site was undergoing the critical period of applying to become a World Natural Heritage site, the land transfer basically developed in the direction of ecological betterment. The largest change was in grassland and was negative, indicating that more land types were converted to grassland during this period. Impervious surfaces came in second, which is consistent with the government’s policy of returning farmland to forest, and the largest change in the attitude of a single land category between 2010 and 2020 was for impervious surfaces, with a value of −6.67%, indicating that impervious surfaces were the most transferred to other land categories. Water and forest remained essentially unchanged, and both cropland and grassland had negative values of mobility, indicating a small degree of shifting of their land classes, and both shifted to ecologically better land classes.

3.2.2. Analysis of Changes in Attitudes towards Integrated Mobility

By calculating the dynamic attitude of the integrated land categories, we found that the dynamic attitude of 2000–2010 was the largest, with a value of 0.37%, which shows that the land categories were constantly transforming and were more obvious, and the integrated dynamic attitude of 2010–2020 was the smallest, which shows that the land category transformation basically tended to stabilize. We also calculated the integrated dynamic attitude from 2000 to 2020, and its value was located between the two phases, which shows that the transformation of landforms was first rapid and then stabilized.

3.3. Evaluation of Ecological Effects

3.3.1. Analysis of Regional Ecosystem Indices

By calculating the regional eco-environment quality index of land use in 2000, 2010, and 2020, as shown in Table 2, the values of the three periods are 0.6863, 0.7064, and 0.7155 respectively. Overall, the eco-environment quality of the Shibing Karst is relatively stable. The eco-environment quality increased from 2000 to 2010, which indicates that the environment has been improved accordingly, and the increase in the eco-environment quality from 2010 to 2020 is not obvious, which indicates that the eco-environment quality is basically in a stable state. The increase in eco-environment quality from 2010 to 2020 is not obvious, indicating that the ecological environment quality is basically in a stable state.
The natural breakpoint method was used to classify the regional ecological quality into four grades and analyze its spatial distribution characteristics more deeply (Figure 6). There is a direct or indirect spatial correspondence between the ecological grades and the different land functional zoning. The high-quality zone is the main part of the study area and basically covers the whole heritage site. The heritage site has a large area of forest and shrubs, is not subject to environmental invasions such as exotic species, and has a more stable development of ecological quality. The low-quality zone is mainly located in the buffer zone on the periphery of the heritage site. The buffer zone allows a small number of aboriginal people to exist, as well as appropriate development and utilization, with strong anthropogenic factors, a concentration of building sites, and ecological protection that is inconsistent with its rhythm, resulting in a poorer ecological quality than that within the heritage site. Overall, the ecological quality of the three phases of the region has not changed much and is basically in a stable state of high-quality ecological development.

3.3.2. Ecological Contribution

We calculated the contribution rate and proportion of the factors leading to the improvement and regression of the regional ecological environment quality (Table 3), so as to better explore the changes within the ecological environment of the Shibing Karst, and to obtain the impact of the conversion between different land use types on the regional ecological environment quality. The factors leading to the improvement of the ecological quality in the past 20 years mainly include the return of cropland to forest, the return of cropland to grassland, and the conversion of low-grade to high-grade land types. Among them, the conversion of cropland to forest and the conversion of cropland to forest are the core, contributing 87.05% and 8.48%, respectively. They are followed by secondary factors such as the conversion of shrubs to forest.
There are numerous factors leading to the reduction in regional ecological quality, the conversion of forest to cropland, and the conversion of forests to shrubs, among others. Among them, the contribution rates of forest to cropland, forest to shrubs, and grassland to cropland were 65.06%, 18.93%, and 14.90%, respectively. The contribution rate of these three land types became the main deterioration factor. However, in conjunction with the above, the deterioration was mainly in the buffer zone, where the indigenous people who used to live in the heritage site were relocated due to the need to protect the original eco-environment of the heritage site. Consequently, factors such as the conversion of cropland have led to a reduction in the quality of the regional eco-environment. There is basically no trend of ecological deterioration in the heritage site. In the study area as a whole, the degree of deterioration is far less than the degree of improvement.

4. Discussion

Changes in ecological quality are closely related to changes in land use types. Changes in land use types can alter land cover conditions and affect many ecological processes, such as biodiversity [33], climate [34], surface runoff [35,36], soil erosion [37,38], and water and soil loss [39]. Not only can they cause changes in surface vegetation and changes in surface temperature, affecting the net primary productivity of plants, but they can also indirectly affect the activities of various microorganisms that depend on the growth of vegetation [40]. Since its application for World Natural Heritage status in 2013, the Shibing Karst World Natural Heritage site has experienced little change in land types over the past 20 years, with forest and shrubs dominating, supplemented by grassland, impervious surfaces, and cropland. During the 2000–2010 decade, the land use transition was large, mainly because the local authorities cooperated with the heritage nomination experts to develop a series of policies to promote the success of the Shibing Karst’s bid. It is in line with national and global sustainable development requirements, such as returning cropland to forest [41], and migrant relocation (relocating the indigenous people of the heritage site to the buffer zone).
This study explored the ecological effects of the Shibing Karst based on land use types, and overall, the ecological environment quality of the Shibing Karst is relatively stable. The eco-environment quality increased from 2000 to 2010, and the increase in eco-environment quality from 2010 to 2020 is not obvious, indicating that the eco-environment quality is basically in a stable state. This is also consistent with the results of the land use type transfer discussed above. In the process of exploring the ecological effects, we found that the main influence on the eco-environment quality of the Shibing Karst is the inter-transformation between cropland, forest, and shrubs, which all belong to the vegetation type, and this conclusion also corroborates the main results of the previous study [42]. However, through the research of this paper, it can be found that since the Shibing Karst was listed as a World Heritage site, the relevant management departments at all levels of government have protected and managed it according to the law and the constraints of the local aboriginal village rules and regulations, and the quality of the eco-environment of the heritage site has been preserved intact in line with the sustainable heritage site tourism advocated by the UNESCO.
Based on this study, we have summarized the following points: (1) We analyzed the land type transformation of the Shibing Karst in the past twenty years. (2) On this basis, the regional ecological environment quality was quantified, and (3) we explored the main impact of land type transformation on ecological environment quality. (4) However, there are still some aspects that have not been thoroughly studied, such as not incorporating human factors, the impact of the atmospheric environment, and the impact of climate on land conversion. (5) Future research should fully consider the use of ground monitoring stations, as well as in-depth research from multiple perspectives and micro-perspectives.

5. Conclusions

Quantitative changes in land use cause qualitative changes in the eco-environment. This study explores the changes in the regional eco-environment quality of the Shibing Karst Heritage Nature site over the past 20 years based on land use using remote sensing data and geospatial analysis. The study shows that:
(1)
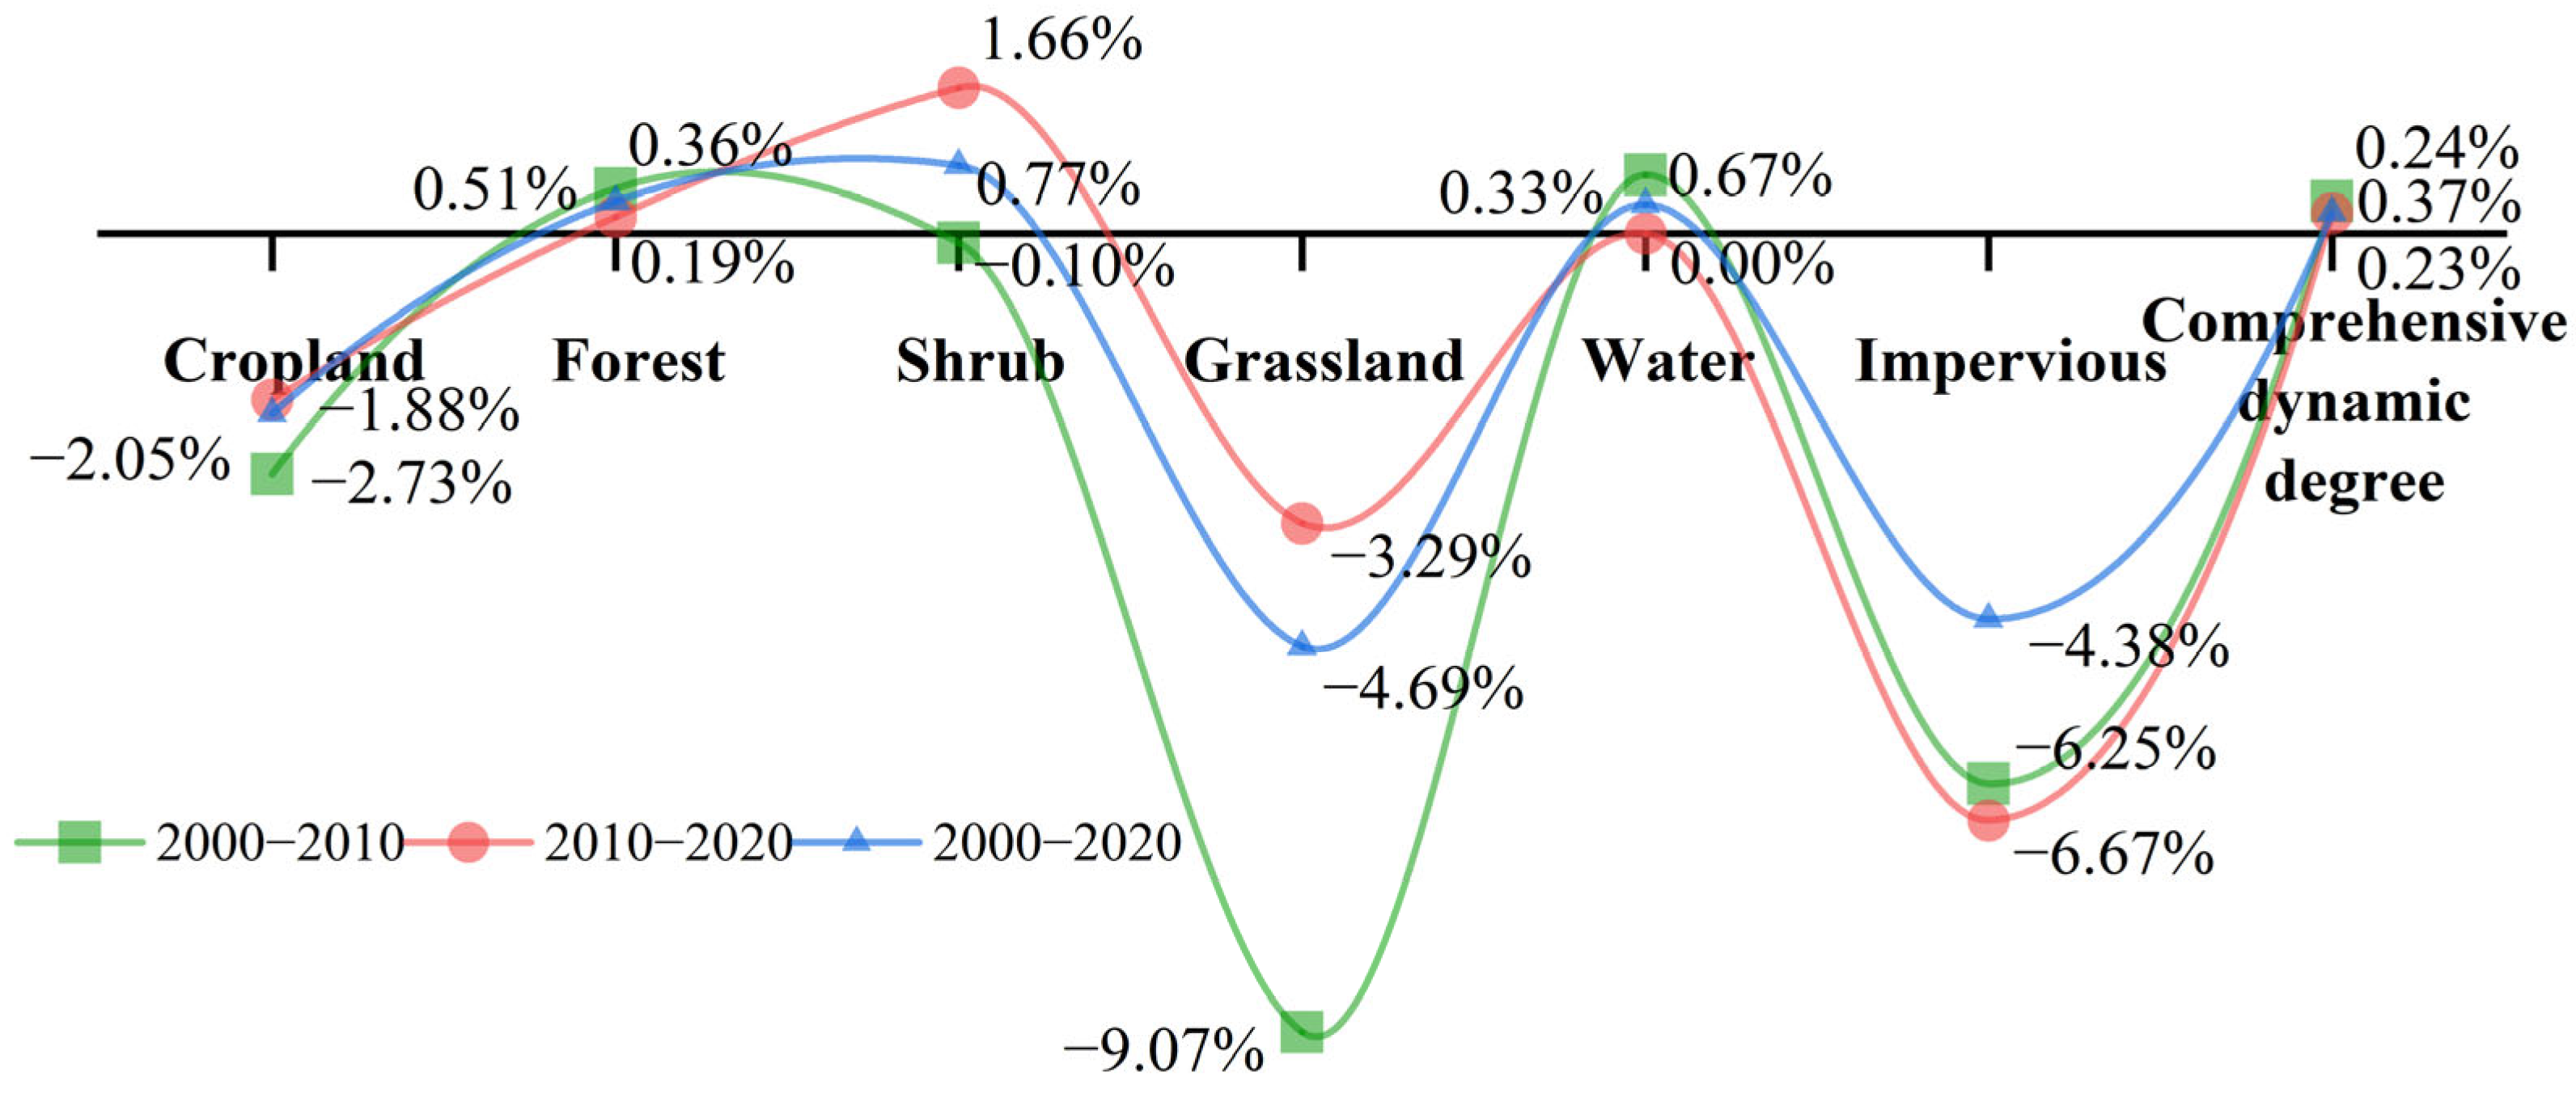
Over the past 20 years, forest and shrubs have dominated the heritage site, with more aggregated cropland and impervious surfaces present in the buffer zone. The area of shrubs has increased, occupying 12.63% of the total transferred area. Cropland has been basically converted to forest in the majority, occupying more than 60% of the total transferred area, followed by shrubs, which are basically being transferred to more ecologically sound land types.
(2)
The analysis of the attitude of motivation showed positive values for forest, shrubs, and water, and negative values for cropland, grassland, and impervious surfaces. Grassland had the largest absolute value of kinetic attitude, and the smallest was for water. The combined attitude of momentum shows a rapid transition and stabilization of the transition of land classes.
(3)
Over the past 20 years, the regional eco-environment quality index has stabilized between 0.68 and 0.71 and has shown a trend of rapid growth followed by stabilization. The transformation between cropland, forest, and shrubs is the main reason for ecological improvement and deterioration, and the relevant protection measures of the heritage site and the corresponding countermeasures of China to cope with the global climate have led to the stabilization and increase in the regional ecological environment quality of the heritage site.

Author Contributions

Conceptualization, Y.C. and N.Z.; methodology, Y.C.; software, N.Z.; validation, Y.C. and N.Z.; formal analysis, Y.C.; investigation, Y.C.; resources, N.Z.; data curation, N.Z.; writing—original draft preparation, N.Z.; writing—review and editing, N.Z.; visualization, N.Z.; supervision, N.Z.; project administration, N.Z.; funding acquisition, N.Z. All authors have read and agreed to the published version of the manuscript.

Funding

This research was funded by The Guiding Fund Project of Government’s Science and Technology (No. Qian Ke He Zhong Yin Di[2023]005); Academic Talent Plan of Guizhou Normal University (No. Qian Shi Xin Miao[2022]B31; Qianshi Xinmiao B15); Natural Science Research Project of Education Department of Guizhou Province [Qianjiaohe KY Zi (2022) 157].

Institutional Review Board Statement

Not applicable.

Informed Consent Statement

Not applicable.

Data Availability Statement

Not applicable.

Conflicts of Interest

The authors declare no conflict of interest.

References

  1. Jaafar, M.; Noor, S.M.; Rasoolimanesh, S.M. Perception of young local residents toward sustainable conservation programmes: A case study of the Lenggong World Cultural Heritage Site. Tour. Manag. 2015, 48, 154–163. [Google Scholar] [CrossRef]
  2. Piergiorgio, R.; Pietro, M.; Chiara, G.; Simona, F.; Daniele, C.; Alessandro, B.; Gianni, B.; Franco, R. The Monviso Ophiolite Geopark, a symbol of the Alpine Chain and geological heritage in Piemonte, Italy. Eng. Geol. Soc. Territ. 2015, 8, 239–243. [Google Scholar]
  3. Chen, X.Q.; Chen, J.G.; Cui, P.; You, Y.; Hui, K.H.; Yang, Z.J.; Zhang, W.F.; Li, X.P.; Wu, Y. Assessment of prospective hazards resulting from the 2017 earthquake at the world heritage site Jiuzhaigou Valley, Sichuan, China. J. Mt. Sci. 2018, 15, 779–792. [Google Scholar] [CrossRef]
  4. Pavlova, I.; Makarigakis, A.; Depret, T.; Jomelli, V. Global overview of the geological hazard exposure and disaster risk awareness at world heritage sites. J. Cult. Herit. 2017, 28, 151–157. [Google Scholar] [CrossRef]
  5. Zhang, H.Y.; Zhao, X.Y.; Cai, Y.L.; Yin, J. The driving mechanism of human forces to the land-use changein the karst mountain area—the case study of Guizhou province. Geogr. Res. 1999, 02, 25–31. [Google Scholar]
  6. Biondi, R.; Meaki, H.; Biondi, B.; Loborec, J. Karst Aquifer Vulnerability Assessment (KAVA) Method—A Novel GIS-Based Method for Deep Karst Aquifers. Sustainability 2021, 13, 3325. [Google Scholar] [CrossRef]
  7. Medici, G.; Lorenzi, V.; Sbarbati, C.; Manetta, M.; Petitta, M. Structural classification, discharge statistics, and recession analysis from the springs of the Gran Sasso (Italy) carbonate aquifer; comparison with selected analogues worldwide. Sustainability 2023, 15, 10125. [Google Scholar] [CrossRef]
  8. Lv, Y.; Jiang, Y.; Hu, W.; Cao, M.; Mao, Y. A review of the effects of tunnel excavation on the hydrology, ecology, and environment in karst areas: Current status, challenges, and perspectives. J. Hydrol. 2020, 586, 124891. [Google Scholar] [CrossRef]
  9. Yang, M.D. On the Fragility of Karst Environment. Yunnan Geogr. Environ. Res. 1990, 1, 21–29. [Google Scholar]
  10. Xiong, K.N.; Xiao, S.Z.; Liu, Z.Q.; Chen, P.D. Comparative analysis on World Natural Heritage value of South China Karst. Strateg. Study CAE 2008, 10, 17–28. [Google Scholar]
  11. Xiong, K.N.; Chi, Y.K. The problems in Southern China Karst ecosystem in Southern of China and its countermeasures. Ecol. Econ. 2015, 31, 23–30. [Google Scholar]
  12. Riyanto, I.A.; Widyastuti, M.; Cahyadi, A.; Agniy, R.F.; Adji, T.N. Groundwater Management Based on Vulnerability to Contamination in the Tropical Karst Region of Guntur Spring, Gunungsewu Karst, Java Island, Indonesia. Environ. Process. 2020, 7, 1277–1302. [Google Scholar] [CrossRef]
  13. Xiao, S.Z.; Xiao, H.; Wu, Y.H. Assessment of construction project on the aesthetic values of world heritage landscape based on GIS viewshed analysis: A case study of Wulingyuan World Natural Heritage Site. J. Guilin Univ. Technol. 2020, 40, 516–522. [Google Scholar]
  14. Wang, Z.G.; Yang, Z.P.; Cao, K.J.; Song, Q.; Liu, Q.; Wang, C.R. Community Cognition on the Protection of World Natural Heritage and Its Affecting Factors: A Case Study in the Kalajun World Natural Heritage Site. Arid Zone Res. 2016, 33, 1311–1317. [Google Scholar]
  15. Zhang, N.; Xiong, K.N.; Zhang, J.; Xiao, H. Evaluation and prediction of ecological environment of karst world heritage sites based on google earth engine: A case study of Libo-Huanjiang karst. Environ. Res. Lett. 2023, 18, 034033. [Google Scholar] [CrossRef]
  16. Shi, H.; Shi, T.; Han, F.; Liu, Q.; Zhao, H. Conservation Value of World Natural Heritage Sites’ Outstanding Universal Value via Multiple Techniques—Bogda, Xinjiang Tianshan. Sustainability 2019, 11, 5953. [Google Scholar] [CrossRef]
  17. Sobhani, P.; Esmaeilzadeh, H.; Sadeghi, S.M.M.; Wolf, I.D. Land potential for ecotourism development and assessing landscape ecology in areas on protection of Iran. Environ. Dev. Sustain. 2023, 1–35. [Google Scholar] [CrossRef]
  18. Irfan, Z.B.; Ling, V.; Shan, J. Ecological health assessment of the Ousteri wetland in India through synthesizing remote sensing and inventory data. Lakes Reserv. Res. Manag. 2020, 25, 84–92. [Google Scholar] [CrossRef]
  19. Liu, F.; Yin, Q.; Zhang, Z.X.; Gong, C.L. Study on remote sensing estimation index and model of urban ecological environment foundation quality. J. Infrared Millim. Waves 2008, 3, 219–223. [Google Scholar] [CrossRef]
  20. Sobhani, P.; Esmaeilzadeh, H.; Sadeghi, S.M.M.; Wolf, I.D.; Esmaeilzadeh, Y.; Deljouei, A. Assessing Spatial and Temporal Changes of Natural Capital in a Typical Semi-Arid Protected Area Based on an Ecological Footprint Model. Sustainability 2022, 14, 10956. [Google Scholar] [CrossRef]
  21. Li, K.D.; Yuan, L.; Hu, X.; Sun, X.F. Spatiotemporal dynamics of Production-Living-Ecological land and its impact on the environment in Beijing-Tianjin-Hebei Region. Ecol. Sci. 2023, 42, 94–102. [Google Scholar]
  22. Shu, T.; Xiong, K.N.; Zhang, N. Response of the Desertification Landscape Patterns to Spatial–Temporal Changes of Land Use: A Case Study of Salaxi in South China Karst. Land 2023, 12, 1557. [Google Scholar] [CrossRef]
  23. Zhang, X.; Du, H.; Wang, Y.; Chen, Y.; Ma, L.; Dong, T. Watershed landscape ecological risk assessment and landscape pattern optimization: Take Fujiang River Basin as an example. Hum. Ecol. Risk Assess. Int. J. 2021, 27, 2254–2276. [Google Scholar] [CrossRef]
  24. Ying, C.; Ling, H.; Kai, H. Change and Optimization of Landscape Patterns in a Basin Based on Remote Sensing Images: A Case Study in China. Pol. J. Environ. Stud. 2017, 26, 2343–2353. [Google Scholar] [CrossRef] [PubMed]
  25. Sun, D.Q.; Zhang, J.X.; Hu, Y.; Jiang, J.L.; Zhou, L. Spatial analysis of China’s eco-environmental quality: 1990–2010. J. Geogr. Sci. 2013, 23, 695–709. [Google Scholar] [CrossRef]
  26. Zhang, Y.J.; Song, W.; Fu, S.; Yang, D.Z. Decoupling of Land Use Intensity and Ecological Environment in Gansu Province, China. Sustainability 2020, 12, 2779. [Google Scholar] [CrossRef]
  27. Li, G.C.; Xiong, K.N.; Xiao, S.Z.; Zhou, M.Z. Research on World Heritage Geomorphologic Value of the Shibing Karst. Trop. Geogr. 2013, 33, 562–569. [Google Scholar]
  28. Wang, X.J.; Liu, G.X.; Xiang, A.C.; Xiao, S.M.; Lin, D.R.; Lin, Y.B.; Lu, Y. Terrain gradient response of landscape ecological environment to land use and land cover change in the hilly watershed in South China. Ecol. Indic. 2023, 146, 109797. [Google Scholar] [CrossRef]
  29. Tolessa, T.; Senbeta, F.; Kidane, M. The impact of land use/land cover change on ecosystem services in the central highlands of Ethiopia. Ecosyst. Serv. 2017, 23, 47–54. [Google Scholar] [CrossRef]
  30. Xiang, G.F.; Hua, R. Land use change and ecological environment effects in coal resource city: A case study of pingdingshan, henan province. Fresenius Environ. Bull. 2021, 30, 8506–8513. [Google Scholar]
  31. Li, X.W.; Fang, C.L.; Huang, J.C.; Mao, H.Y. The urban land use transformations and associated effects on eco-environment in northwest china arid region: A case study in hexi region, gansu province. Quat. Sci. 2003, 23, 280–290. [Google Scholar]
  32. Jiang, X.T.; Zhai, S.Y.; Wang, Z.; Liu, H.; Chen, J.; Zhu, Y.Y. Simulating the Production-Living-Ecological space and analyzing eco-environmental effects based on FLUS model in Zhengzhou, China. Acta Ecol. Sin. 2018, 38, 97–106. [Google Scholar]
  33. Detsis, V. Placing land degradation and biological diversity decline in a unified framework: Methodological and conceptual issues in the case of the north Mediterranean region. Land Degrad. Dev. 2010, 21, 413–422. [Google Scholar] [CrossRef]
  34. Sadeghi, S.M.M.; Gordon, D.A.; Van Stan, J.T. II A global synthesis of throughfall and stemflow hydrometeorology. In Precipitation Partitioning by Vegetation: A Global Synthesis; Springer: Cham, Switzerland, 2020; pp. 49–70. [Google Scholar]
  35. Ahmadi-Sani, N.; Razaghnia, L.; Pukkala, T. Effect of Land-Use Change on Runoff in Hyrcania. Land 2022, 11, 220. [Google Scholar] [CrossRef]
  36. Cheng, C.; Zhang, F.; Shi, J.C.; Kung, H.T. What is the relationship between land use and surface water quality? A review and prospects from remote sensing perspective. Environ. Sci. Pollut. Res. 2022, 29, 56887–56907. [Google Scholar] [CrossRef]
  37. Achu, A.L.; Thomas, J. Soil erosion and sediment yield modeling in a tropical mountain watershed of the southern Western Ghats, India using RUSLE and Geospatial tools. Total Environ. Res. Themes 2023, 8, 100072. [Google Scholar] [CrossRef]
  38. Ma, S.; Wang, L.J.; Wang, H.Y.; Zhao, Y.G.; Jiang, J. Impacts of land use/land cover and soil property changes on soil erosion in the black soil region, China. J. Environ. Manag. 2023, 328, 117024. [Google Scholar] [CrossRef] [PubMed]
  39. Zare, M.; Panagopoulos, T.; Loures, L. Simulating the impacts of future land use change on soil erosion in the kasilian watershed, Iran. Land Use Policy 2017, 67, 558–572. [Google Scholar] [CrossRef]
  40. Deljouei, A.; Abdi, E.; Marcantonio, M.; Majnounian, B.; Amici, V.; Sohrabi, H. The impact of forest roads on understory plant diversity in temperate hornbeam-beech forests of Northern Iran. Environ. Monit. Assess 2017, 189, 392. [Google Scholar] [CrossRef]
  41. Li, Y.Z.; Liu, C.M.; Liu, X.M.; Liang, K.; Bai, P.; Feng, Y.X. Impact of the Grain for Green Project on the Land Use/Cover Change in the Middle Yellow River. J. Nat. Resour. 2016, 31, 2005–2020. [Google Scholar]
  42. Zhang, N.; Xiong, K.N.; Zhang, J.; Xiao, H.; Shen, C.H. Ecological Environment Dynamic Monitoring and Driving Force Analysis of Karst World Heritage Sites Based on Remote-Sensing: A Case Study of Shibing Karst. Land 2023, 12, 184. [Google Scholar] [CrossRef]
Figure 1. Location of the study area.
Land 12 01978 g001
Figure 2. Map of land use types in the three phases.
Land 12 01978 g002
Figure 3. Land use change mapping of Shibing Karst from 2000 to 2020.
Land 12 01978 g003
Figure 4. Land use transfer matrix.
Land 12 01978 g004
Figure 5. Attitudinal changes in mobility.
Land 12 01978 g005
Figure 6. Spatial pattern of eco-environment quality in Shibing Karst.
Land 12 01978 g006
Table 1. Land use classifications and their ecological quality indices.
NumberTypeEVt
1Cropland0.27
2Forest0.76
3Shrub0.65
4Grassland0.70
5Water0.54
6Impervious0.18
Table 2. Eco-environmental quality index of land use in Shibing Karst.
YearCroplandForestShrubGrasslandWaterImperviousComposite Index
20000.03910.63200.01310.00200.00010.00010.6863
20100.02830.66480.01300.00020.00010.00000.7064
20200.02310.67710.01520.00010.00010.00000.7155
Table 3. Factors affecting eco-environment quality in Shibing Karst and their contribution rates.
ItemsType of TransferArea Transformed 2000–2020 (km2)Ecological ContributionPercentage of Contribution
Ecological improvementCropland–Forest16.8600.0292087.05%
Cropland–Shrub2.1170.002848.48%
Cropland–Grassland0.03600.000050.61%
Shrub–Forest3.4390.001343.99%
Grassland–Forest0.2900.000060.18%
Impervious–Cropland0.1060.000030.10%
Impervious–Forest0.0060.000010.04%
Ecological degradationForest–Cropland1.6660.0028965.06%
Forest–Shrub2.1590.0008418.93%
Forest–Grassland0.0090.000010.04%
Shrub–Cropland0.0270.000040.81%
Grassland–Cropland0.4350.0006614.90%
Grassland–Shrub0.0660.000120.26%
Disclaimer/Publisher’s Note: The statements, opinions and data contained in all publications are solely those of the individual author(s) and contributor(s) and not of MDPI and/or the editor(s). MDPI and/or the editor(s) disclaim responsibility for any injury to people or property resulting from any ideas, methods, instructions or products referred to in the content.

