Article

How Should Soundscape Optimization from Perceived Soundscape Elements in Urban Forests by the Riverside Be Performed?

1
School of Architecture, Southeast University, Nanjing 210096, China
2
School of Architecture and Urban-Rural Planning, Fuzhou University, Fuzhou 350108, China
3
Department of Forest Resources Management, University of British Columbia, Vancouver, BC V6T 1Z4, Canada
*
Author to whom correspondence should be addressed.
These authors contributed equally to this work.
Land 2023, 12(10), 1929; https://doi.org/10.3390/land12101929
Submission received: 18 August 2023 / Revised: 7 October 2023 / Accepted: 10 October 2023 / Published: 17 October 2023

Abstract

:
Urban forests by the riverside are important habitats for various animals and contribute various soundscapes for citizens. Unfortunately, urban forests are exposed to the influence of riverside traffic noises from freeways. This study aims to explore the spatial and temporal variation of soundscape, conduct soundscape optimization for multiple parameters, and find a balance and its interval of soundscape elements through optimizing a soundscape map. Questionnaires and measuring equipment were used to gather soundscape information in an urban forested area in Fuzhou, China. Diurnal variations and soundscape mapping were used to analyze spatial and psychophysical relationships between soundscape drivers. We then conducted optimization for a soundscape map, which included normalization, critical value determination, target interval of optimal SPL determination, and modification of SPL and mapping. Our findings suggest that biological activities and natural phenomena are potential drivers for diurnal variation of soundscapes, especially tidal phenomena contributing water and shipping soundscapes. Our results also suggest that all the high values of perceived soundscapes were found at the southwest corner of the study area, which includes both riverside and urban forest elements. Furthermore, we suggest combining both optimal soundscape and SPL correction maps to aid in sustainable design in urban forests. This can contribute to the understanding and methodology of soundscape map optimization in urban forests when proposing suitable design plans and conservation of territorial sound.

1. Introduction

An urban forested area is an important part of urban green infrastructure. It encompasses the trees and shrubs in an urban area, including those in yards, along streets and utility corridors, in protected areas, and in watersheds [1]. Urban forests provide a variety of potential benefits to residents, such as sustainable cooling for cities [2], improved air quality [3,4], noise reduction [5], and improved sensory landscapes such as lightscapes [6], soundscapes [7,8], and smellscapes. These potential benefits play a key role in the construction of a healthy city. The World Health Organization (WHO) has announced goals for healthy cities, which aim to continuously improve the health and quality of life of city dwellers [9]. A healthy city is one that continually creates and improves its physical and social environments and expands community resources to enable people to mutually support each other. Previous studies of built environments have suggested that blue-green spaces, which are composed mainly of plants and water resources, are an important carrier of a healthy city as they contribute to a landsense ecology in sustainable cities [10]. Urban forested areas near water also play a potential role in healthy cities as they generally have similar compositions to blue-green spaces, which suggests that we should pay more attention to these areas.
Urban forests by riversides are important habitats for various animals. These animals occupy their ecological niche in land, river, and air [11]. The location of urban forests can influence the diversity of animal species. For example, in urban downtown areas, urban forests by the riverside perform the same function as an urban waterfront park [12]. Pets are animals that often accompany their owners during recreational activities in urban downtown areas, which suggests a lack of terrestrial wildlife in urban environments [13]. Contrary to the lack of terrestrial wildlife, wild birds, especially aquatic birds by riversides, occupy the predominant positions in the forested area of downtown. In suburbs, urban forests near the riverside also function as wetlands, suggesting that various wildlife inhabits here [14]. These various animals contribute to the production of biological sound (biophony) in the soundscape. Previous studies have demonstrated that biophony can reduce pressure experienced by people living in high-density cities, further contributing to the development of healthy cities [7]. For our study, we have chosen to focus on understanding soundscapes in urban forests near the riverside.
Unfortunately, urban development has resulted in many issues for urban forests located near riversides [15,16]. As most urban rivers are located near freeways, the most notable and serious issue for urban rivers is traffic pollution, which includes air pollution from traffic emissions, light pollution from car lights, and noise pollution from car horns [17]. Some scholars have conducted research on optimal solutions for landscape visual quality assessment and urban heat mitigation [18,19,20]. There are differences in the penetration capacity of these pollution sources, where noise pollution is strong and easily perceived by the public. The noise pollution spreads into forested areas along freeways at urban forest boundaries, contributing to a negative effect on the soundscape [21]. Urban forest planners and landscape designers do not know how to optimize or minimize noise exposure and negative soundscapes, which is an application gap in urban scenarios. Therefore, optimizing a soundscape map is necessary for urban forests near riversides to provide optimal references for planners and designers.
Previous studies of soundscape optimization have mainly focused on optimal solutions for a single parameter, such as clarifying the optimization threshold through psychophysical laws and linear regression, auditory augmented reality, etc. [22,23]. There is a lack of optimal solutions for multiple parameters, especially when finding a balance between perceived soundscape elements. Another potential research gap is that soundscape optimization is disposable and single-round in general, which suggests that we should focus on achieving multi-round optimization for optimal soundscape. The challenges with these research gaps are how to find a balance and its interval of soundscape elements through multi-round optimization of a soundscape map and then continuously optimize the urban forest. Thus, the following three research questions were asked: (1) Do biological activities and natural phenomena influence the diurnal variation of the soundscape? (2) What is the relationship between subjective and objective data in soundscape maps? (3) How can we apply the optimal soundscape map?
We suggest multiple steps to conduct optimization for a soundscape map for multiple parameters between perceived soundscape elements and provide the possibility of multi-round optimization, contributing to being infinitely close to an extremely optimal solution after multiple rounds of optimization. SPL (LAeq) is the most widely used index to measure noise levels in urban and forest environments [24]. Thus, LAeq is selected as a physical parameter of the optimal soundscape.
This study aims to highlight the importance of urban forests near riversides and fill some of the research gaps in optimizing a soundscape map. Specifically, this study aims to (1) explore the spatial and temporal variation of soundscape in urban forests by riverside; (2) conduct soundscape optimization for multiple parameters; and (3) find a balance and interval of soundscape elements through soundscape map optimization. The findings and methodology developed in this study aim to contribute to soundscape conservation and sustainable design in urban forests.

2. Methodology

2.1. Study Area

Our study was conducted in Fuzhou, Fujian, China, which has a subtropical marine monsoon climate. Our observation site was Fuzhou Beach Park (FBP), an important forested area that has a total area of 200,000 m2 and widths that vary between 30 m and 200 m. FBP is located on both sides of the Hongtang Bridge, along the Wulong River (see Figure 1). FBP is also surrounded by a university and several communities; thus, FBP is mainly visited by residents, students, and tourists. The entrance to FBP is close to a freeway, which often experiences rush hour.
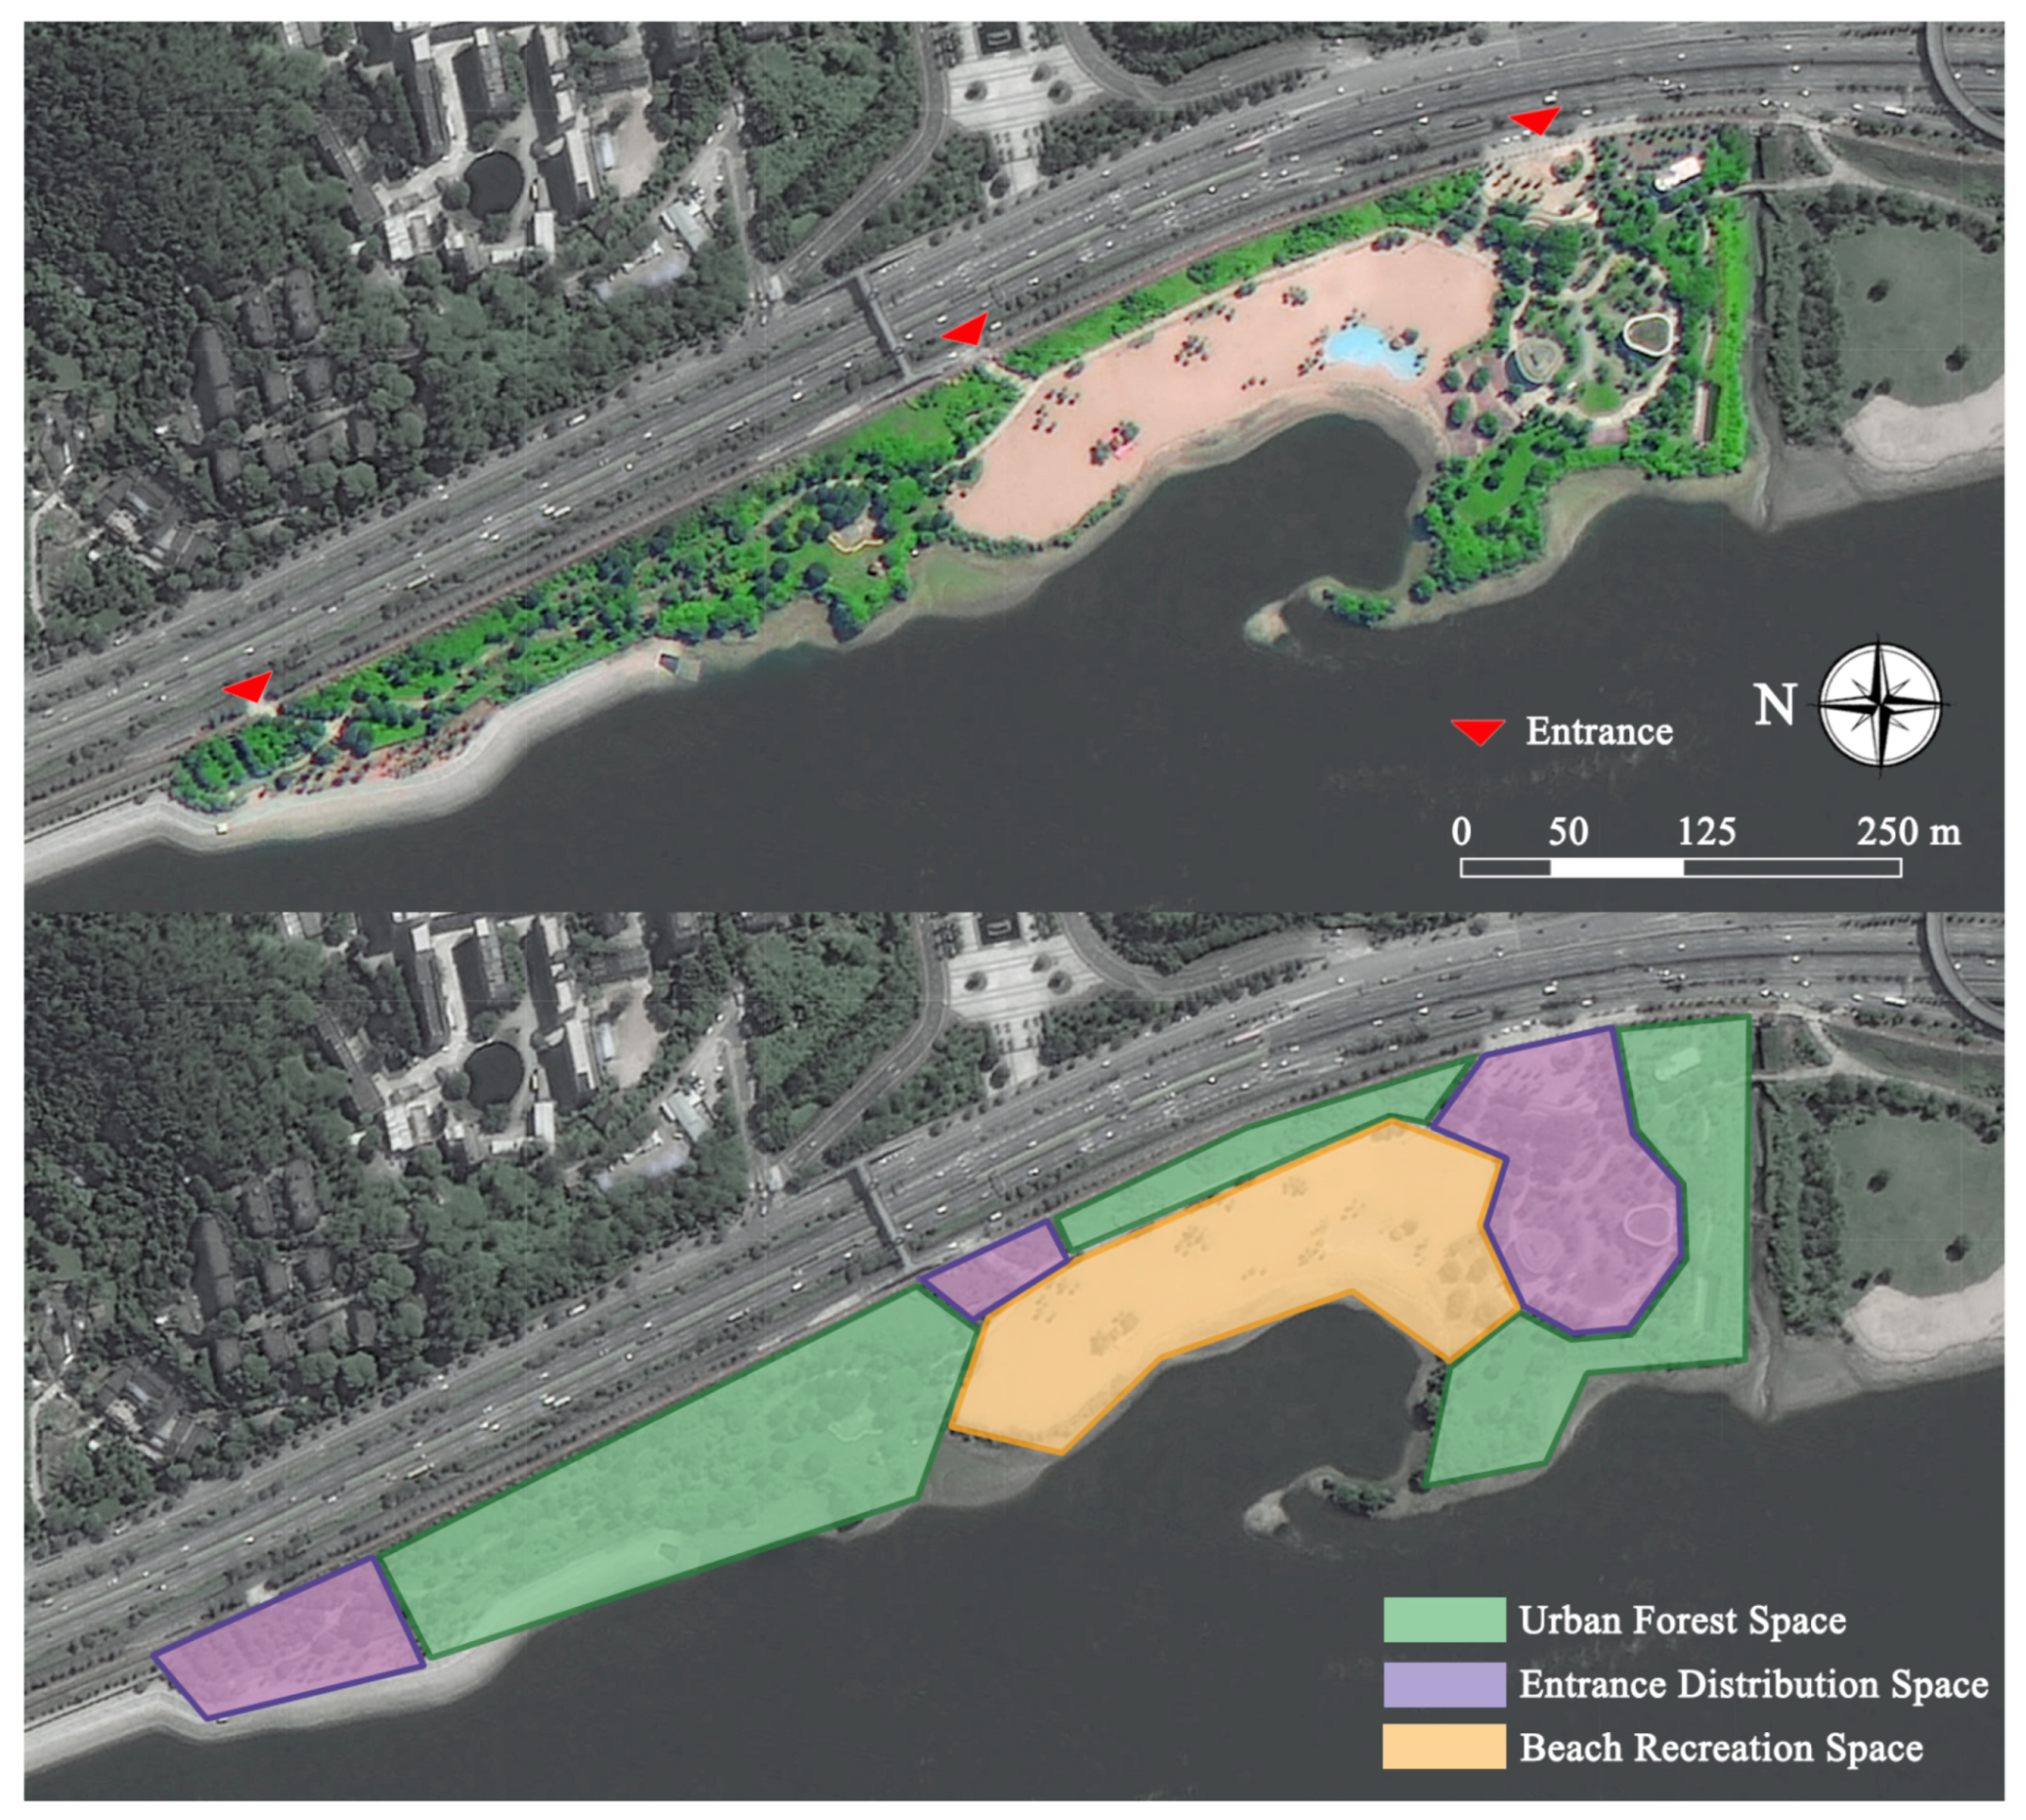
To meet the demand and behavior of visitors, the area of FBP is divided into multiple functional spaces, which include urban forest space, entrance distribution space, and beach recreation space (see Figure 2). The beach recreation space is surrounded by urban forests and a river, which meets the need for visitors to be close to nature. The dominant tree species in the urban forests and entrance distribution spaces include masson pine (Pinus massoniana), mountain ebony (Bauhinia purpurea), linden (Ficus religiosa), and araucaria (Araucaria cunninghamii), whereas hemp palm (Trachycarpusortune) is the dominant tree species in the beach recreation space. Similarly, various animals, such as the intermediate egret (Ardea intermedia), myna (Acridotheres cristatellus), and common tern (Sterna hirundo), inhabit this urban forested area.
Overall, the urban forested areas within FBP contain high levels of forest cover and potential sources for sounds, which makes FBP a suitable area for soundscape research in urban forests. To contribute to soundscape mapping, seventy-eight observation sites that were evenly distributed at 30 m intervals were selected in FBP.

2.2. Soundscape Data

Based on the condition of the study area, various nature resources contributed to potential soundscape resources. Questionnaires and measuring equipment were used to gather soundscape information in Fuzhou Beach Park.
A questionnaire was conducted to inquire about the perceived occurrence and pleasure of soundscapes. According to [25,26], soundscapes are comprised of three main classes: geophony, biophony, and anthrophony. Our questionnaires included: six categories for geophony, including “leaves rustling”, “branches swaying” and “water”, and three blank spaces; six categories for biophony, including “birdsong”, “insects”, “barking”, and three blank spaces; and fourteen categories for anthrophony, including “traffic”, “broadcast”, “ringtone”, “shipping”, “sanitation”, “plant pruning”, “footsteps”, “speech”, “children”, “singing”, “peddling”, and three blank spaces. The first section of the questionnaire determined the presence or absence of soundscape elements before each category. The second section utilized the following five-point ordinal scale [7,27] for the pleasantness of perceived soundscape in urban forests (PSUF) for geophony, biophony, and anthrophony: “not pleasant at all (+1)”, “slightly pleasant (+2)”, “moderately pleasant (+3)”, “very pleasant (+4)”, and “extremely pleasant (+5)”. The third section asked about the questionee’s information, such as age, gender, and hearing ability.
Meanwhile, we conducted a measuring process for a sound environment. SPL (LAeq) is the most widely spread index to measure noise levels in urban environments and forest environments [24]. Thus, this parameter was adopted to express objective information about the soundscape. The LAeq was measured using Type-1 sound level meters (AWA6228+) at 1.5 m above the ground during the survey.

2.3. Procedure

2.3.1. Participants and Measurements

Participants were actively recruited on-site, and the majority of the participants were park visitors. A total of 317 participants (male = 149, female = 168, average 27.6 ± 3.9) with normal hearing took part in the questionnaire. Based on our participants alone, it can be said that visitors to the study area are mainly young and middle-aged. All participants were exposed to the soundscape in a standing position at each site for five minutes, and LAeq was measured simultaneously using five Type-1 sound level meters. Then, the participants spent one minute filling out questionnaires. Equipment measurements were repeated three times at each observation site.
Tests were conducted on sunny days in November 2019, December 2019, and January 2020, not including holidays. The test included five time periods: morning (6:00–9:00) and (9:00–12:00), afternoon (12:00–15:00) and (15:00–18:00), and evening (18:00–21:00). The population distributions of the questionnaire in different periods were 48, 77, 54, 67, and 71 participants, respectively. Before the test began, all participants were told the details of the study and required to sign a consensus outlining the procedures and details of the survey, including content, purpose, and methodology. Furthermore, participants could quit the study at any point if they felt uncomfortable during the process.

2.3.2. Optimizing a Soundscape Map

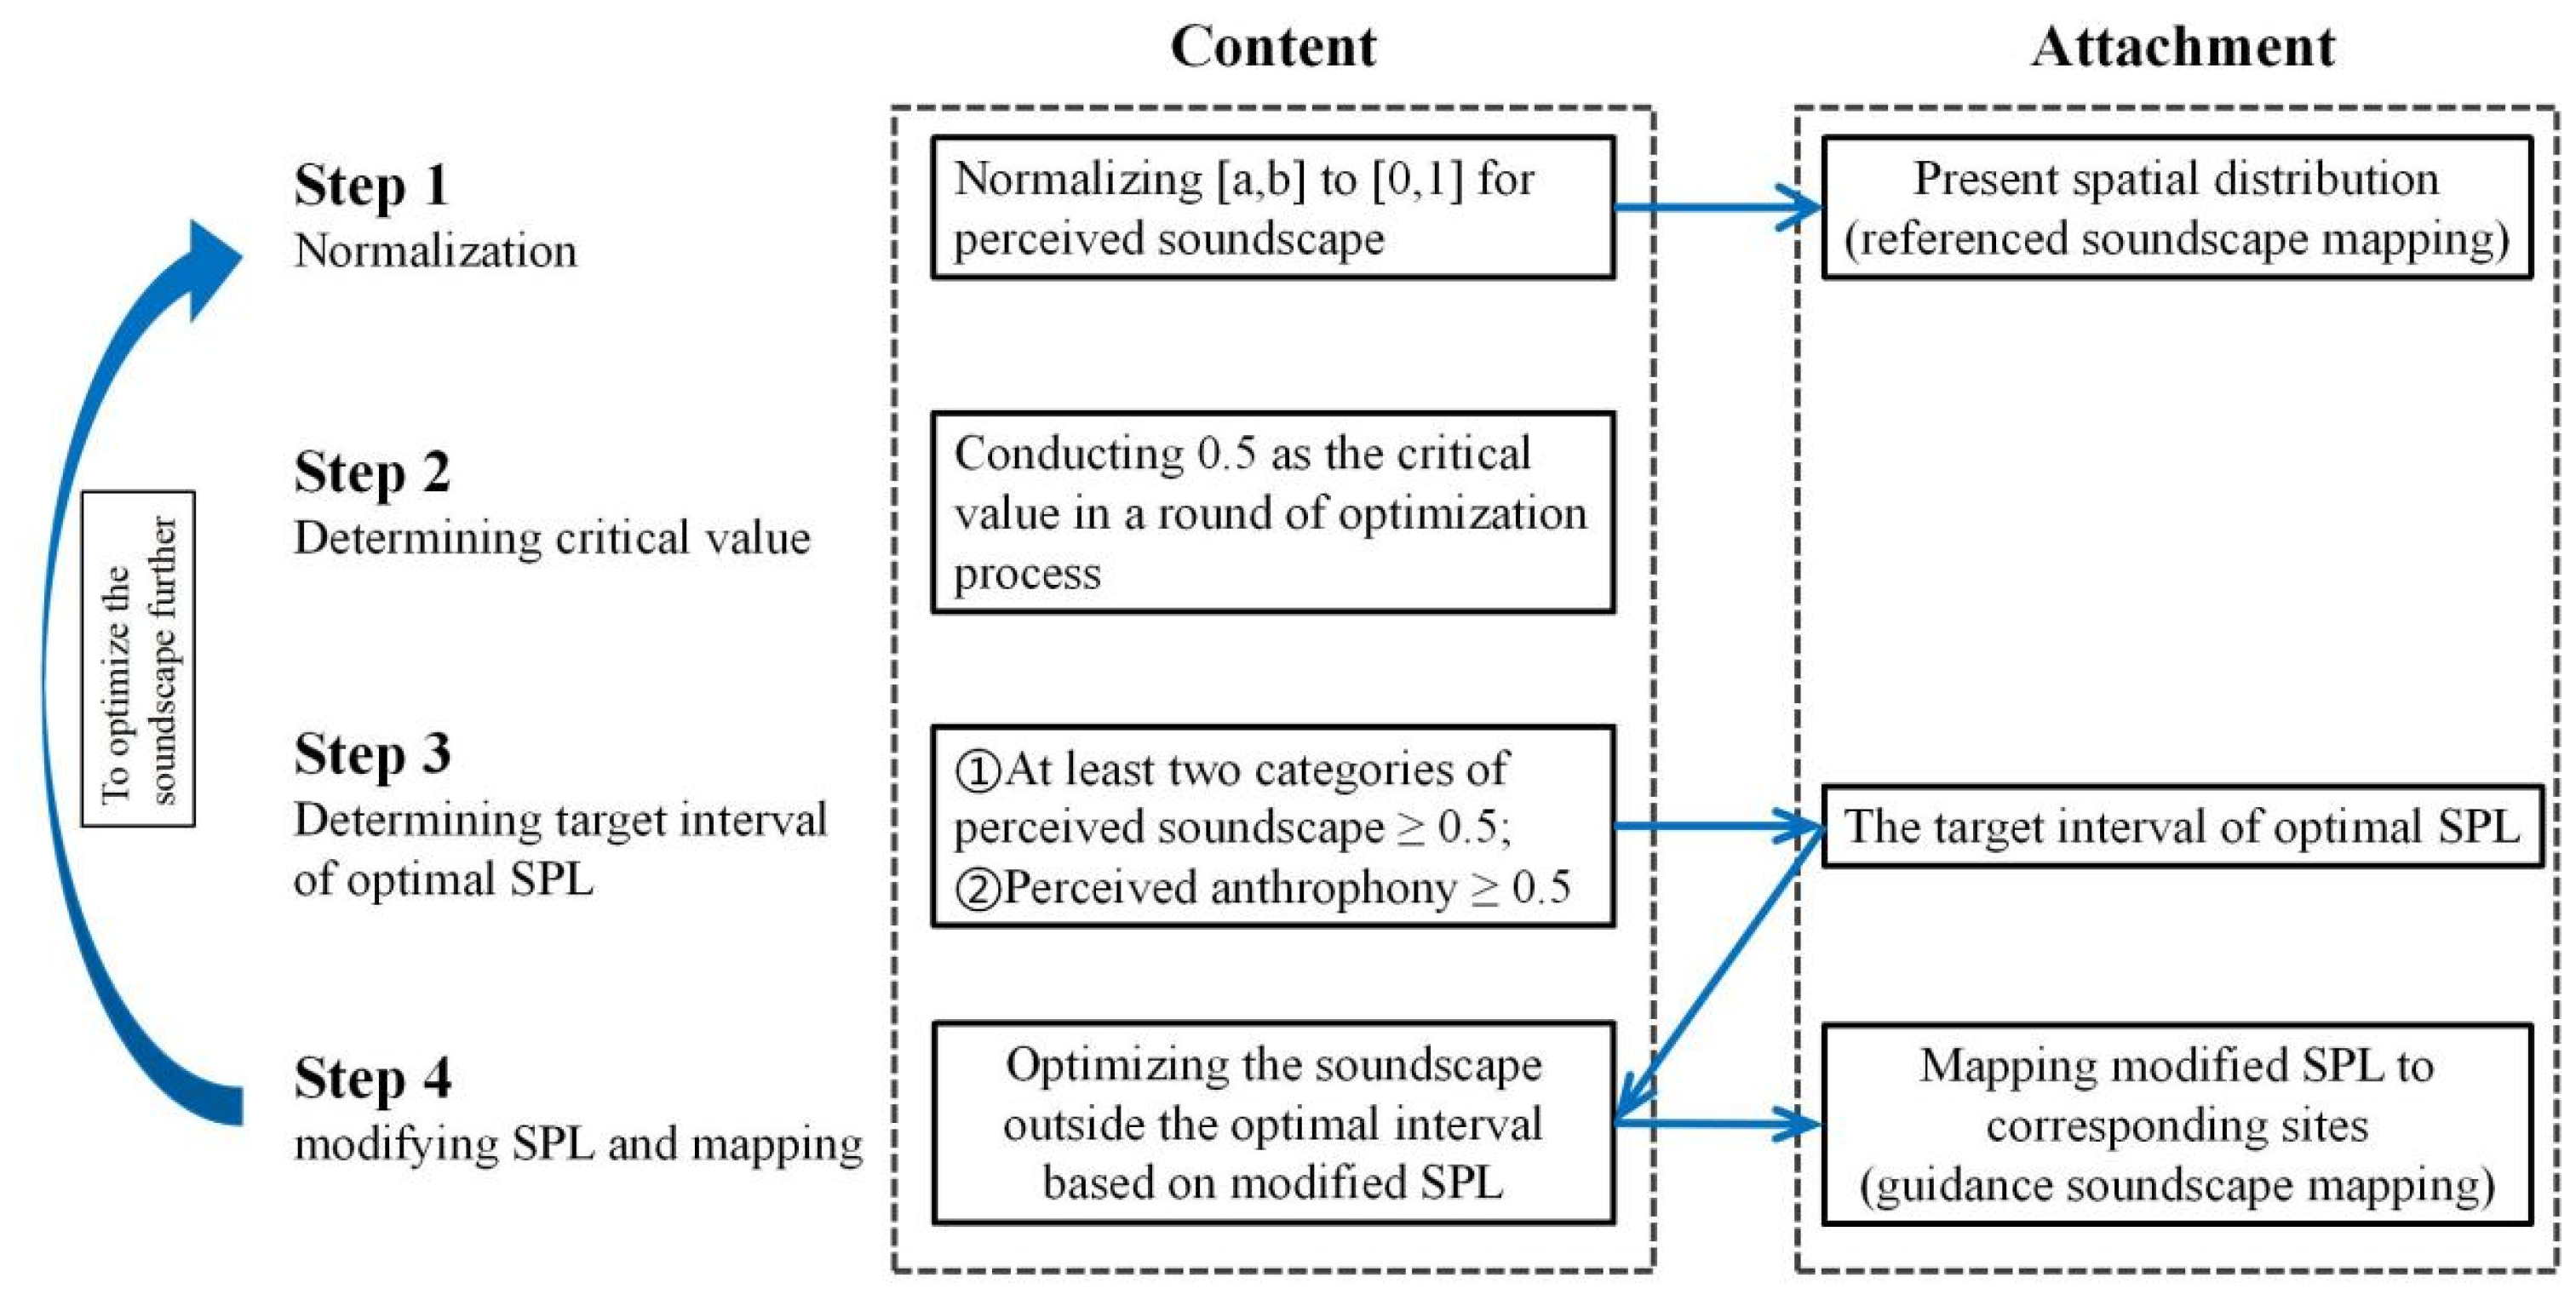
A soundscape is that acoustic environment as perceived, experienced, or understood by a person or people in context [28]. Sound sources in urban forests are generated by nature or human activity. Thus, soundscapes include the superposition and mixing of geophony, biophony, and anthrophony in urban forests [29]. We considered optimal soundscape to be when a perceptual balance is reached among these three soundscape elements. Therefore, optimizing a soundscape map included four steps (see Figure 3).
Step 1: Normalization. Due to the fluctuating extremes of the perceived soundscape, we considered eliminating interval differences through normalization. The normalized interval of perceived soundscape was [0, 1] for geophony, biophony, and anthrophony. We then conducted a process of soundscape mapping as a reference to the present spatial distribution, which is performed using ArcGIS.
Step 2: Determining the critical value. The critical value for the perceptual balance should be considered when finding the optimal target interval of SPL (LAeq). After the normalization process, the 0.5 value represents the average of the perceived soundscape. To effectively and feasibly gradually improve perceived soundscape in urban forests, we considered 0.5 as the critical value of perceived soundscape in a round of optimization. Based on this critical value, multiple rounds may be performed later.
Step 3: Determining the target interval of optimal SPL. Based on the relationship between subjective and objective data of the soundscape, we determined the target interval of optimal SPL according to the critical value from the previous step. Previous studies have suggested that negative artificial sound weakens the positive effects of natural sound [30]. Thus, the target interval for an optimal soundscape is to find the following conditions: (1) perceived soundscape scores are 0.5 or above for at least two categories of soundscape (geophony, biophony, and anthrophony); (2) perceived anthrophony is not below 0.5.
Step 4: Modifying SPL and mapping. According to the obtained optimal interval, we optimized the soundscape outside the optimal interval by modifying SPL. The modified SPL data were mapped to corresponding observation sites. We then conducted a process of soundscape mapping as a guide to optimal spatial distribution.
Furthermore, by combining the referenced and guidance soundscape mapping, we could propose suitable design plans for different spatial locations. If we wanted to optimize the soundscape further, we would start from the first step again and conduct multiple optimal processes.

3. Result

3.1. Diurnal Variation of Soundscape

3.1.1. Perceived Soundscape Elements at Different Time Periods

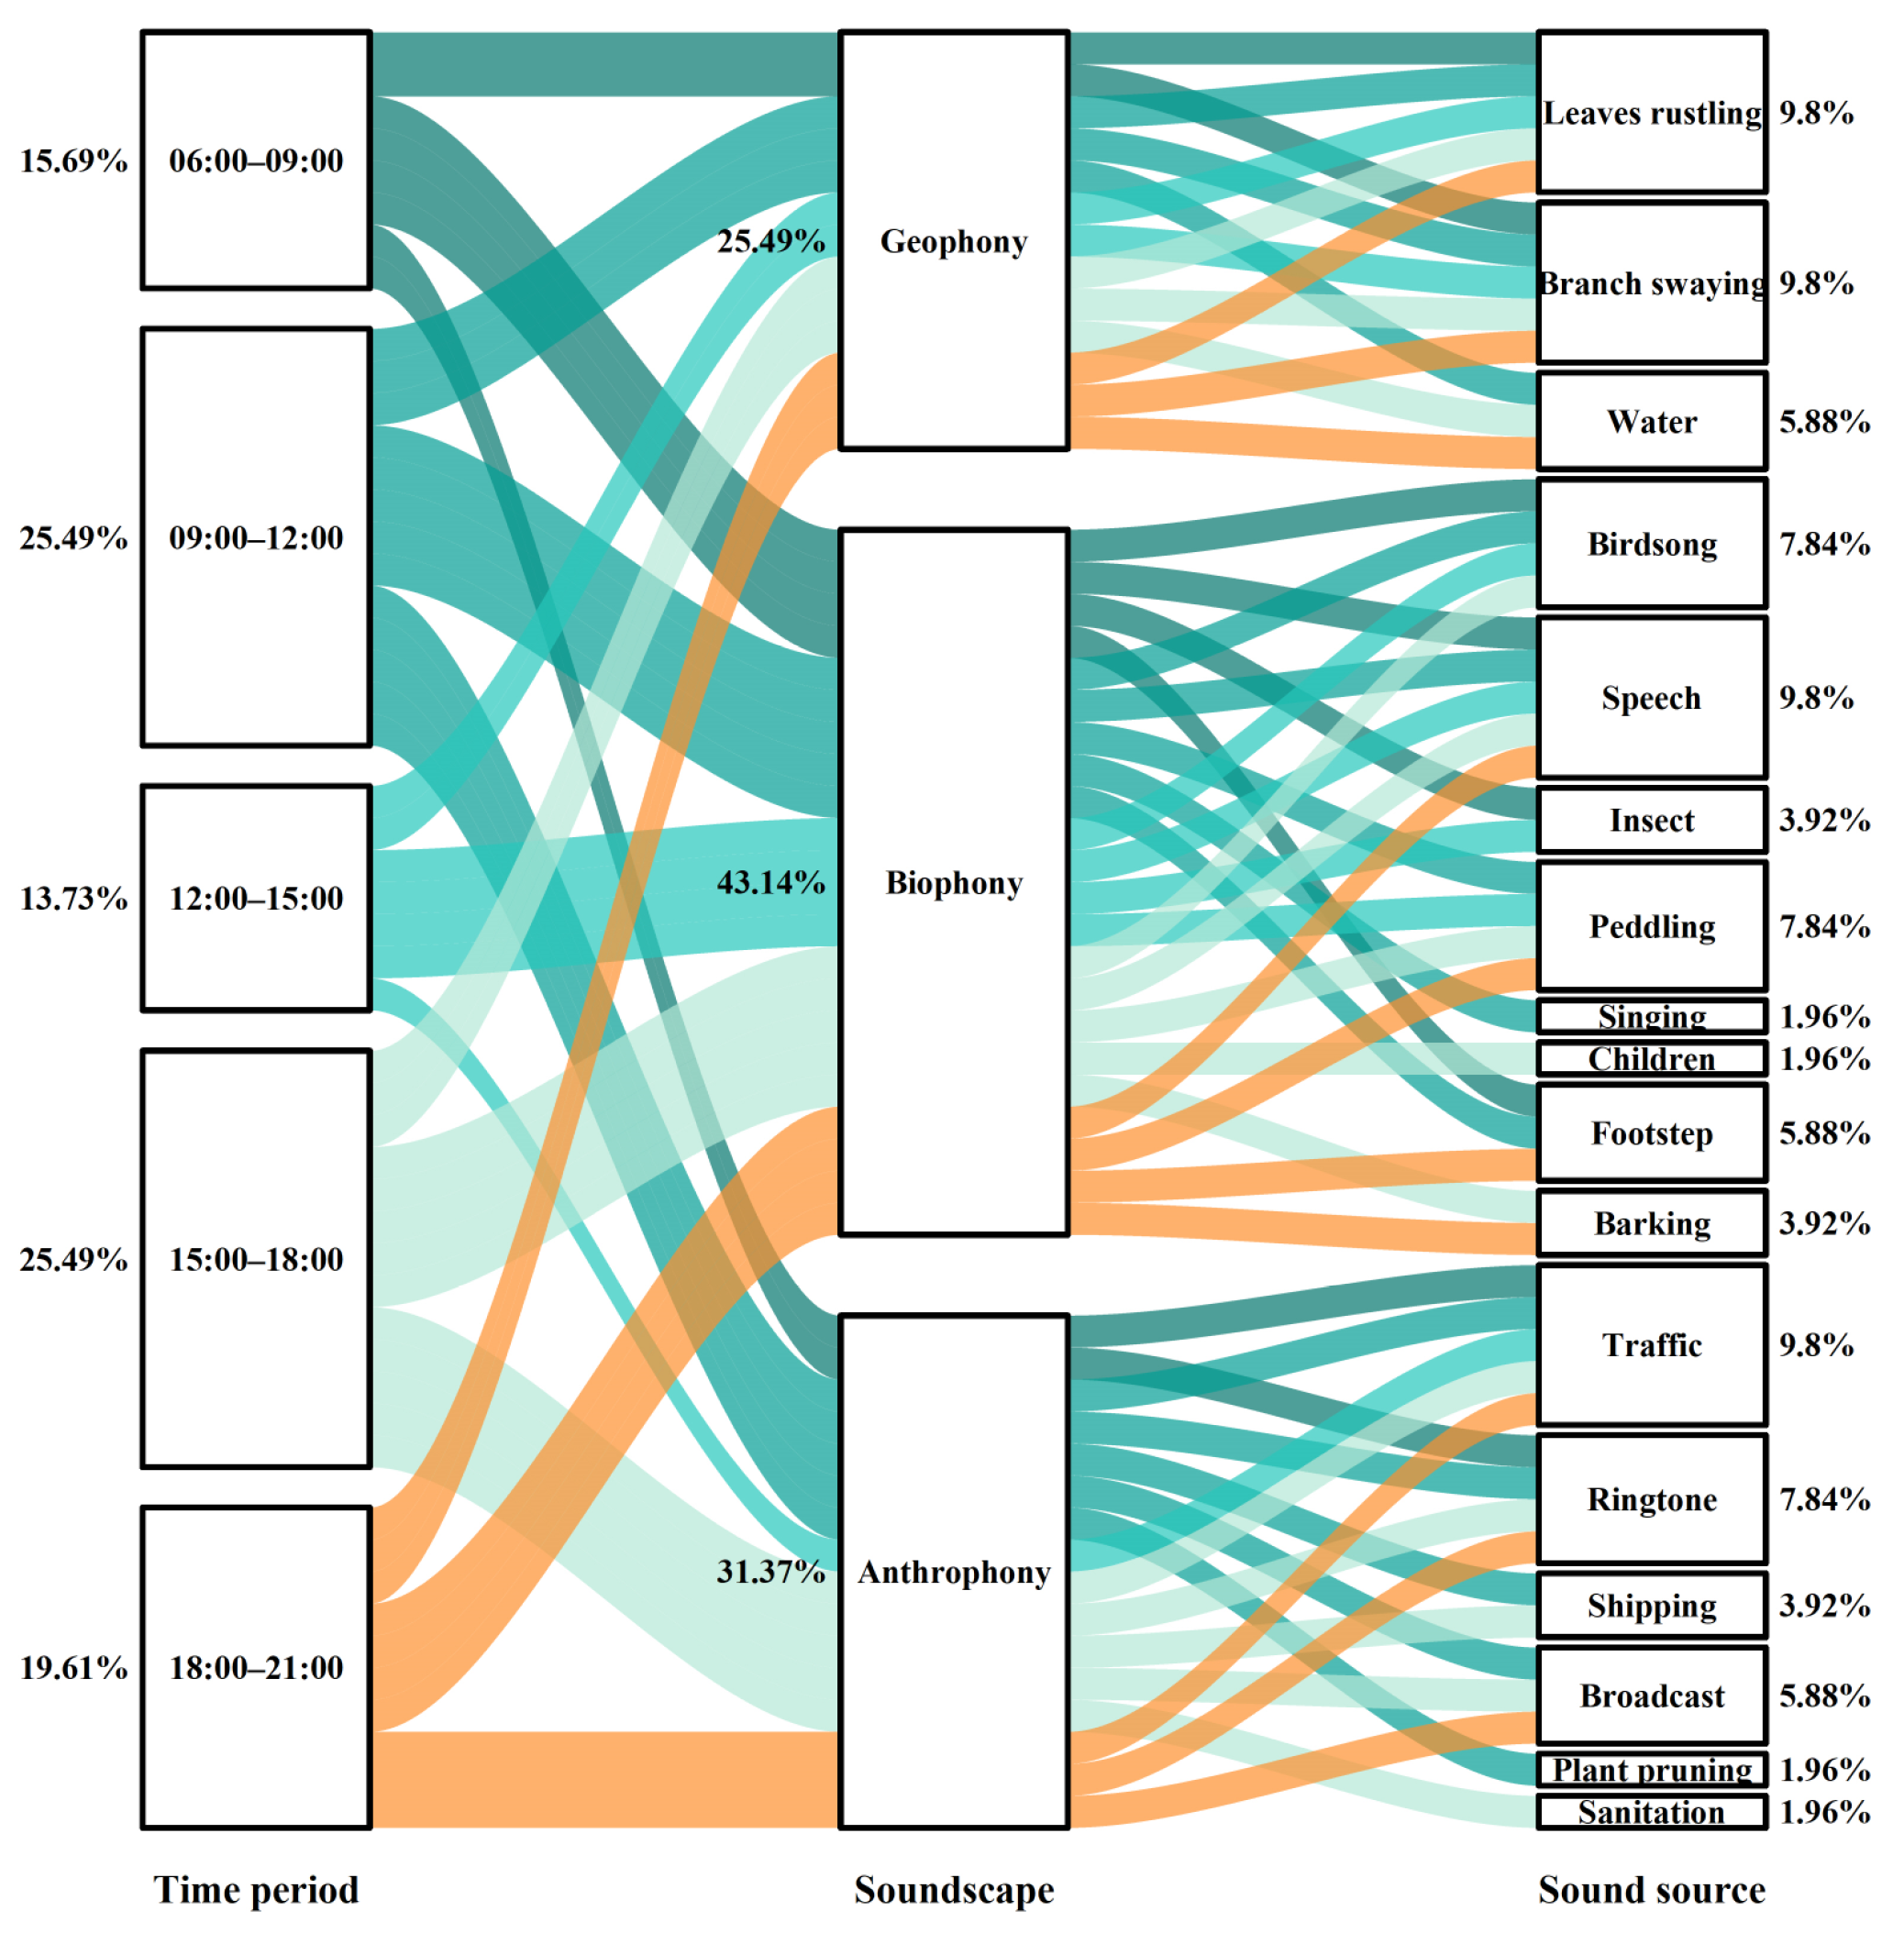
Perceived soundscape elements obtained from questionnaires were summed and classified. This included “leaves rustling”, “branches swaying”, and “water” for geophony; “birdsong”, “footsteps”, “speech”, “insects”, “peddling”, “barking”, “children”, and “singing” for biophony; and “traffic”, “broadcast”, “ringtone”, “shipping”, “sanitation”, and “plant pruning” for anthrophony. These perceived soundscape elements suggest that there are various soundscapes in the study area. As shown in Figure 4, our results indicated that anthrophony occupies a majority of the soundscape (accounting for 58.82%), and the periodicity of the anthrophony also influences soundscape variation. Thus, a diurnal variation analysis of the perceived soundscape (see Figure 5) was conducted.
The above figure demonstrates that “leaves rustling”, “branches swaying” in geophony, and “speech” in anthrophony were distributed in all time periods, which suggests that the natural phenomena of river wind and individuals’ speech may occur in diurnal variation. Between the period of 9:00–12:00, there was a maximal gap of perceived soundscape elements between natural sound (geophony and biophony) and unnatural sound (anthrophony), with a ratio of 4:9. There was a minimal difference in perceived soundscape elements between the period of 6:00–9:00, with a ratio of 1:1. but the number of biophony and anthrophony elements remained the same during this time. Specifically, results showed that “birdsong” and “peddling” occurred before night (18:00–21:00) and after morning (06:00–09:00), respectively. These sound elements were also dominant throughout the day, with an overlapping period between 09:00 and 18:00. This suggested that the most frequent biological and human activities in the study area occur between 09:00–18:00. We also found that when “shipping” was perceived, “water” would also be perceived, which indicated a potential relationship between the sailing time and tide.

3.1.2. Sound Pressure Level in Main Distribution Spaces

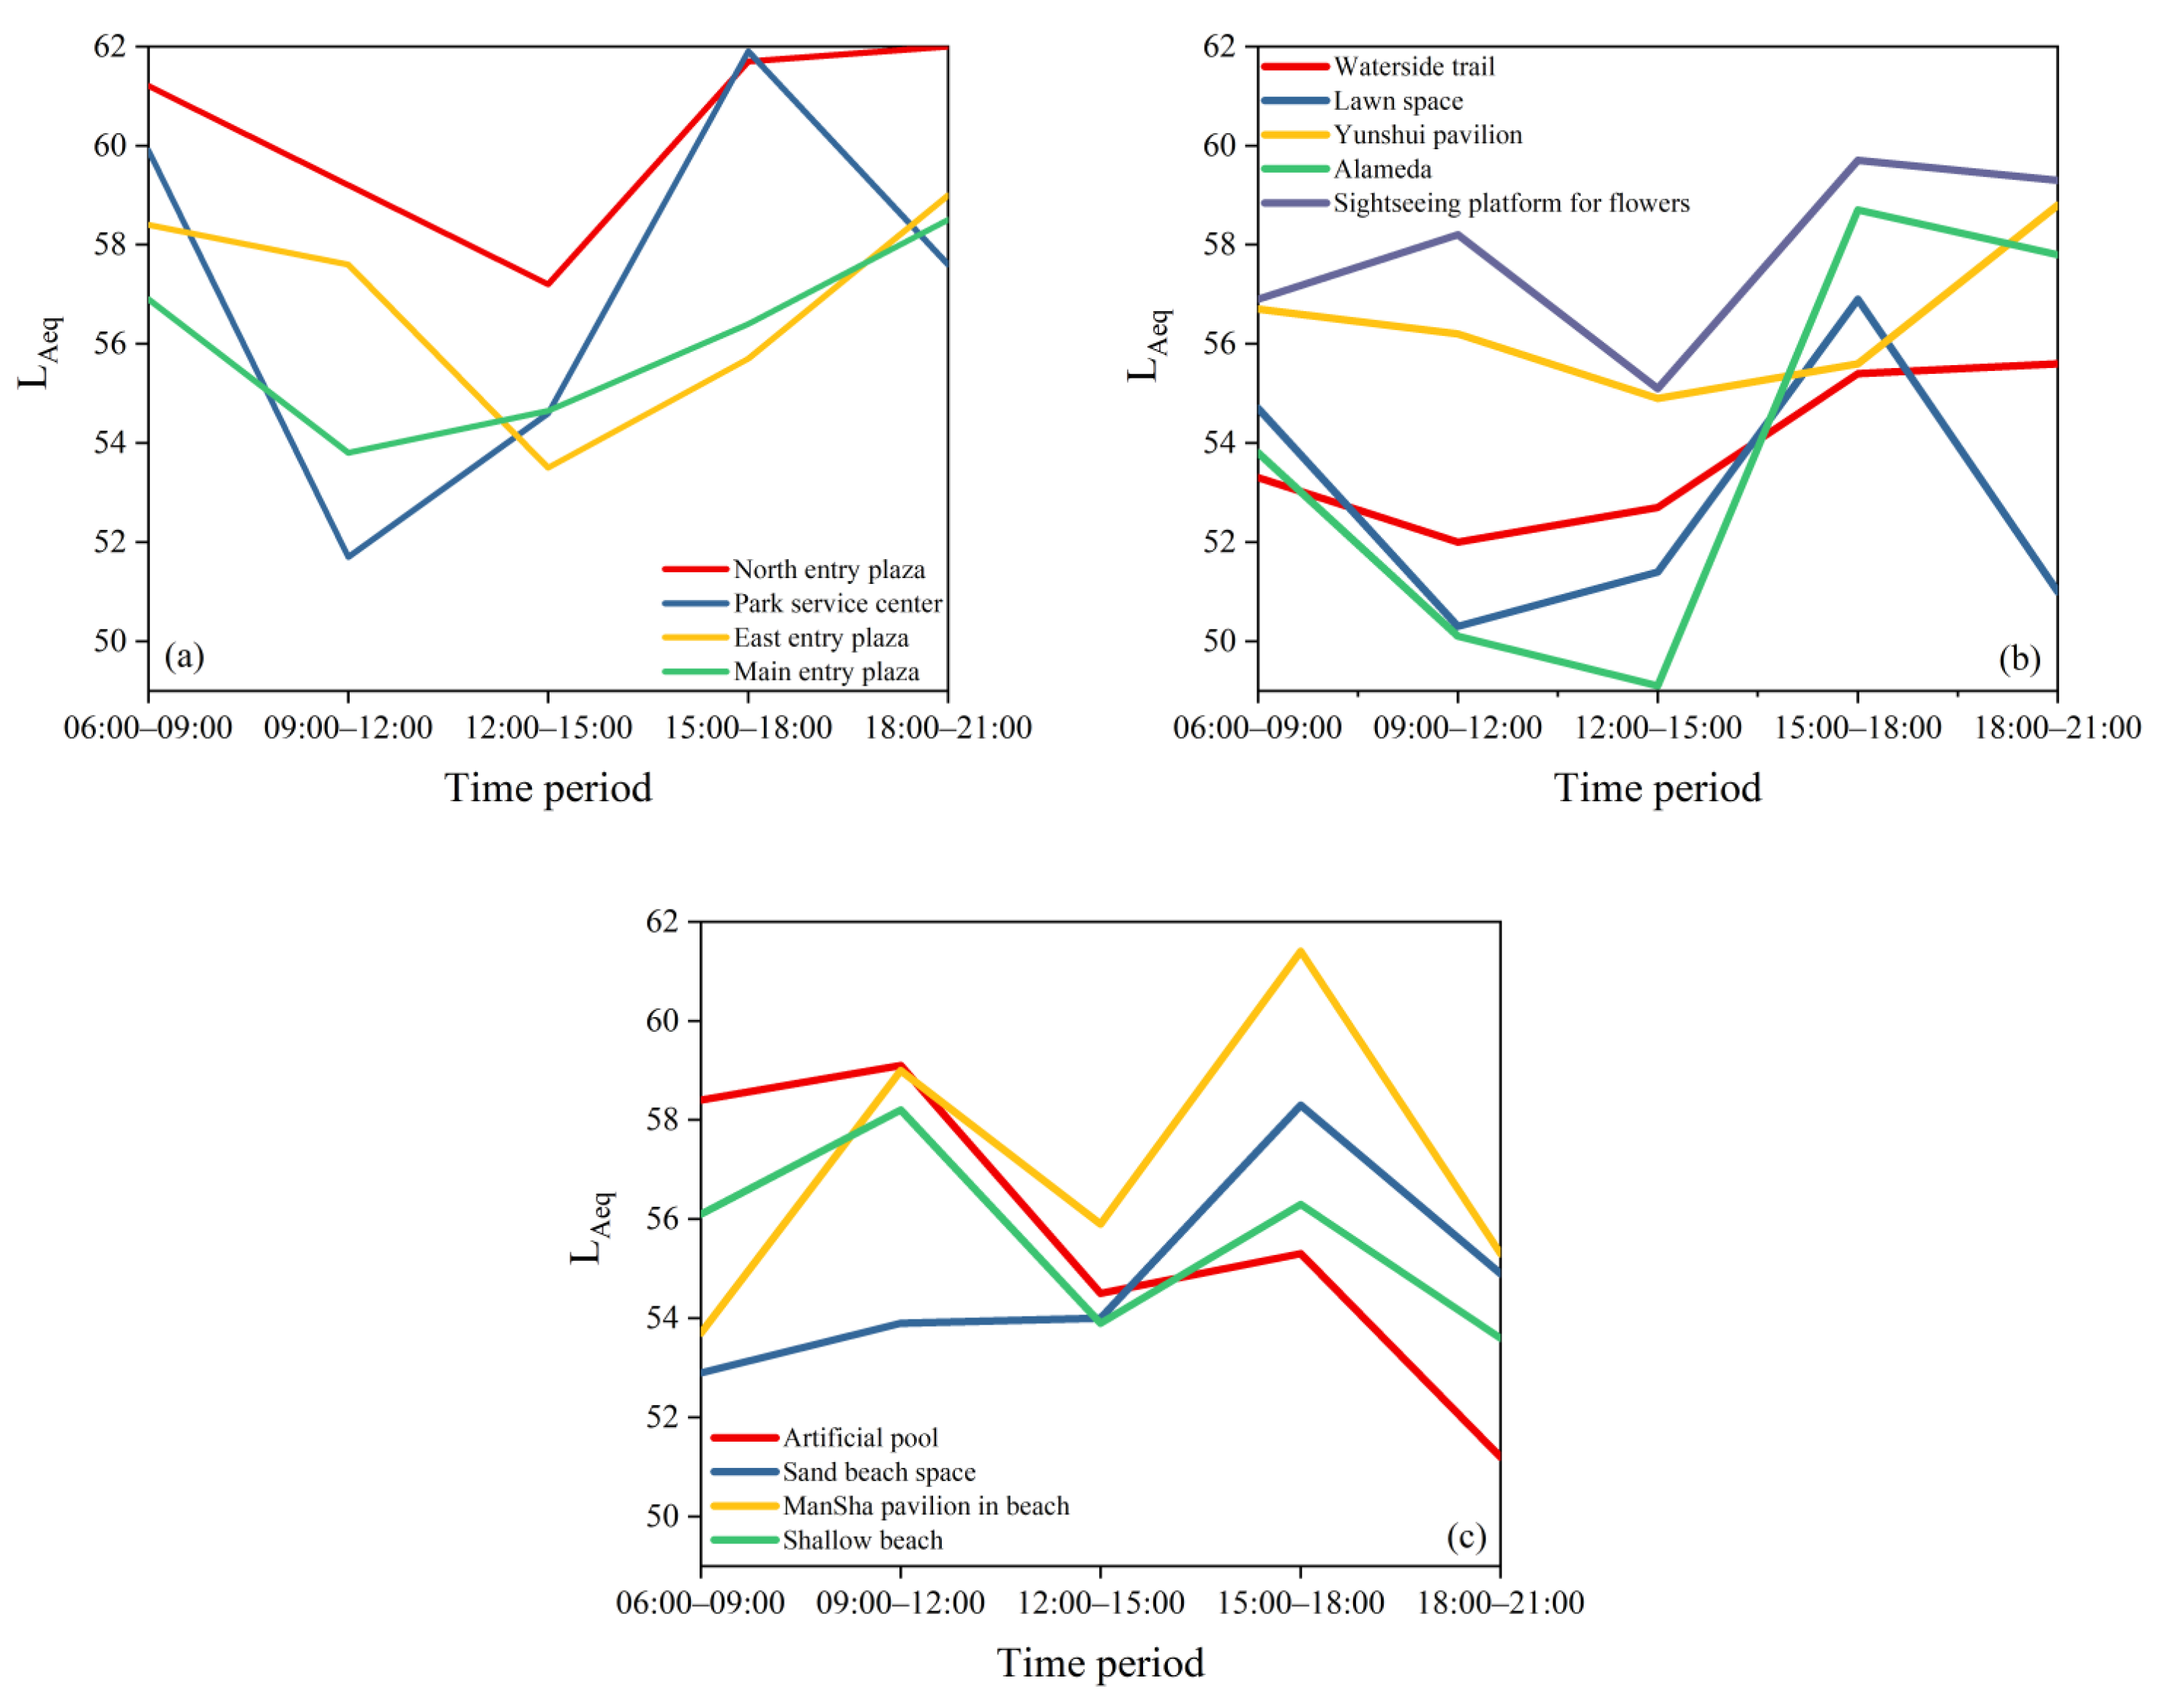
The flow rate of individuals influences the sound pressure level of the main distribution spaces. Figure 5 shows the SPL of each distribution space within the main distribution spaces, which include the entrance distribution space, urban forest space, and beach recreation space. The period with the lowest SPL was between 12:00 and 15:00 and occurred mainly in the urban forest area, which indicated low biological activities at this time. The period with the highest SPL was between 18:00 and 21:00 and was found to occur mainly in the entrance distribution space. Similarly, our results also showed that periods of high SPL were found at 06:00–09:00 and 15:00–18:00, which suggested a potential relation between biological activities and rush hour. Interestingly, we found that the average SPL of urban forest space was higher than that of beach recreation areas between 18:00 and 21:00, and bird activity decreased after dusk, which suggested that individuals may participate in more recreational activities at night in nearby green spaces than water.
Our results showed that the “North entry plaza” had the most periods where the SPL was at its highest, which was distributed in the interval [57.2, 62.0] dBA. We also found that SPL at the “North entry plaza” decreased during the non-rush hour between 9:00 and 15:00. This may be due to the entry plaza being near an expressway, where SPL may have been influenced by traffic noise. In the urban forest space, the SPL for “Sightseeing platform for flowers” was highest and distributed in the interval [56.9, 59.7] dBA. The “Sightseeing platform for flowers” acts as a transition space between the urban forest and beach recreation spaces and plays a role in the function of stopping and staying for rest. In the beach recreation space, the SPL for “Mansha pavilion in beach” was highest and most distrusted in the interval [53.7, 61.4] dBA. This space acts not only as a resting place, but also as an active place for beach activities.

3.2. Soundscape Mapping

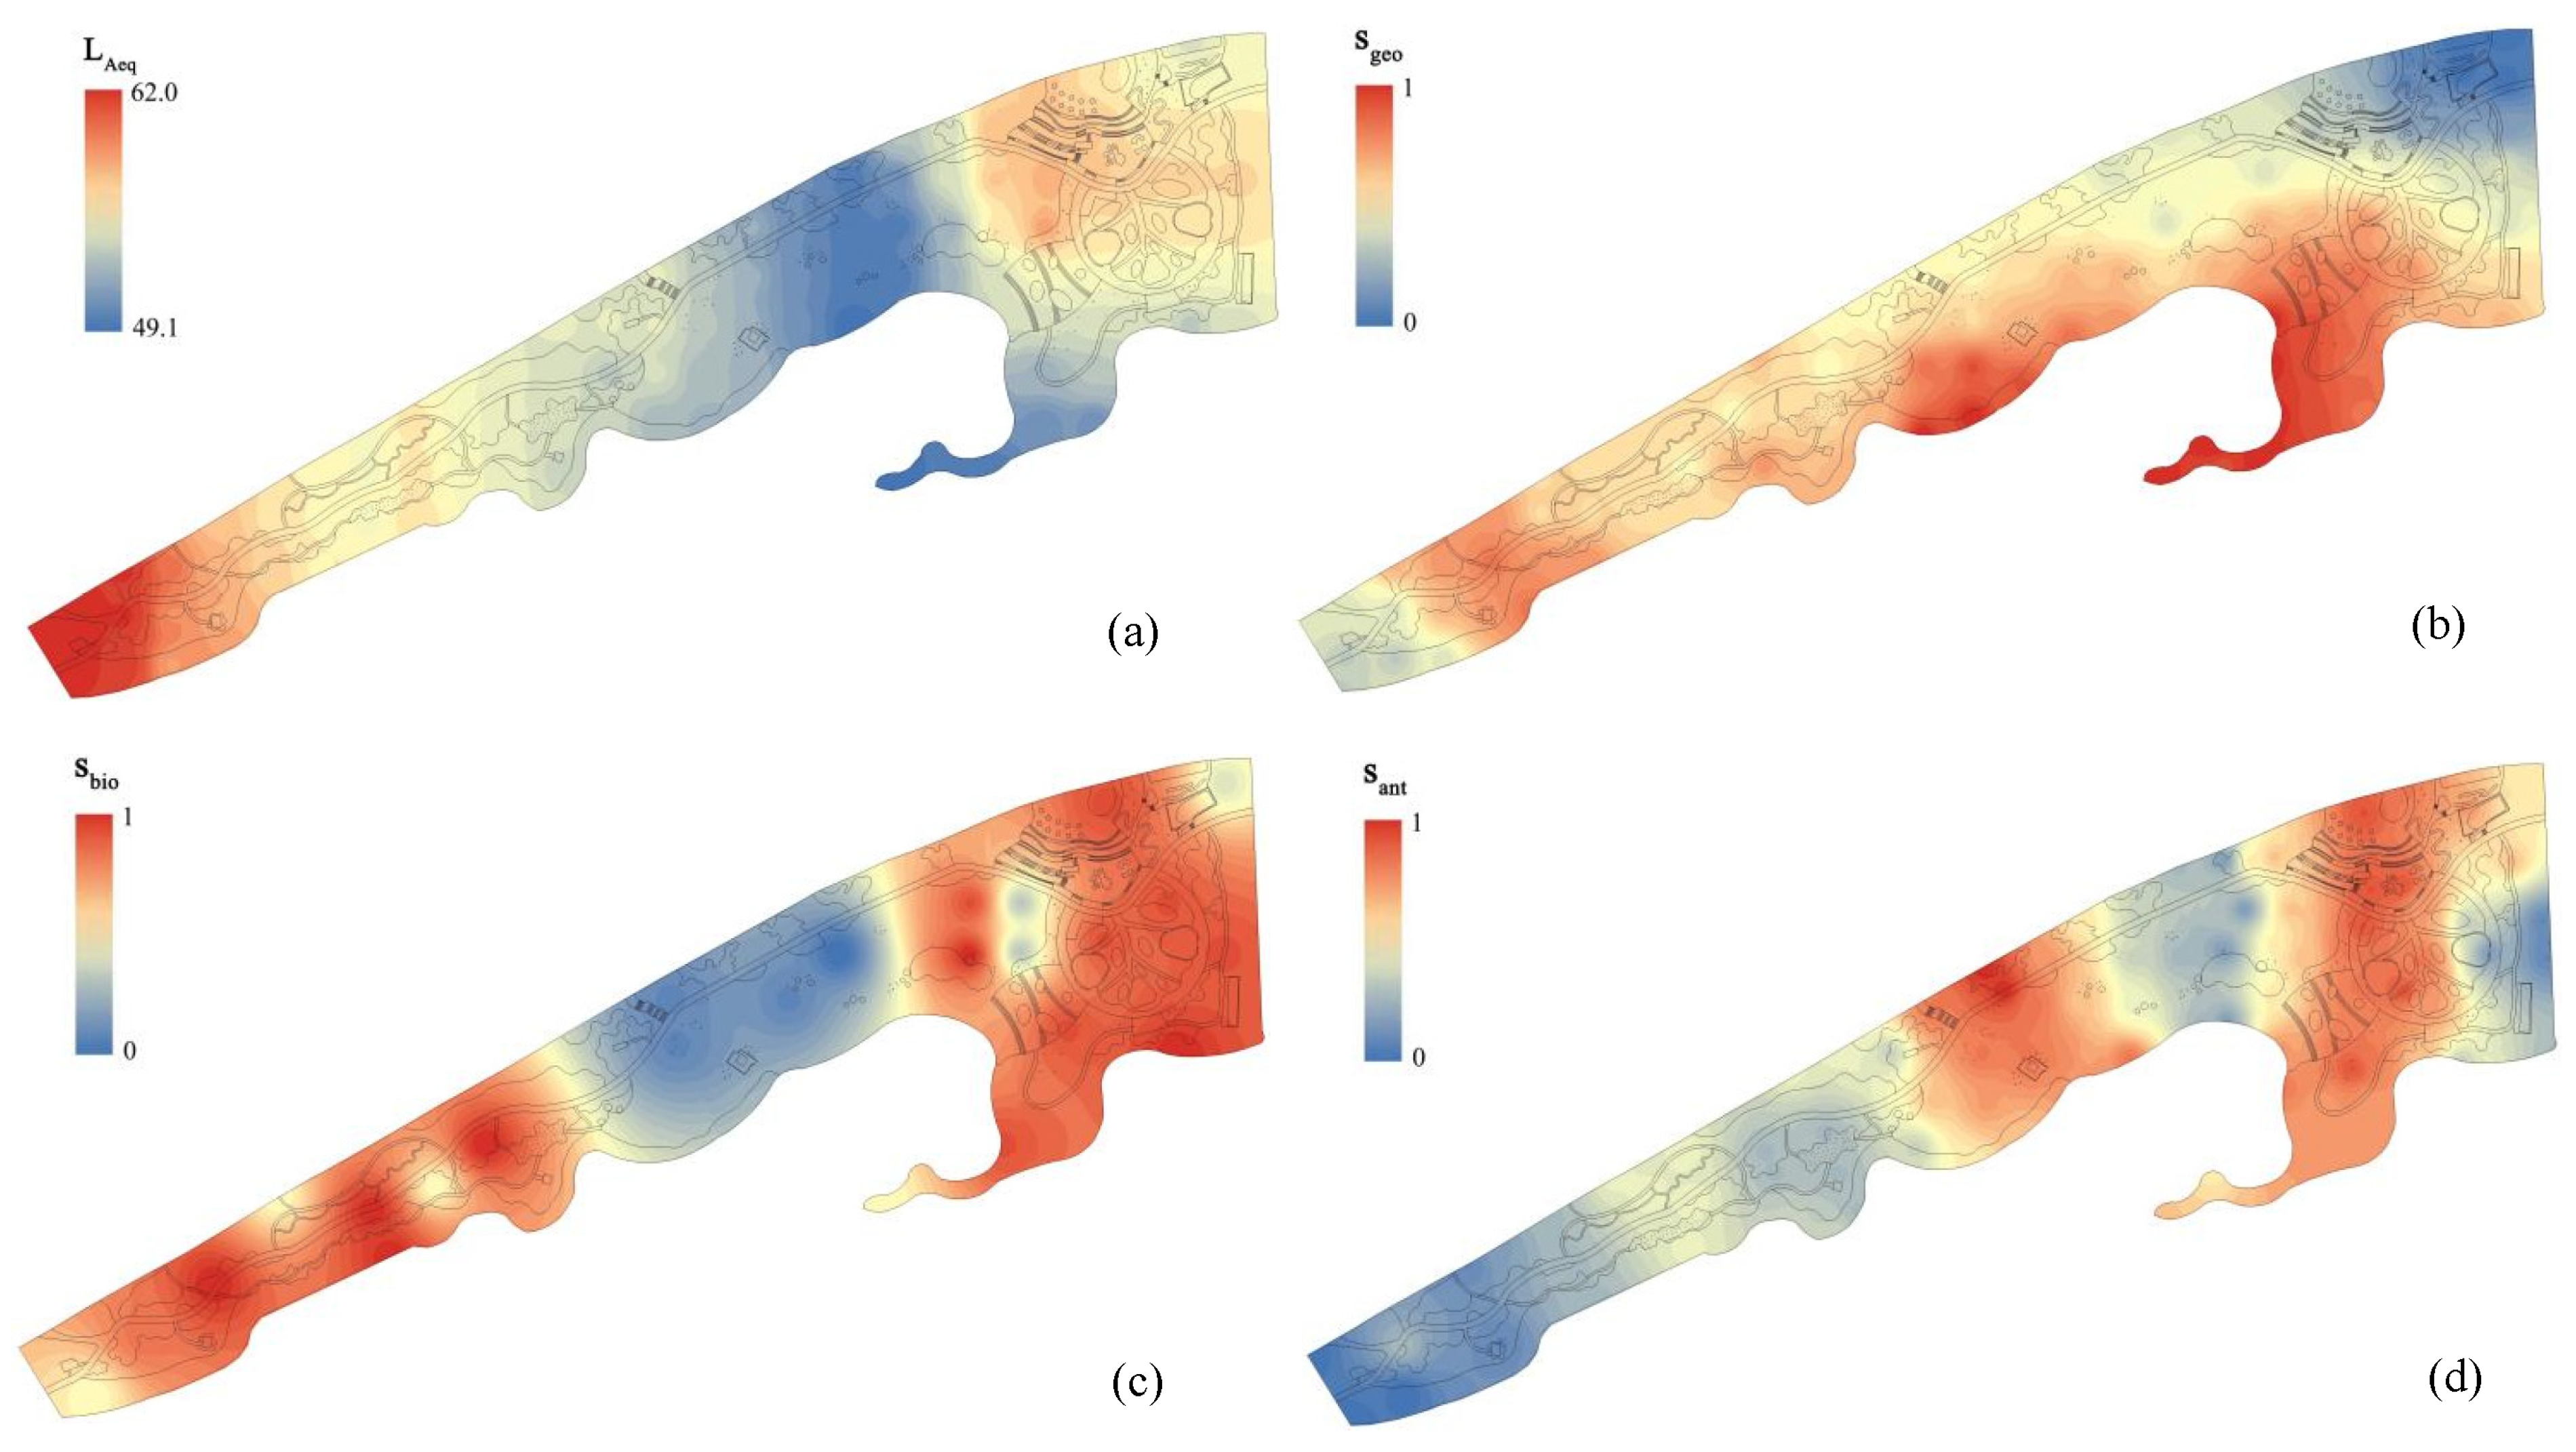
The psychological quantity of geophony, biophony, and anthrophony was distributed in the intervals [2.6, 3.9], [2.3, 3.6], and [1.1, 2.3], respectively. We then conducted a normalization process to transfer the interval to [0, 1]. The process of soundscape mapping was then conducted based on the subjective and objective data of the soundscape (see Figure 6).
Figure 6a shows that high SPL was distributed in the “North entry plaza” and the nearby urban forest space, followed by the “Main entry plaza”, while the beach recreation space presented a relatively low SPL. Figure 6b demonstrates that the positive perception of geophony was mainly distributed to the beach recreation space and urban forest space, which suggested an attention tendency for individuals to water and plant space. As shown in Figure 6c, the positive perception of biophony was mainly distributed to the urban forest space and entrance distribution space, which may be attributed to an attraction towards birds in plants nearby the entrance distribution space and existing plants in the urban forest space. Furthermore, our results showed that the negative perception of anthrophony was mainly distributed to urban forest space, but this distribution trend was opposite for beach recreation space and entrance distribution space (see Figure 6d).
When the results from Figure 5a,b are combined, we can see that, from the low SPL and the positive perception of geophony around the waterfront, the SPL of water soundscapes is relatively low. These combined figures also show that high SPL and the positive perception of geophony are mainly distributed in urban forest space, which suggests that wind energy causes leaves and branches to vibrate and produce strong sound energy. Likewise, when Figure 6a,c are combined, our results show a similar tendency between SPL and perceived biophony, suggesting a balance between the sound environment and biological activities. Additionally, as shown both in Figure 6a,d, there is a negative relationship between SPL and perceived anthrophony in beach recreation spaces, especially around the waterfront, and an opposite tendency in the “Main entry plaza”.

3.3. Optimal Soundscape Interval and Guided Mapping

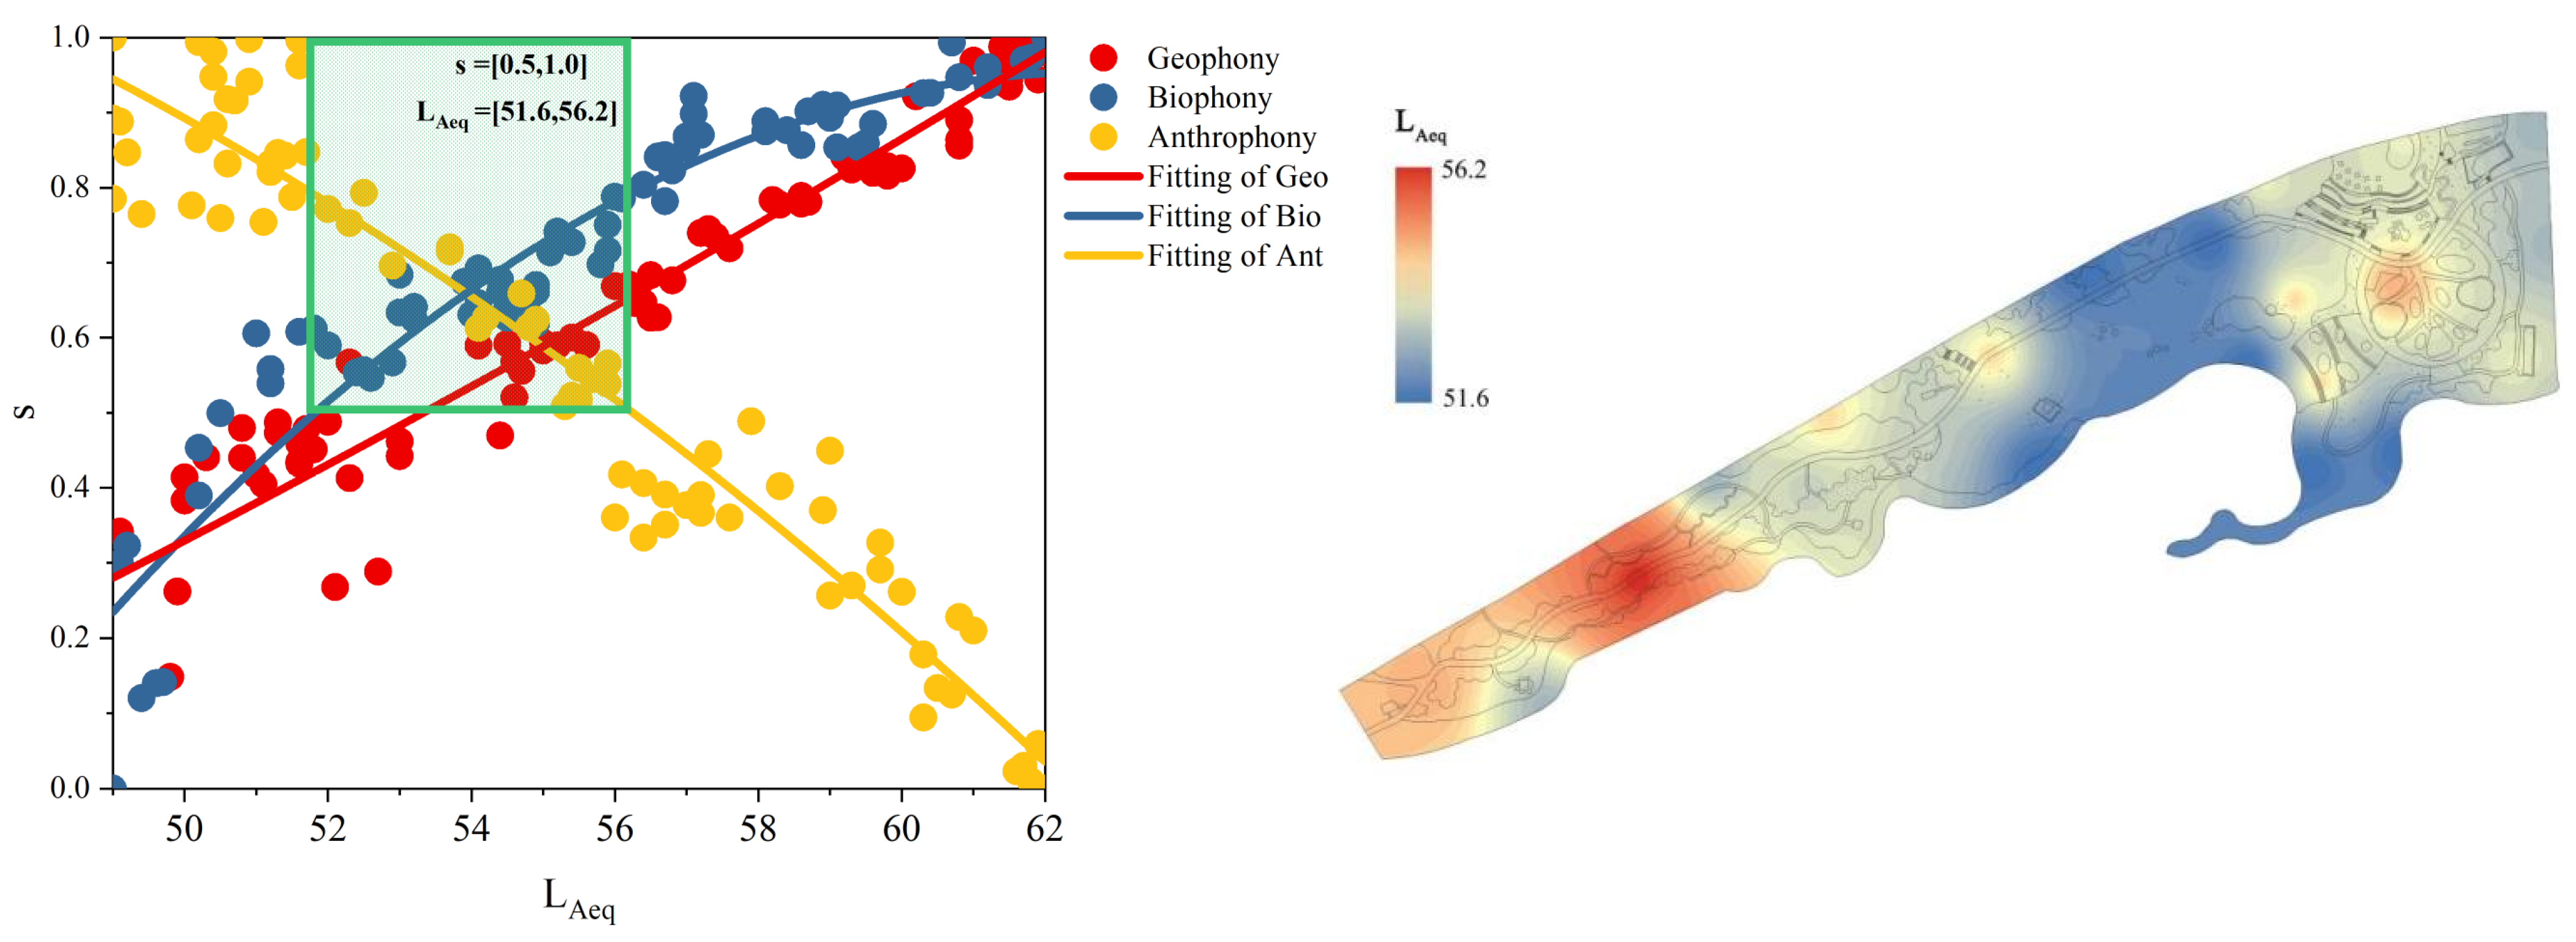
Through quadratic fitting analysis, our results showed a positive relationship between SPL and natural soundscape (geophony and biophony), with R-squared being 0.93 and 0.90, respectively. Likewise, there was a negative relationship between SPL and unnatural soundscape (anthrophony), with R-squared being 0.93. Specifically, most scores of perceived biophony were higher than perceived geophony when SPL was the same.
Furthermore, Figure 7 (left) demonstrates that the target SPL interval of the optimal soundscape was [51.6, 56.2]. When SPL was higher than 51.6 dBA within this interval, the scores of perceived geophony and anthrophony both exceeded 0.5. Similarly, when SPL was higher than 53.2 dBA, perceived biophony exceeded 0.5. Figure 7 (left) also shows that when the SPL exceeded 56.2 dBA, the score of perceived anthrophony would be lower than 0.5, suggesting that this SPL is a critical value in the optimal interval.
Following the goal of obtaining an optimal interval, we maintained, enhanced, and weakened the soundscape by modifying SPL at our observation sites. The modified process included maintaining SPL within the optimal interval, enhancing SPL if the value was lower than 51.6 dBA to the optimal interval, and weakening SPL if the value was higher than 56.2 dBA to the optimal interval. We then conducted soundscape mapping for SPL after the modification process. Figure 7 (right) shows that high SPL was distributed in the “Park service center” and urban forest space, while low SPL was distributed in the beach recreation space.

4. Discussion

4.1. Biological Activities and Natural Phenomena Influencing Diurnal Variation of the Soundscape

Humans tend to engage in recreational activities in natural environments, especially in areas that contain water and plants [31]. These two conditions are simultaneously met in urban forests located by the riverside. Forests are habitats for many creatures, especially birds, which suggests that the biological and human activity cycle may influence the diurnal variation of the soundscape [32].
Our findings showed that various biological and human activities are performed at different time periods (see Figure 4 and Figure 5). Between the period of 6:00 and 9:00, we observed high SPL contributed by the following: a peak in birdsong activity, rush hour traffic, and morning exercises performed by the locals (e.g., Tai Chi, ball games, and running). We found that SPL decreased after 9:00 as several shops in the study area opened, the number of morning exercisers decreased, and rush hour ended. Between noon and late afternoon (12:00–15:00), we observed a gradual decrease in biophony. Then, there was a second birdsong peak at dusk and an increasing number of visitors during this period. Between 18:00 and 21:00, various commercial and human activities (e.g., walks along the river beach, exercises, family activities, etc.) occurred that contributed to a high SPL.
Traffic roads are generally built along rivers in urban areas [33]. This is consistent with our study area, and traffic noises outside our area were perceived at all times during our study. In addition to the traffic noise, the sounds of broadcasts and ringtones, common characteristics of urban parks, often occupy dominant positions in anthrophony [34].
Natural phenomena can influence the diurnal variation of the soundscape. As a ventilation corridor, the Wulong River channel generates periodic winds to urban forests located nearby the riverside, which promotes the soundscape occurrence of leaves rustling and branches swaying [35]. Similarly, the water soundscape can be influenced by tidal phenomena caused by the river. During our survey, the tidal phenomena of the Wulong River included four tide processes: (1) the first low tide occurred from 0:00 to 6:10; (2) the first high tide occurred from 6:11 to 11:20; (3) the second low tide occurred from 11:21 to 18:40; and (4) the second high tide occurred from 18:41 to 23:30. The high and low tides contributed to water soundscapes, which might be difficult to perceive if tidewaters were over a long distance from the riverside. As tide direction is beneficial to conserving the navigational energy of ships, the ships docked at the harbor followed the high tide in and the low tide out [36].

4.2. Relationship of Soundscape Maps between Subjective and Objective Data

Figure 6 shows the complexity mechanism of soundscape maps in urban forests located nearby the riverside, which is different from that of soundscape maps for non-waterfront urban open space [37]. This complexity mechanism was reflected in the tendency toward continuous distribution for perceived geophony. The tendency toward discontinuous distribution for perceived biophony indicates that the effects of land heterogeneity play a role in plant density and biological activities [38]. Our findings suggested that the perception value of anthrophony in urban forests near riversides is higher than that of non-waterfront urban open space, which indicated the optimization effect of water soundscape [39]. Interestingly, there was a high value of perception for all soundscape elements (geophony, biophony, and anthrophony) at the southwest corner of the study area. This area was not only the furthest away from the entrance distribution space with the lowest SPL, but also included both riverside and urban forest elements. Thus, we suggest that it is necessary and important to plan a quiet space with riverside and urban forest elements (see Figure 7, right) through further noise reduction design.
With the exception of biological activities, natural phenomena, and external traffic noise, the number of paths and trails was also a potential driver for soundscape in urban forests by the riverside. There was only one path in the beach recreation space, indicating that open spaces may contribute to sound diffusion at trail paths [40]. The beach recreation space was also less affected by sounds reflected from tree leaves on the ground, as the sand in this area seemed to absorb the sound. Furthermore, birds do not tend to settle on palm trees in beach recreation spaces, calling for consideration of plants that attract birds. The open areas with a presence of non-paths (beach and platform) are the locations where people mainly partake in recreational and commercial activities. Our findings showed that the potential tolerance for anthrophony, which was generated during recreational activities, contributed to a higher value of perceived anthrophony, which suggested a consideration for maintaining the present soundscape.

4.3. Application of the Optimal Soundscape Map

Optimal soundscape intervals and guided mapping contributed to the optimization of the study area. By observing normalized relationships, our findings showed that the psychological value intervals of geophony, biophony, and anthrophony are optimized from [2.6, 3.9], [2.3, 3.6], and [1.1, 2.3], to [3.3, 3.9], [3.0, 3.6], and [1.7, 2.3], respectively. This suggested that the positive perception of geophony and biophony in urban forests near riversides changed after optimization [41]. As there were traffic roads built nearby the study area, there was a limited ability to optimize anthrophony throughout the site, suggesting that we may need to appropriately increase plant density on the outer boundaries of urban forests close to traffic roads to better optimize anthrophony.
We conducted the superposition and subtraction of the two figures when Figure 6a and Figure 7 (right) were combined. Figure 8 shows the result of the SPL correction contributing to optimal practice guidance. This figure suggests that sound environment optimization is unnecessary when in urban forest space, which indicates a consideration for conservation and maintenance. We also suggested that landscape designers optimize the SPL of the north entry plaza and beach recreation space, which indicates considerations for noise reduction and various soundscapes, respectively. Thus, we suggest that contributing government managers and landscape designers should use both the optimal soundscape map and the SPL correction map when proposing suitable design plans. If the optimal goal of the design plans were achieved, we could conduct the application of optimal soundscape maps again, suggesting further optimizing the soundscape in urban forests.
Some limitations may exist in our study. Although we tried to transform optimal soundscape perception into a soundscape map for guidance in urban forests near riversides, the details of external traffic were not considered a key driver of soundscape inside urban forests. Considering the difference in dominant tree species, results may show the soundscape in subtropical cities, but the framework of soundscape optimization is adapted to places where geophony, biophony, and anthrophony are present. Furthermore, diurnal variation of visual and lightscape may potentially influence auditory attention, which suggests a diurnal variation in the sensitivity variation of perceived soundscape.

5. Conclusions

Urban forests located near the sides of rivers are often exposed to the influence of riverside traffic noise from freeways. We found that in terms of diurnal variation of soundscape, biological activities and natural phenomena were potential drivers, especially those from tidal phenomena that contribute to water and shipping soundscape. Soundscape optimization was conducted in Fuzhou Beach Park in Fuzhou, China, which included soundscape normalization, critical value determination, target interval of optimal SPL determination, SPL modification, and mapping. We suggest combining both optimal soundscape and SPL correction maps for sustainable design in urban forests. Cooperative optimization of audio-visual interaction may need to be considered in future studies to further conduct an optimal perception process for multi-sensory experiences.

Author Contributions

Conceptualization, X.-C.H. and S.C.; methodology, X.-C.H.; validation, S.C., J.L. and L.-H.G.; investigation, X.-C.H. and S.C.; resources, J.L.; data curation, J.-B.W.; writing—original draft preparation, X.-C.H.; writing—review and editing, E.D.; supervision, Y.C. All authors have read and agreed to the published version of the manuscript.

Funding

This project was supported by the National Natural Science Foundation of China (52208052, 51838003), the National Key Research and Development Program of China (2019YFD1100405), and the Program of Humanities and Social Science Research Program of the Ministry of Education of China (Grant No. 21YJCZH038).

Data Availability Statement

The original research data has been presented in the figures of article.

Acknowledgments

The authors appreciate the valuable comments of editors and anonymous reviewers. Hao Zhang is acknowledged for useful discussions.

Conflicts of Interest

The authors declare no conflict of interest.

References

  1. Escobedo, F.J.; Kroeger, T.; Wagner, J.E. Urban forests and pollution mitigation: Analyzing ecosystem services and disservices. Environ. Pollut. 2011, 159, 2078–2087. [Google Scholar] [CrossRef] [PubMed]
  2. Santamouris, M. Cooling the cities—A review of reflective and green roof mitigation technologies to fight heat island and improve comfort in urban environments. Sol. Energy 2014, 103, 682–703. [Google Scholar] [CrossRef]
  3. Guo, H.; Li, W.; Yao, F.; Wu, J.; Zhou, X.; Yue, Y.; Yeh, A.G. Who are more exposed to PM 2.5 pollution: A mobile phone data approach. Environ. Int. 2020, 143, 105821. [Google Scholar] [CrossRef] [PubMed]
  4. Qi, J.; Lan, D.; Samsung, L. Planning for cooler cities: A framework to support the selection of urban heat mitigation techniques. J. Clean. Prod. 2020, 275, 122903. [Google Scholar] [CrossRef]
  5. Yang, F.; Yi, B.Z.; Zhu, Z.J. An assessment of psychological noise reduction by landscape plants. Int. J. Environ. Res. Public Health 2011, 8, 1032–1048. [Google Scholar] [CrossRef] [PubMed]
  6. Hong, X.-C.; Wang, G.Y.; Liu, J.; Dang, E. Perceived loudness sensitivity influenced by brightness in urban forests: A comparison when eyes were opened and closed. Forests 2020, 11, 1242. [Google Scholar] [CrossRef]
  7. Hong, X.-C.; Wang, G.; Liu, J.; Song, L.; Wu, E. Modeling the impact of soundscape drivers on perceived birdsongs in urban forests. J. Clean. Prod. 2021, 292, 125315. [Google Scholar] [CrossRef]
  8. Ma, K.W.; Mak, C.M.; Hai, M.W. Effects of environmental sound quality on soundscape preference in a public urban space. Appl. Acoust. 2021, 171, 107570. [Google Scholar] [CrossRef]
  9. Boulos, M.K.; Al-Shorbaji, N.M. On the internet of things, smart cities and the who healthy cities. Int. J. Health Geogr. 2014, 13, 10. [Google Scholar] [CrossRef]
  10. Han, L.; Shi, L.; Yang, F.; Xiang, X.Q.; Gao, L. Method for the evaluation of residents’ perceptions of their community based on landsenses ecology. J. Clean. Prod. 2020, 281, 124048. [Google Scholar]
  11. Magroski, L.M.; Pessoa, A.; Lucena, W.; Loures-Ribeiro, A.; Araújo, C.B.D. Where to release birds seized from illegal traffic? the value of vocal analyses and ecological niche modeling. Perspect. Ecol. Conserv. 2017, 15, 91–101. [Google Scholar] [CrossRef]
  12. Fei, F.; Wang, Y.; Jia, X. Assessment of the mechanisms of summer thermal environment of waterfront space in China’s cold regions. Sustainability 2022, 14, 2512. [Google Scholar] [CrossRef]
  13. Duquette, C.A.; Loss, S.R.; Hovick, T.J. A meta-analysis of the influence of anthropogenic noise on terrestrial wildlife communication strategies. J. Appl. Ecol. 2021, 58, 1112–1121. [Google Scholar] [CrossRef]
  14. Silva-Rodríguez, E.A.; Gálvez, N.; Swan, G.J.F.; Cusack, J.J.; Moreira-Arce, D. Urban wildlife in times of covid-19: What can we infer from carnivore sightings in urban areas? Sci. Total Environ. 2020, 765, 142713. [Google Scholar] [CrossRef] [PubMed]
  15. Nicholas, A.P.; Quine, T.A. Crossing the divide: Representation of channels and processes in reduced-complexity river models at reach and landscape scales. Geomorphology 2007, 90, 318–339. [Google Scholar] [CrossRef]
  16. Wang, M.; Zhang, D.Q.; Su, J.; Dong, J.W.; Tan, S.K. Assessing hydrological effects and performance of low impact development practices based on future scenarios modeling. J. Clean. Prod. 2018, 179, 12–23. [Google Scholar] [CrossRef]
  17. Sarnat, J.A.; Golan, R.; Greenwald, R.; Raysoni, A.U.; Kewada, P.; Winquist, A.; Sarnat, S.E.; Flanders, W.D.; Mirabelli, M.C.; Zora, J.E.; et al. Exposure to traffic pollution, acute inflammation and autonomic response in a panel of car commuters. Environ. Res. 2014, 133, 66–76. [Google Scholar] [CrossRef]
  18. Qi, J.; Lin, E.S.; Tan, P.Y.; Ho, R.C.; Sia, A.; Olszewska-Guizzo, A.; Zhang, X.; Waykool, R. Development and application of 3D spatial metrics using point clouds for landscape visual quality assessment. Landsc. Urban Plan. 2022, 228, 104585. [Google Scholar] [CrossRef]
  19. Wang, M.; Liu, M.; Zhang, D.; Qi, J.; Fu, W.; Zhang, Y.; Rao, Q.; Bakhshipour, A.E.; Tan, S.K. Assessing and optimizing the hydrological performance of Grey-Green infrastructure systems in response to climate change and non-stationary time series. Water Res. 2023, 232, 119720. [Google Scholar] [CrossRef]
  20. Qi, J.; Lan, D.; Samsung, L. Application of a decision-making framework for multi-objective optimisation of urban heat mitigation strategies. Urban Clim. 2023, 47, 101372. [Google Scholar] [CrossRef]
  21. Grunst, M.L.; Grunst, A.S.; Pinxten, R.; Eens, M. Little parental response to anthropogenic noise in an urban songbird, but evidence for individual differences in sensitivity. Sci. Total Environ. 2021, 769, 144554. [Google Scholar] [CrossRef] [PubMed]
  22. Chi, C.F.; Dewi, R.S.; Huang, M.H. Psychophysical evaluation of auditory signals in passenger vehicles. Appl. Ergon. 2017, 59, 153–164. [Google Scholar] [CrossRef] [PubMed]
  23. Hong, J.Y.; Lam, B.; Ong, Z.T.; Ooi, K.; Tan, S.T. A mixed-reality approach to soundscape assessment of outdoor urban environments augmented with natural sounds. Build. Environ. 2021, 194, 107688. [Google Scholar] [CrossRef]
  24. Kang, J. From dBA to soundscape indices: Managing our sound environment. Front. Eng. Manag. 2017, 4, 184–192. [Google Scholar] [CrossRef]
  25. Krause, B. Anatomy of the soundscape: Evolving perspectives. J. Audio Eng. Soc. Audio Eng. Soc. 2008, 56, 73–80. [Google Scholar]
  26. Pijanowski, B.C.; Farina, A.; Gage, S.H.; Dumyahn, S.L.; Krause, B.L. What is soundscape ecology? An introduction and overview of an emerging new science. Landsc. Ecol. 2011, 26, 1213–1232. [Google Scholar] [CrossRef]
  27. ISO/TS 12913-2:2018; Acoustics—Soundscape—Part 2: Data Collection and Reporting Requirements. ISO (International Organization for Standardization): Geneva, Switzerland, 2018.
  28. ISO/TS 12913-1:2014; Acoustics—Soundscape—Part 1: Definition and Conceptual Framework. ISO (International Organization for Standardization): Geneva, Switzerland, 2014.
  29. Manzano, J.V.; Almagro, J.; Quesada, R.G. The importance of changing urban scenery in the assessment of citizens’ soundscape perception. on the need for different time-related points of view. Noise Mapp. 2021, 8, 138–161. [Google Scholar] [CrossRef]
  30. Kogan, P.; Arenas, J.P.; Bermejo, F.; Hinalaf, M.; Turra, B. A green soundscape index (GSI): The potential of assessing the perceived balance between natural sound and traffic noise. Sci. Total Environ. 2018, 642, 463–472. [Google Scholar] [CrossRef]
  31. Jiang, B.; Xu, W.; Ji, W.; Kim, G.; Pryor, M.; Sullivan, W.C. Impacts of nature and builtacoustic-visual environments on human’s multidimensional mood states: Across-continent experiment. J. Environ. Psychol. 2021, 77, 101659. [Google Scholar] [CrossRef]
  32. Hong, X.-C.; Liu, J.; Wang, G.Y.; Jiang, Y.; Wu, S.T.; Lan, S.R. Factors influencing the harmonious degree of soundscapes in urban forests: A comparison of broad-leaved and coniferous forests. Urban For. Urban Green. 2019, 39, 18–25. [Google Scholar] [CrossRef]
  33. Clair, C. Comparative permeability of roads, rivers, and meadows to songbirds in banff national park. Conserv. Biol. 2010, 17, 1151–1160. [Google Scholar] [CrossRef]
  34. Jeon, J.Y.; Lee, P.J.; You, J.; Kang, J. Acoustical characteristics of water sounds for soundscape enhancement in urban open spaces. J. Acoust. Soc. Am. 2012, 131, 2101. [Google Scholar] [CrossRef] [PubMed]
  35. Hong, X.-C.; Zhu, Z.P.; Liu, J.; Geng, D.H.; Lan, S.R. Perceived occurrences of soundscape influencing pleasantness in urban forests: A comparison of broad-leaved and coniferous forests. Sustainability 2019, 11, 4789. [Google Scholar] [CrossRef]
  36. Pei, Y.L.; Chen, D.J. Study on the optimal dispatching algorithm of ships in and out of tidal two-way channel. In Proceedings of the IEEE 4th Information Technology and Mechatronics Engineering Conference (ITOEC), Chongqing, China, 14–16 December 2018; pp. 324–329. [Google Scholar]
  37. Lavandier, C.; Aumond, P.; Gomez, S.; Dominguès, C. Urban soundscape maps modelled with geo-referenced data. Noise Mapp. 2016, 3, 278–294. [Google Scholar] [CrossRef]
  38. Linke, J.; Franklin, S.E.; Hall-Beyer, M.; Stenhouse, G.B. Effects of cutline density and land-cover heterogeneity on landscape metrics in western alberta. Can. J. Remote Sens. 2008, 34, 390–404. [Google Scholar] [CrossRef]
  39. Hong, J.Y.; Jeon, J.Y. Relationship between spatiotemporal variability of soundscape and urban morphology in a multifunctional urban area: A case study in seoul, korea. Build. Environ. 2017, 126, 386–395. [Google Scholar] [CrossRef]
  40. Guillaume, G.; Picaut, J.; Dutilleux, G. Use of the transmission line matrix method for the sound propagation modelling in open-space. J. Acoust. Soc. Am. 2021, 123, 3924. [Google Scholar] [CrossRef]
  41. Hong, X.-C.; Liu, J.; Wang, G.-Y. Soundscape in Urban Forests. Forests 2022, 13, 2056. [Google Scholar] [CrossRef]
Figure 1. The location of the study area in Fuzhou.
Land 12 01929 g001
Figure 2. Aerial photo of Fuzhou Beach Park (top) and functional areas (bottom).
Land 12 01929 g002
Figure 3. The framework of soundscape optimization.
Land 12 01929 g003
Figure 4. Composition of the soundscape at different time periods.
Land 12 01929 g004
Figure 5. The SPL of entrance distribution space (a), urban forest space (b), and beach recreation space (c) at different time periods.
Land 12 01929 g005
Figure 6. The soundscape maps of SPL (a), geophony (b), biophony (c), and anthrophony (d).
Land 12 01929 g006
Figure 7. Optimal soundscape interval (left) and guided soundscape map (right).
Land 12 01929 g007
Figure 8. SPL Correction of soundscape map.
Land 12 01929 g008
Disclaimer/Publisher’s Note: The statements, opinions and data contained in all publications are solely those of the individual author(s) and contributor(s) and not of MDPI and/or the editor(s). MDPI and/or the editor(s) disclaim responsibility for any injury to people or property resulting from any ideas, methods, instructions or products referred to in the content.