Article

Impervious Land Expansion as a Control Parameter for Climate-Resilient Planning on the Mediterranean Coast: Evidence from Greece

by
Apostolos Lagarias
Department of Planning and Regional Development, School of Engineering, University of Thessaly, 38334 Volos, Greece
Land 2023, 12(10), 1844; https://doi.org/10.3390/land12101844
Submission received: 8 September 2023 / Revised: 21 September 2023 / Accepted: 25 September 2023 / Published: 27 September 2023

Abstract

:
Impervious land expansion is linked to ecosystem fragmentation and degradation, posing threats to nature conservation and multiplying climate change impacts. This is particularly true on the Mediterranean coast, where persistent urbanization is coupled with tourism development, further intensifying coastal erosion, flood risk, heat stress and biodiversity loss, while decreasing carbon sequestration. In this research, high-resolution imperviousness data were analyzed through a geospatial methodology to detect patterns and processes in a heavily burdened Mediterranean coastal area, namely Greece. The methodology was structured on a set of GIS tools, analyzing the distribution of new impervious cover between 2006 and 2018, to evaluate pressures exerted on coastal territories and on the environmental protection network. The results revealed relatively slow rates of impervious land expansion at a nationwide scale, mostly attributed to the economic recession period in Greece. However, certain locations exhibited continuing artificialization of land even within Natura 2000 areas, while future pressures on coastal territories are expected to increase due to the restarting of construction activity and the continuing dynamic of the mass tourism sector. The conclusions imply that controlling for imperviousness is important in order to develop spatial planning policies for climate resilience, which should be decisively enforced in the Mediterranean to prevent a business-as-usual scenario.

1. Introduction

Based on current projections and estimations, coastal European areas will be confronted with important threats and environmental challenges up to 2050, emanating from land use changes [1] related to urbanization, tourism development, and agricultural intensification. Due to intense land take, ecosystems and biodiversity will be heavily affected [2] by deforestation, ecosystem fragmentation and degradation [3], with a loss of open habitats, natural vegetation, and agricultural land [2]. Simultaneously, higher built-up pressure can be related to overexploitation of natural resources [1]; air, water, and land pollution; increasing vulnerability to coastal erosion [4]; and coastal inundation.
These threats are expected to further worsen due to climate change (CC) impacts [5], with highly urbanized coastal areas usually coinciding with high-risk prone areas due to significant population and infrastructure concentration in relation to hazard-amplifying conditions [2]. Simultaneously, increased artificialization of land is limiting the amount of carbon sinks and the ability of natural ecosystems to capture carbon dioxide; it is also related to increased water demand and a loss of fertile soils due to poor land management [6,7]. This is in line with IPCC directives [8], where controlling urban sprawl is considered a major element of climate change adaptation and a sustainable use of land.
The present paper handles key research questions regarding urban encroachment in coastal areas, setting a target of exploring a characteristic case study from the Mediterranean context and providing links between the analysis of impervious land expansion and climate change adaptation. In the EU-Mediterranean region, intense land use exploitation in coastal areas is currently reported [9], heavily transforming the traditional Mediterranean landscape and its spatial and ecological structure. Generally, it is accepted that in the coastal Mediterranean zone, complex ecological and resource systems (in both the marine and land seashore parts) coexist and interact with human communities and relevant socioeconomic activities [10].
However, the restructuring of historically compactly built cities towards more dispersed periurban patterns [11,12] was further intensified by tourism and second housing developments in coastal zones [13,14,15], with the Mediterranean region being characterized as an exemplary case of a heavily burdened territory due to incoming tourist flows [16,17]. As a result, the dominant tourism development model unfolds as a land- and resource-intensive activity, taking up space along the coastline to support a growing demand for facilities and related infrastructure, posing pressure on natural resources, coastal communities, and ecosystems. Moreover, due to long-term deficiencies in spatial planning, urbanization in coastal Mediterranean areas is also linked to low-density/dispersed patterns, with increasing CO2 emissions and energy demands, under a car-dependent model of mobility that is prevailing in exurban and island areas [18].
Characteristic hotspots of coastal urban development related to mass tourism are identified on the Adriatic coast of Italy [19], on the Cote d’Azur in France [20], in Costa Blanca and Costal del Sol along the Spanish Mediterranean coast [21,22,23,24], in island states like Malta [25] and Cyprus [26], and also in emerging tourism destinations along the Dalmatian coast [27,28]. In Greece, signs of overtourism have already been identified [29,30,31,32], especially affecting highly reputable destinations like the South Aegean islands, Ionian Islands, and Crete, while intense coastalization is also affecting mainland coastal areas like Chalkidiki and Pieria in the Central Macedonia region, Attica, and certain parts of the Peloponnese [33], among other areas. This model of coastal urban development usually coincides with areas of unique ecological value [34,35], and is related to a long-term tradition of a largely unplanned or poorly regulated characteristic of settlement expansion [11], illegal construction [36,37], and an insufficient implementation of environmental protection policies, prioritizing economic profit over sustainability concerns while generating local and regional environmental conflicts [38].
The dramatic impact of these processes in coastal areas and ecosystems has been largely reported in the literature [39,40,41,42], while it is estimated that in certain parts of the coastline zone, and more notably in island territories, carrying capacity thresholds have already been reached [32,43]. At the same time, according to current scenarios, the Mediterranean Basin is a CC “hotspot” region with an increased number of multiple climatic hazards, including coastal flooding, heat extremes and fire risk, the frequency and severity of meteorological droughts, a decrease in precipitation and river flow, and increasing water demand for agriculture [44]. Overall, it is assessed that the Mediterranean coastal region currently lies at a critical standpoint, undergoing intensive socioeconomic and environmental changes [45], which, coupled with climate change risks and vulnerabilities, could result in further environmental degradation and threats to sustainability achievements [46].
This comes at a time where the EU seems determined to put forward more strict and concrete policies for nature preservation and protection and no-net-land-take policies [47,48], such as those included in the Biodiversity Strategy for 2030 [7] as a core part of the European Green Deal and the new Nature Restoration Law [49]. Coastal ecosystems in particular are considered a major asset to combat climate change, providing benefits including storm surge mitigation, protection against coastal erosion and floods, water filtration, and drought protection, while also acting as carbon sinks and carbon storage systems. To this end, strategies regarding climate resilience are marked by a considerable turn towards nature-based solutions (NbSs), providing links and synergies between CC adaptation and biodiversity [50].
Impervious land expansion is defined as the covering of the soil surface with impermeable materials (i.e., any surface which water cannot infiltrate) because of urban development and infrastructure construction, resulting in the substitution of the original natural/agricultural land cover or water surface with an artificial one [51]. According to the literature, the amount of impervious surface in a landscape is an important indicator [52] directly related to land take [47] and to the presence of residential, commercial, industrial complexes including paved ways, roads [53], while the analysis and mapping of impervious surface area is essential for improving urban environmental quality toward ecological, livable, and sustainable goals [54]. Researchers like Torbick and Corbiere [55], Zhou and Wang [56], Xian et al. [57], Ghazaryan et al. [58], and Li et al. [59], among others, have used imperviousness data to evaluate urbanization processes, while, specifically in the Mediterranean, relevant recent research includes the study of urbanization and periurbanization processes [60,61,62,63], built-up pattern analysis [15,64], polycentricity [65], and landscape conservation [66]. Imperviousness is directly related to a set of climate change impacts [67,68,69], changing microclimate conditions [70] and determining the strength of the urban heat island effect, while the sealing of the surface diminishes rainwater infiltration, reduces aquifer recharge [71], and increases water runoff [53] and subsequent soil erosion and flood risk [44].
In respect to vulnerability related to climate change, imperviousness can be regarded as a better control parameter than built-up density. This is because not only buildings, but also related structures and paved surfaces (like parking lots, pool areas, canopy roofs, sealed parts of sport and recreation areas, etc.), have an environmental impact, altering the use of land as well as climatic behavior at the local level. Therefore, these structures should be co-estimated in the assessment of pressures exerted on natural, seminatural, and agricultural areas and ecosystems; this is also the case for road structures that have been linked with ecosystem fragmentation and habitat loss, even beyond their immediate physical footprint, especially when they penetrate natural ecosystems or wilderness areas [72].
Based on the above remarks, we can deduce that the analysis and monitoring of impervious land expansion can be a crucial control parameter, supporting climate-resilient strategies for Mediterranean coastal zones at the national, regional, and local levels. This is line with the European Environmental Agency, which states that reducing imperviousness is an important factor for climate-resilient planning and is regarded as a “green” adaptation tool [44], while also supporting EE initiatives for green infrastructure and resource efficiency [73,74]. Our research hypothesis is that the continuing expansion of impervious land is exacerbating CC-related pressures on coastal territories. Towards this direction, specific methodologies and research studies are still needed, especially in the field of integrating a spatial analysis and spatial planning perspective into climate resilience issues. This appears to be crucial in the Mediterranean context, and more specifically, in Greece. Greece can be regarded as a representative example in light of this research due to (a) the significance of its extensive coastline zone including 6000 islands and islets, (b) the fact that coastal zones (both land and marine ones) contain a dense network of ecosystems particularly vulnerable to environmental and climatic pressures, and (c) the fact that climate change adaptation is still in its infancy in the Greek context, especially in the field of land use planning and environmental protection; this is related to severe problems in coping with increasing challenges and vulnerabilities related to the built environment in the coastal zone.
Imperviousness is not yet incorporated as a control parameter in national and regional CC adaptation plans, while consistent relevant studies taking advantage of high-resolution spatial data are still sparse. To fill this gap, a GIS-enabled methodology was adopted, combining imperviousness data from the imperviousness density high-resolution layer, as provided by the Copernicus Land Monitoring Service, with spatial information related to the network of protected areas, according to three subsequent zones near the coast: the frontline zone, buffer zone, and transitional zone. The research aim is to provide a full-scale assessment of new impervious cover in the period 2006–2018 (i.e., the time period of imperviousness data availability), downscaling results to the regional and local levels and providing considerable inputs for planners and decision makers regarding climate resilience.
This is particularly important as, currently, the country is emerging from the long-term economic crisis of the 2009–2018 period, which was followed by the COVID-19 pandemic. Our main hypothesis is that after a slowdown in impervious land expansion during the years of the economic recession, a “rebound” must be expected, especially in coastal locations, depending on large-scale investments in the tourism industry in combination with emerging spatial and developmental practices and policies in Greece. Therefore, the spatial analysis’s results are discussed in light of the general context regarding the spatial and developmental repercussions of the crisis period in Greece and their impact on coastal territories; this is a crucial viewpoint in order to properly assess the current “state of the play” and to provide insights on future environmental pressures regarding coastal territories.
The structure of the paper contains five sections. Section 2 describes the methodology and data, including a brief presentation of the case study area and expected climate change impacts. Section 3 presents the results regarding the estimation and evaluation of impervious land expansion in the coastal zones at a regional and local level, while Section 4 puts forward a discussion relating the major research findings and results to the general context of the economic crisis period and its spatial and developmental repercussions. Finally, Section 5 highlights the conclusions and pathways for future research towards climate-resilient planning in the coastal region.

2. Materials and Methods

2.1. Data and Methodological Considerations

Methodological issues regarding land use analysis in coastal zones can be important, as the magnitude of changes related to urban expansion, as well the distributional characteristics of the built-up patterns (e.g., compact, dispersed forms of development), are largely dependent on the accuracy of the data used. Despite the current availability of high-resolution data, many works regarding land use analysis within coastal zones are still largely dependent on Corine Land Cover (CLC) data [1,21,75], where a minimum mapping unit (MMU) of 25 hectares (ha) for areal phenomena and a minimum width of 100 m for linear phenomena are used. However, using such a crude-resolution landcover zoning approach can lead to a significant underestimation or overestimation of urban development, depending on the pattern and geometry of development (i.e., compact/dispersed). This is important as information regarding impervious areas might be “lost”, especially in exurban areas. Specifically, CLC data cannot capture a large portion of low-density built-up areas scattered within zones identified as agricultural seminatural/natural areas or wetlands. Moreover, the 25 ha MMU and the condition that only changes when ≥5 ha is mapped impede a sound comparison of changes between different versions of CLC [18].
To handle this problem, the EEA has recently released new sets of data (https://land.copernicus.eu/en/products accessed on 24 September 2023) focusing on different hotspots, i.e., areas that are prone to specific environmental challenges, with a spatial resolution equivalent to the one of Urban Atlas (MMU 0.25–1 ha). These databases include a subset of the Natura 2000 Network, Riparian Zones, and a database specifically targeted to the coastal zone covering a 10 km wide buffer zone from the coastline (https://land.copernicus.eu/local/coastal-zones accessed on 24 September 2023). However, the above-mentioned Coastal Zones database is not yet validated, and relevant data have not yet been incorporated in applied research. High-resolution national land cover databases have been developed in several Mediterranean countries, such as the ISPRA database (Institute for Environmental Protection and Research) in Rome, Italy, the BD TOPO®/RGE Geodatabase in France [3], and SIOSE2005 and HR SIOSE2017 in Spain [76]. However, national data are not comparable across different Mediterranean countries; this fact hampers a harmonized analysis of the EU-Mediterranean zone, which is an important issue in order to handle inter-regional environmental problems and better co-ordinate relevant policies.
In Greece, the classification of multitemporal satellite images has been extensively used by individual studies to obtain high-resolution data regarding impervious areas [77], while in other cases, researchers have depended on the manual processing and digitization of satellite images or orthophotograph interpretation [78], a process that can be time-consuming. Moreover, land use analysis, as specified in the official technical specifications of urban planning and regional planning studies in Greece [79,80], still largely depends on aggregated Corine data, while the same holds for recently accomplished Regional Adaptation Action Plans (RAAPs) and the currently developed Special Environmental Studies (SEP) for the Natura 2000 network, this posing severe constraints in accurately monitoring and evaluating urban patterns to support planning decisions.

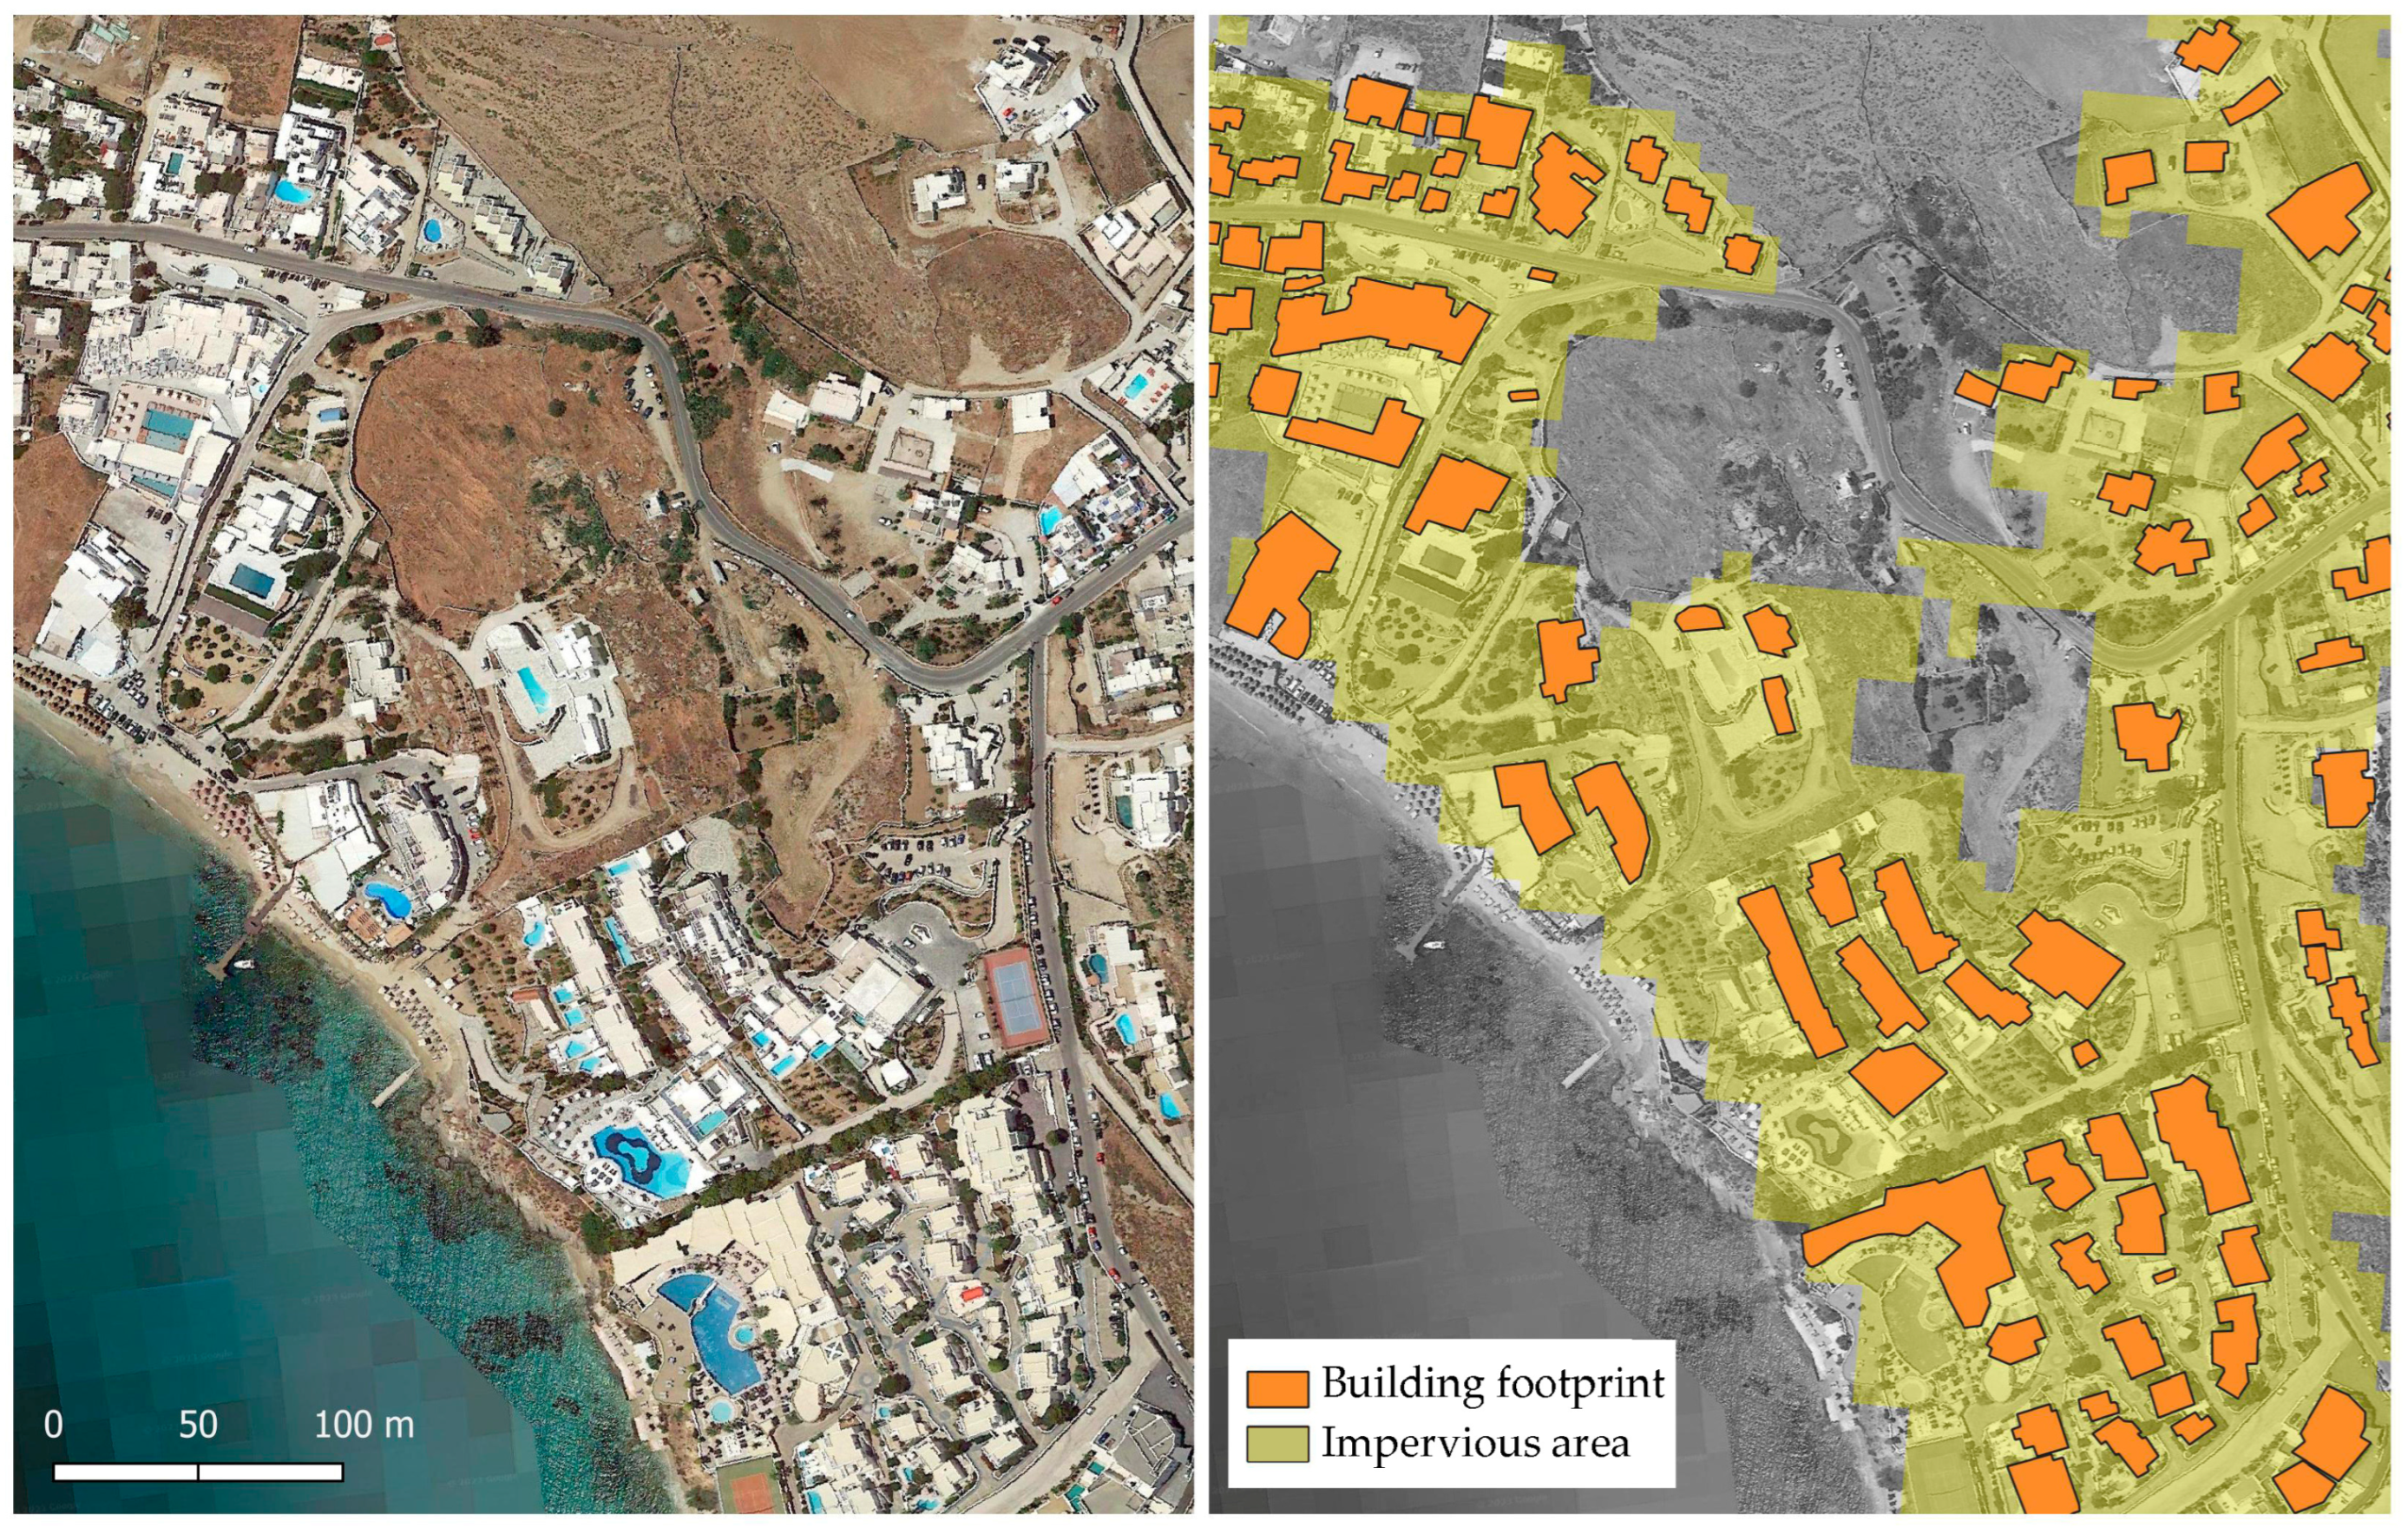
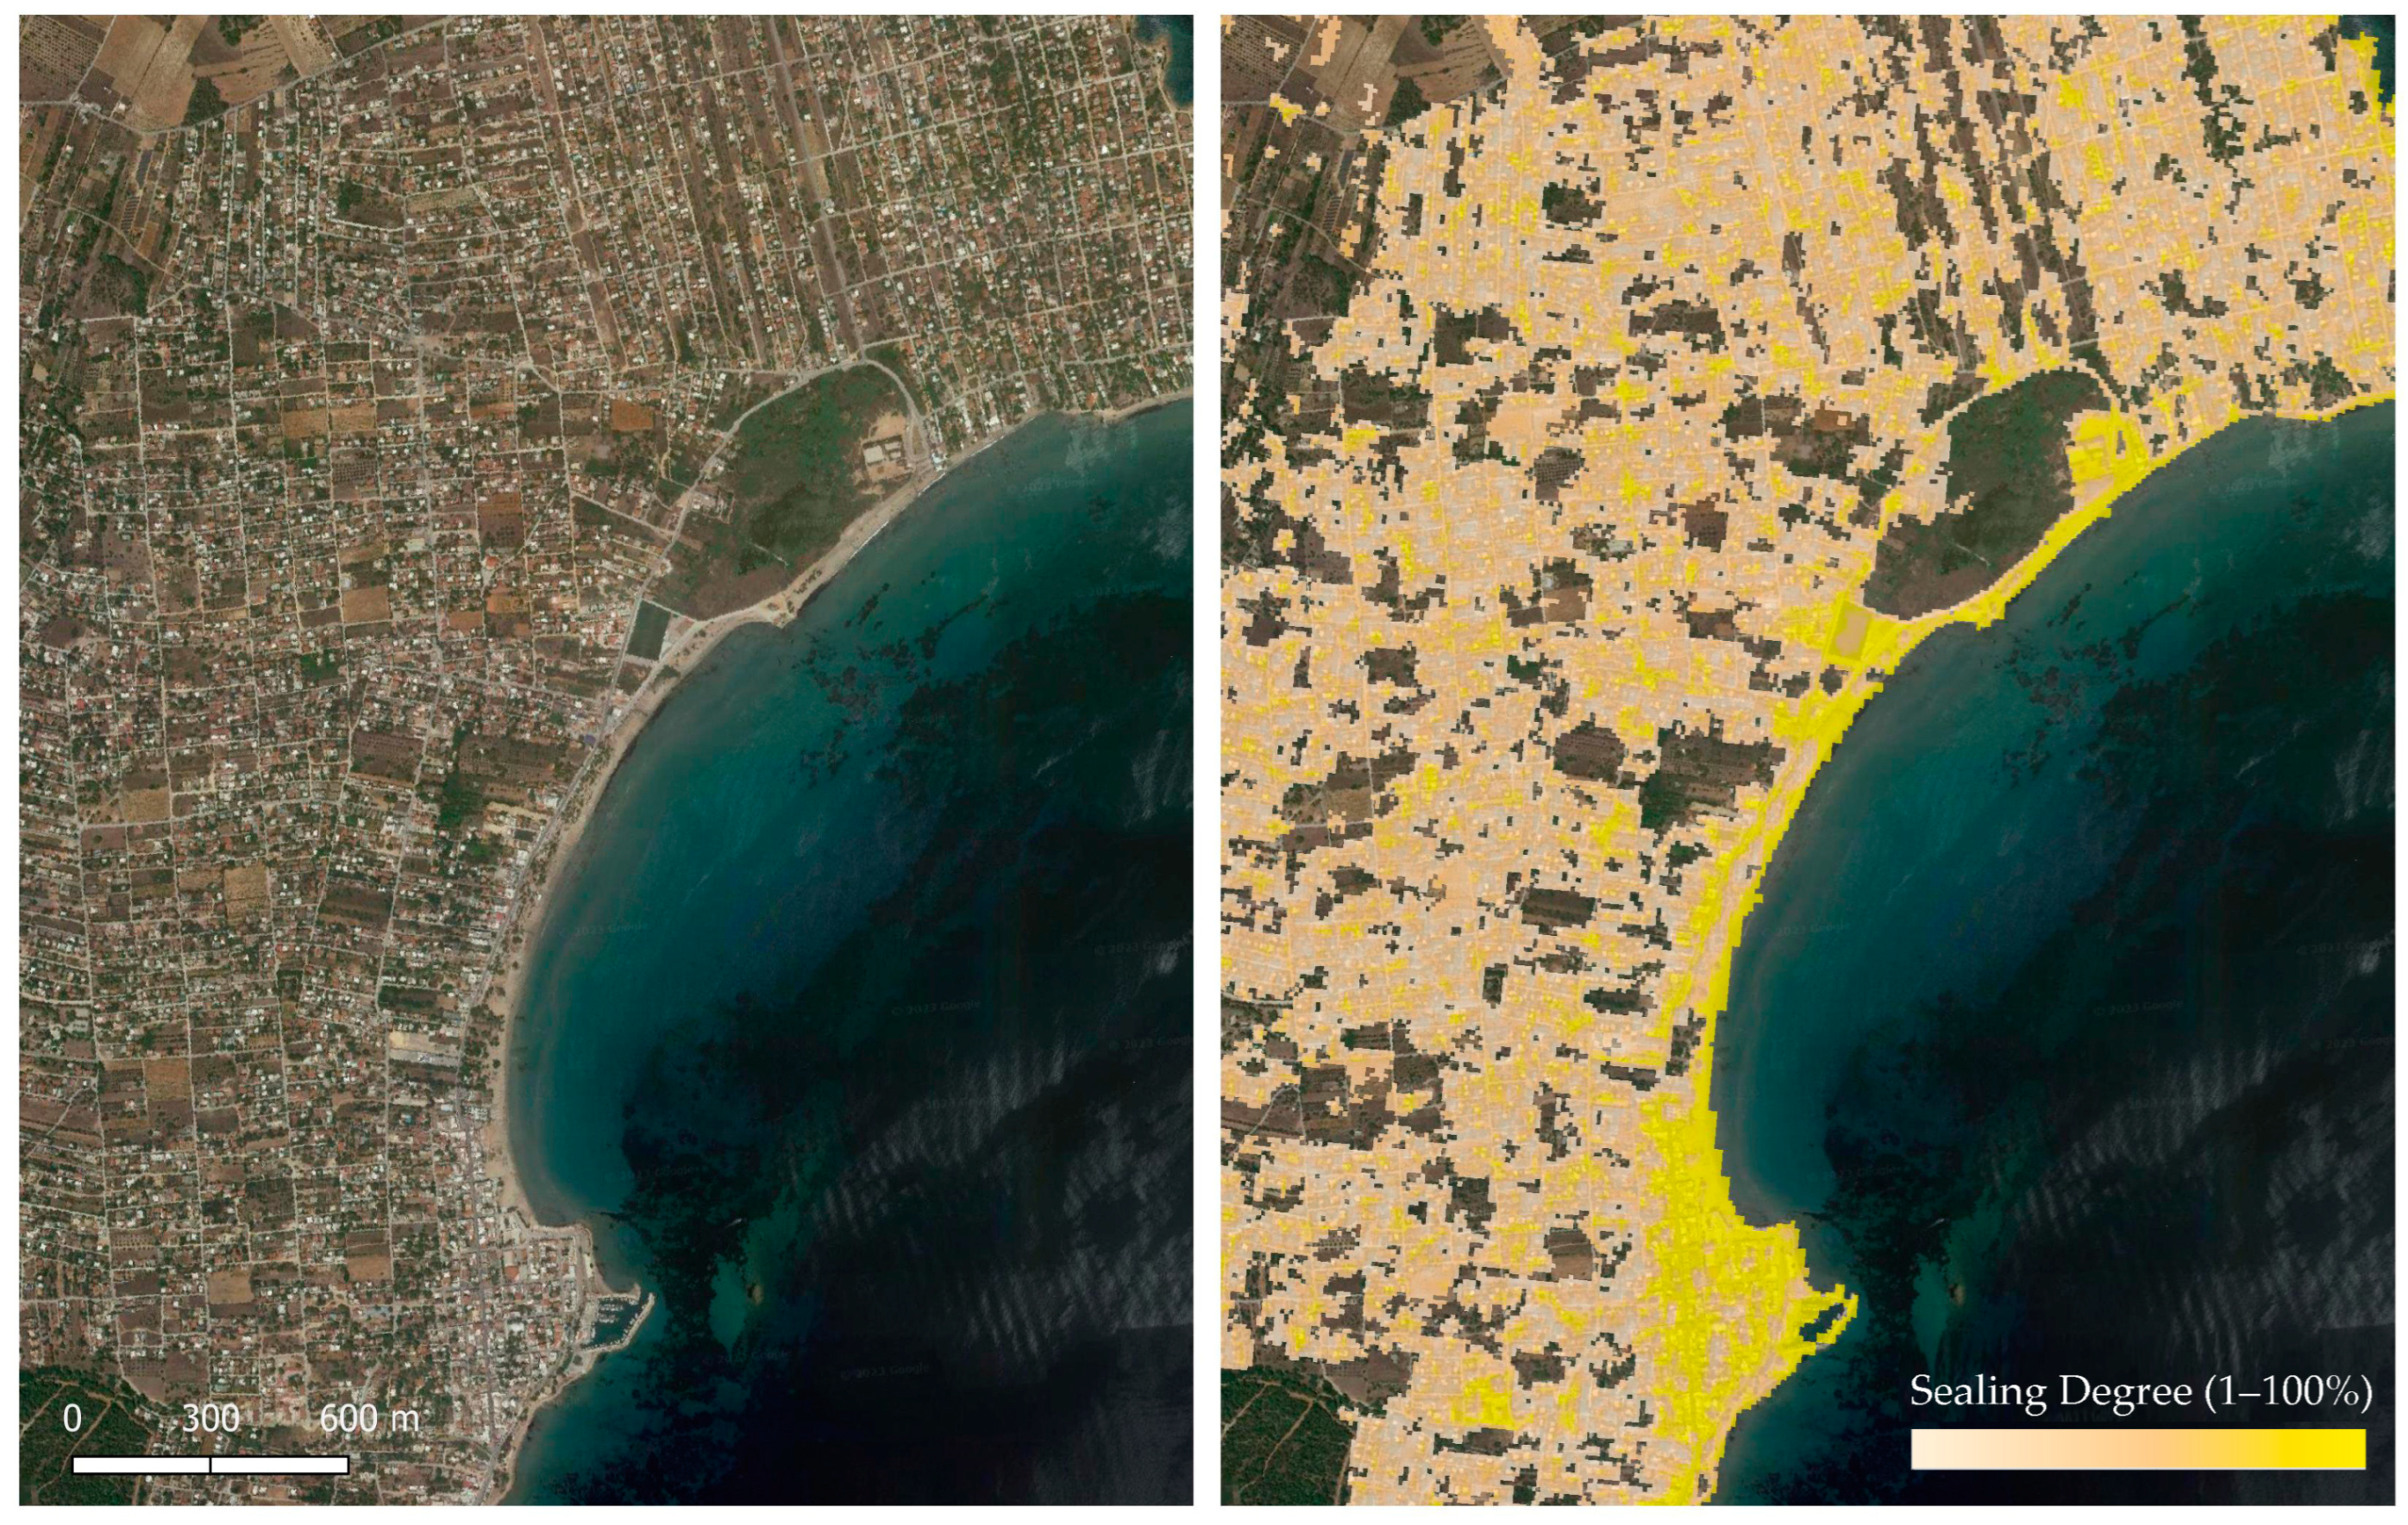
2.2. The Imperviousness High-Resolution Dataset

The imperviousness dataset (IMP) is part of the Copernicus High-Resolution Layers, provided on a pan-European scale and based on the processing of satellite data obtained from the Copernicus Sentinel-1 and Sentinel-2 sensors, considering spatially detailed Google Earth imagery as a supplementary data source for validation [81]. These layers include specific land use/land cover products, such as on impervious surfaces, forests, grasslands, water bodies, woody features, and wetness conditions [82]. The IMP dataset captures the spatial distribution of artificially sealed areas. Sealed pixels are classified based on the level of soil sealing (imperviousness (or sealing) degree, IMD), produced using a semiautomated classification based on calibrated NDVI (Normalized Difference Vegetation Index). Non-sealed areas are characterized by a value of IMD = 0%, while built-up areas are characterized by IMD values in the range of 1–100%.
According to the technical specifications of the dataset [83], impervious surfaces include a large set of structures like housing areas and isolated buildings, industrial/commercial areas, traffic areas, roads, railways inside built-up areas, greenhouses, solar panel parks, construction sites with discernible evolving built-up structures, sealed surfaces associated with sport and recreation/tourist areas, and other paved surfaces. On the other hand, they do not include mines, quarries, peat extraction areas, sand and sand pits, dump sites, natural and cultivated vegetated areas, unvegetated or sparsely vegetated areas, arable land, vineyards, fruit plantations, grass surfaces used for sports, green roofs, etc. The IMP dataset spans through time covering the 2016–2018 period, at a spatial resolution of 20 m for the years 2006, 2009, 2012, and 2015 and 10 m for 2018, while aggregated rasters are also delivered at a 100 m × 100 m spatial resolution.
In this work, to assess pressure on coastal areas, the imperviousness change layers were used, as delivered for 3-year periods (IMCC_06: 2006–2009, IMCC_09: 2009–2012, IMCC_12: 2012–2015, and IMCC_15: 2015–2018) at a comparable resolution of 20 m. These layers include a raster dataset mapping the percentage of sealing increase or decrease in the period covered (IMC layer), and a classified change product (IMCC layer) that maps the most relevant categories of sealing change, namely: (a) unchanged no sealing (class = 0), (b) new cover (from unsealed to sealed, class = 1), (c) loss of cover (from sealed to unsealed, class = 2), (d) unchanged sealed (class = 10), (e) increased sealing (class = 11), (f) decreased sealing (class = 12). In the IMCC layer, a binary approach was used for sealed areas, as all land with IMD ≥ 1% was considered as “sealed”. To handle the issue of varying sealing values caused by the variance in input data quality for the processing of the historical layers, differences below a dynamic threshold for sealing increase (set to 20%) were considered as stable, as a lower threshold would cause false detected changes [83].
As already noted in the introductory part, imperviousness is an important control parameter in the estimation of climate-related impacts in coastal areas. This is particularly important in coastal areas where hotels, commercial spaces, and vacation houses usually include extensive paved surfaces like parking lots, pool areas, marines, etc., which result in an area many times larger being affected (Figure 1). However, building regulations usually focus on permitted built-up surfaces and the volume of new construction, not accounting for the accompanying environmental impact and land take of other artificial structures.
In order to apply the IMP dataset in the analysis of coastal areas, several methodological considerations needed to be taken into account. First of all, as the spatial resolution improved from 20 m to 10 m in the 2018 dataset, the identification of sealed areas became more detailed, capturing more buildings and structures in low-density areas than previous versions. This fact resolved several omissions and underestimations of sealed areas in previous releases and does not correspond to “new cover”, meaning that newly identified cells due to technical reasons are classified as “unchanged sealed” in the IMCC layers. Therefore, in this work, we chose to use IMCC for the period of 2015–2018 as a reference, combining this more accurate product with “new cover” cells identified in the previous periods (2006–2009, 2009–2012, and 2012–2015).
Secondly, according to the imperviousness dataset methodology [83], not all the elements in the list of impervious/nonimpervious data may be separated clearly with automated classification methods. This was handled by the product developers with the use of in situ information to enhance accuracy levels. However, inspection of data in coastline zones revealed several misclassifications. For example, land attributed to sand/beach areas or bare rocks was, in several cases, incorrectly identified as “highly-sealed”, especially in areas where coastal settlements were developed (Figure 2). This can be a disadvantage of using the IMP dataset to analyze coastal areas; however, applying the change layers (IMC and IMCC) to examine new cover allowed minimizing the effect classification inaccuracies could have on our results, as normally, the beach zone remains stable through time.
Inspection of data also showed that narrow roads were captured as “sealed areas” only if they were located between buildings. However, this also did not largely affect the current research target, as the focus was placed on new roads that were constructed in relation to residential, commercial, or tourism infrastructure and not on roads crossing between agricultural parcels and natural land. On the other hand, critical transport infrastructure like highways was included in the imperviousness database; therefore, in the present research, we applied a control of how new highway construction might affect the research results.

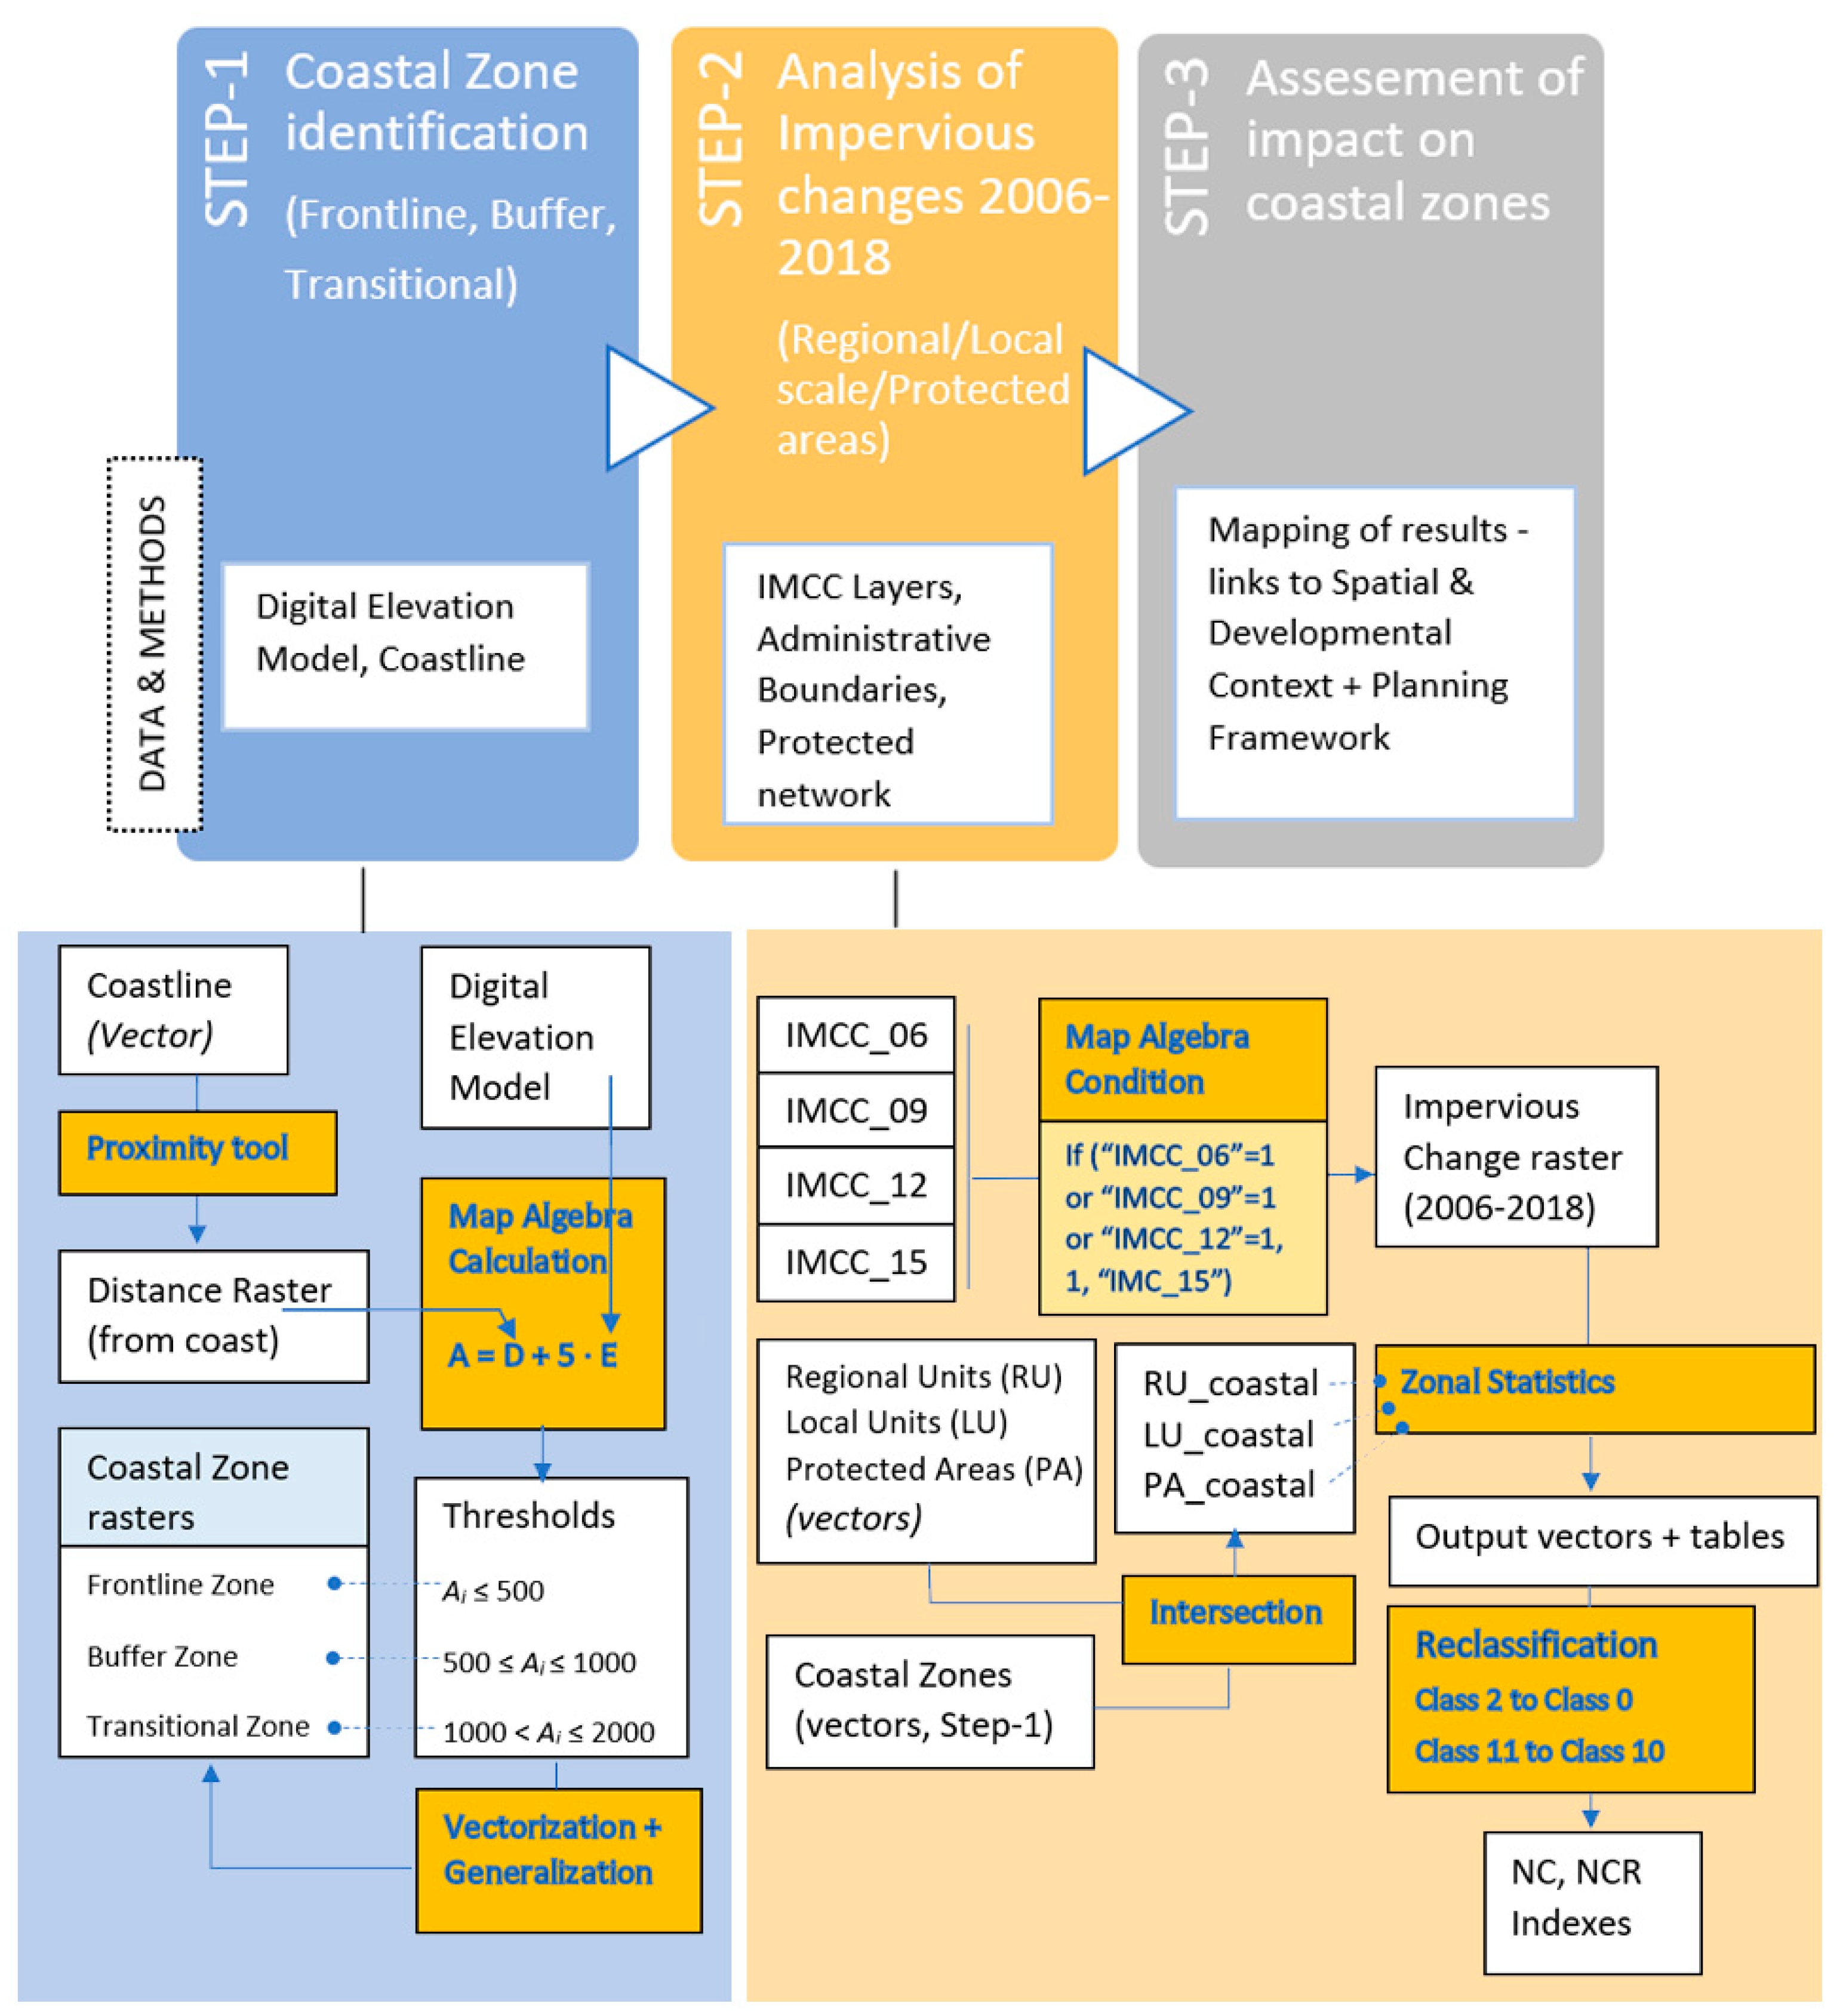
2.3. Methodological Steps

The basic workflow of the methodology adopted in the research is presented in Figure 3. The first step was to define the critical coastal zone. According to the literature, this may vary depending on the research focus and also on the geographical characteristics of the area examined [18]. In certain studies, the coastal zone is defined by a combination of the distance-to-coast and elevation dimensions [84,85], while distance thresholds could span from a belt zone of a few hundred meters [19] to a zone of several kilometers. For example, in the pan-European study by Lavalle et al. [1], the geographical delimitation of coastal zones was based on a 10 km buffer from the coastline, with an extra 2 km buffer from coastal wetlands, salt marshes, and salines, so as to include all transitional waters areas that were under the direct influence of maritime environments.
To construct a research-specific definition of the coastal zone, in this study, a combination of elevation and distance criteria was applied by taking into account the specific particularities of coastal development and geomorphology in the case study area. A coastal subzoning method was used, with the first zone including areas with high accessibility to the shore (including the seashore and the beach) and secondary (transitional) zones demarked towards the hinterland. A proximity raster calculating Euclidean distance to the coastline was combined with the Digital Elevation Model (DEM) of Europe to produce a 25 m raster dataset with cell values defined as Ai = Di + 5 · Ei, where Ai is coastal accessibility, Di is the distance from the coast, and Ei is the terrain altitude of cell i. By setting different threshold values for this raster, the following set of coastal subzones was defined:
  • Frontline coastal zone: Ai ≤ 500 (direct accessibility to the sea, within what can be perceived as “walking distance”—up to 500 m; the elevation is up to 100 m).
  • Buffer coastal zone: 500 ≤ Ai ≤ 1000 (high accessibility to the sea, usually in continuity with the frontline zone; this zone could include higher-elevation areas between 100 and 200 m).
  • Transitional coastal zone: 1000 < Ai ≤ 2000 (lower accessibility to the sea; this zone could include higher-elevation areas up to 200–400 m).
The specified zones were converted to vectors by considering polygon holes with a relatively small area (≤10 ha) as an integral part of each zone (cartographic generalization procedure). Areas with Ai > 2000 were considered as “hinterland” and left out of this study, despite the fact that they can also be related to several coastal phenomena and influenced by maritime climatic conditions. This choice was mostly based on evidence that, in Greece, development in exurban areas is usually “squeezed” within a considerably narrow belt from the coast [86] due to increasing demand for immediate access to the sea for tourism and second housing development.
The second step was the processing of imperviousness data. Map algebra methods were used to combine the IMCC datasets for different periods in order to produce a raster dataset identifying new impervious cover (class = 1) and unchanged sealed land (class = 10) for the period of 2006–2018. The following condition was used: If (IMCC_06 = 1 or IMCC_09 = 1 or IMCC_12 = 1, true: 1, false: IMCC_15). Loss of cover (class = 2) and increased sealing (Class = 11) for the period of 2015–2018 were reclassified as Class 0 (unsealed) and as Class 10 (unchanged sealed), respectively. Class 12 pixels (decreased sealing) were not identified in the case study area. To evaluate impervious land changes, two main indicators were specified, namely:
(a) NC (new cover) index: the number of cells in Class 1 with new cover divided by the total zone area (Class 0 + Class 1 + Class 10).
(b) NCR (new cover rate) index: the number of cells in Class 1 with new cover divided by the sealed areas in 2006 (Class 10 cells) and multiplied by 100.
The third step was to combine the produced IMCC 2006–2018 raster with data of the protected network, i.e., Natura 2000 areas (obtained from the Copernicus Land Monitoring Service, https://land.copernicus.eu/local/natura/n2k-20181 accessed on 24 September 2023), Natural Parks and Wildlife Sanctuaries (obtained from the Geodata Geoportal of Greece, https://geodata.gov.gr accessed on 24 September 2023), and Important Bird Areas [87]. Zonal statistics methods were used in order to quantify the raster cell values per zone, while geoprocessing tools (intersection, spatial join, and dissolve) were applied to process the vector files of the specified coastal zones at the national, regional, and local levels. Geospatial analysis was processed using the Quantum GIS version 3.28.3 open source software.

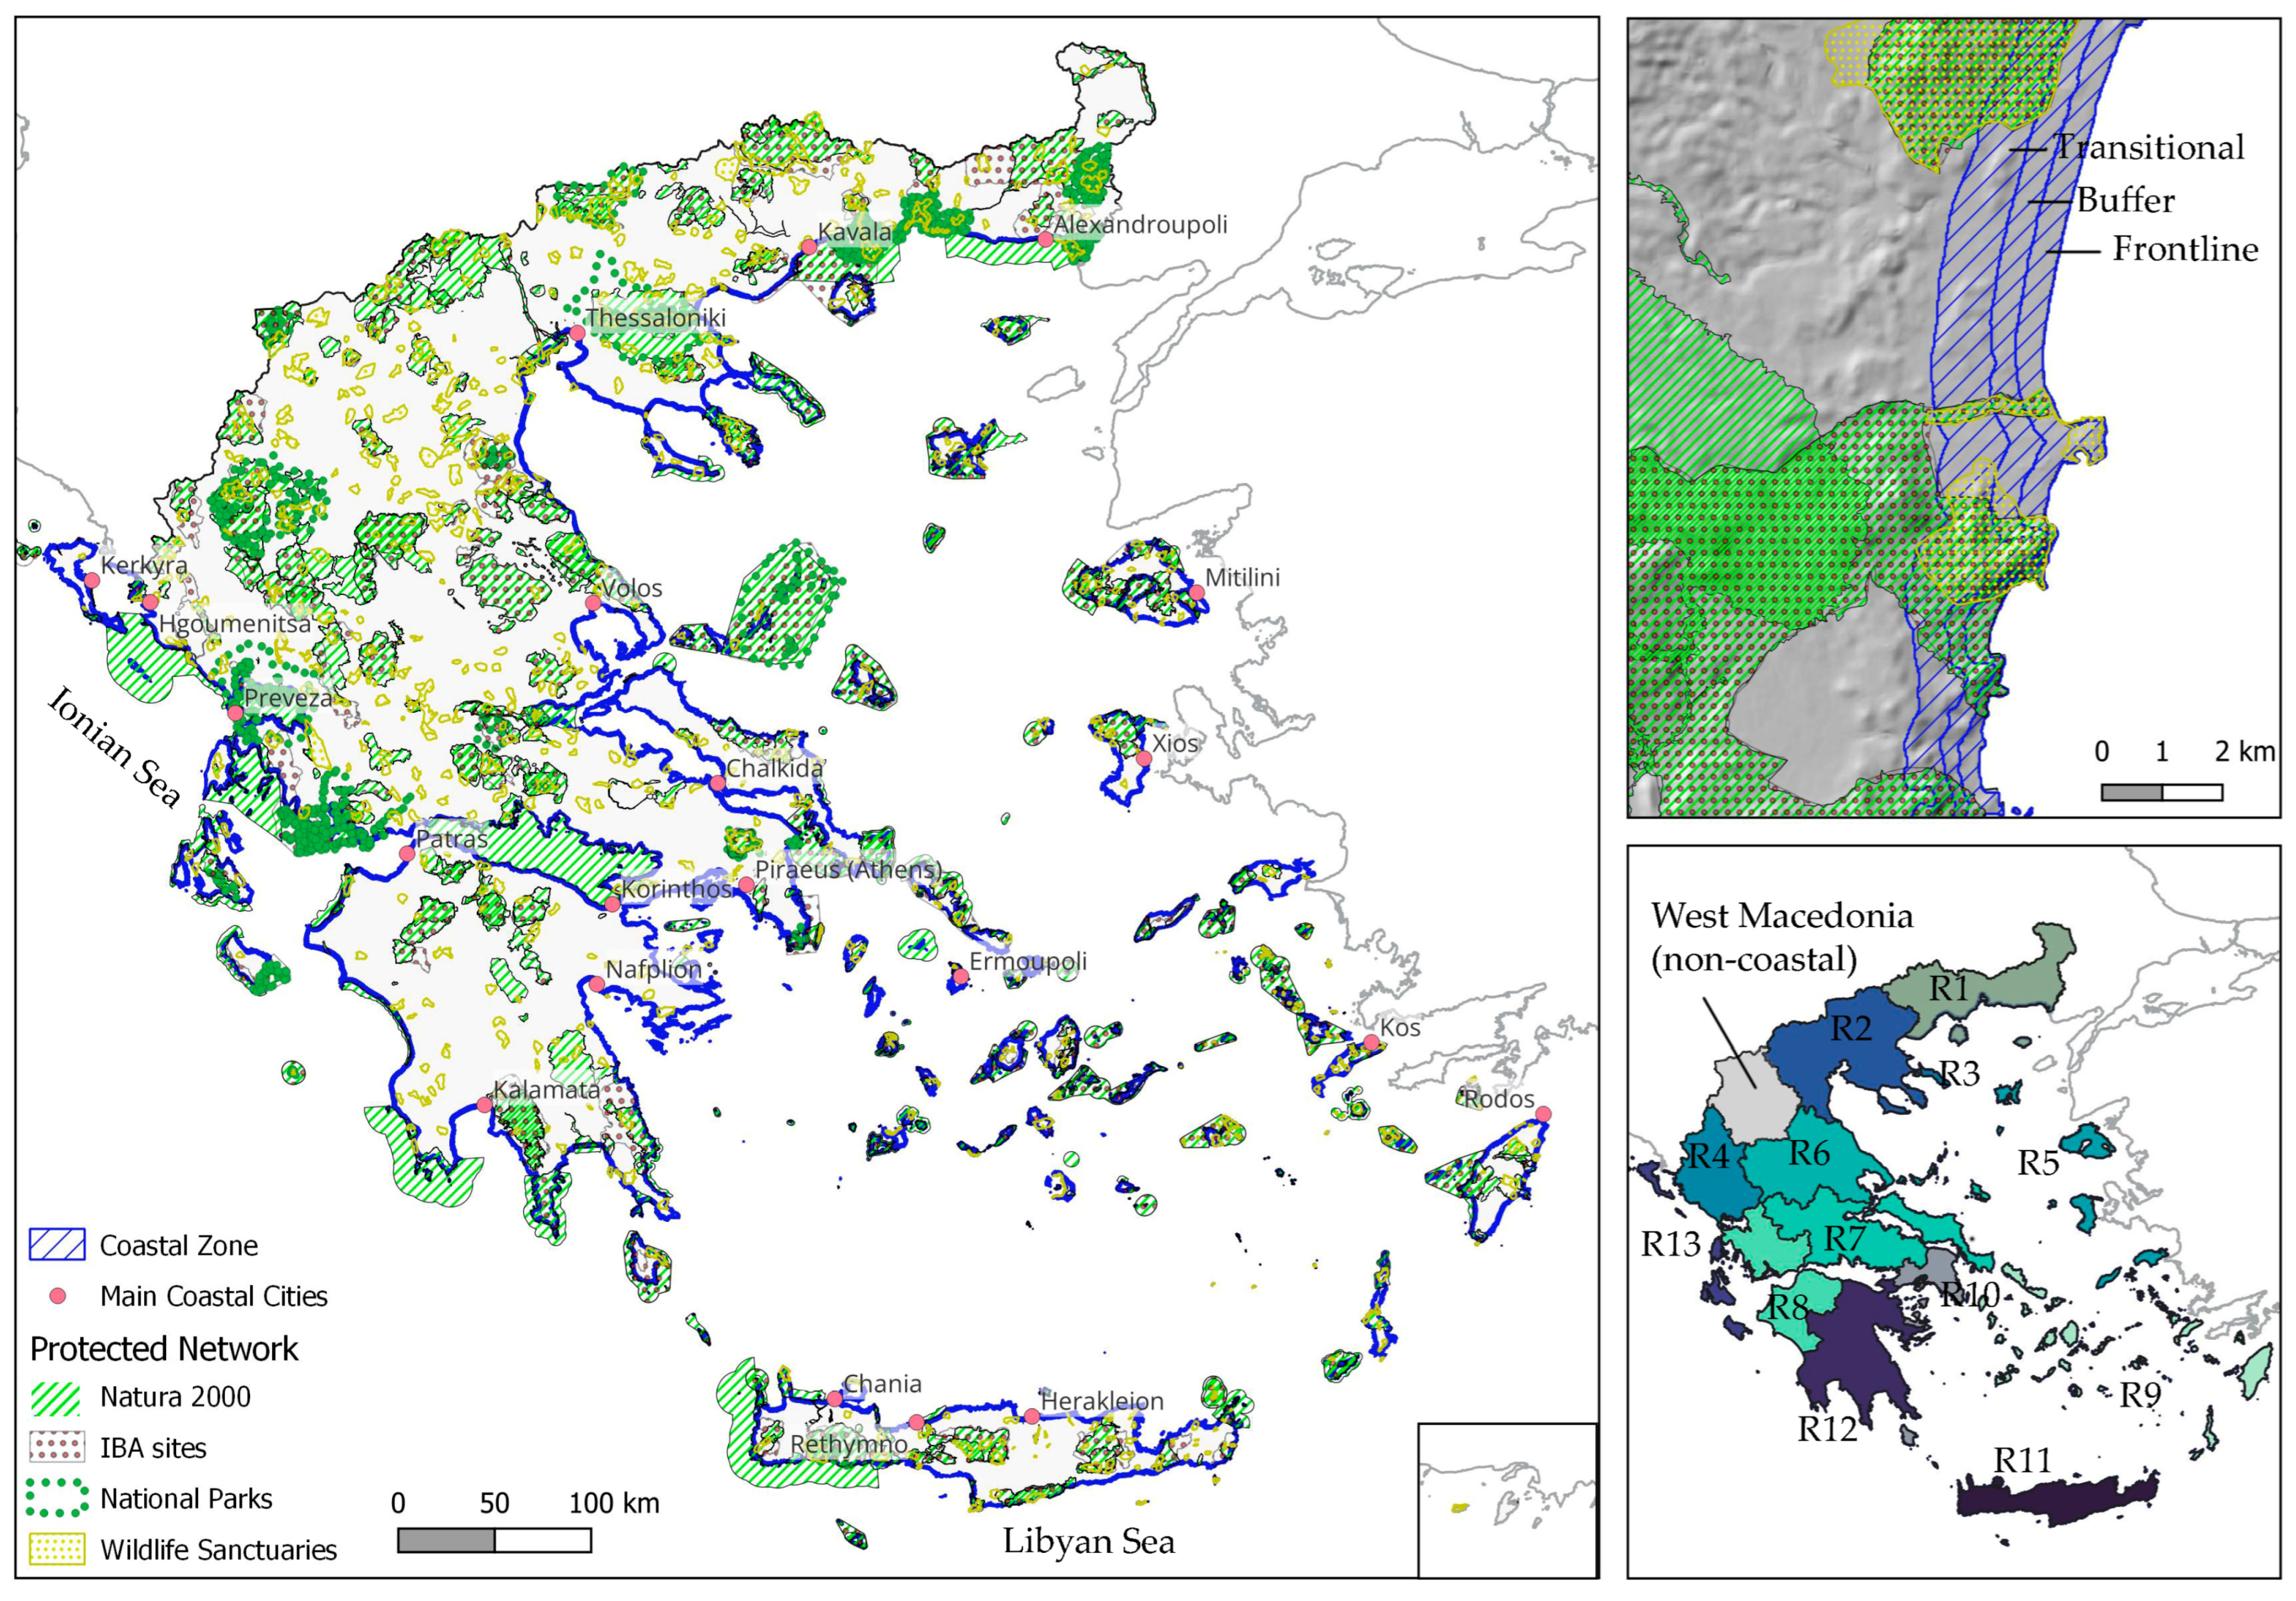
2.4. Case Study Area

Despite its relatively small size, Greece is the country with the most extensive coastline in Europe, estimated to be close to 16 thousand km, including 6000 islands and islets (112 of which are inhabited) and including the Aegean Archipelago, the Ionian Archipelago, and the Libyan Archipelago (Figure 4). The coastal zone of Greece has been particularly important since ancient times, with major port cities and a large share of economic activities dependent on the sea, resulting in a dense network of archaeological spaces and coastal monuments. According to data from the 2021 Census [88], the population in Greece has reached 10,482,487 people (a 3.1% decrease with respect to 2011), with an important concentration in the coastal region, where the population density is estimated to be about three times higher than the density in hinterland zones [33].
The case study area includes the coastal zone of Greece, spanning through 12 out of the 13 regions (Nuts 2), with the addition of the independent Monastic community of Mount Athos. The South Aegean region (R9 on the map) contains the largest share of the coastal zone as a percentage of its total area (44.7%), followed by the North Aegean (31.6%, R5 on the map), Ionian Islands (37.5%, R13 on the map), Athos (30.9%, R3 on the map) and the Attica region (22.6%, R10 on the map), Central Greece (8.8%, R7 on the map), West Greece (8.3%, R8 on the map), and the Peloponnese (8.1%, R12 on the map); the smallest percentages are in Thessaly (3.5%, R6 on the map), Epirus (3.5%, R4 on the map), East Macedonia and Thrace (4.6%, R1 on the map), and Central Macedonia (5.1%, R2 on the map).
Population varies considerably among the different regions, with Attica and the Central Macedonia region presenting the highest population densities, as they contain the two major metropolitan centers of Greece (Athens and Thessaloniki, respectively). Only the South Aegean region and Crete present population growth in the 2011–2021 period, with all the other regions characterized by population decline. Major coastal cities include Thessaloniki, Piraeus (forming part of the Urban Agglomeration of Athens), Patras, Volos, Kalamata, and Kavala in mainland Greece, with the addition of important island cities like Herakleion, Chania, and Rethymno in Crete; Rodos, Kos, and Ermoupoli in the South Aegean region; Kerkyra in the Ionian region; and Chios and Mytilene in the North Aegean region.
The case study area includes a dense network of protected areas: 29.3% of the total coastal zone is part of the Natura 2000 Network (not counting the marine part of Natura 2000 areas), 25.3% is part of the Important Bird Areas’ (IBA) network, 8.0% belongs to Wildlife Sanctuaries, and 11.4% in National Parks. As these areas usually overlap, a combined analysis showed that about 40% of the total coastal zone of Greece lies within protected areas. The largest share of the protected coastal zone was identified to be in Athos (100%), Epirus (59% of regional coastal zone), the East Macedonia and Thrace region (58.6%), and the South Aegean region (53.5%), while in the Ionian Islands, Attica, Central Greece, and the Peloponnese, less than one third of the coastal zone is protected. The coastal geomorphology is considerably diverse, including mainland and island parts, delta rivers, low-elevation land, steep slopes, mountain cliffs, and gorges, in close proximity to the seashore. According to the methodology adopted, high-slope and/or elevated areas close to the coast (up to 300 m) were included in the analysis as they form an integral part of the coastline zone; such areas are crucial for biodiversity, and are also usually perceived by real estate and market forces as candidate land for second housing and tourism development due to the views they offer towards the sea.
Scenarios reveal that Greece will be largely affected by climate change, with most of the consequences characterized as negative [89]. The mean temperature is expected to increase by over 2 °C and 2.5 °C for scenarios RCP 2.6 and 4.5, respectively, and by over 3 °C under scenario RCP 8.5. However, the increase in high temperatures is expected to be lower in the coastal and insular zone than in the hinterland flatlands and semimountainous or mountainous areas [89]. More periods of drought during the spring and summer are expected in certain parts like Crete, the South Peloponnese, and the South Aegean [89], with an increase in days of extreme heatwaves and related fire risk [90]. This is a crucial parameter, as drought is already severely affecting certain parts of these specific regions, with increasing urbanization and mass tourism posing particular stress on local water resources, exceeding the carrying capacity of places. Moreover, wildfires in coastal parts of Greece have already led to deforestation and the loss of natural land and vegetation, causing large-scale ecological disasters, characteristic examples being the recent forest fires in islands like Chios (in 2016), Samos (in 2021), Evvoia (in 2021), and Rodos (in 2023). Coastal settlement formations that have been developed illegally are particularly vulnerable to natural disasters, as proved by the recent wildfire in the settlement of Mati in Attica (2018) with 104 lives lost, partly attributed to problematic urban planning and a lack of evacuation options [91].
Decreased rainfall will mostly affect Crete, the Southeast Peloponnese, Central Greece, and the coastal part of Thessaly [89], while according to Representative Concentration Pathway (RCP) scenarios related to climate change, more specifically RCP 2.6 and 4.5 scenarios, precipitation could increase in certain coastal parts of Northern Greece (Thessaloniki, Chalkidiki, Thrace, and the North Aegean Islands), with a similar estimation for the coastal zone of West Greece, Epirus, and the Ionian Islands. Soil moisture will decrease mostly in the southern and western part of Greece, while under all scenarios, season length is expected to increase in the hinterland’s mountainous areas, while it will remain relatively stable in the insular and coastal territories. A major problem is the increasing frequency and severity of “flash-floods” and Mediterranean cyclones leading to disasters in low-land areas, like in the case of the “Ianos” cyclone hitting the Ionian Islands, the Peloponnese, and West Greece in 2021, and the recent “Daniel” storm in September 2023, with unprecedented volumes of water destroying settlements and infrastructure in Thessaly, including coastal and hinterland areas.
Moreover, a large part of the Greek coastline presents high vulnerability to sea level rise [92], which is estimated to be close to 4 mm/year in the Aegean for the 1992–2014 period, and with a worst-case scenario of a 102 cm rise between now and 2100 [93]. Erosion data [94] show that about 30% of the Greek coastline was already affected by erosion in 2004. By co-estimating parameters like areas of high ecological value and population living within the area of influence of coastal erosion, high exposure was reported for the Attica region and moderate exposure was reported for West Greece, Central Macedonia, and Thrace [94]. Local geological and geomorphological factors, including vertical ground motions, also affect vulnerability to sea level rise and coastal erosion, rendering projections for the Greek territory more complex. However, even in the more optimistic scenario, a large part of coastal wetlands will be affected due to marine flooding and water salinization, and a considerable loss of beach area can be expected, with impacts on coastal infrastructure.
As already noted in Section 1, the time span covered in this work coincides to a large extent with the economic crisis period of 2009–2018, related to the public debt crisis of the Greek state. Austerity measures imposed by the IMF, the European Union, and the European Central Band as part of the bail-out program [95,96] plunged Greek society into general poverty, especially for the low and middle socioeconomic classes, who experienced a heavy loss of income and unprecedented unemployment [97]. Major effects of the crisis included the collapse of the construction sector, the devaluation of land properties, and a dramatic cut-down of public expenses, including expenses in the social welfare sector, public sector, and relevant infrastructure [98]. Moreover, this period was marked by radical changes regarding the general socioeconomic and political structure, which also affected the spatial planning framework and related policies [99,100].
While metropolitan areas in Greece were severely affected, exhibiting increasing spatial segregation, unemployment, and social exclusion [101], tourism locations and particularly islands were more resistant [102]. Domestic tourism was particularly hit by the crisis, yet international tourist arrivals in Greece increased from 15 million in 2010 to 31.3 million in 2019 [103]. This fact has been linked to the spread of Airbnb rentals in urban and coastal territories. Airbnb had grown rapidly in Greece since 2012, reaching up to about 126,000 registrations in 2018 [104,105], with over half of them currently located in the islands (a crude estimation based on Airdna platform data, https://www.airdna.co/ accessed on 24 September 2023). While the official tourism sector presented a relatively slow growth rate, with a 13% increase in bed capacity in the 2010–2020 period [104], Airbnb came to fill the “gap” in terms of supply and demand, mostly utilizing and upgrading existing building stock, but also driving new construction in island and coastal territories. Therefore, recent evidence shows that despite the spatial and developmental impacts of the economic recession period, followed by the COVID-19 pandemic that has largely affected incoming flows of visitors during 2019 and 2020, dynamic processes affecting coastal and insular areas in Greece are still in place.

3. Results

3.1. Impervious Land Expansion at the Regional Scale

To analyze imperviousness changes in the 2006–2018 period, the methodology described in Section 2 was used, based on the NC (new cover) and NCR (new cover rate) indexes. Based on the obtained results, impervious land expansion (new cover) in the coastal zone at a nationwide scale is 5228 ha, corresponding to a 5.8% increase in the existing impervious surface compared to 2006 (i.e., 89,570 ha). Analysis based on the three sequential coastline zones showed that 41% of new impervious cover was located in the frontline zone, 23.6% in the buffer zone, and 34.4% in the transitional zone. The most dynamic regions in terms of the NC index in the frontline zone were the two heavily urbanized “metropolitan” regions (Attica and Central Macedonia) plus the island regions of Crete, Ionian Islands, and the South Aegean, with the addition of the Peloponnese. Table 1 presents the obtained index scores for each region.
The NCR index in the frontline zone was considerably dynamic in the South Aegean (10.4) and the Peloponnese (9.4), followed by Crete (6.7), North Aegean (6.1), and Central Greece (6.1), while the NCR was considerably lower in the two “metropolitan” regions (Attica and Central Macedonia), where new impervious cover was only a small percentage of already developed land (3.3% and 3%, respectively); this fact is most probably attributed to the economic crisis that particularly affected large urban centers. The NCR was particularly high in the South Aegean and the Peloponnese, not only in the frontline zone but also in the buffer and the transitional zones; this fact is related to the considerable expansion of development towards the hinterland, while in Central Greece, high NCR values were reported in the transitional zone. The monastic community of Athos presented high NCR scores (12.2); however, this is attributed to the very small imperviousness level it presents (with only 0.43% of total land developed until 2018) and cannot be classified as truly “dynamic”. As shown by the data presented in Table 1, 30.9% of the frontline zone in Attica was covered by impervious areas in 2018, with this percentage reaching 19.4% in Central Macedonia, 16% in Crete, and 15.2% in the Ionian Islands. With the exception of Athos, in all regions, a gradual decrease in imperviousness was observed moving from the frontline to the transitional zone, with this decrease being more rapid in Attica, Epirus, and Central Macedonia.
A combined analysis of both indexes (Figure 5a) reveals that the Peloponnese and West Greece were the regions with simultaneously high NC and NCR values (over the national mean). The South Aegean and Central Greece regions presented high NCR values (over the national mean) and NC values close to the national mean, while Crete presented high NC values and NCR values close to the national mean. On the other hand, Thessaly and East Macedonia and Thrace were the regions presenting the lowest rates of impervious land expansion, in terms of both NC and NCR, in the coastal zone. When NC is plotted against impervious area per region (2006), a linear relationship is observed (Figure 5b); therefore, new cover is correlated to the overall level of development, with Attica, Central Macedonia, and the Peloponnese more notably departing from this linear trend.
In the period of 2006–2018, new highways influencing coastal areas included the A8 highway (Olympia Odos) crossing through the North Peloponnese (and part of the West Greece region), the enlargement of the A1 highway around the Maliakos Gulf, the A5 highway (Ionia Odos) connecting the western part of Greece from south to north, the A9 highway in Northern Crete, and finally, the small coastal part of the A2 highway (Egnatia Odos) and the Thessaloniki–Moudania highway in Central Macedonia. However, analysis showed that highway construction only marginally affected the results. By controlling for a buffer of 50 m on both sides of the national highway network, it was identified that new cover related to highway construction was only 2.4% of new impervious cover during the 2006–2018 period, mostly affecting the Central Macedonia region (16% of new cover was highway-related), West Greece (3.3%), Epirus (3.2%), and Crete (2.6%).

3.2. Impervious Land Expansion at the Local Scale

Regional level data show that Greek coastal territories still posess a large amount of undeveloped land. However, overall statistics might obscure pressures exerted in certain areas, as impervious land is not distributed evenly. As certain coastal zones are still affected to a considerable degree, local-scale analysis is critical in order to identify coastline sectors where impervious land expansion is accelerating. Consequently, results are also analyzed based on a division of coastline sectors according to local administrative boundaries, where impervious land changes and relevant NC and NCR indexes are estimated and compared. Local/municipal entity boundaries (i.e., the first-level division of municipalities in Greece) are used, as they usually correspond to the geographical level of local spatial planning as specified by general urban plans.
According to the sector analysis, the NC index during the 2006–2018 period (Figure 6) revealed a marginal increase in impervious land expansion in most coastal territories of Greece, with several notable exceptions. First of all, NC was higher than 1 (corresponding to over 1% of coastal-land affected by new cover in the 2006–2018 period) in 81 out of the 480 local/municipal communities containing coastal areas. These include the following: (a) Coastal urban areas in Athens, Thessaloniki, Chalkida, and Volos, with urban land expansion attributed to industrial/commercial development and relative infrastructure, including port facilities. (b) Highway-related development, mostly affecting municipalities along the highway axes mentioned above. (c) Tourism development, which was the dominant type of coastal land use conversion during the 2006–2018 period.
More specifically, tourism-related artificial land expansion was recorded in island parts like Thasos (eastern part), Limnos (western part), Skiathos, Paxoi, Zakynthos (western part), Kerkyra (western part), Lefkada (northern part), Rodos (northern and southeastern part), Mykonos, Paros, Kos, Syros, and Santorini. In Crete, important impervious land expansion was recorded in certain parts of the northern coast like Kolympari (Chania), Chersonisos-Malia (Heraklion), and Elounta (Lasithi). All these are reputable mass tourism destinations where, despite the economic crisis, new construction continues. Tourism-related impervious land expansion was also reported in the Pylos area (attributed to the construction of the Costa Navarino resort), and along the South Attica coast towards Cape Sounio. Figure 7 presents the NCR distribution, and a characterization of coastal sectors based on combined criteria: (a) “Intense coastal development”, i.e., areas with impervious land in 2018 exceeding the national mean (≥7.8%), (b) “Coastal development & expansion”, i.e., areas with existing development (impervious land exceeding half of the national mean, ≥3.9%) and the simultaneous condition of NC and NCR exceeding the national mean (NC ≥ 0.43 and NCR ≥ 5.8), (c) “Expansion in less developed areas”, i.e., areas with NC and NCR exceeding half of the national mean, and impervious land in 2018 less than half the national mean (≤3.9%).
An inspection of the corresponding maps showed that high rates of impervious land expansion (NCR index) were recorded in most of the islands, and also in the South Peloponnese, along the Corinthian Bay, the Maliakos Gulf, and on the Aetolia-Acarnania coast (those last two areas were partly affected by road construction). As displayed in Figure 7b, areas with high levels of existing coastal development with continuing expansion were identified (a) in Aegean islands with mass tourism (Mykonos, Paros, Santorini, Skiathos, and the northern part of Rodos and Lindos); (b) Ionian islands like Lefkada and Paxoi and the central part of Kerkyra, with the addition of several parts of the Epirus coast (close to the city of Preveza and in Parga-Syvota); (c) parts of Crete including the periurban area of Chania, Agios Nikolaos–Elounda, and Ierapetra; (d) the urbanized corridor along the Corinthian Bay, as well as touristic urban zones in Nafplion and Calamata in the Peloponnese. On the other hand, the results confirm that the northern part of the Greek coast, including the highly developed touristic zones of Pieria, Chalkidiki, and Kavala, presents developmental stability.

3.3. Impervious Land Expansion within Protected Areas

One of the most important issues regarding climate change adaptation is related to impervious land expansion in less developed areas, coinciding in many cases with areas of the protected natural network (or in close proximity to it). It is important to note that even small percentages of imperviousness within protected areas can considerably affect the ecosystem due to the multiple types of landscape fragmentation provoked by low-density scattered development. The results show that impervious land expanded by 798 ha (or by 8.6%) in the period of 2006–2018 within coastal protected areas (Table 2). The protected areas mostly affected by impervious land expansion during the 2006–2018 period were identified in the South Aegean (NCRpr = 11.8), West Greece (NCRpr = 14.0), and Crete (NCRpr = 13.6). Additionally, the results show that in Attica, the Ionian Islands, Epirus, and West Greece, protected land is significantly affected by imperviousness, with 5.78%, 4.65%, 3.38%, and 3.13% of protected coastal land affected by 2018, respectively (with 2.14% being the mean value at the nationwide level). These imperviousness figures could include old rural settlements, suburban sprawl, illegal second housing formations, tourism development, and relative infrastructure, together creating a hybrid spatial pattern that can be linked to considerable ecosystem degradation.
This issue is becoming more and more important in the islands of Greece, where tourism-related development encroached on Natura 2000 and wildlife sanctuary areas in the period of 2006–2018 under a highly dispersed spatial pattern scheme, radically altering existing land cover, while rendering new infrastructure particularly vulnerable to CC impacts. The results show that development can also be intense on land in close proximity (up to 1–2 km) to the protected network. This is important as tourism facilities in many cases chose to be located exactly at the border of protected areas; nevertheless, they still considerably affect the ecosystem by altering water resources, biodiversity, microclimatic conditions, etc. This is, for example, the case for the Agios Prokopios area on Naxos Island (Figure 8), where scattered development surrounds protected wetlands within disaster-prone (flood risk) low-elevation land close to the coast.

4. Discussion

The research results confirm the hypothesis of a “moratorium” on coastal urban sprawl in Greece during the period of 2006–2018, with low rates of impervious land expansion. At an overall level, a 5.8% increase in impervious land was reported, with less than 0.5% of previously undeveloped areas in the coastal zone affected by new construction. The highest NC index values were reported for the frontline zone, corresponding to the areas with immediate accessibility to the sea, while there was a gradual decrease in imperviousness in the buffer and transitional zones.
At the regional level, the South Aegean, Crete, and the Peloponnese were the more “dynamic” regions; downscaling results to a local level revealed continuing trends of impervious land expansion in specific coastal sectors, especially those affected by tourism, while other areas were affected by industrial/commercial sprawl as well as highway construction. The results also show that in the 2006–2018 period, protected natural areas (comprising up to 40% of land in the coastal zone) continued to be affected by impervious land expansion. This is evaluated as an alarming fact: natural areas like wetlands, sand dunes, forests, and scrub vegetation are abundant along the Greek coastline and play a crucial role in climate change adaptation, acting as barriers to coastal erosion, preventing floods, and acting as carbon sinks, while preserving biodiversity. Impervious land encroachment could considerably degrade their ecosystemic role and render coastal areas particularly vulnerable to climate change impacts.
Therefore, the results obtained in this work could inform national- and regional-level policies regarding CC adaptation in many ways: First of all, they highlight areas of intense development at the coastal front, where specific actions should be prioritized to handle increasing environmental pressures and natural hazards. A characteristic example is the urbanized corridor along Corinthian Bay, an area where impervious land expansion still continued in the 2006–2018 period and which was identified as an area heavily affected by coastal erosion, putting buildings and infrastructure in proximity to the sea in danger. Secondly, the results identified natural areas where new development is encroaching, like on highly touristic islands, in the absence of a strict framework handling climate-related vulnerabilities. An example is the Lindos Municipality in Rodos, identified by the results as a sector of coastal impervious expansion and coinciding with the area of a destructive forest wildfire which led to the large-scale evacuation of hotel resorts in July 2023. Similar locations where impervious land expansion is simultaneously increasing vulnerabilities to natural disasters (i.e., to flood and fire risk) and decreasing the ability of natural coastal ecosystems to mitigate the effects of climate change were identified in many parts along the case study area; therefore, providing specific planning solutions for these areas could be an important expansion of this work.
It is important to note that the overall slowdown of impervious land expansion implied by the results should be considered as a temporal effect related to the general socioeconomic and political context of the examined period and the sociospatial manifestations of the Greek crisis. Among the major impacts of the economic recession has been the sudden interruption of the real estate boom that had peaked in Greece in the previous period, with construction activity gradually collapsing after 2008. This was accompanied by the devaluation of land properties; the inability of households to pay off home loans taken up during the previous period due to the dramatic cut-down of wages, pensions, and public expenses; and the bankruptcy of construction companies in the private sector.
The economic crisis period has also largely impacted spatial planning issues in Greece. One of the first political actions of the economic crisis period was the legalization of millions of illegal construction projects [106,107,108], mainly aiming to provide income for the state budget. Illegal houses in Greece include structures along the shore, within forest land, and/or natural areas. These are usually areas of spontaneous development, presenting increasing vulnerability to natural disasters. Moreover, the studied period coincides with a significant reform of the Greek Spatial Planning Framework [109], existing since the 2000s, with the insertion of a new set of spatial planning tools largely imposed by the IMF and EU partners [76] and adopted by successive Greek governments to accelerate projects, making procedures more quick, flexible, and favorable to large-scale investments [110,111]. These tools include Special Spatial Plans for Strategic Investments (entitled ESXASE in Greek, Law 3894/2010) [112], forming part of the newly defined Special Urban Plans (Law 4269/2014, Law 4447/2016, and Law 4759/2020) [113,114,115]. Spatial planning reform also involves legislative instruments to capitalize on public land property [79] (Special Spatial Development Plans for Public Property, entitled ESXADA in Greek, Law 3986/2011) [116], with many of them targeted at high-value coastal territories. These new sets of spatial planning tools, legislated during the crisis period, are currently being activated by the mass tourism sector to obtain permission for a considerable number of future projects within privileged locations on the coastal front (e.g., recent ESXADA projects in Afantou in Rodos, Paliouri, and Ag. Ioannis in Chalkidiki, and Kassiopi in Kerkyra; ESXASE projects in Kavousi, Elounda, Cavo Sidero, and Kissamos Bay in Crete, etc.).
At the same time, the restructuring of the real estate market has led to profit opportunities for foreign speculators and investors buying off cheap land and property during the economic crisis period [117]; this process is also driven by the golden visa policies initiated in 2013 in Greece, and a growing global demand for high-quality vacation housing on the Mediterranean coast [21]. Moreover, the spread of Airbnb in coastal and island territories, coupled with steadily increasing international tourism arrivals, has been one of the most important new facts during the crisis period; this trend is still rapidly accelerating. In Greece, this can be further fueled by new legislation regarding complex tourism resorts and mixed small-scale tourism resorts that allows the incorporation of private housing formations under favorable building regulations. Such private vacation houses within hotel zones can be rented, sold, or exploited by their owners in a flexible way, while taking advantage of being located in privileged natural locations or even within Natura 2000 areas at a minimum distance from the shoreline that has been exceptionally set to 30 m (from 50 m, which is normally permitted for tourism facilities).
In light of these remarks, we can deduce that as Greece enters the post-crisis period (or more correctly, the post-memorandum period, as the effects of the crisis are still very important for Greek society), a “rebound” of coastal urban sprawl might be expected. Recent data show that construction activity is finally picking up after a downturn for over 10 years, while after considerable fluctuations during the COVID-19 pandemic (2020–2021), construction activity has been accelerating since 2022 (Figure 9). Especially in the case of mass tourism destinations like the South Aegean, this increase has been impressive, reaching precrisis figures. This “rebound”, combined with increasing demand for coastal space and a lack of strict land use planning regulations prioritizing nature conservation, is evaluated as an alarming issue, adding another challenge for climate adaptation strategies that still remain in their infancy in Greece, with an effective mechanism to coordinate the interconnections between spatial plans and climate change adaptation policies still missing [118].

5. Conclusions

In the Mediterranean, the rapid acceleration of urban sprawl is fueled by periurbanization processes and mass tourism development, particularly concentrated in the coastal zone. Continuing imperviousness expansion could lead to landscape fragmentation, increase the urban heat island effect, reduce natural land and vegetation, accelerate coastal erosion, and lead to the overexploitation of land and natural resources.
Regarding the effect of such processes on coastal territories, our work implies that imperviousness is a better control parameter than built-up footprints as it also accounts for road construction, parking lots, pools, and other related structures that affect ecosystems. Reducing imperviousness can be considered as a “green” adaptation measure, directly affecting how a territory will function in the case of a flashflood, a forest fire, coastal erosion, and other impacts of climate change; therefore, strategies prioritizing biodiversity preservation in coastal zones are needed. Towards this direction, it is of major importance to utilize high-resolution spatial data to assess the impact development has already had on coastal territories, to evaluate climate change threats, and to provide tools for monitoring land cover changes.
Herein, geospatial methods were applied to examine the spatial outcome of the recession period in Greece in terms of imperviousness land expansion, and to assess the way it has affected development in coastal zones. The results provide a full-scale estimation of recent impervious land expansion in Greece, which is able to inform and support national- and regional-level spatial planning decisions and strategies.
The results reveal that, at an overall level, Greece still possesses a large percentage of undeveloped land. This can be a valuable asset in order to combat climate change at its frontline, i.e., the coastal zone. However, as the country emerges from the crisis period, a notable “rebound” in the construction sector can be expected, which, coupled with the continuing dynamic of the mass tourism sector, Airbnb expansion, and global real estate interest in investing in coastal locations, is imposing particular stress on coastal and insular territories, undermining recent national and regional efforts towards climate resilience. This is in line with the persistent view of tourism as a “heavy industry” in Greece, related to an unsustainable model of coastal tourism development, increasing social inequalities and environmental vulnerabilities. In the absence of a coherent national-level spatial planning framework guiding development in coastal areas, as well as enforcing directions for nature preservation, it can be expected that an unsustainable business-as-usual scenario could take place. This can be alarming, and could also mark a possible future expansion of this work, placing particular focus on protected areas under stress, with the execution of in-depth case study analyses to specifically evaluate climate change impacts and probable solution and adaptation measures.
In conclusion, it is our strong belief that spatial planning and land use policies remain an irreplaceable tool in preventing undesirable land use/land cover changes and securing a climate-resilient future. The management of urban sprawl should be related to reduced rates of land take, with this issue being particularly relevant to coastal zone management, where coastal retreat policies with strict nature preservation should be enforced. Currently, as important steps towards climate change adaptation policies are made on the European and international scales, scientific inputs such as those provided by the present research could be particularly relevant for properly handling spatial planning decisions, through a climate resilience approach, to secure a sustainable pathway for the Mediterranean.

Funding

This research received no external funding.

Data Availability Statement

The data used to support the findings of this study can be made available by the corresponding author upon request.

Conflicts of Interest

The authors declare no conflict of interest.

References

  1. Lavalle, C.; Rocha Gomes, C.; Baranzelli, C.; Batista, E.; Silva, F. Coastal Zones Policy Alternatives on European Coastal Zones 2000–2050; EUR 24792 EN; Publications Office of the European Union: Luxembourg, 2011; Available online: https://citeseerx.ist.psu.edu/document?repid=rep1&type=pdf&doi=e7a543af907c22030afca985f3e55b8baffc8f95 (accessed on 24 September 2023).
  2. MedECC. Climate and Environmental Change in the Mediterranean Basin–Current Situation and Risks for the Future. First Mediterranean Assessment Report; Cramer, W., Guiot, J., Marini, K., Eds.; Union for the Mediterranean, Plan Bleu, UNEP/MAP: Marseille, France, 2020; ISBN 978-2-9577416-0-1. [Google Scholar] [CrossRef]
  3. Vimal, R.; Geniaux, G.; Pluvinet, P.; Napoleone, C.; Lepart, J. Detecting threatened biodiversity by urbanization at regional and local scales using an urban sprawl simulation approach: Application on the French Mediterranean region. Landsc. Urban Plan. 2012, 104, 343–355. [Google Scholar] [CrossRef]
  4. European Environmental Agency (EEA). The Changing Faces of Europe’s Coastal Areas; EEA Report No 6/2006; Office for Official Publications of the European Communities: Luxembourg, 2006; ISBN 92-9167-842-2. [Google Scholar]
  5. Satta, A.; Puddu, M.; Venturini, S.; Giupponi, C. Assessment of coastal risks to climate change related impacts at the regional scale: The case of the Mediterranean region. Int. J. Disaster Risk Reduct. 2017, 24, 284–296. [Google Scholar] [CrossRef]
  6. Morote, A.-F.; Hernández, M. Urban sprawl and its effects on water demand: A case study of Alicante, Spain. Land Use Policy 2016, 50, 352–362. [Google Scholar] [CrossRef]
  7. European Commission. Biodiversity Strategy for 2030. 22 December 2021. Available online: https://environment.ec.europa.eu/strategy/biodiversity-strategy-2030_en (accessed on 24 September 2023).
  8. IPCC. Climate Change and Land: An IPCC Special Report on Climate Change, Desertification, Land Degradation, Sustainable Land Management, Food Security, and Greenhouse Gas Fluxes in Terrestrial Ecosystems; Shukla, P.R., Skea, J., Buendia, E.C., Masson-Delmotte, V., Pörtner, H.-O., Roberts, D.C., Zhai, P., Slade, R., Connors, S., van Diemen, R., et al., Eds.; Cambridge University Press: Cambridge, UK; New York, NY, USA, 2019. [Google Scholar] [CrossRef]
  9. Smiraglia, D.; Cavalli, A.; Giuliani, C.; Assennato, F. The Increasing Coastal Urbanization in the Mediterranean Environment: The State of the Art in Italy. Land 2023, 12, 1017. [Google Scholar] [CrossRef]
  10. Official Journal L 034, Protocol on Integrated Coastal Zone Management in the Mediterranean 04/02/2009 P. 0019–0028. Available online: https://eur-lex.europa.eu/legal-content/EN/TXT/?uri=CELEX:22009A0204(01) (accessed on 24 September 2023).
  11. Egidi, G.; Cividino, S.; Vinci, S.; Sateriano, A.; Salvia, R. Towards local forms of sprawl: A brief reflection on Mediterranean urbanization. Sustainability 2020, 12, 582. [Google Scholar] [CrossRef]
  12. Lagarias, A.; Sayas, I. Urban sprawl in the Mediterranean: Evidence from coastal medium-sized cities. Reg. Sci. Inq. 2018, December 2018, 15–32. [Google Scholar]
  13. Soto, M.T.R.; Clavé, S.A. Second homes and urban landscape patterns in Mediterranean coastal tourism destinations. Land Use Policy 2017, 68, 117–132. [Google Scholar] [CrossRef]
  14. Mejjad, N.; Rossi, A.; Pavel, A.B. The coastal tourism industry in the Mediterranean: A critical review of the socio-economic and environmental pressures & impacts. Tour. Manag. Perspect. 2022, 44, 101007. [Google Scholar] [CrossRef]
  15. Kizos, T.; Tsilimigkas, G.; Karampela, S. What Drives Built-Up Area Expansion on Islands? Using Soil Sealing Indicators to Estimate Built-Up Area Patterns on Aegean Islands, Greece. Tijdschr. Voor Econ. En Soc. Geogr. 2017, 108, 836–853. [Google Scholar] [CrossRef]
  16. Simpson, M.C.; Gössling, S.; Scott, D.; Hall, C.M.; Gladin, E. Climate Change Adaptation and Mitigation in the Tourism Sector: Frameworks, Tools and Practices; UNEP, University of Oxford, UNWTO, WMO: Paris, France, 2008. [Google Scholar]
  17. UNEP/MAP—United Nations Environment Programme/Mediterranean Action Plan. State of play of tourism in the Mediterranean: A Roadmap for a Greener, Inclusive & Resilient Tourism in the Mediterranean. Sustainable Tourism Community-Interreg Med. 2022. Available online: https://planbleu.org/wp-content/uploads/2022/11/EN_VF_stateoftourism_PLANBLEU.pdf (accessed on 24 September 2023).
  18. Lagarias, A.; Stratigea, A. Coastalization patterns in the Mediterranean: A spatiotemporal analysis of coastal urban sprawl in tourism destination areas. Geo. J. 2023, 88, 2529–2552. [Google Scholar] [CrossRef]
  19. Romano, B.; Zullo, F. The urban transformation of Italy’s Adriatic coastal strip: Fifty years of unsustainability. Land Use Policy 2014, 38, 26–36. [Google Scholar] [CrossRef]
  20. Liziard, S. Littoralisation de l’Arc latin: Analyse spatio-temporelle de la répartition de la population à une échelle fine. Espace Popul. Soc. 2013, 1, 21–40. [Google Scholar] [CrossRef]
  21. Membrado, J.C.; Huete, R.; Mantecón, A. Urban sprawl and northern European residential tourism in the Spanish Mediterranean coast. Tour. Rev. 2016, 10. [Google Scholar] [CrossRef]
  22. Colaninno, N.; Cerda, J.F.; Roca, J. Spatial patterns of land use: Morphology and demography, in a dynamic evaluation of urban sprawl phenomena along the Spanish Mediterranean coast. In Proceedings of the European Regional Science Association Congress-51st European Congress of the Regional Science Association International, Barcelona, Spain, 30 August–2 September 2011; pp. 1–18. [Google Scholar]
  23. Malerba, A.; Castro Noblejas, H.; Sortino Barrionuevo, J.F.; Mérida Rodríguez, M. Urban Transformation of the Coastline from a Landscape Perspective. Analysis of Cases on the Costa del Sol (Spain). In INTERNATIONAL SYMPOSIUM: New Metropolitan Perspectives; Springer International Publishing: Cham, Switzerland, 2022; pp. 1671–1682. [Google Scholar]
  24. Hof, A.; Blázquez-Salom, M. The Linkages between Real Estate Tourism and Urban Sprawl in Majorca (Balearic Islands, Spain). Land 2013, 2, 252–277. [Google Scholar] [CrossRef]
  25. Wolff, C.; Nikoletopoulos, T.; Hinkel, J.; Vafeidis, A. Future urban development exacerbates coastal exposure in the Mediterranean. Sci. Rep. 2020, 10, 14420. [Google Scholar] [CrossRef] [PubMed]
  26. Vardopoulos, I.; Ioannides, S.; Georgiou, M.; Voukkali, I.; Salvati, L.; Doukas, Y.E. Shaping Sustainable Cities: A Long-Term GIS-Emanated Spatial Analysis of Settlement Growth and Planning in a Coastal Mediterranean European City. Sustainability 2023, 15, 11202. [Google Scholar] [CrossRef]
  27. Braičić, Z.; Lončar, J. Economic-geographic analysis of differentiated development in croatian coastal region. J. Geogr./Rev. Za Geogr. 2015, 10, 7–24. [Google Scholar]
  28. Kranjčević, J.; Hajdinjak, S. Tourism urbanization in Croatia. The cases of Poreč in Istria and Makarska in Dalmatia. Comp. Southeast Eur. Stud. 2019, 67, 393–420. [Google Scholar] [CrossRef]
  29. Sarantakou, E.; Terkenli, T. Non-Institutionalized Forms of Tourism Accommodation and Overtourism Impacts on the Landscape: The Case of Santorini, Greece. Tour. Plan. Dev. 2019, 16, 411–433. [Google Scholar] [CrossRef]
  30. Panousi, S.; Petrakos, G. Overtourism and tourism carrying capacity—A regional perspective for Greece. In Culture and Tourism in a Smart, Globalized, and Sustainable World; Katsoni, V., Ciná van Zyl, C., Eds.; Springer: Cham, Switzerland, 2021; pp. 215–229. [Google Scholar] [CrossRef]
  31. Lagarias, A.; Stratigea, A.; Theodora, Y. Overtourism as an emerging threat for sustainable island communities–Exploring indicative examples from the South Aegean Region, Greece. In Proceedings of the International Conference on Computational Science and Its Applications, Athens, Greece, 3–6 July 2023; Springer Nature: Cham, Switzerland, 2023; pp. 404–421. [Google Scholar] [CrossRef]
  32. Vandarakis, D.; Malliouri, D.; Petrakis, S.; Kapsimalis, V.; Moraitis, V.; Hatiris, G.A.; Panagiotopoulos, I. Carrying Capacity and Assessment of the Tourism Sector in the South Aegean Region. Greece. Water 2016, 15, 2616. [Google Scholar] [CrossRef]
  33. Lagarias, A.; Zacharakis, I.; Stratigea, A. Assessing the coastal vs hinterland divide by use of multitemporal data: Case study in Corinthia, Greece. Eur. J. Geogr. 2022, 13, 001–026. [Google Scholar] [CrossRef]
  34. Wang, J.; Chen, J.; Wen, Y.; Fan, W.; Liu, Q.; Tarolli, P. Monitoring the coastal wetlands dynamics in Northeast Italy from 1984 to 2016. Ecol. Indic. 2021, 129, 107906. [Google Scholar] [CrossRef]
  35. Theodora, Y.; Stratigea, A. Climate Change and Strategic Adaptation Planning in Mediterranean Insular Territories: Gathering Methodological Insights from Greek Experiences. In Proceedings of the Computational Science and Its Applications–ICCSA 2021: 21st International Conference, Cagliari, Italy, 13–16 September 2021; Proceedings, Part X 21, 2021. Springer International Publishing: Cham, Switzerland, 2021. [Google Scholar] [CrossRef]
  36. Minetos, D.; Polyzos, S.; Sdrolias, L. Features and spatial analysis of illegal housing in Greece. Trans. Line 2017, 1, 86–107. [Google Scholar]
  37. Yoyas, N. Illegal constructions in the post-memorandum Greece: Changes and constants in a chronic phenomenon. Reg. Sci. Inq. 2018, 10, 153–161. [Google Scholar]
  38. Kousis, M. Marine and Coastal Issues in Local Environmental Conflict: Greece, Spain, and Portugal1. In Contesting the Foreshore Tourism, Society, and Politics on the Coast; Boissevain, J., Selwyn, T., Eds.; Amsterdam University Press: Amsterdam, The Netherlands, 2004. [Google Scholar]
  39. Evelpidou, N.; Petropoulos, A.; Karkani, A.; Saitis, G. Evidence of Coastal Changes in the West Coast of Naxos Island, Cyclades, Greece. J. Mar. Sci. Eng. 2021, 9, 1427. [Google Scholar] [CrossRef]
  40. García-Ayllón, S. La Manga case study: Consequences from short-term urban planning in a tourism mass destiny of the Spanish Mediterranean coast. Cities 2015, 43, 141–151. [Google Scholar] [CrossRef]
  41. Rodríguez-Santalla, I.; Navarro, N. Main Threats in Mediterranean Coastal Wetlands. The Ebro Delta Case. J. Mar. Sci. Eng. 2021, 9, 1190. [Google Scholar] [CrossRef]
  42. Atik, M.; Altan, T.; Artar, M. Land Use Changes in Relation to Coastal Tourism Developments in Turkish Mediterranean. Pol. J. Environ. Stud. 2010, 19, 21–33. [Google Scholar]
  43. Briguglio, L.; Avellino, M. Overtourism, Environmental Degradation and Governance in Small Islands with Special Reference to Malta. In Shaping the Future of Small Islands; Palgrave Macmillan: Singapore, 2021; pp. 301–322. [Google Scholar] [CrossRef]
  44. European Environmental Agency (EEA). Urban Adaptation to Climate Change in Europe, Report No 2/2012; European Environmental Agency (EEA): Copenhagen, Denmark, 2012. [Google Scholar]
  45. Baker, E.; Sevaldsen, P.; Kurvits, T. The State of the Mediterranean Marine and Coastal Environment; Grid-Arendal: Tyholmen, Norway, 2013; Available online: https://policycommons.net/artifacts/2390445/the-state-of-the-mediterranean-marine-and-coastal-environment/3411769/ (accessed on 24 September 2023).
  46. Leka, A.; Lagarias, A.; Panagiotopoulou, M.; Stratigea, A. Development of a Tourism Carrying Capacity Index (TCCI) for sustainable management of coastal areas in Mediterranean islands–Case study Naxos, Greece. Ocean Coast. Manag. 2022, 216, 105978. [Google Scholar] [CrossRef]
  47. European Environmental Agency (EEA). Land and Soil in Europe. Why We Need to Use These Vital and Finite Resources Sustainability; European Environmental Agency (EEA): Copenhagen, Denmark, 2019. [Google Scholar] [CrossRef]
  48. Communication from the Commission to the European Parliament, the European Council, the Council, the European Economic and Social Committee and the Committee of the Regions. EU Soil Strategy for 2030-Reaping the Benefits of Healthy Soils for People, Food, Nature and Climate. COM(2021)699. Available online: https://eur-lex.europa.eu/legal-content/EN/TXT/?uri=CELEX:52021DC0699 (accessed on 24 September 2023).
  49. Communication from the Commission to the European Parliament, the European Council, the Council, the European Economic and Social Committee and the Committee of the Regions. Proposal for a Regulation of the European Parliament and of the Council on Nature Restoration; COM(2022)304. Available online: https://eur-lex.europa.eu/legal-content/EN/TXT/?uri=CELEX:52022PC0304 (accessed on 24 September 2023).
  50. UNFCCC; CBD; IISD; GIZ; UNEP; SwedBio. Promoting Synergies between Climate Change Adaptation and Biodiversity through the National Adaptation Plan (NAP) and National Biodiversity Strategies and Action Plan (NBSAP) Processes; United Nations Climate Change Secretariat: Bonn, Germany, 2022. [Google Scholar]
  51. Bauer, M.E.; Loffelholz, B.C.; Wilson, B. Estimating and mapping impervious surface area by regression analysis of Landsat imagery. In Remote Sensing of Impervious Surfaces; CRC Press: Boca Raton, FL, USA, 2007; pp. 31–48. ISBN 9780429138768. [Google Scholar]
  52. El Garouani, A.; Mulla, D.J.; El Garouani, S.; Knight, J. Analysis of urban growth and sprawl from remote sensing data: Case of Fez, Morocco. Int. J. Sustain. Built Environ. 2017, 6, 160–169. [Google Scholar] [CrossRef]
  53. Jat, M.K.; Garg, P.K.; Khare, D. Monitoring and modelling of urban sprawl using remote sensing and GIS techniques. Int. J. Appl. Earth Obs. Geoinf. 2008, 10, 26–43. [Google Scholar] [CrossRef]
  54. Kuang, W. Mapping global impervious surface area and green space within urban environments. Sci. China Earth Sci. 2019, 62, 1591–1606. [Google Scholar] [CrossRef]
  55. Torbick, N.; Corbiere, M. Mapping urban sprawl and impervious surfaces in the northeast United States for the past four decades. GISci. Remote Sens. 2015, 52, 746–764. [Google Scholar] [CrossRef]
  56. Zhou, Y.; Wang, Y.Q. An Assessment of Impervious Surface Areas in Rhode Island. Northeast Nat. 2007, 14, 643–650. [Google Scholar] [CrossRef]
  57. Xian, G.; Klaver, L.Y.; Hossain, N. Measuring urban sprawl and extent through multitemporal. US Geol. Surv. 2006, 1726, 57. [Google Scholar]
  58. Ghazaryan, G.; Rienow, A.; Oldenburg, C.; Thonfeld, F.; Trampnau, B.; Sticksel, S.; Jürgens, C. Monitoring of urban sprawl and densification processes in western Germany in the light of SDG indicator 11.3. 1 based on an automated retrospective classification approach. Remote Sens. 2021, 13, 1694. [Google Scholar] [CrossRef]
  59. Li, J.; He, L.; Dai, J.; Li, X.; Fu, Q. Urban Sprawl Study Based on Impervious Surface Percent. Remote Sens. Technol. Appl. 2008, 23, 424–427. [Google Scholar] [CrossRef]
  60. Salvati, L. The spatial pattern of soil sealing along the urban-rural gradient in a Mediterranean region. J. Environ. Plan. Manag. 2014, 57, 848–861. [Google Scholar] [CrossRef]
  61. Salvati, L. Soil sealing, population structure and the socioeconomic context: A local-scale assessment. Geo. J. 2016, 81, 77–88. [Google Scholar] [CrossRef]
  62. Fox, D.; Youssaf, Z.; Adnès, C.; Delestre, O. Relating imperviousness to building growth and developed area in order to model the impact of peri-urbanization on runoff in a Mediterranean catchment (1964–2014). J. Land Use Sci. 2019, 14, 210–224. [Google Scholar] [CrossRef]
  63. Tombolini, I.; Zambon, I.; Ippolito, A.; Grigoriadis, S.; Serra, P.; Salvati, L. Revisiting “Southern” Sprawl: Urban Growth, Socio-Spatial Structure and the Influence of Local Economic Contexts. Economies 2015, 3, 237–259. [Google Scholar] [CrossRef]
  64. Lagarias, A.; Prastacos, P. Comparing the urban form of South European cities using fractal dimensions. Environ. Plan. B Urban Anal. City Sci. 2020, 47, 1149–1166. [Google Scholar] [CrossRef]
  65. Salvati, L.; Carlucci, M. The way towards land consumption: Soil sealing and polycentric development in Barcelona. Urban Stud. 2016, 53, 418–440. [Google Scholar] [CrossRef]
  66. Salvati, L.; Quatrini, V.; Barbati, A.; Tomao, A.; Mavrakis, A.; Serra, P.; Sabbi, A.; Merlini, P.; Corona, P. Soil occupation efficiency and landscape conservation in four Mediterranean urban regions. Urban For. Urban Green. 2016, 20, 419–427. [Google Scholar] [CrossRef]
  67. Gramaglia, C.; Salles, C.; Rio, M.; Tournoud, M.G. Reducing the imperviousness of urban soils: A way of improving the quality of runoff that is struggling to impose itself in the Mediterranean area (No. IAHS2022-432). In Proceedings of the Copernicus Meetings, Montpellier, France, 29 May–3 June 2022. [Google Scholar]
  68. Ferreira, C.S.; Walsh, R.P.; Steenhuis, T.S.; Ferreira, A.J. Effect of peri-urban development and lithology on streamflow in a Mediterranean catchment. Land Degrad. Dev. 2018, 29, 1141–1153. [Google Scholar] [CrossRef]
  69. Mehr, A.D.; Akdegirmen, O. Estimation of urban imperviousness and its impacts on flashfloods in Gazipaşa, Turkey. Knowl.-Based Eng. Sci. 2021, 2, 9–17. [Google Scholar] [CrossRef]
  70. Morabito, M.; Crisci, A.; Guerri, G.; Messeri, A.; Congedo, L.; Munafò, M. Surface urban heat islands in Italian metropolitan cities: Tree cover and impervious surface influences. Sci. Total Environ. 2021, 751, 142334. [Google Scholar] [CrossRef]
  71. Andreu, V.; Gimeno-García, E.; Pascual, J.; Vazquez-Roig, P.A.; Picó, Y. Presence of pharmaceuticals and heavy metals in the waters of a Mediterranean coastal wetland: Potential interactions and the influence of the environment. Sci. Total Environ. 2016, 540, 278–286. [Google Scholar] [CrossRef]
  72. Kati, V.; Kassara, C.; Vrontisi, Z.; Moustakas, A. The biodiversity-wind energy-land use nexus in a global biodiversity hotspot. Sci. Total Environ. 2021, 768, 144471. [Google Scholar] [CrossRef]
  73. Communication from the Commission to the European Parliament, the Council, the European Economic and Social Committee and the Committee of the Regions—Roadmap to a Resource Efficient Europe, COM(2011) 571 final, 2011. Available online: https://eur-lex.europa.eu/legal-content/EN/TXT/?uri=CELEX%3A52011DC0571 (accessed on 24 September 2023).
  74. Communication from the Commission to the European Parliament, the Council, the European Economic and Social Committee and the Committee of the Regions—Green Infrastructure (GI): Enhancing Europe’s Natural Capital, COM(2013) 249 final, 2013. Available online: https://eur-lex.europa.eu/legal-content/EN/TXT/?uri=celex%3A52013DC0249 (accessed on 24 September 2023).
  75. González-García, A.; Palomo, I.; Arboledas, M.; González, J.A.; Múgica, M.; Mata, R.; Montes, C. Protected areas as a double edge sword: An analysis of factors driving urbanisation in their surroundings. Glob. Environ. Chang. 2022, 74, 102522. [Google Scholar] [CrossRef]
  76. SIOSE, National Technical Team, High Resolution Land Cover/Land Use Information System in Spain (HR SIOSE) Technical Document, Dirección Gral. del Instituto Geográfico Nacional. Subdirección Gral. de Cartografía y Observación del Territorio. Available online: http://www.siose.es/SIOSEtheme-theme/documentos/pdf/D0_220615_HR_SIOSE_Technical_Document_v1_EN.pdf\ (accessed on 24 September 2023).
  77. Gounaridis, D.; Chorianopoulos, I.; Koukoulas, S. Exploring prospective urban growth trends under different economic outlooks and land-use planning scenarios: The case of Athens. Appl. Geogr. 2018, 90, 134–144. [Google Scholar] [CrossRef]
  78. Tsilimigkas, G.; Gourgiotis, A.; Derdemezi, E.T. Spatial planning incompetence to discourage urban sprawl on Greek Islands. Evidence from Paros, Greece. J. Coast. Conserv. 2022, 26, 11. [Google Scholar] [CrossRef]
  79. Technical Specifications of Local Urban Plans; 3545/B/03.08.2021; Official Government Gazette: Athens, Greece, 2021.
  80. Technical Specifications of Regional Spatial Frameworks of Law 4447/2016 (A’241); 2818/B/17.07.2021; Official Government Gazette: Athens, Greece, 2021.
  81. European Environment Agency (EEA). High Resolution Layers. European Union, Copernicus Land Monitoring Service, 2021. Available online: https://land.copernicus.eu/en/products (accessed on 24 September 2023).
  82. Kleinewillinghöfer, L.; Olofsson, P.; Pebesma, E.; Meyer, H.; Buck, O.; Haub, C.; Eiselt, B. Unbiased Area Estimation Using Copernicus High Resolution Layers and Reference Data. Remote Sens. 2022, 14, 4903. [Google Scholar] [CrossRef]
  83. Langanke, T. Copernicus Land Monitoring Service–High Resolution Layer Imperviousness: Product Specifications Document, Publisher: Copernicus team at EEA (European Environment Agency). 2016. Available online: https://land.copernicus.eu/en/technical-library (accessed on 24 September 2023).
  84. Agardy, T.; Alder, J. Coastal systems. In Ecosystems and Human Well-Being: Current State and Trends; Hassan, R., Scholes, R., Ash, N., Eds.; Island Press: Washington, DC, USA, 2005; Volume 1, pp. 513–549. [Google Scholar]
  85. McGranahan, G.; Balk, D.; Anderson, B. The rising tide: Assessing the risks of climate change and human settlements in low elevation coastal zones. Environ. Urban. 2007, 19, 17–37. [Google Scholar] [CrossRef]
  86. Lagarias, A.; Stratigea, A. High-resolution spatial data analysis for monitoring urban sprawl in coastal zones: A case study in Crete Island. In Proceedings of the Computational Science and Its Applications–ICCSA 2021: 21st International Conference, Cagliari, Italy, 13–16 September 2021; Proceedings, Part X 21. Springer International Publishing: Cham, Switzerland, 2021; pp. 75–90. [Google Scholar] [CrossRef]
  87. BirdLife International. Important Bird and Biodiversity Area (IBA) Digital Boundaries: March 2023 Version; BirdLife International: Cambridge, UK; Available online: http://datazone.birdlife.org/site/requestgis (accessed on 24 September 2023).
  88. Hellenic Statistical Authority, Population-Housing Census. 2021. Available online: https://www.statistics.gr/en/2021-census-pop-hous (accessed on 24 September 2023).
  89. Kartalis, K.; Kokkosis, X.; Filippopoulos, K.; Polydoros, A.; Lappa, K.; Mavrakou, T. Integrating Climate Change in the Transformation of Developmental Model in Greece, Online 2021. Available online: https://www.dianeosis.org/wp-content/uploads/2021/10/Climate_Change_2021.pdf (accessed on 24 September 2023). (In Greek).
  90. European Environmental Agency. Climate Change, Impacts and Vulnerability in Europe; EEA Report 2016, No 1/20172016; European Environmental Agency (EEA): Copenhagen, Denmark, 2016. [Google Scholar]
  91. Dandoulaki, M.; Lazoglou, M.; Pangas, N.; Serraos, K. Disaster Risk Management and Spatial Planning: Evidence from the Fire-Stricken Area of Mati, Greece. Sustainability 2023, 15, 9776. [Google Scholar] [CrossRef]
  92. Ministry of Environment and Energy. National Strategy for Climate Change in Greece. 2016. Available online: https://www.depa.gr/wp-content/uploads/2020/02/06.04.2016-espka-teliko_.pdf (accessed on 24 September 2023). (In Greek)
  93. Marcos, M.; Jorda, G.; Cozannet, G. Sea level rise and its impacts on the Mediterranean. In Jean-Paul Moatti et Stéphane Thiébault (dir.) The Mediterranean Region under Climate Change, a Scientific Update; IRD Éditions: Marseille, France, 2016; pp. 265–275. [Google Scholar] [CrossRef]
  94. Eurosion, 2004, Living with Coastal Erosion in Europe: Sediment and Space for Sustainability PART I-Major Findings and Policy Recommendations of the EUROSION Project (2004). Available online: http://www.eurosion.org/ (accessed on 24 September 2023).
  95. Zambarloukou, S. Greece After the Crisis: Still a south European welfare model? Eur. Soc. 2015, 17, 653–673. [Google Scholar] [CrossRef]
  96. Tulumello, S.; Cotella, G.; Othengrafen, F. Spatial planning and territorial governance in Southern Europe between economic crisis and austerity policies. Int. Plan. Stud. 2020, 25, 72–87. [Google Scholar] [CrossRef]
  97. Hardouvelis, G.; Gkionis, I. A decade long economic crisis: Cyprus versus Greece. Cyprus Econ. Policy Rev. 2016, 10, 3–40. [Google Scholar]
  98. Mitrakos, T. Inequality, Poverty and Social Welfare in Greece: Distributional Effects of Austerity. Released by Bank of Greece 2014, Working Paper 174. Available online: https://ssrn.com/abstract=4184595 (accessed on 24 September 2023). [CrossRef]
  99. Gemenetzi, G. Restructuring Local-Level Spatial Planning in Greece Amid the Recession and Recovery Period: Trends and Challenges. Plan. Pract. Res. 2022, 38, 564–582. [Google Scholar] [CrossRef]
  100. Vitopoulou, A.; Yiannakou, A. Public land policy and urban planning in Greece: Diachronic continuities and abrupt reversals in a context of crisis. Eur. Urban Reg. Stud. 2020, 27, 259–275. [Google Scholar] [CrossRef]
  101. Corella, G.; Othengraphen, F.; Papaioannou, A.; Tulumello, S. Socio-political and socio-spatial implications of the economic crisis and austerity politics in Southern European cities, spatial impacts of the economic crisis. In Cities in Crisis: Socio-Spatial Impacts of the Economic Crisis in Southern European Cities; Knieling, J., Othengrafen, F., Eds.; Routledge: London, UK, 2015. [Google Scholar]
  102. Psycharis, Y.; Kallioras, D.; Pantazis, P. Economic crisis and regional resilience: Detecting the ‘geographical footprint’of economic crisis in Greece. Reg. Sci. Policy Pract. 2014, 6, 121–141. [Google Scholar] [CrossRef]
  103. Institute of Greek Tourism Confederation. Available online: https://insete.gr/ (accessed on 24 September 2023).
  104. Boutsioukis, G.; Fasianos, A.; Petrohilos-Andrianos, Y. The spatial distribution of short-term rental listings in Greece: A regional graphic. Reg. Stud. 2019, 6, 455–459. [Google Scholar] [CrossRef]
  105. Athanassiou, E.; Cholezas, I.; Lychnaras, V.; Skintzi, G. Greek Economic Outlook 2018/37; Centre of Planning and Economic Research (KEPE): Athens, Greece, 2018. [Google Scholar]
  106. Law 4014/2011-Environmental Licensing of Works and Activities, Regulation of Illegal Constructions in Respect to Environmental Balance and Other Arrangements of the Ministry of Environment; Issue Α 209/21.9.2011; OGG (Official Government Gazette): Athens, Greece, 2011. (In Greek)
  107. Law 4178/2013-Confronting of Illegal Construction: Environmental Balance and Other Arrangements; Issue A 174/08.08.2013; OGG (Official Government Gazette): Athens, Greece, 2013. (In Greek)
  108. Law 4495/2017-Control and Protection of Built Environment and Other Arrangements; Issue A’167/3-11-2017; OGG (Official Government Gazette): Athens, Greece, 2017. (In Greek)
  109. Asprogerakas, E.; Melissas, D. Reflections on the hierarchy of the spatial planning system in Greece (1999–2020). Int. Plan. Stud. 2023. [Google Scholar] [CrossRef]
  110. Papageorgiou, M. Spatial planning in transition in Greece: A critical overview. Eur. Plan. Stud. 2017, 25, 1818–1833. [Google Scholar] [CrossRef]
  111. Vezyriannidou, S.; Portokalidis, K. Special Spatial Plans VS Local Spatial Plans. Towards a new vision of planning system at the local level in Greece, during the period of economic crisis. RELAND Int. J. Real Estate Land Plan. 2018, 1, 402–408. [Google Scholar]
  112. Law 3894/2010-Acceleration and Transparency for the Implementation of Strategic Investments; Issue A 204/2.12.2010; OGG (Official Government Gazette): Athens, Greece, 2010. (In Greek)
  113. Law 4269/2014-Regional and Urban Planning Reform–Sustainable Development; Issue A 142/28.6.2014; OGG (Official Government Gazette): Athens, Greece, 2014. (In Greek)
  114. Law 4447/2016-Spatial Planning, Sustainable Development and Other Provisions; Issue A 241/23.12.2016; OGG (Official Government Gazette): Athens, Greece, 2016. (In Greek)
  115. Law 4759/2020-Modernization of Regional and Urban Planning Legislation, and Other Arrangements; Issue A 245/09.12.2020; OGG (Official Government Gazette): Athens, Greece, 2020. (In Greek)
  116. Law 3986/2011–Urgent Measures for the Implementation of the Medium-Term Fiscal Strategy 2012–2015; Issue A 152/1-7-2011; OGG (Official Government Gazette): Athens, Greece, 2011. (In Greek)
  117. Hadjimichalis, C. Crisis and land dispossession in Greece as part of the global ‘land fever’. City 2014, 18, 502–508. [Google Scholar] [CrossRef]
  118. Lazoglou, M.; Serraos, K. Climate change adaptation through spatial planning: The case study of the region of Western Macedonia. IOP Publ. Conf. Ser. Earth Environ. Sci. 2021, 899, 012021. [Google Scholar] [CrossRef]
Figure 1. Mapping of tourism development on Mykonos Island (Greece): the imperviousness dataset (2018) captures the land take more accurately than the building footprint.
Land 12 01844 g001
Figure 2. Incorrect classification in the eastern Attica zone (Greece), with the beach area classified as highly sealed impervious area (sealing degree close to 100%).
Land 12 01844 g002
Figure 3. Methodological steps and GIS methods.
Land 12 01844 g003
Figure 4. Map of the case study area including the regional administrative division (R1–R13 as defined in text), highways, and the network of protected areas.
Land 12 01844 g004
Figure 5. (a) Mean NC and NCR per region plotted against each other. (b) Mean NC plotted against % imperviousness coverage of year 2006.
Land 12 01844 g005
Figure 6. NC index and characteristic locations of (a) industrial activity (Almyros), (b) scattered tourism development (Paros), and (c) organized tourism development and road construction (Costa Navarino resort).
Land 12 01844 g006
Figure 7. (a) NCR index; (b) characterization of coastal sectors based on combined criteria.
Land 12 01844 g007
Figure 8. Tourism-related expansion in Agios Prokopios (Naxos Island), affecting Natura 2000 wetlands and the wildlife sanctuary.
Land 12 01844 g008
Figure 9. The collapse of construction activity in Greece during the economic recession period and the recent “rebound” in highly touristic regions like South Aegean and places like Paros Island (own elaboration of data from the Hellenic Statistical Authority).
Land 12 01844 g009
Table 1. Results per region and coastal subzone (frontline, buffer, and transitional).
RegionNCNCR% Impervious Land
Z1 *Z2 *Z3 *Z1Z2Z3Z1Z2Z3
R1East Macedonia and Thrace0.50.20.14.13.72.711.86.65.0
R2Central Macedonia0.60.30.33.52.42.919.413.89.1
R3Athos (Mon. community)0.20.00.012.720.910.31.50.10.3
R4Epirus0.50.30.45.34.07.29.18.25.6
R5North Aegean0.30.20.16.16.87.86.02.71.9
R6Thessaly0.60.30.25.05.84.411.55.43.6
R7Central Greece0.60.30.36.16.911.210.94.93.2
R8West Greece0.60.60.54.97.19.412.89.26.3
R9South Aegean0.60.30.310.49.710.96.94.03.1
R10Attica1.20.60.54.02.53.130.924.317.1
R11Crete1.00.60.46.75.86.616.010.36.4
R12Peloponnese1.00.60.39.411.49.611.26.13.8
R13Ionian Islands0.70.30.25.14.15.415.27.94.8
GRGreece (mean)0.70.40.35.95.46.212.57.75.3
* Z1: frontline, Z2: buffer, and Z3: transitional.
Table 2. Results regarding protected coastal network.
RegionProtected
Area
(km2)
% of Coastal ZoneImpervious Expansion
(ha)
NCpr *NCRpr *% of Protected Land
Affected
R1East Macedonia and Thrace37958.644.10.125.82.14
R2Central Macedonia27028.30.00.120.12.21
R3Athos (Mon. community)10299.85.20.0512.20.48
R4Epirus19359.934.60.185.63.41
R5North Aegean56247.064.80.129.31.36
R6Thessaly21338.630.80.147.42.10
R7Central Greece38628.280.80.218.82.58
R8West Greece39942.9153.20.3914.03.16
R9South Aegean124653.5150.60.1211.81.14
R10Attica18521.646.80.254.65.78
R11Crete36434.869.00.1913.61.58
R12Peloponnese38731.054.00.147.81.92
R13Ionian Islands24729.169.10.286.44.65
GRGreece (mean)493339.8802.90.178.62.14
* NC and NCR indexes adjusted for areas within the protected network.
Disclaimer/Publisher’s Note: The statements, opinions and data contained in all publications are solely those of the individual author(s) and contributor(s) and not of MDPI and/or the editor(s). MDPI and/or the editor(s) disclaim responsibility for any injury to people or property resulting from any ideas, methods, instructions or products referred to in the content.

