Article

Optimization of Microclimate Conditions Considering Urban Morphology and Trees Using ENVI-Met: A Case Study of Cairo City

by
Ahmed Yasser Abdelmejeed
1,2,* and
Dietwald Gruehn
1
1
Research Group—Landscape Ecology and Landscape Planning (LLP), Department of Spatial Planning, TU Dortmund University, 44227 Dortmund, Germany
2
Faculty of Urban and Regional Planning, Cairo University, Cairo 11562, Egypt
*
Author to whom correspondence should be addressed.
Land 2023, 12(12), 2145; https://doi.org/10.3390/land12122145
Submission received: 3 November 2023 / Revised: 2 December 2023 / Accepted: 6 December 2023 / Published: 9 December 2023

Abstract

:
This research aims to optimize the use of trees to enhance microclimate conditions, which has become necessary because of climate change and its impacts, especially for cities suffering from extreme heat stress, such as Cairo. It considers elements of urban morphology, such as the aspect ratio and orientation of canyons, which play an important role in changing microclimate conditions. It also considers both sides of each canyon because the urban shading is based on the orientation and the aspect ratio, which can provide good shade on one side of the canyon but leave the other side exposed to direct and indirect radiation, to ensure a complete assessment of how the use of trees can be optimized. As Cairo city is very large and has a variety of urban morphologies, a total of 144 theoretical cases have been tested for Cairo city using ENVI-met to cover the majority of the urban cases within the city (Stage 1). Then, the same tree scenarios used in the theoretical study are applied to an existing urban area in downtown Cairo with many urban morphology varieties to validate the results of the theoretical study (Stage 2). After testing all cases in both stages, it became very clear that the addition of trees cannot be the same for the different aspect ratios, orientations, and sides of the different canyons. For example, eastern roads should have more trees than other orientations for all aspect ratios, but the required number of trees is greater for the northern side than the southern side, as the southern side is partially shaded for a few hours of the day by buildings in moderate and deep canyons. Northern streets require a very limited number of trees, even in shallow canyons, on both sides. The correlation between the number of trees on each side for the different orientations and aspect ratios shows a strong negative relationship, but the correlation values change between the different sides and orientations. The results of applying trees to an existing urban area show almost the same results as the theoretical study’s results, with very slight differences occurring because of the irregularity of the existing study area. This proves that when adding trees, not only the aspect ratio and orientation but also the side of each canyon should be considered to ensure that pedestrians, in all cases, have better microclimate conditions and that the use of trees is optimized.

1. Introduction

1.1. Heat Stress and UHI Appearance and Causes

Cities grow over many decades with different urban fabrics and morphologies, and they continue to evolve in various shapes to meet their populations’ growing needs. Because of rapid expansion and increases in population density, cities absorb more heat and suffer from heat stress and the effects of urban heat islands (UHIs), which disturb human health [1]. Cities’ centers have been observed to be hotter than their suburbs. This is due to urban areas absorbing and trapping longwave radiation, which supports UHIs [2]. In one study, the air and surface temperatures in city centers were higher than those in suburban areas by 5.0 to 5.5 C° [3]. In another study conducted in downtown Cairo, an increase of 0.5 to 3.5 C° in the surface temperature was observed and reached 10 C° as the maximum difference in comparison to the suburbs [4,5]. The urban climate is an important issue pertaining to local and global climates, and it is influenced by several urban design factors, such as urban morphology and density, properties of urban surfaces, and different types of vegetation cover [6]. The process of trapping longwave radiation mainly controls UHIs. When buildings are taller and streets are narrower, urban canyons absorb less longwave radiation; however, they trap the absorbed heat [2]. Distance from the city center, surface albedo, aspect ratio, and vegetation density are major predictors of the UHI response. In one study, it was found that every 500 m increase in the distance from the city center reduced the interurban heat island by 0.13 C°. Increasing the surface albedo by 0.01 decreased the UHI by 0.18 C°, whereas increasing the vegetation density ratio by 0.10 yielded a 0.17 C° reduction in the UHI. A 10% increase in the aspect ratio increased the UHI by 0.17 C° [7].

1.2. Urban Morphology Relating to Urban Shading and PET Parameters

Urban morphology, sky view factor (SVF), and shading are the major factors that have a significant role in enhancing microclimate conditions and reducing UHI effects [2,8]. The shadow-cast effect produced by buildings helps reduce pedestrian radiant load and, consequently, improves thermal comfort, especially in high-density cities, although ventilation is reduced [9,10]. Shallow canyons are susceptible to worse thermal conditions than their deeper counterparts with similar aspect ratio values [9]. Asymmetrical streets are better than low, symmetrical streets at enhancing wind flow and blocking solar radiation [11]. Increasing the SVF in the selection of an urban configuration reduces UHI intensity [12]. Deep urban canyons can reduce the amount of direct solar radiation during the daytime. Therefore, the level of thermal comfort in an open space (i.e., high SVF) is lower than that in a shaded space (i.e., low SVF) [13]. The results of the analysis prove that thermal comfort is mainly affected by exposure to solar radiation [14]. In conclusion, shading from direct radiation is more important than the increase in absorbed radiation due to urban reflectance.
The physiological equivalent temperature (PET) meteorological parameters (air temperature, wind speed, radiant temperature, and humidity) [15] can be controlled and enhanced using urban morphology. The mean radiant temperature (TMRT) is a key meteorological parameter governing human energy balance and is used to evaluate the thermal comfort of humans [16]. The target is to keep the TMRT below 45 C° [8]. Air temperature and specific humidity have emerged as the least effective, suggesting that urban configurations can alter their values only to a limited extent [10,17]. The outdoor thermal comfort level significantly depends on the speed and direction of the urban wind flow [18]. Wind speed has been widely reported to have an influence on urban heating, and there is a strong negative correlation between wind speed and air temperature [19]. All of these PET meteorological parameters, along with urban shading and SVF, can be optimized using urban morphology and urban geometry elements, such as by adjusting the street canyon aspect ratio and orientation, in addition to using different densities of vegetation [10,16,20,21].

1.2.1. Aspect Ratio Effect

The aspect ratio (AR), or a canyon’s height-to-width ratio (H/W), is an important parameter that is usually used to investigate the influence of urban geometry on an outdoor environment, especially temperature and building energy demand [17,22]. The aspect ratio is the dominant factor for daily net solar radiation gains on road and wall surfaces. The effects of shadows on surrounding buildings are also important factors for the radiation environment in urban street canyons [23], as the enhancement of shade due to increased H/W ratios is capable of producing significant reductions in the PET [16,24]. There is a strong relationship between UHIs and the aspect ratio during the night, as the effect of the street canyon on UHI intensity is significant. According to one study conducted in the city of Basel, Switzerland, the intensity of the maximum nighttime UHI has a linear relationship with the SVF, which is controlled by the aspect ratio [25]. In addition, the lowest daytime mean radiant temperatures result from the high aspect ratios of streets. Air temperatures decrease slightly with an increase in aspect ratios, but the radiation fluxes expressed by the mean radiant temperature are, by far, more decisive [26].
In Osaka, the daily net solar radiation gains are large for roads in which the aspect ratio is greater than approximately 1.5 (H/W). Roads in which the aspect ratio is between 1.0 and 1.5 (H/W) are also in the target range for effective urban heat island mitigation measures, and particular attention is needed for the north sides of east–west roads and the centers of north–south roads [23]. In Malaysia, for the six asymmetrical aspect ratios of Putrajaya Boulevard, an aspect ratio of 2–0.8, which reduces the temperature of surfaces by 10 to 14 C° and the air by 4.7 C°, is recommended for enhancing the boulevard’s microclimates and mitigating tropical heat islands. In the northeast to southwest direction, aspect ratios of 0.8–2 reduce the morning microclimate and night heat islands, yet the negative effects during the day are greater than the positive effects during the nighttime [11]. Along Wall Street, New York City, the outcomes of winter and summer analyses show high values of daytime air temperatures along the widest street canyon (aspect ratio = 0.33) [27]. In the center of Camagüey, Cuba, aspect ratios higher than one are advisable, as they contribute to improving the thermal conditions of courtyards in the summer. When the aspect ratio of a courtyard is H/W = 0.5, no variations in the TMRT are obtained when using different orientations because most of the courtyards have surfaces that are exposed to direct solar radiation during the critical period of the day (11:00 h and 14:00 h), and particular subzones of the courtyard that are adjacent to the surrounding facades are more comfortable than the central subzone, increasing the aspect ratio from 0.5 to 3 and reducing the TMRT by 15.7 C° [8]. An increase of 0.5 in the aspect ratio’s values can decrease the maximum mean radiant temperature by 2.90 C° on average in the early morning and late afternoon and, consequently, decrease the PET [17]. Regarding the impact of the AR on UHIs, streets featuring a lower aspect ratio have a high frequency of heat stress in the daytime but low PET in the nighttime [10]. Comparing both east–west- and north–south-oriented streets against surface temperature measurements in Tokyo, it was found that the shading effect of a tall building in north–south street canyons had less of an impact on solar gains than that in east–west streets. Tall buildings and narrow canyons reduce the SVF and increase the amount of shaded area on the surface, resulting in lower temperatures in canyons during the daytime but higher temperatures at night [24].

1.2.2. Street Orientation Effect

Street orientation is considered to play an influential role in altering the microclimate in urban areas, and it influences the exposure of canyon surfaces to direct solar radiation. A north–south (N–S) street orientation will be fully exposed to solar radiation at midday but mostly shaded in the early morning and late afternoon. This is contrary to an east–west (E–W) street orientation, which is fully exposed in the early morning and late afternoon [17,22,28,29]. North–south-oriented streets are cooler than those with an east–west orientation, and the comfort level in these areas increases along with their H/W ratio [20], because east–west-oriented canyons are exposed to sunlight throughout the day regardless of their H/W ratio, whereas north–south-oriented canyons are only exposed to sunlight during certain times of the day [20]. One study conducted on urban heat island mitigation measures found that the top priorities are the north side of east–west roads and the center of north–south roads [23]. The NW–SE orientation shows a slightly lower PET level than N–S and E–W orientations [30]. It has been found that an orientation angle between 30° and 60° with wind direction and a canyon aspect ratio of 2.5 can reduce the PET value by 5 to 9 C° throughout most of the study area during midafternoon on a summer day [18].
In a study conducted in Sydney [17], it was concluded that streets situated on the north–south axis offer a superior level of thermal comfort than east–west-oriented streets. The PET values presented a comfortable range of 12.33% during the daytime; streets on the NE–SW axis provided the highest level of thermal comfort, on average at 24.95%, and the worst option was evaluated as the NW–SE orientation. As the duration of solar exposure and the average mean radiant temperature (TMRT) increase, mainly because the wind velocity decreases, outdoor users face a lack of thermal satisfaction.

1.2.3. Combined Effect of Aspect Ratio and Street Orientation

The orientation and canyon aspect ratio have a profound influence on the urban microclimate that directly impacts street-level thermal comfort, as PETs at the street level strongly depend on the aspect ratio and street orientation [14,18,28,29,30]. Street geometry and orientation influence the amount of solar radiation received by street surfaces, as well as the airflow in urban canyons [6]. For E–W orientations, streets with an H/W greater than two should be fully shadowed only during the hottest and coolest months of the year [20]. Streets on the E–W axis present the worst conditions for all H/W ratios (up to 3.0). An increase in the H/W ratio on an E–W street does not improve PET levels [14]. It is difficult to mitigate the heat stress along an E–W-oriented street. The walls provide only a limited amount of shading, even for proportions with an H/W ratio of 4:1. In comparison, an N–S orientation combined with a high aspect ratio, equal to or greater than an H/W ratio of 2:1, provides a much better thermal environment with lower PET maxima and shorter periods of high stress [14,20]. Thermal stress can be reduced in a street canyon with a northwest–southeast orientation combined with an aspect ratio of at least 1.5, and these street configurations can reduce heat stress, increase the frequency of comfortable thermal conditions, and enable solar access throughout the year in the midlatitudes [10]. An orientation angle of 30–60° in the wind direction and a canyon aspect ratio of 2.5 can reduce PETs by 5–9 C° during the midafternoon on a summer day [20].

1.2.4. Urban Trees

The effectiveness of trees in enhancing daytime thermal comfort decreases as urban density increases and vice versa at night [9,22]. Urban trees can reduce the effects of the surrounding building mass and help create a low-SVF environment that is cooler during both daytime and nighttime [13]. It has been demonstrated that urban morphology and urban vegetation shading affect solar radiation storage during the day in the summer, and urban shading significantly contributes to UHI mitigation [13]. Significant temperature differences between vegetated and non-vegetated areas have been observed, which can be explained by both the shading and evapotranspiration effects of trees [31]. As a rule, on summer days, outdoor activities in unshaded areas are not recommended between 10:00 h and 15:00 h. Therefore, the provision of shade, using canopies and vegetation, is necessary if outdoor activities are to occur during this time of day [8]. In open-set high-rise urban areas, the presence of trees could produce a relevant reduction in thermal stress at the pedestrian level [30]. Trees can be considered as a solution to improve the thermal condition of streets, especially in streets designed along nonoptimal orientations with low-rise buildings [17]. In a previous study, an area that was at an angle of 30° from the north with an aspect ratio of 1.0 was found to not require any plantings, as a continuous shaded zone was created by the buildings along both streets in the parallax and perpendicular directions. However, decreasing the aspect ratio creates a need for shade-providing trees for the streets in the perpendicular direction, as the distance between the buildings increases [18]. A study [14] demonstrated that trees have a much more considerable effect on E–W streets. The reduction in PET values is very significant, especially for the side of the street facing south. Increasing 10% of the urban vegetation can reduce Ta and MRT throughout the entire day and nighttime by up to 0.8 C° [16]. PET has been found to be approximately 10 C° lower under trees than in green areas (38 C°) and at least 25 C° lower than in enclosed areas (48 C°) [10]. Increasing the density of vegetation in shallow urban canyons (H/W = 0.5) increased PET enhancement by more than 4% compared with low-density vegetation in the same urban canyon [17].

1.3. Cairo City: The Case Study

1.3.1. Cairo City’s Climate

Cairo is in a subtropical climatic region with a dry climate. During summer (June to August), it is hot and dry with a maximum mean temperature of 28 C° [5]. Cairo city receives an enormous amount of solar radiation, which causes the city to experience massive heat stress.

1.3.2. City Urban Morphology

The Greater Cairo Metropolitan Area boasts the largest urban area in Africa and ranks as the 11th largest city in the world [4]. A study found that Cairo’s land cover was 233.78 km2 in 1973, growing to 557.87 km2 in 2006, which means that it has more than doubled in size, and the rate of urbanization is 9.8 km2 per year [32]. Figure 1 shows its rapid urban growth over 22 years on both agricultural and desert land [33]. A total area of 187.32 km2 of agricultural lands has been lost because of this urban expansion [32]. The New Urban Community Authority considers 25% of Cairo to be informal, but some research considers 50% or 66.6% of Cairo to be informal [34]. This formal and informal rapid growth has increased the city’s density and size, in addition to creating different urban morphologies and fabrics (i.e., different aspect ratios, from very shallow to shallow, moderate, deep, and very deep) as shown in Figure 2, which react in different ways to the meteorological parameters, creating different microclimate conditions inside the different urban canyons.

1.4. Research Gap and Target

This research aimed to optimize the integration of many different urban morphologies (with varying aspect ratios and orientations) and urban trees (low and high densities) to understand the correlation between them and maximize the enhancement of the microclimate conditions for the case study (i.e., Cairo city). The objectives of this research were not only to fill the gaps in the understanding of different urban canyons and how they respond to harsh microclimate conditions but also how to integrate various urban canyons with different densities of urban trees, as well as how these trees would perform inside different urban canyons. In addition, as previous studies mostly focused on the enhancement of the whole canyon, in this study, the main focus is on the sides of different canyons, as they are quite important because canyon sides are the places where people walk, sit, and stand, while the rest of the canyon is mainly for vehicles. The findings of this research should help urban designers and landscape architects choose an aspect ratio, street orientation, and tree density from an urban climate point of view while developing urban projects in Greater Cairo.

2. Materials and Methods

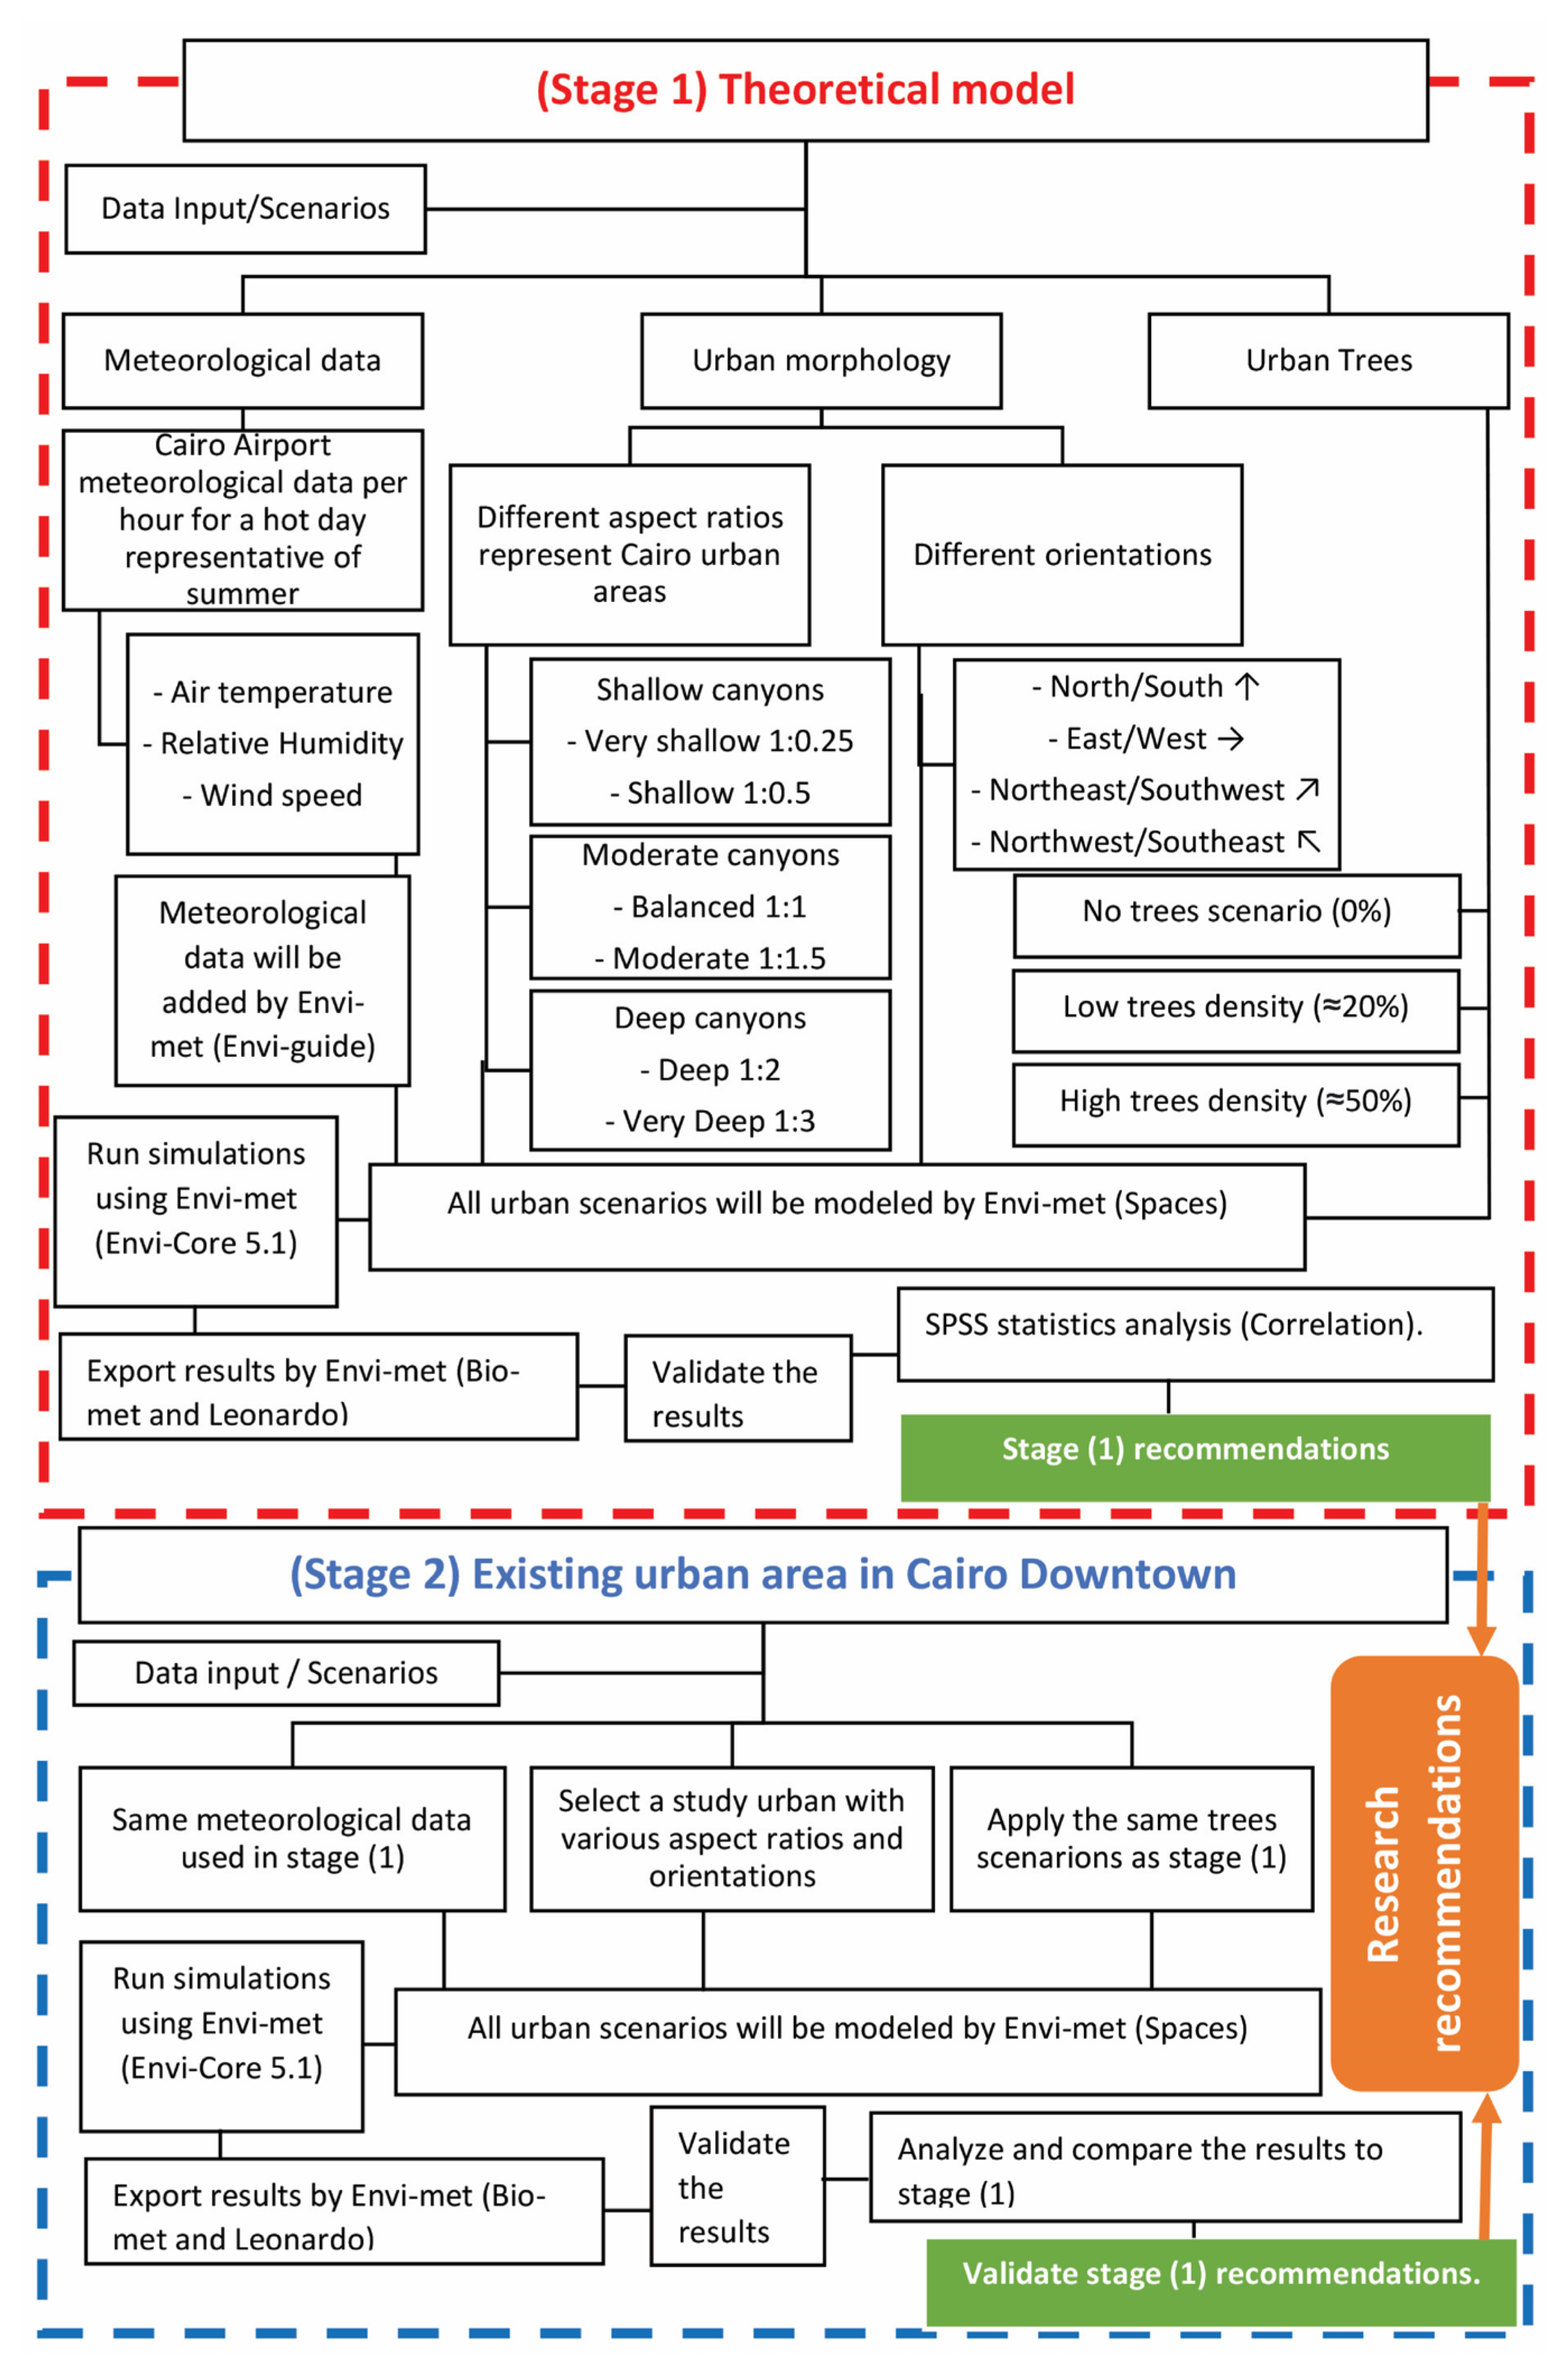
To achieve the research target, a study analyzing and testing the urban morphology’s characteristics with and without different tree densities was conducted. The method of testing and analyzing the relationship was performed in two stages, as shown in Figure 3. Stage one was the creation of a theoretical model representing the different common urban canyons in Cairo city along different orientations. This model was tested first without trees and then with different tree densities. Stage two involved testing the theoretical model’s outcomes when applied to an existing case study in downtown Cairo with similar aspect ratios and orientations. For a better understanding of the relationship and to go further in depth regarding the details of the urban canyons, this study conducted both stages on both sides of the urban canyon; this will help to understand how both sides of an urban canyon (i.e., where people are walking) react to climate conditions and how changing the aspect ratio and orientation, as well as adding different tree densities, will impact the thermal comfort and the UHI effects at the pedestrian level on each side. Studying both sides of a street provides more accurate and detailed results because in some canyons, one side is shaded by buildings but the other is totally exposed to direct sun radiation [35], which affects the control and optimization of the number of added trees; this is in line with water efficiency approaches, which is quite important in Egypt’s case, as it suffers from water scarcity [36].

2.1. Stage (1): Theoretical Model

In Stage One, a theoretical model was developed representing the different aspect ratios and orientations that are very common in Cairo city (Step a). Then, tree scenarios were applied to the base case (Step b) to understand the effects of the trees after comparing the results of both steps.

2.1.1. Stage (1): Step (a) Theoretical Model (Base Case)

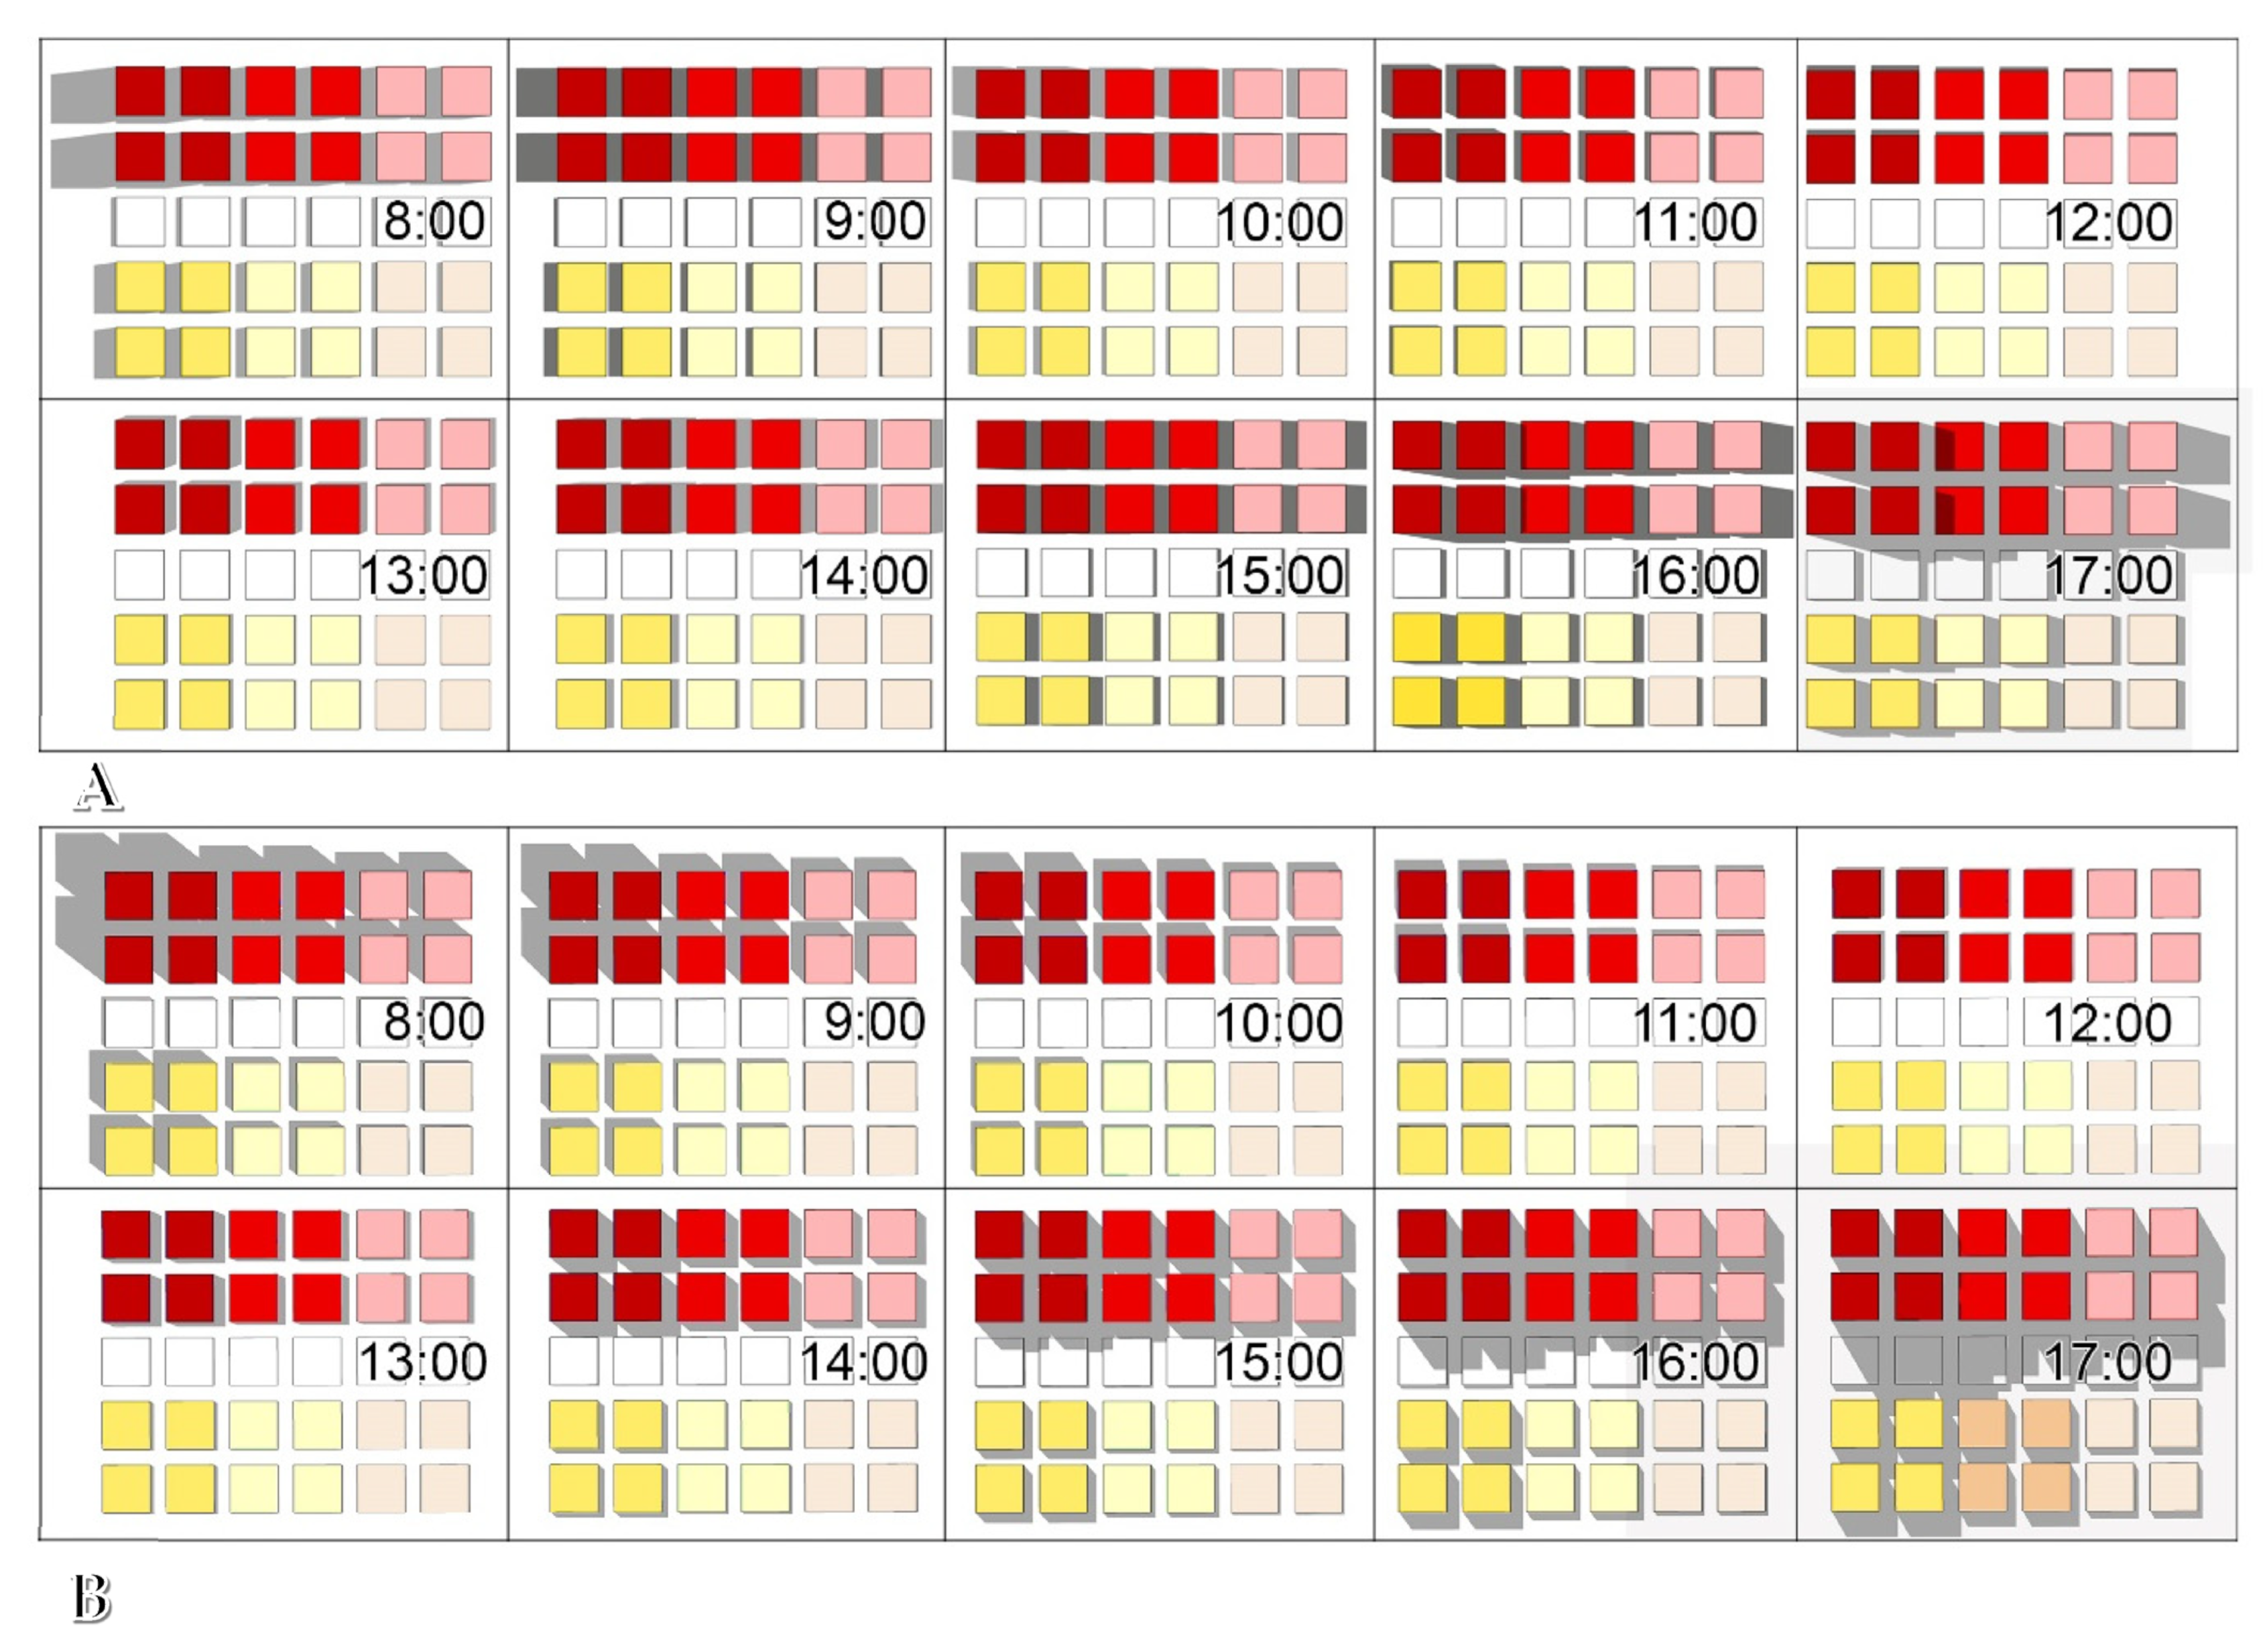
The range of aspect ratios that were evaluated varied between very shallow and very deep, and six aspect ratios were developed and evaluated (3:1, 2:1, 1:1.5, 1:1, 0.5:1, and 0.25:1), which covers the majority of the various urban canyons in Cairo city. The six aspect ratios developed were oriented to four different orientations every 45 degrees, and the different orientations represented the main orientations (i.e., north–south, east–west, northeast–southwest, and northwest–southeast); that is, the total number of cases in the theoretical model base case was 24. Figure 4 shows the base case of the theoretical model, and Figure 5 shows the shading analysis for the different aspect ratios and orientations. As the aim was to understand how each urban canyon reacts and performs, each side of an urban canyon was analyzed and compared to fully comprehend each urban canyon using receptors (i.e., measuring points), as shown in Figure 4A; hence, the total number of cases in the base case was 48.

2.1.2. Stage (1): Step (b) Tree Scenarios

The tree scenarios were developed and added to the base case to compare the tree results to the base case results without trees to understand the effect of the trees on every street on each side. Two tree scenarios were developed that represented two tree densities (low tree density ≈ 20%; high tree density ≈ 50%), as shown in Figure 6. The total number of cases after adding the tree scenarios, in addition to the base case scenarios, was 144 (base cases = 48; tree scenario cases = 96), as shown in Table 1, which is sufficient for comparing various urban cases with different aspect ratios and orientations, as well as for the integration of different tree scenarios. The tree scenarios were applied to all urban canyons with different aspect ratios and orientations, and both street canyon sides were measured for all the tree scenarios.

2.1.3. Result Measurement

The results for both sides of a canyon in each scenario were compared to better comprehend the performance and the relationship between different urban canyons and trees. This comparison provides extensive information to aid urban planners and landscape architects in making decisions during the development of urban areas in Cairo city, particularly after implementing the findings in an existing urban area (Stage 2) in downtown Cairo.

2.2. Stage (2): Existing Case Study

The purpose of this section is to assess an existing urban area and compare its findings with those of the theoretical model. This will help validate the results of the theoretical model, which is highly symmetrical and uniform; however, in reality, urban areas, especially in old city zones, are not that uniform. Thus, comparing the results of both theoretical and existing case studies will provide insight into the tolerance and accuracy of the findings. This evidence can then be used to apply the research recommendations.

2.2.1. Study Area Location and Urban Characteristics

The selected study area should be located in the center of Cairo city so that it will be under the influence of the UHI and represent the urban density of the city downtown [4,5]. The selected study area, located in Khedival Cairo, in the city’s downtown area, has varying street widths due to its hierarchical road systems, resulting in different aspect ratios and orientations. These urban varieties make the case study suitable for studying and representing the majority of urban cases in the theoretical study. Figure 7 illustrates the selected study area’s location and urban characteristics.
As depicted in Figure 7B and Table 2, the study area contains numerous urban varieties that offer many different cases for comparison with the theoretical model. This study encompassed streets with different widths from 10 m for local pedestrian streets to 40 m for major roads within the study area (Rameses St., S1), with different building heights per street, leading to many aspect ratios ranging from 0.5:1 to 2:1, as shown in Table 2. In addition, the study area’s streets have four urban orientations, as shown in Figure 7C and Table 2, providing urban canyons with various orientations (N–S, E–W, NE–SW, and NW–SE), covering all orientations in the theoretical model. This large variety within the study area aided in representing and validating the theoretical cases. Table 3 displays the number of theoretical study cases that were covered in the study area, with 12 cases from the theoretical model being covered, representing approximately 75% of the total number of cases after excluding those with very deep and very shallow aspect ratios, which are uncommon in Cairo city. This demonstrates that the study area represented the urban varieties found in the theoretical model well. Furthermore, it was well suited to this research and significantly contributed to the achievement of this study’s objectives. Figure 7D and Table 2 provide information on the streets selected for this study.

2.2.2. Study Area Tree Scenarios

The tree scenarios that were applied to the study area were the same as those in the theoretical model. In total, three different tree scenarios were applied: no trees at 0%, a low density of trees at 20%, and a high density of trees at 50%, as shown in Figure 8. Applying the same tree scenarios as in the theoretical model allowed for a comparison of the impact of the trees in different canyons between the theoretical model and the case study. Because of the presence of both wide and narrow streets in the study area, certain streets (S3, S4, S5, S7, and S8) only had a single row of trees located in the middle of the street. This is because the width of these streets is 10 m, making it impossible to accommodate two rows of trees. Conversely, in streets that are exceptionally wide, such as S1, three rows of trees were planted to achieve 50% tree coverage.

2.3. Data Input, Model Setup, and Measuring Points

The software used to run the simulations for the different cases in the theoretical model and the study area was ENVI-met V5.1, 2022. All required information for the model was provided, representing existing urban configurations (material, soil) of common materials in Cairo, as well as meteorological data.

2.3.1. Model Setup and Geometry

The model’s location was 30.02 latitude and 31.22 longitude. These coordinates were obtained from the ENVI-met V5.1 2022 database by selecting the location of Greater Cairo from the ENVI-met application “Spaces”. As shown in Table 4, for both the theoretical and case study models, the study area’s model was created using the following model geometry: materials, soil, and trees.

2.3.2. Simulation Configuration

The simulation configuration was conducted for a representative summer day (i.e., hottest day of July: 28 July 2022). The air temperature, relative humidity, and wind speed were added to ENVI-met for each hour of the simulated day, and climate data were imported from the Cairo Airport weather station [40,41]. The starting time of the simulation was 1:00 a.m., and the total duration of the simulation was 24 h. ENVI-met simple forcing was used for the metrological data. Output data were extracted every hour and converted using the ENVI-met ‘’Bio-met’’ to calculate the PET values at each receptor for each hour in all scenarios. The different PET values were the main factors in the comparison. They were compared among all scenarios to assess the effect of each scenario. In addition, other main parameters were measured, such as wind speed (WS) and total mean radiant temperature (TMRT). As Figure 9 illustrates, the PET and its parameters were measured at one given point located at the center of each street’s side and centralized between trees to avoid the direct shade of the tree canopies. The receptors were located on both sides of each selected street, exactly in the middle, and for the tree scenarios, they were shifted to be exactly in the middle between trees, helping to ensure that the results would not be affected by the direct shade of the trees and that the results that are compared represent the indirect impact of the tree scenarios.

2.4. Validation of the Results

After comparing the meteorological data measured in Cairo city on the 28th of July [40,41] with the ENVI-met outputs for the potential air temperature and relative humidity for both the theoretical models and the case study model at an empty point located in the center of each model, it was found that there was a good match between the measured data and the output data, as shown in Figure 10a,c. Also, the root mean square error (RMSE) and the index of agreement (d) were calculated for the measured and simulated air temperature and relative humidity, and as shown in Figure 10b,d, the RMSE ranged between 1.04 and 0.662 for the air temperature and between 9.06 and 5.5 for the relative humidity. The index of agreement ranged between 0.977 and 0.993 for air temperature and between 0.903 and 0.974 for relative humidity. This means that all models accurately represented the weather conditions in Cairo city, and the results for the different scenarios and different urban cases are reliable and represent how these canyons would perform in real-life situations.

3. Results

The results are divided into three parts. The first part concerns the theoretical model’s results (Stage 1), which present the results of the different aspect ratios with different orientations with and without applying the tree scenarios. The second part presents the results of the existing study area (Stage 2) and how the different canyons perform with and without trees. The final part is a comparison between both parts to gain a better understanding of the results and validate the results of the theoretical model. The ∆PET, ∆TMRT, and ∆Wind speed were the major parameters in the comparison, as recommended in many studies, because they have the greatest impact on thermal comfort and they change significantly between different types of canyons, both with and without trees [16,17,18].

3.1. Theoretical Model Results

The results are presented in two stages, with the first stage explaining how the different canyons performed by comparing the PET values of each side of the different street canyons with various aspect ratios and orientations, and the second stage comparing the trees’ impact on each side of the street canyons. The purpose of the first stage is to understand how changing the aspect ratio, orientation, and side of the canyon affect thermal comfort and changing PET values before adding trees, as well as to understand which canyons do not need trees and which require the addition of trees.

3.1.1. Stage One: Results for the 0% Tree Scenario

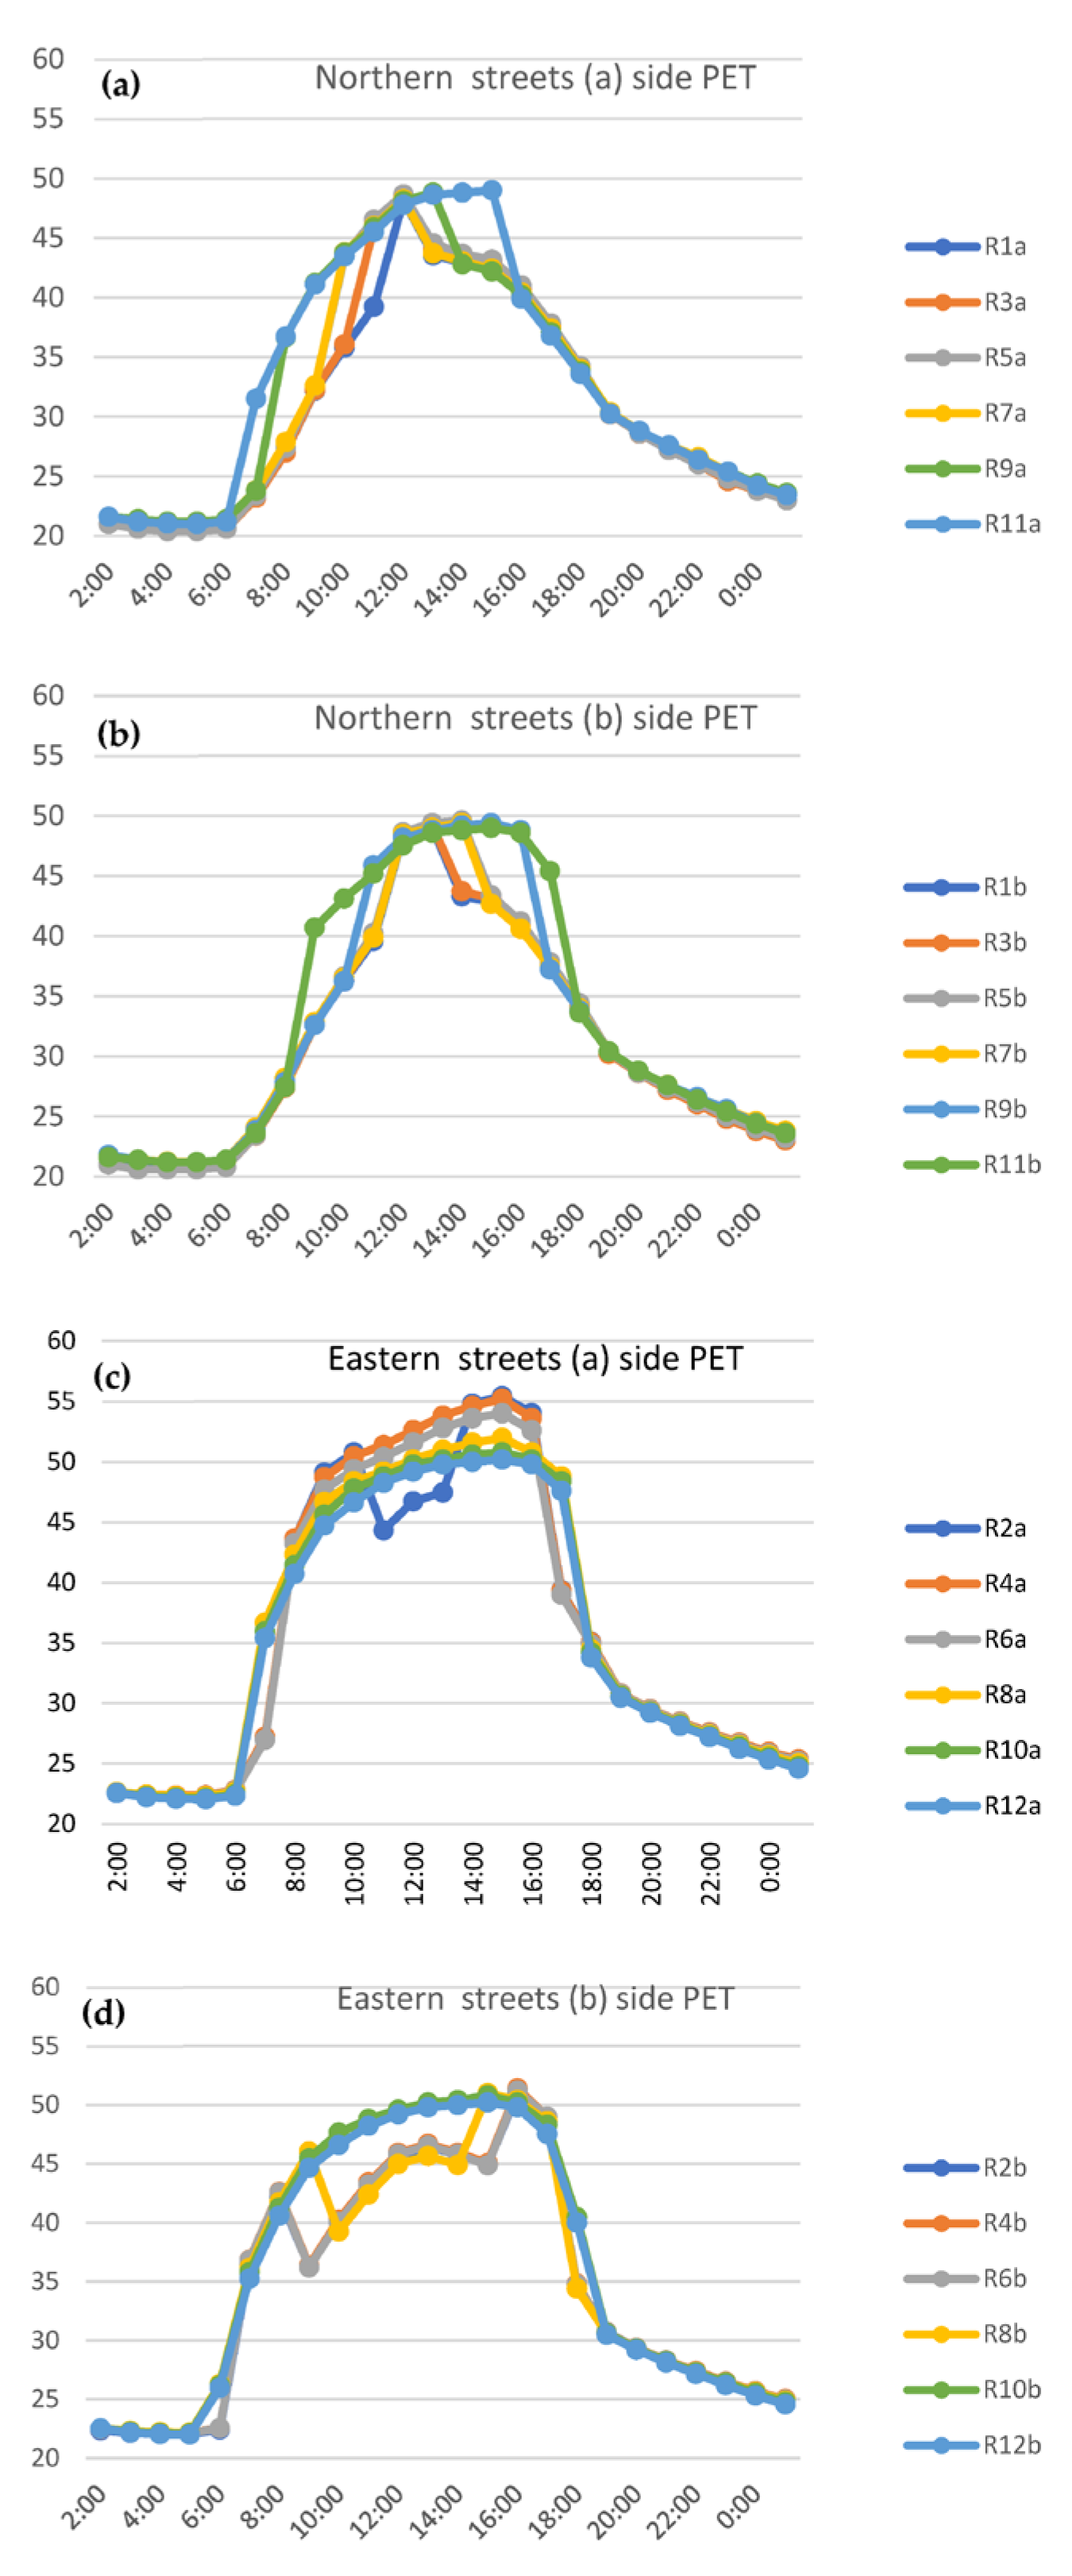
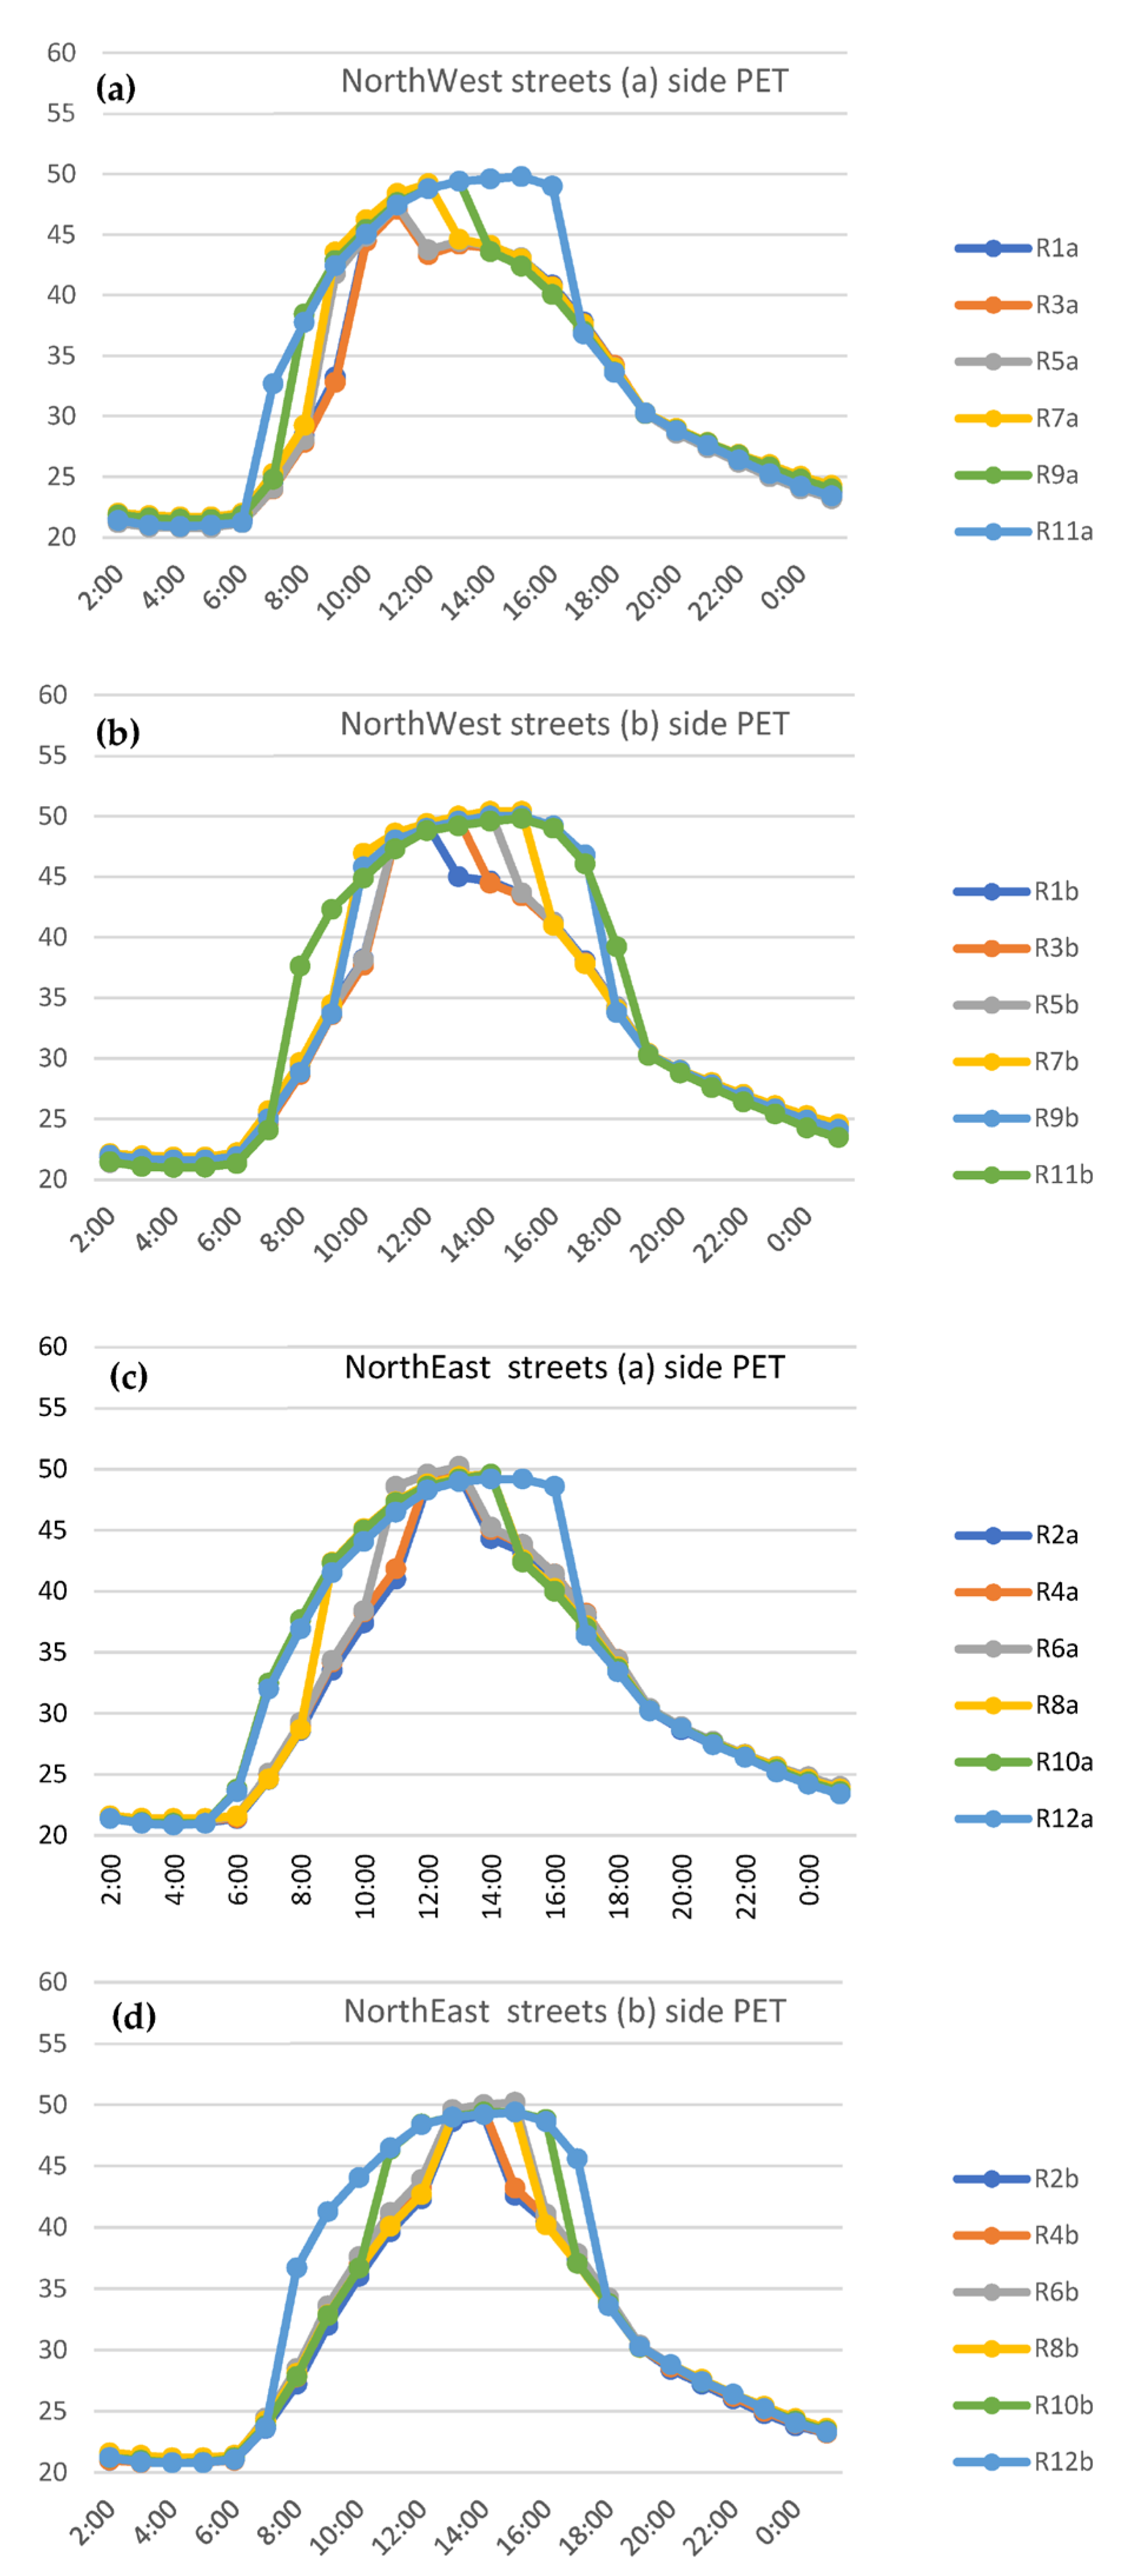
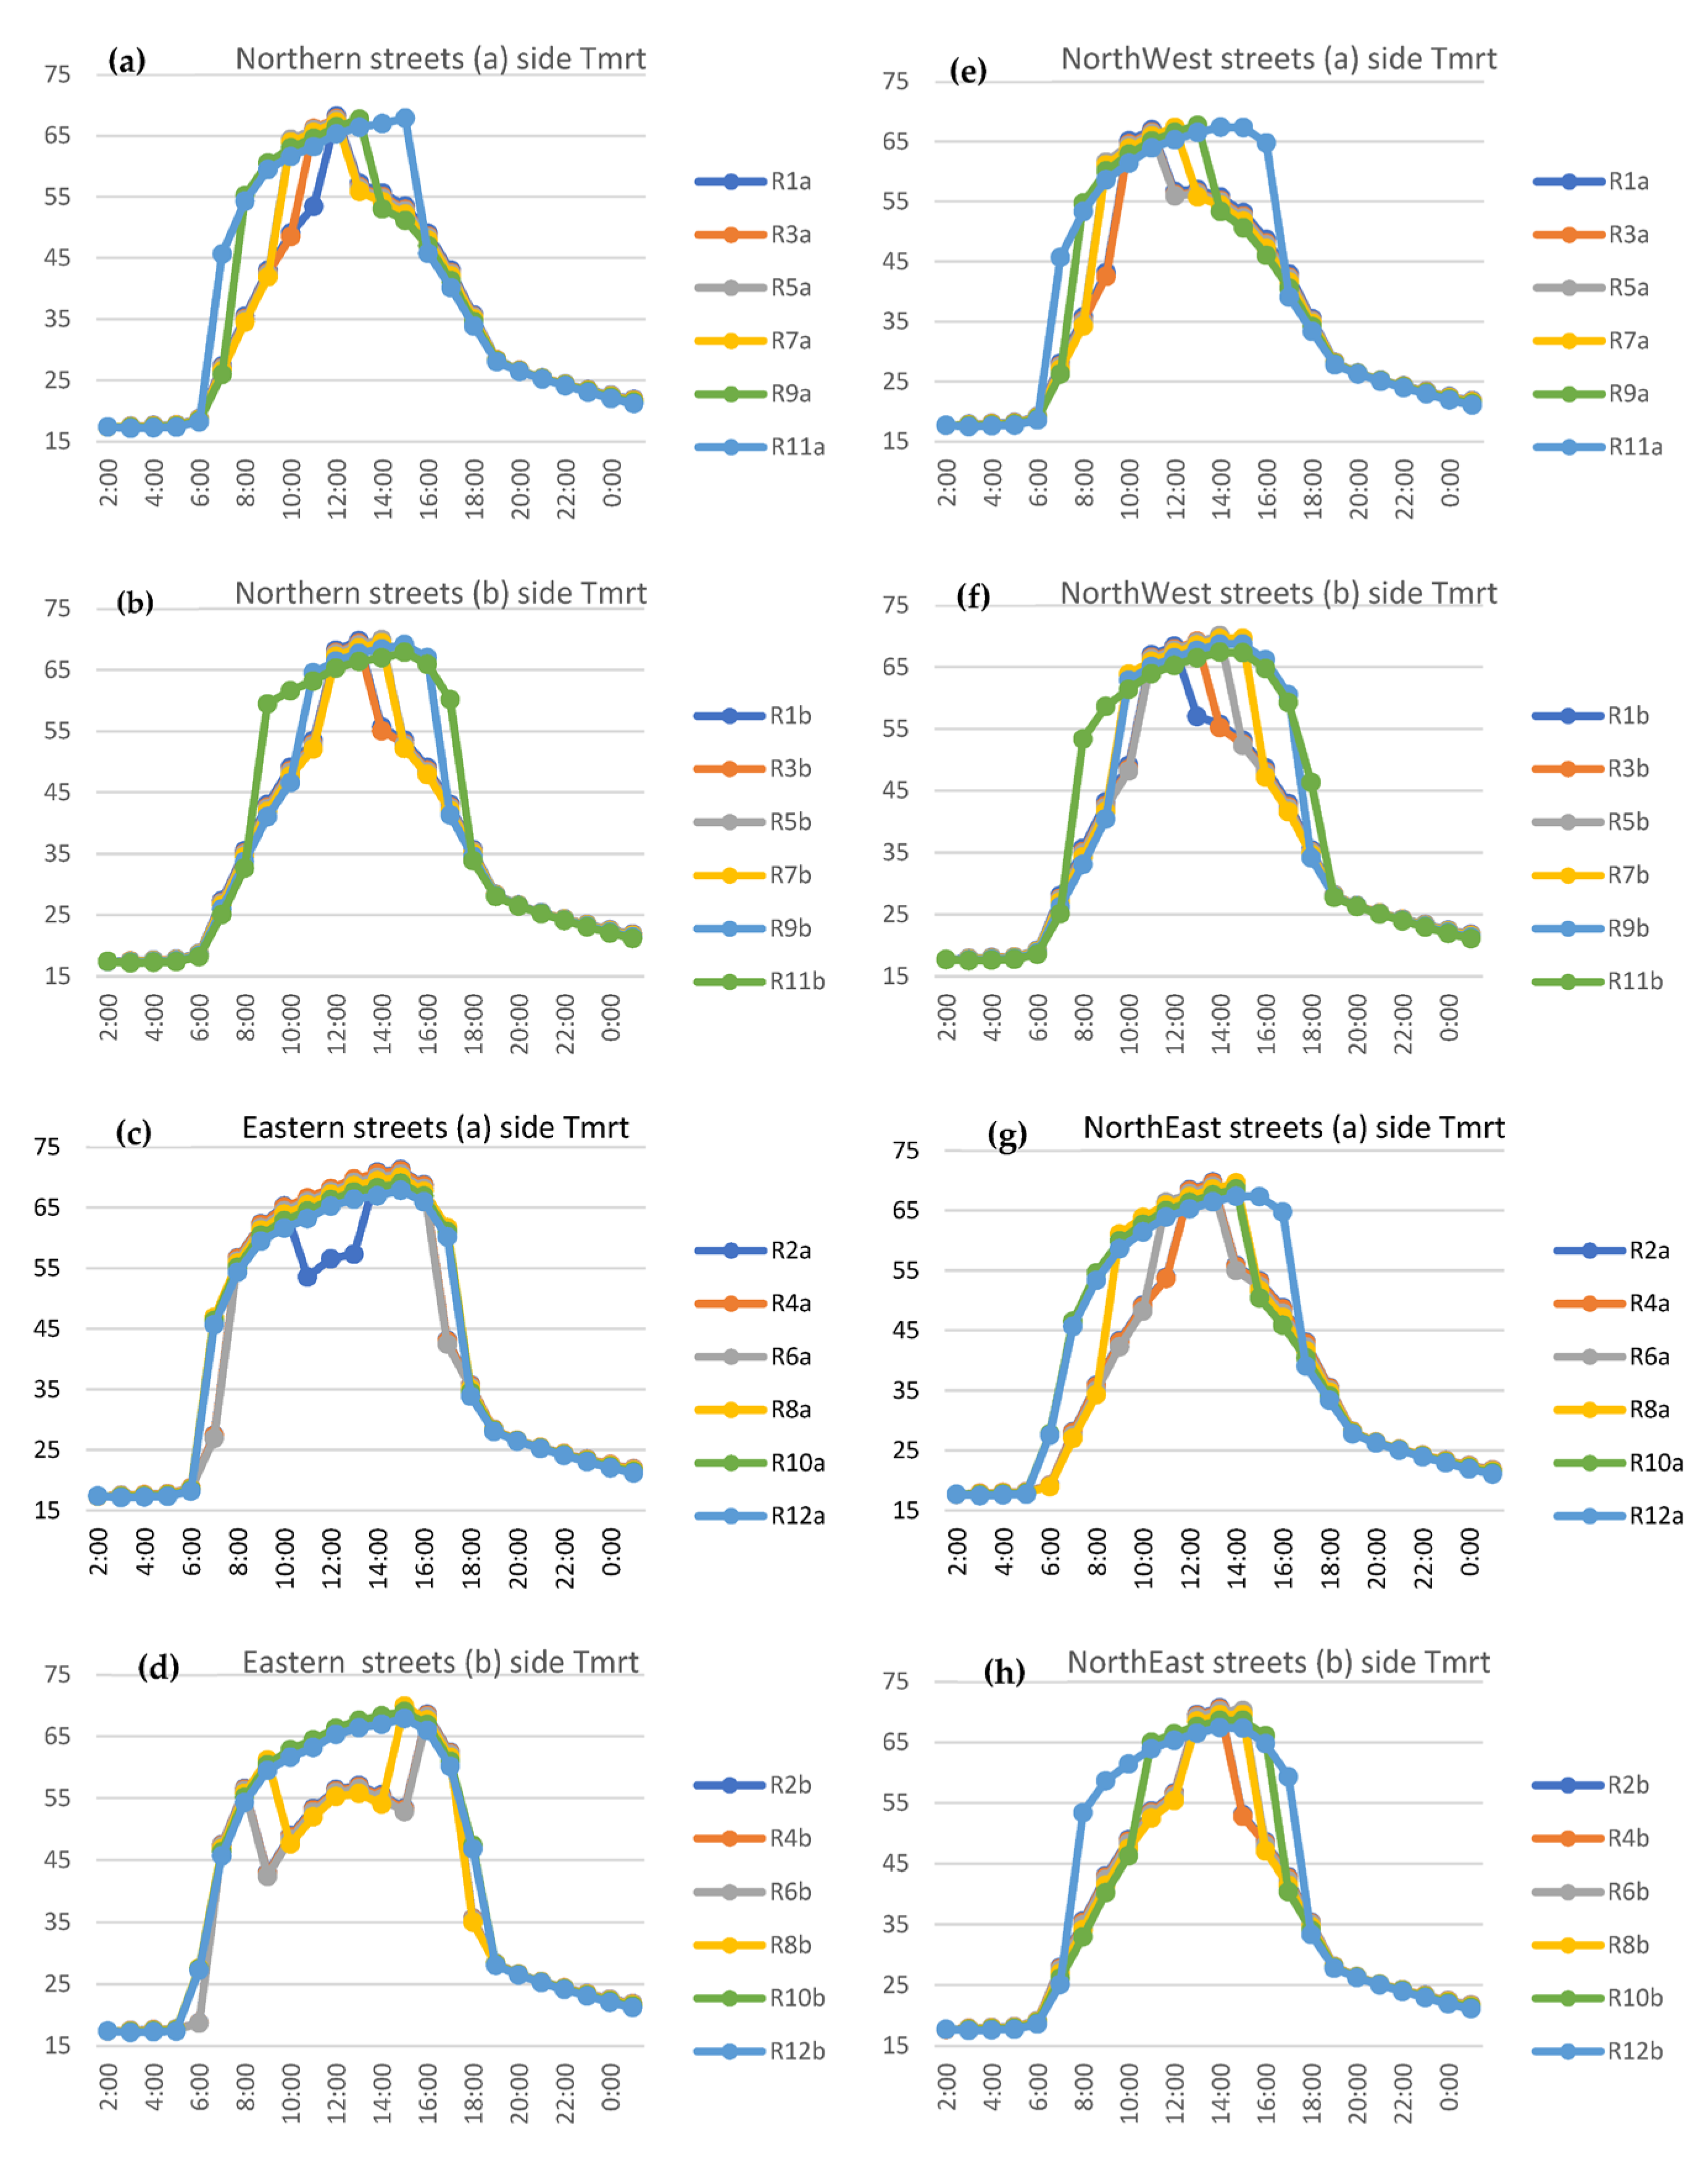
By comparing the PET values for each side of all the urban canyons, as shown in Figure 11 for the northern and eastern canyons and Figure 12 for the northwestern and northeastern canyons, it was found that the PET values varied between the different aspect ratios, orientations, and canyon sides. The worst PET values were measured on the (a) sides of the eastern streets, as shown in Figure 11c,d, where the PET values reached more than 50 C° for all aspect ratios over many hours during the daytime, in addition to reaching the highest PET value of 58 C° (R2a) at 15:00. On the (b) sides of the eastern canyons, the PET values were slightly lower than those on the (a) sides; however, with different aspect ratios, both sides were under extreme heat stress, and the effect of the different aspect ratios in reducing the PET values was very limited, by around 2–3 C°, and only in moderate to deep urban canyons on the (b) side (i.e., R4b, R6b, and R8b). For other orientations, the aspect ratio played an important role in reducing PET values by providing good urban shading, which is increased in moderate and deep canyons. As shown in Figure 11a,b, in the northern canyons, on the (a) street sides, an increase in the aspect ratio reduced the PET by approximately 5 C° in R1a for 4 h, in R3a and R5a for 7 h, in R7a for 6 h, and in R9a for 3 h compared with R11a, which is the shallowest urban canyon. On the (b) side, the impact of the aspect ratio was less than that on the (a) side, as the decrease in PET was lower, both in terms of the value and reduction in the number of hours. As shown in Figure 12a–d, the performance of the different aspect ratios on both sides of the canyon is very good, and the urban shading is very effective, especially for the northwest orientation’s (a and b) sides, as the PET in all cases did not exceed 50 C° and decreased by 5 C° or more with an increase in the aspect ratio. Moreover, the number of hours with a reduced PET increased in R9a,b for 4 h, in R7a,b for 6 h, in R5a,b for 7 h, in R3a,b for 8 h, and in R1a,b for 3 h compared with R11a,b, which is the shallowest canyon. Similar PET enhancements occurred along the northeast orientation on both canyon sides with an increase in the aspect ratio, especially during the afternoon hours, when PET values decreased on average by 5 C° in R2a,b for 8 h, in R4a,b for 9 h, in R6a,b for 7 h, in R8a,b for 7 h, and in R10a,b for 4 h and 2 h compared with the shallowest canyon (R12a,b). In conclusion, the effect of the urban aspect ratio appears clearly in the northern, northeast, and northwest orientations, especially on side (a) for the northern streets and side (b) for the northeast and northwest street canyons.
To better understand the differences in the PETs on each canyon side for the different orientations and aspect ratios, a detailed study of the main PET parameters (total mean radiant temperature (TMRT) and wind speed) [17] was applied to each side of the different street canyons.
As shown in Figure 13, the TMRT values and the charts’ shapes are quite similar to those of the PET charts, which signifies that the PET reduction was mainly driven by the decrease in the TMRT [10]. The highest TMRT values with a limited TMRT reduction via a change in the aspect ratio were measured for the eastern canyons. The reduction on the (a) sides was limited in R2 to 10 C° for 3 h only, and it was slightly better on side (b) for R4, R6, and R8, with the same reduction range of 7 h as in R4 and R6, and for 5 h in R8.
The reduction in the TMRT values was significant in the northern canyons on side (b), northwest canyons on side (b), and northeast canyons on side (b) during the afternoon hours. The reduction exceeded 10 C° for many hours (more than 5 h) in the moderate and deep canyons, and the TMRT reduction decreased gradually as the canyons became shallower. In the northern canyons on side (a), northwest canyons on side (a), and northeast canyons on side (a), the main TMRT reduction took place during the morning to noon hours. The TMRT values decreased by more than 10 C° for many hours, up to 5 h for deep canyons, and the reduction and number of reduction hours gradually decreased with a decrease in the aspect ratio from deep to shallow.
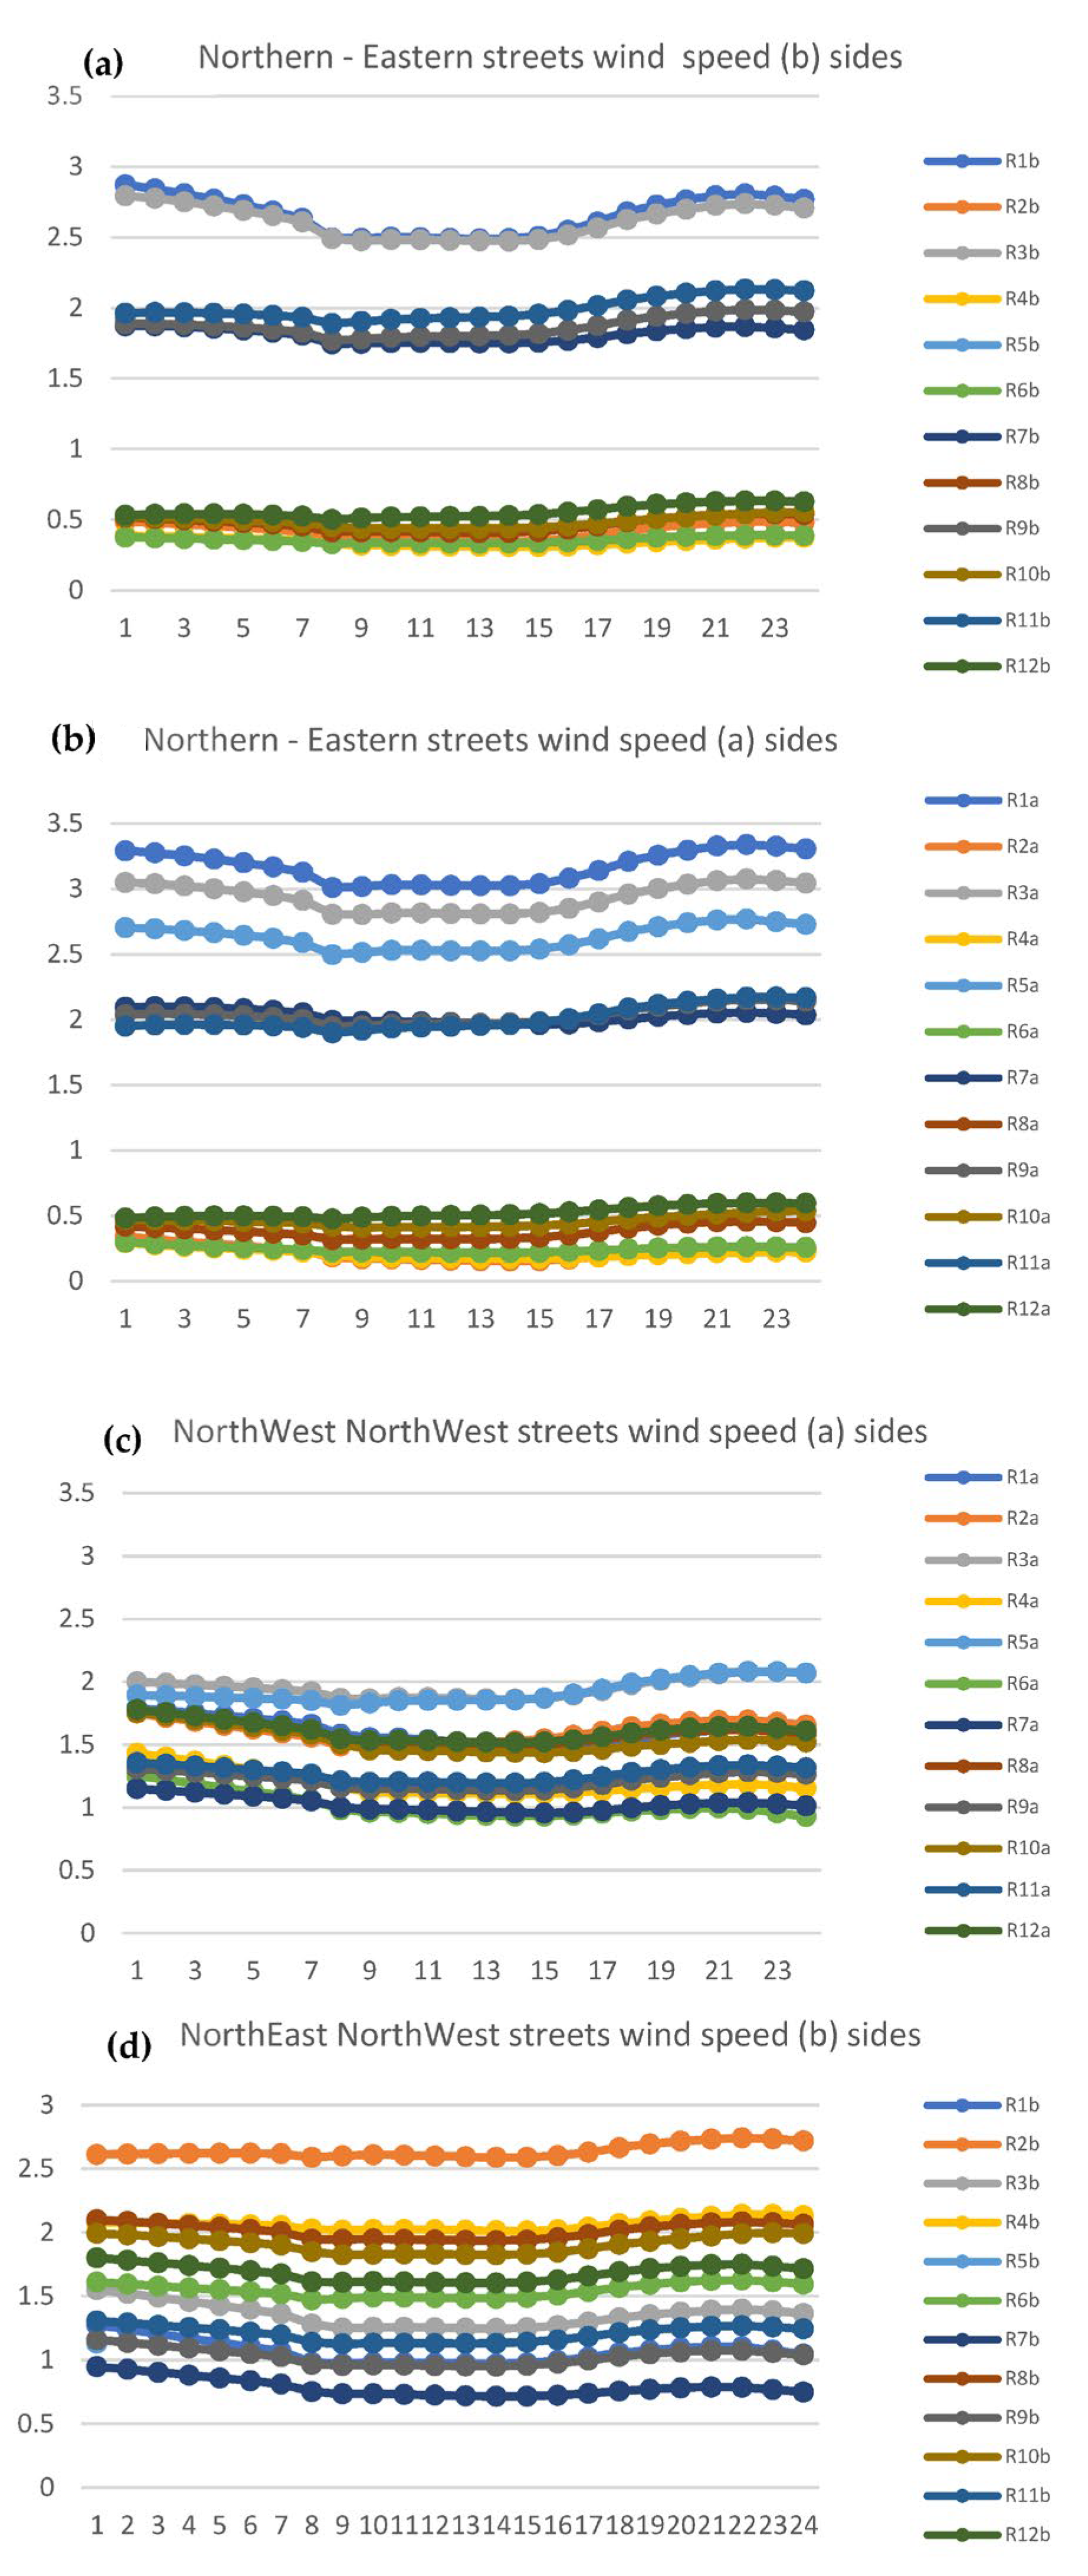
Studying the wind speed values is crucial for gaining a better understanding of the performance of each canyon orientation, as it helps in the investigation and comprehension of the reasons behind the varying PET values and aids in further research on different orientations, aspect ratios, and canyon sides. As shown in Figure 14, the wind speed changed significantly among the different orientations and changed slightly between the different aspect ratios and canyon sides of the same orientation. A significant change in the wind speed primarily occurred between the northern and eastern streets; as shown in Figure 14a,b, the drop in the wind speed was significant, as the values decreased from a range of 3.5 to 2 m/s in the northern streets to a range of 0.6 to 0.2 m/s in the eastern streets for the different aspect ratios and street sides. This large drop clarifies an additional reason for the high PET values in the eastern roads in general. In the northwest and northeast roads, on side (a), the wind speed for all aspect ratios were within the range of 1–2 m/s, which implies that the wind speed for this orientation is within a middle range, which did not significantly differ with a change in any of their orientations (NW or NE). However, on the (b) side of the northeast and northwest orientations, the difference in the range of wind speed increased from 1 to 2.8 m/s, and the highest value was measured for the northeast orientations.
By measuring the TMRT and wind speed for the different aspect ratios and orientations on both canyon sides, the reason behind the difference in the PET values is elaborated: the urban shading based on the sun’s path and angle in relation to the aspect ratio is not significant along the eastern roads on both sides; however, it is very significant in the northern, northwest, and northeast on side (b) during the afternoon hours. It has a good impact on the northern, northeast, and northwest canyons on side (a) during the morning to noon hours. Also, the wind speed is very low or almost non-noticeable on the eastern roads. However, it is strong on northern roads and moderate in the northeast and northwest canyons.
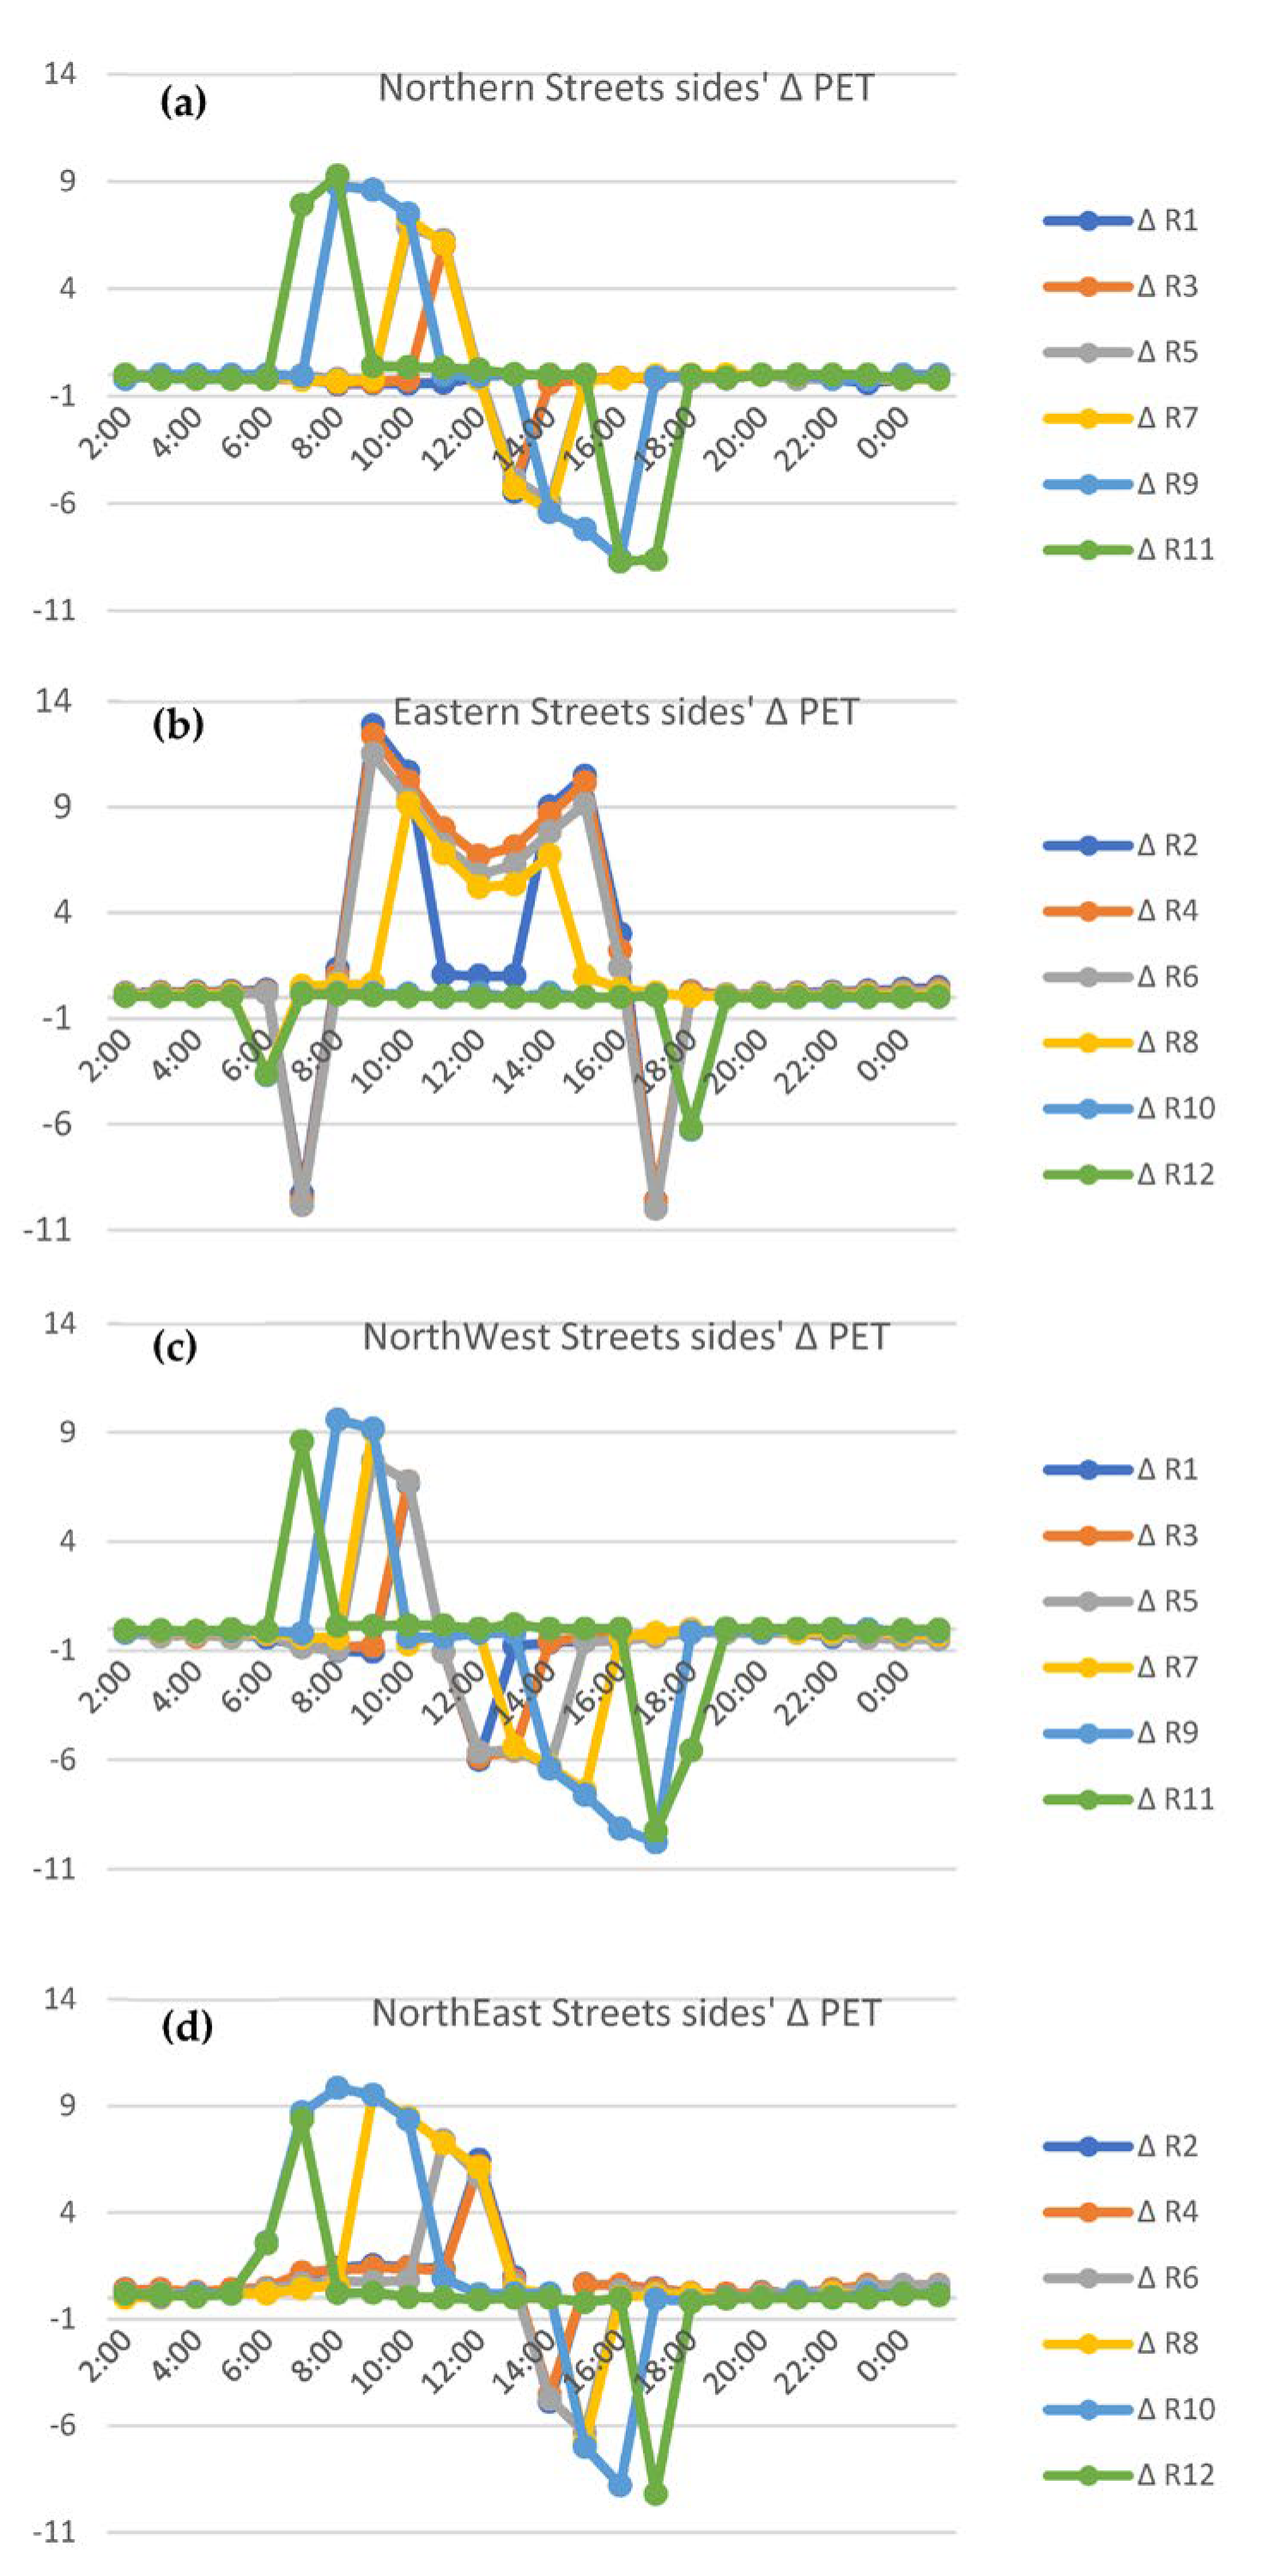
Figure 15 shows the ∆ PET between each side of each street canyon with different aspect ratios and orientations, and it clarifies the significant change that occurred for the eastern roads between side (a) and side (b), as the maximum PET difference reached 14 C° in the deep and moderate canyons. This significant difference within the same canyon is because of the effect of the aspect ratio and orientation, which reduces the PET on the (b) side much more than that of the (a) side for most of the daytime. The differences in the northern, northeast, and northwest canyons vary between the morning and afternoon hours; thus, the aspect ratio plays an important role that varies during the day because of the sun’s path, which changes its angle during the daytime. The main enhancement in the morning hours was measured in the northeast roads, and the main enhancement in the afternoon hours was measured in the northern canyons. The northwest canyons showed a balanced enhancement between the morning and afternoon hours. Shallow canyons, such as R11 and R12, in all orientations showed a very minor change between sides. This signifies that the effect of the aspect ratio was not considered in the shallow canyons; however, in the moderate and deep canyons, the difference between the canyon sides was significant in the N, NE, and NW and varied based on the orientations.
This concludes how the different sides of the aspect ratios and orientations perform without adding trees. This provides a clear understanding and some insight into the expected performance of trees when they are added to different sides with various aspect ratios and orientations.

3.1.2. Stage Two: Results of the Tree Scenarios

In this stage, the effect of adding different tree percentages was measured by comparing the PET values in each tree scenario for each side of the road for different aspect ratios and orientations. As clarified, the two tree densities (20% and 50%) were tested on different sides of various street canyons to understand the relationship between trees and different sides of various street canyons.
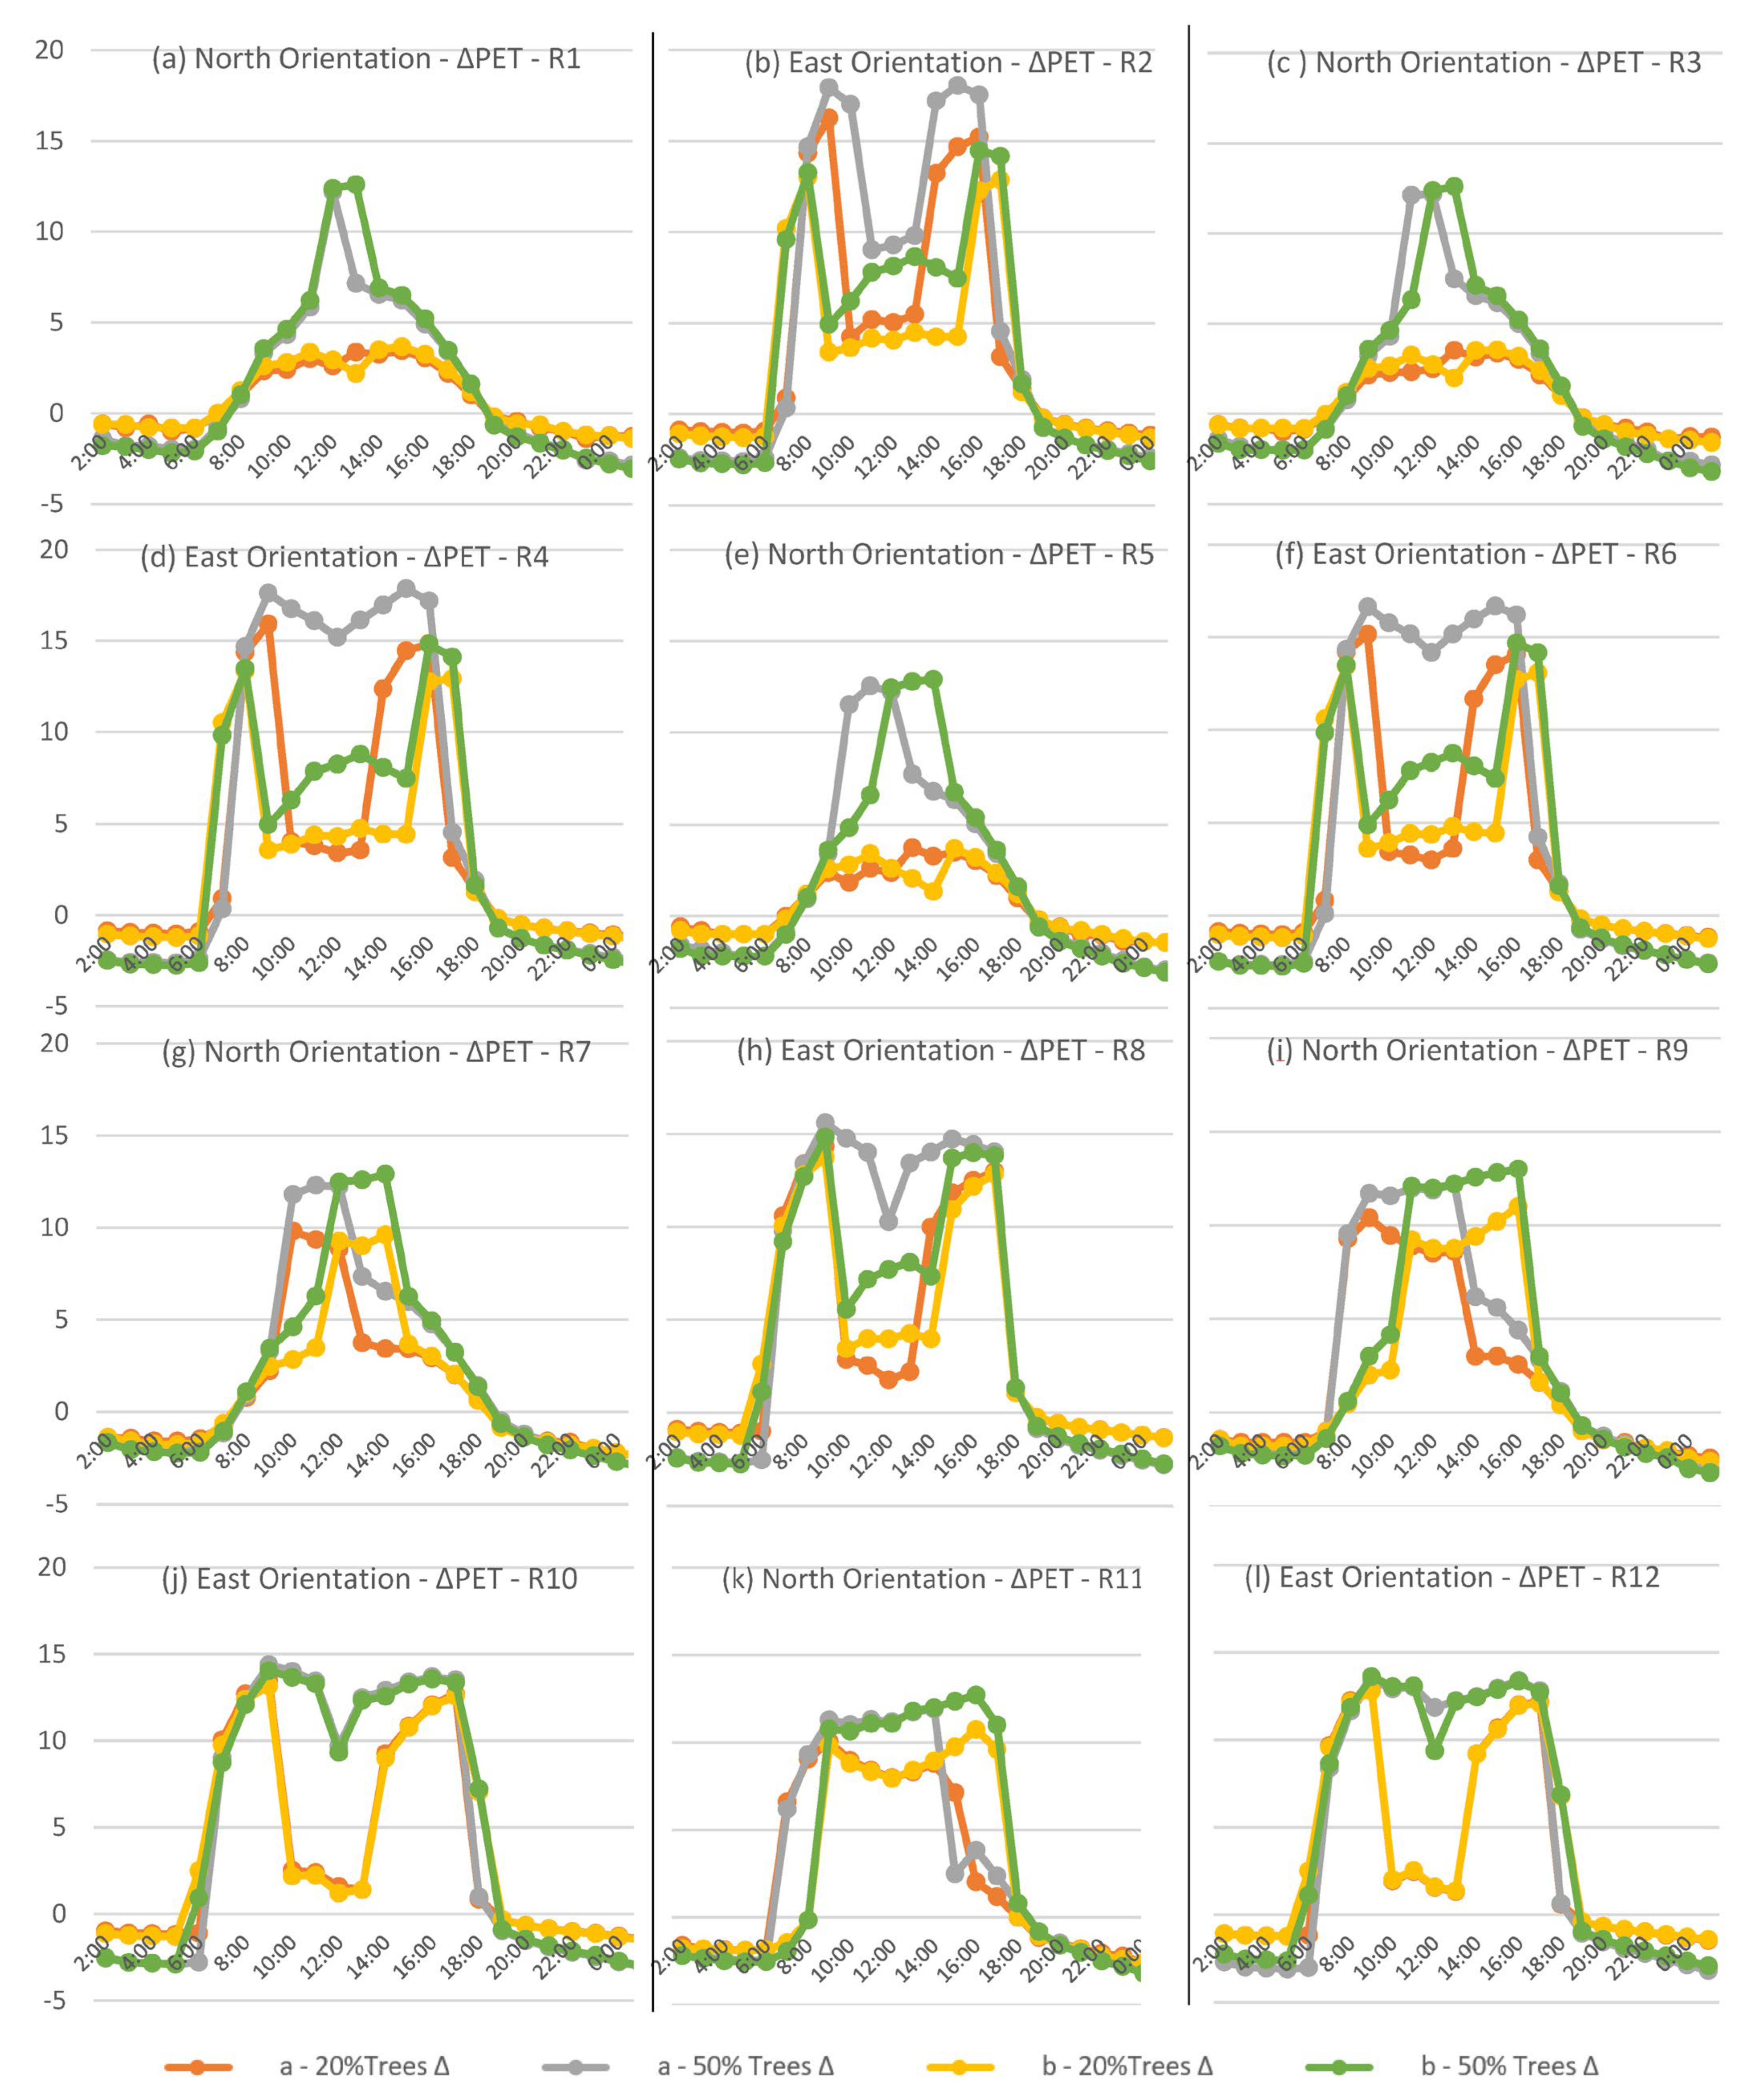
As shown in Figure 16, tree performance varied based on aspect ratio, orientation, and street side. Trees reduced PET values significantly in two cases. The first case involved all aspect ratios of the eastern canyons, and the second case involved shallow urban canyons in all other orientations. In Figure 16, there are two shapes of charts: M-like shape and A-like shape. The M-like shape represents a significant performance of the trees in charts (b, d, f, h, i, j, k, and l). These charts depict the PET reduction reaching a maximum, which remained for most of the daytime, except during the noon hours. This led to an M-like shape for PET reduction, which occurred for most of the time. In these canyons, the ∆PET reached up to 17 C° as the maximum and an average of 12–15 C°, and this average reduction lasted, on average, for 8–10 h, which is almost the entire daytime period and a significant PET reduction. However, in the northern orientation in the moderate and deep canyons, all of the charts showed an A-like shape, which represents a limited enhancement of the PET compared to other cases because the ∆PET reached 13 C° as the maximum for only 3 h in very few cases, and the average ∆PET reached between 4 and 7 C° for most of the daytime. The results in Figure 16 also show that increasing the tree percentage from 20% to 50% in shallow canyons is very promising for both sides of shallow canyons and on side (a) in moderate and deep eastern canyons. However, increasing the tree density in deep and moderate northern canyons did not lead to any significant enhancements.
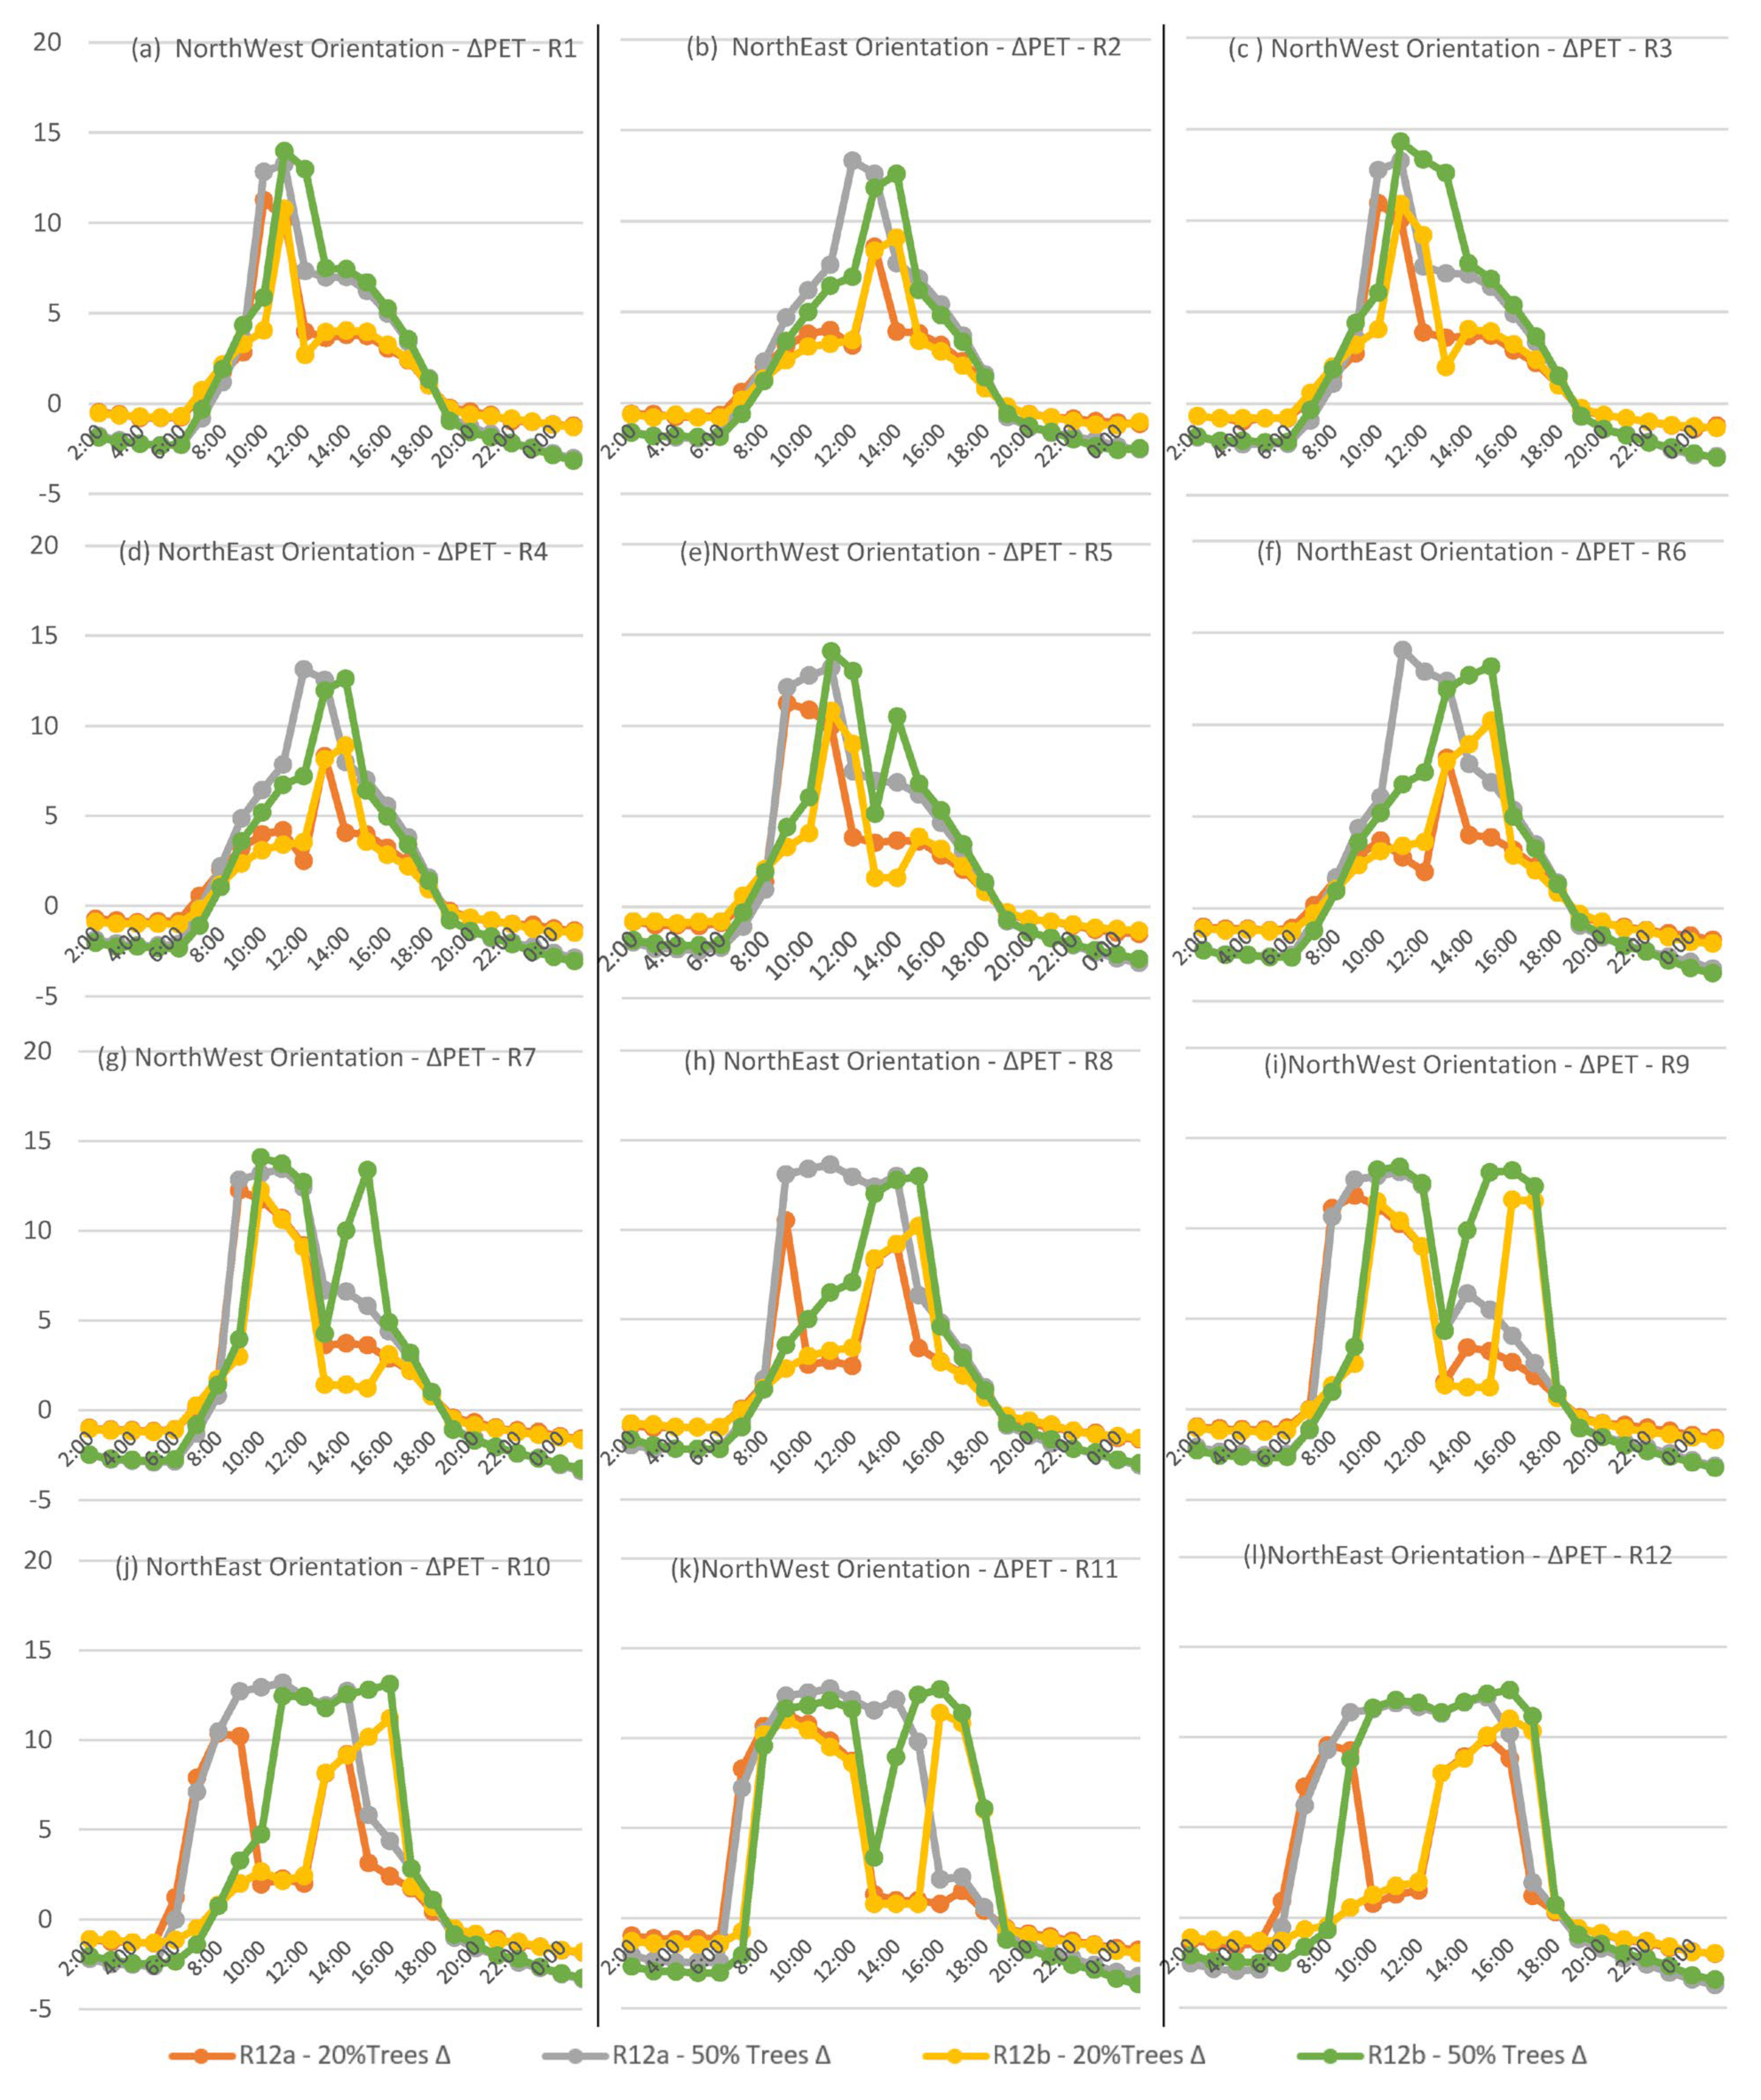
In Figure 17, the northwest and northeast canyons showed equal tree performance, with a significant enhancement in the shallow canyons for both orientations on both sides, as shown in canyons R9, R10, R11, and R12. For the moderate and deep aspect ratios, the tree performance of the canyons in both orientations was almost the same and very similar to the performance of the trees in the moderate and deep canyons of the northern orientation. In addition, the maximum ∆PET reduction reached an average of 12–14 C°, and the average reduction reached 4–7 C°. The performance of the trees on both sides of the canyons was almost the same, with a slight enhancement on side (b). Increasing the density of the trees from 20% to 50% played an important role in reducing the PET values in both orientations in the shallow canyons, as the ∆PET between the 20% and 50% tree scenarios reached 10 C° in some hours in the shallow canyons. In the moderate and deep canyons, increasing the tree percentage led to minor PET reductions, with an average of 2–3 C° only between the 20% and 50% tree scenarios.
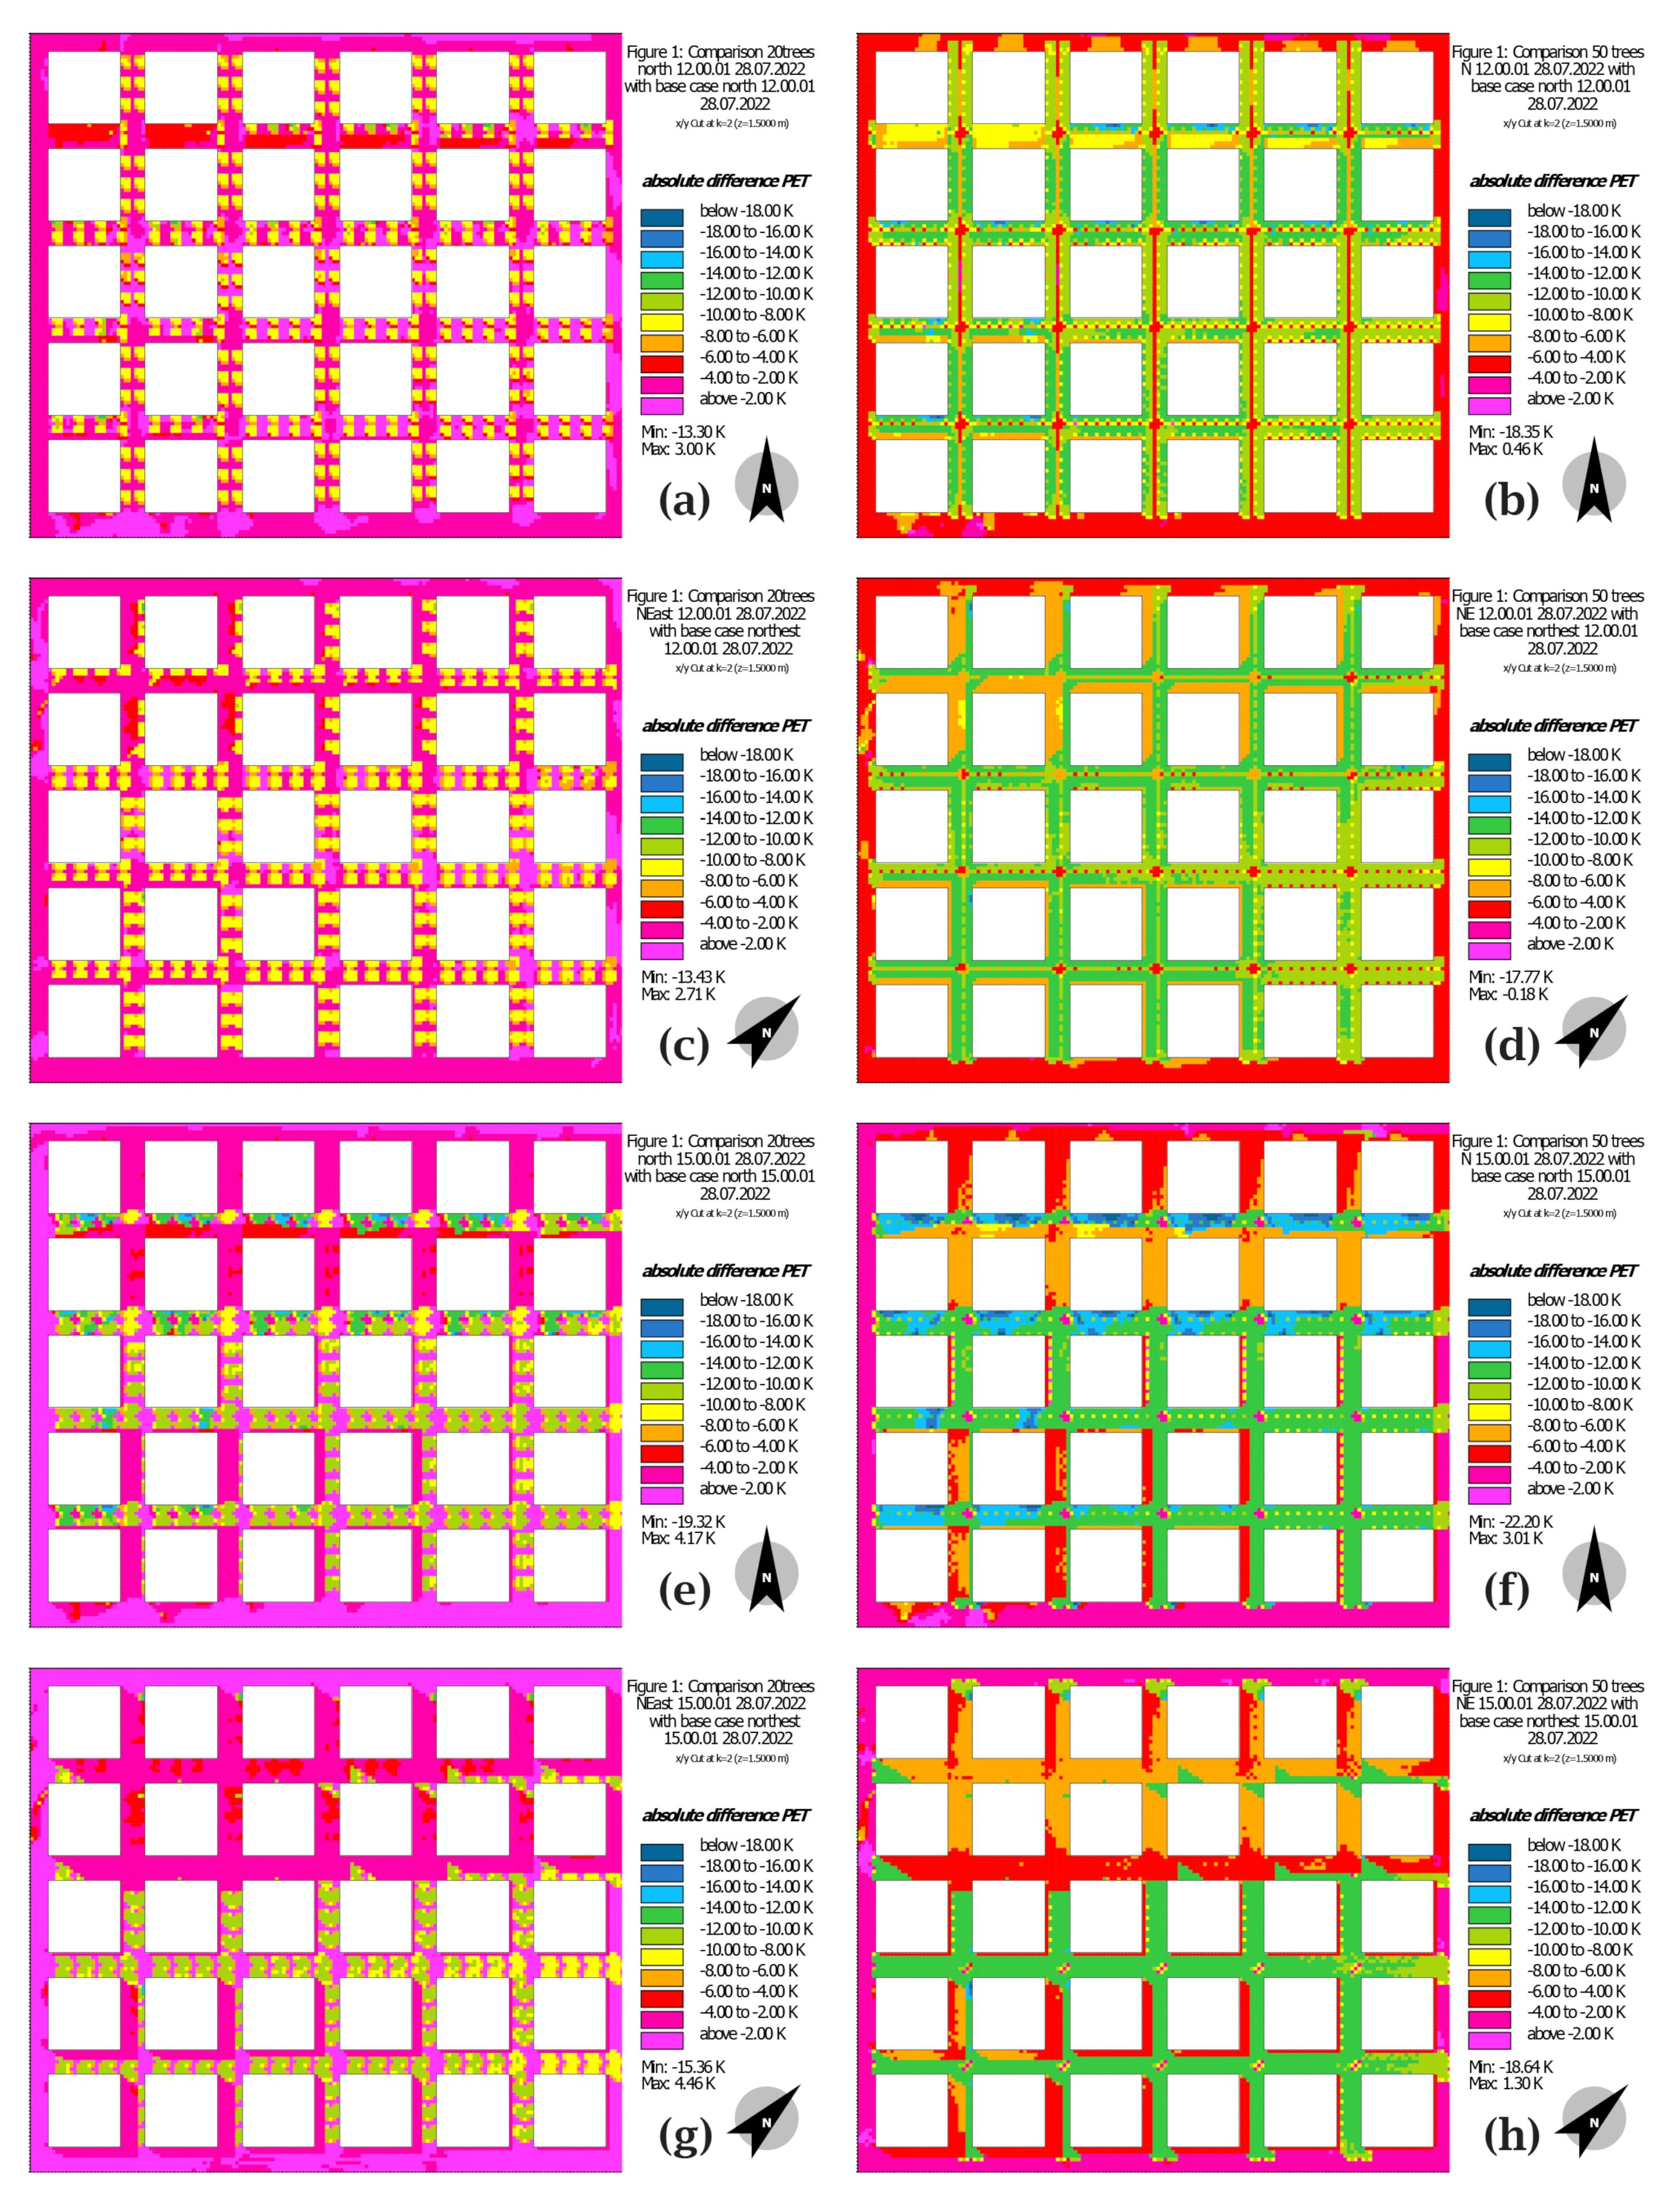
Figure 18 shows the ∆PET for the 20% and 50% tree scenarios compared to the 0% tree scenario for all aspect ratios and orientations at 12:00 and 15:00. At noon (12:00), the 20% tree performance in all orientations was almost the same; also, the 50% tree performance in all orientations was almost the same. This is due to the sun’s location at this hour, which is almost perpendicular to the urban canyons, and the role of the aspect ratio almost vanishes. The 50% tree enhancement of the PET values is significant compared with the enhancement produced by the 20% tree scenario at that hour due to the provision of more shading to the urban canyons, and the only difference was in the deepest canyon (H:W = 3:1) because a slight appearance of urban shading occurred for all orientations, reducing the significance of the high-density tree scenario’s enhancement slightly.
In the same figure, in the afternoon (15:00), when tree shading is mixed with urban canyon shading, the actual importance of the trees appears in some canyons and disappears in other canyons. In the shallow canyons, the dark green category, which represents a reduction of 12 to 14 C°, appears clearly in most of the shallow canyons for the 50% tree scenario, and this changed gradually from dark green to orange, which represents a reduction of 6 to 8 C°, in the moderate canyons. Then, it gradually changed to a red color, which represents a reduction of 2 to 4 C°, in the deep canyons, especially in the north, northeast, and northwest orientations, with the eastern orientation showing a greater reduction. It was better than the other orientations, even in the deep canyons. Also, the 20% tree scenario showed the same gradual enhancements with lower values, as it ranged between light green (10 to 12 C°) and red (2 to 4 C°), and the effect is presented on the map in a dotted form, covering an area that is not fully continuous, as shown for the 50% scenario.
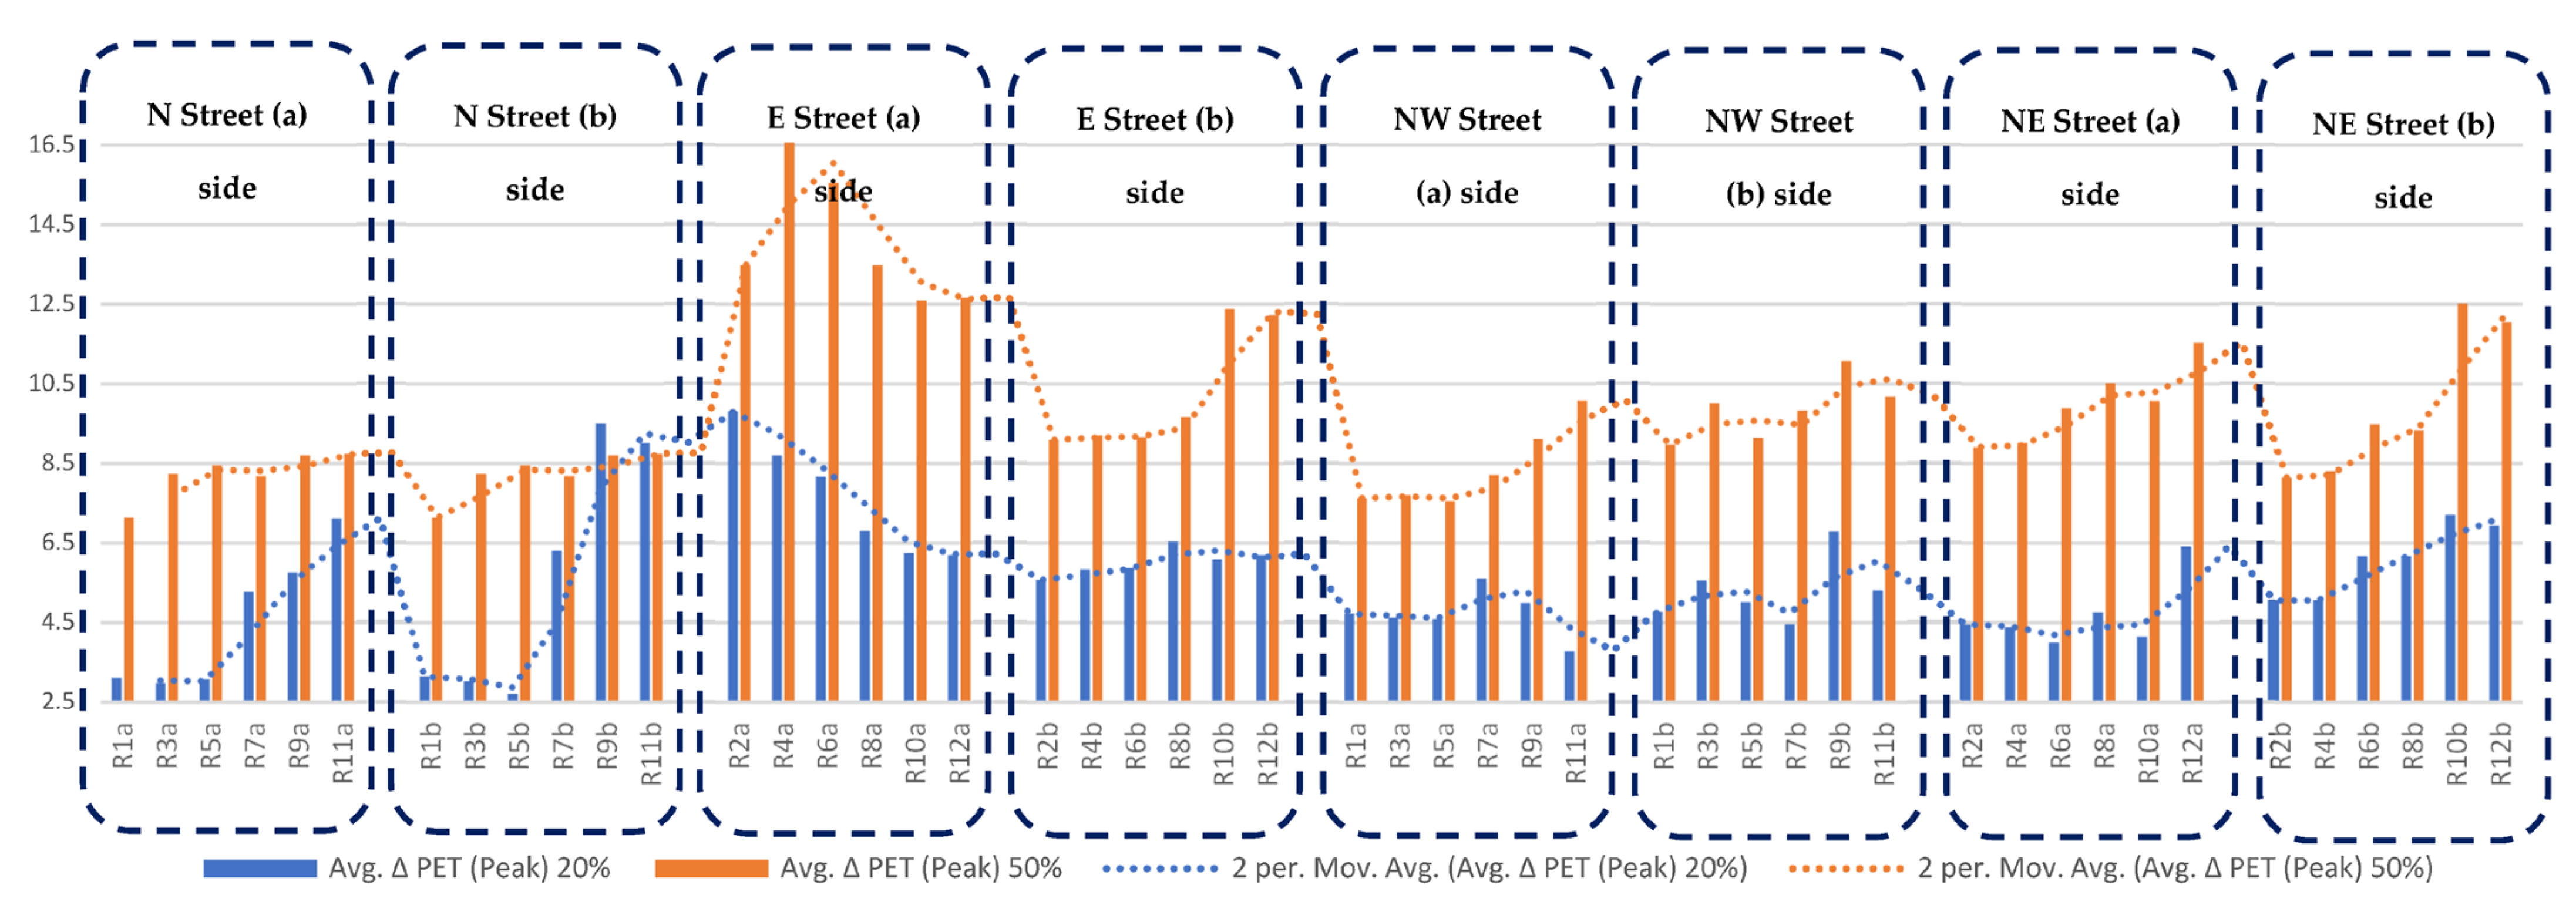
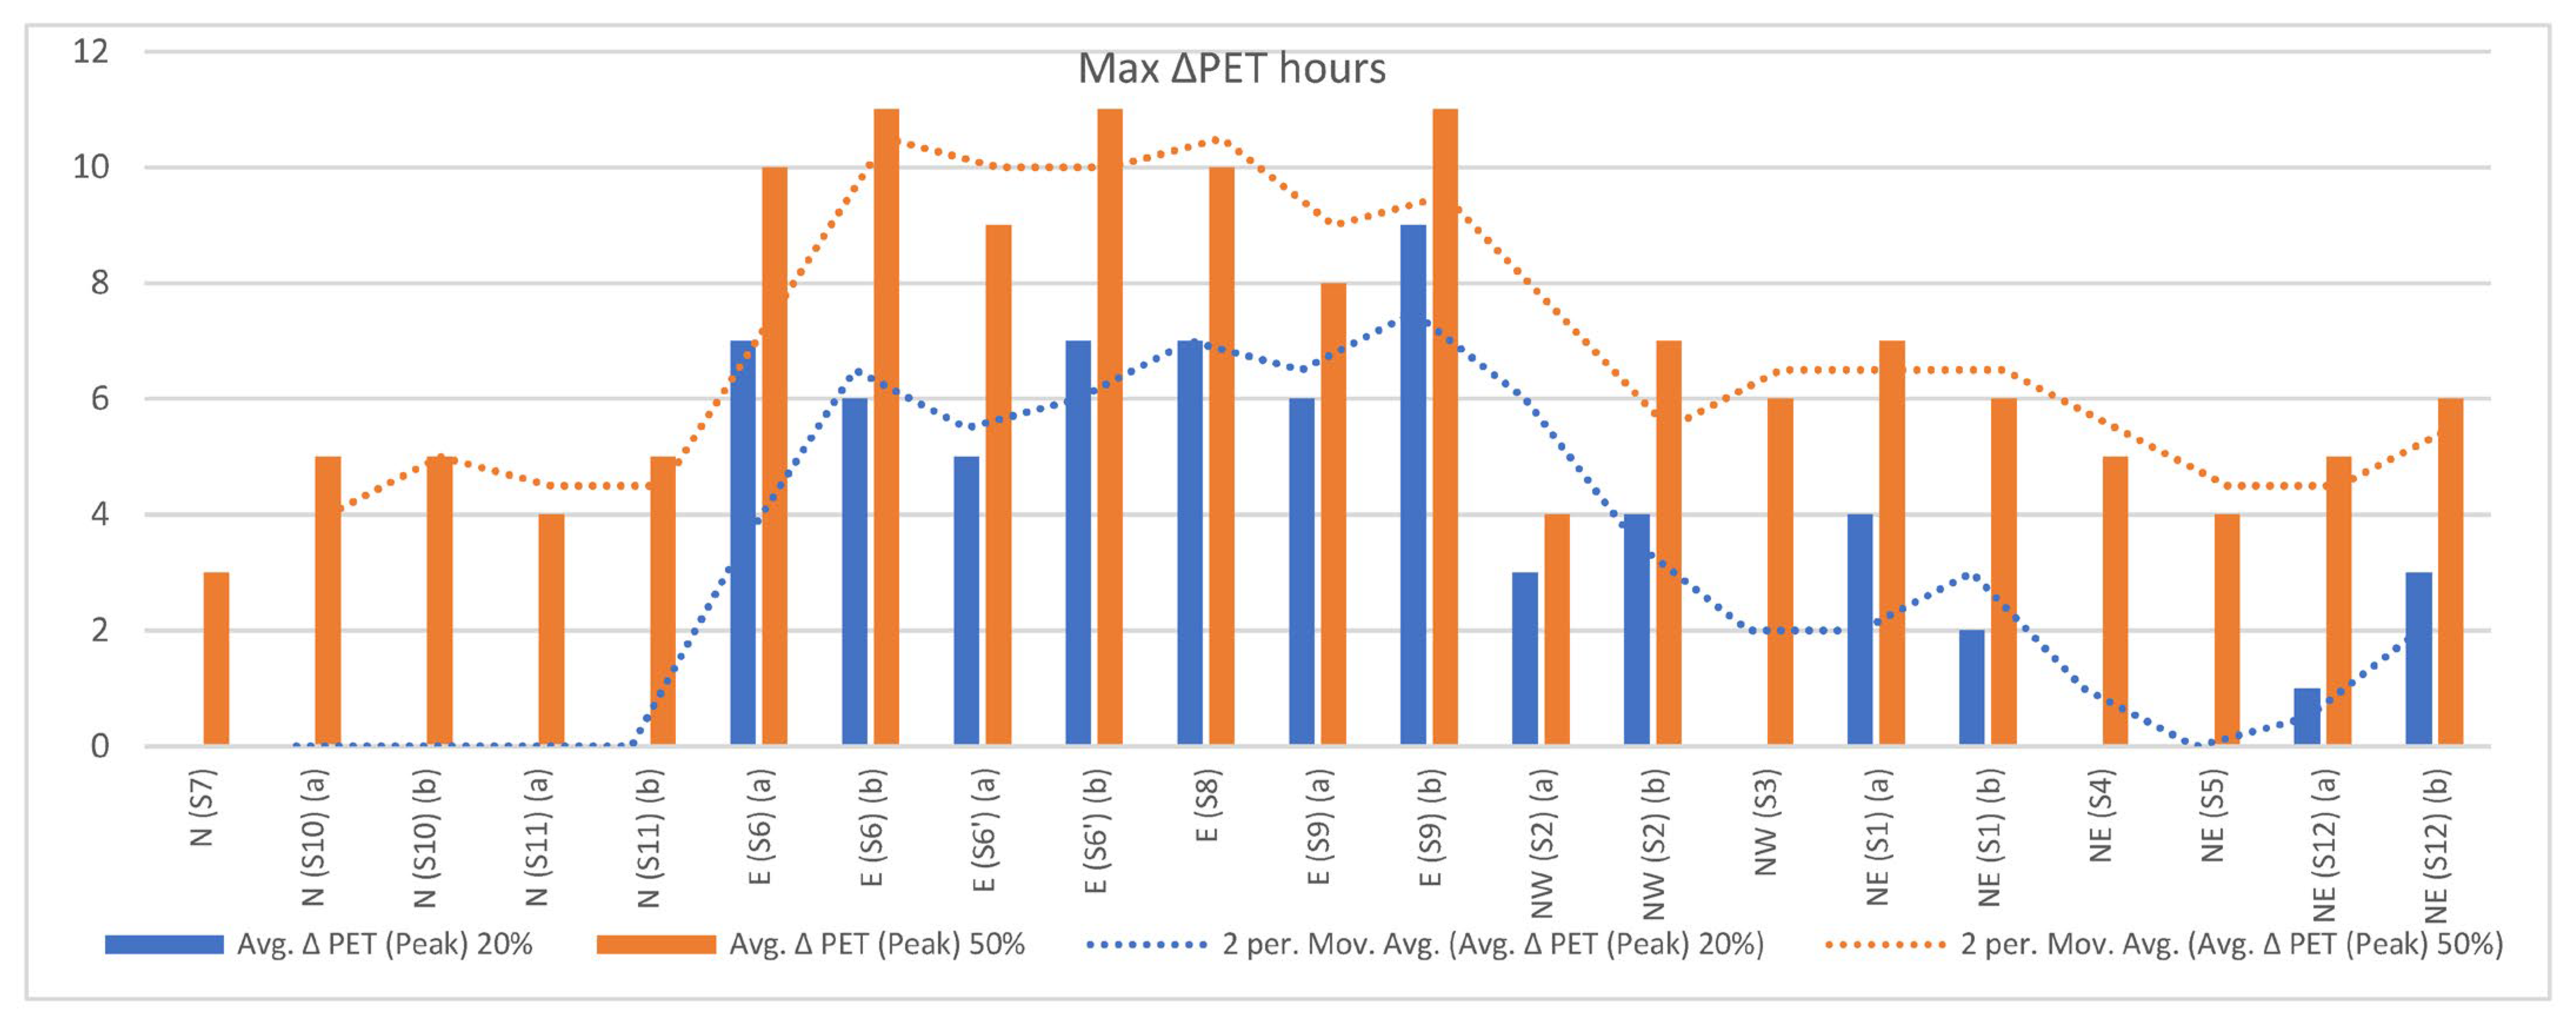
Figure 19 and Figure 20 show a detailed comparison of both sides of the various street canyons with different orientations and aspect ratios that were applied in two ways. The first method compared the average ∆PET during the peak hours in the daytime (from 11:00 to 16:00), as presented in Figure 19. The second method compared how many hours the PET was reduced by 8 C° or more. This reduction helps change the level of thermal comfort by almost two thermal zones and should be considered a significant enhancement [30]. Both comparisons (Figure 19 and Figure 20) show the significant impact of applying high tree densities on shallow streets and in eastern canyons on both sides. In addition to explaining the gradual performance of the trees with various aspect ratios (moderate to deep), in the other orientations, the trees’ performance decreased with an increase in the aspect ratio (H/W). It also demonstrates that for deep and moderate canyons with northern, northeast, and northwest orientations, increasing the tree density from 20% to 50% does not lead to significant PET reductions and remains almost the same in some cases.
For a better understanding of the relationship between the aspect ratio and tree scenario performance for different orientations on both canyon sides, an additional statistical analysis was performed. Different aspect ratios were analyzed against the reduced hours with different tree densities for each street orientation on each side using SPSS analysis to calculate the correlation, mean, standard deviation, and regression. Before calculating the correlation between both mentioned variables, as shown in Table 5, all input data for the aspect ratio and avg. ΔPET (peak hours) for all orientations on both sides were normally distributed based on the Kolmogorov–Smirnov (KS) test, except the ΔPET values for the 50% tree scenario for a north orientation on the ‘’b’’ side and the 50% tree scenario for an east orientation on the ‘’b’’ side therefore Pearson correlation was applied for all cases, except for the mentioned cases in which Spearman correlation was applied. Table 5 proves that there was a very strong negative correlation between an increase in the aspect ratio and the ΔPET for peak hours with different tree percentages for all orientations on both sides. However, the correlation value was not the same for all orientations and sides. For example, the correlation for eastern roads was lower than that for the other orientations at −0.849, −0.849, −0.878, and −0.802, which reached −0.971 to −0.900 in most cases. Also, the NE on side (b) and NW on side (a) showed a less significant correlation, and this result is very similar to that of the eastern orientation, which is in line with the measured PET reduction. This means that the trees’ performance was less dependent on the urban canyon shading because the urban shading is very minor in this orientation, and the other elements, such as the wind speed, do not help; therefore, the trees’ presence is very important in these canyons. In addition, the mean values presented in Table 5 represent the huge difference between the eastern cases and the rest of the orientations; this is also in line with the PET reduction and correlation results. The correlation results could show more significant changes if the results of the shallow aspect ratios (0.5 and 0.25) were excluded because the results of both ratios are the same for the eastern orientation, whereby the impact of the aspect ratio disappears. Figure 21 shows linear scatter plots and regressions of the aspect ratio and ∆PET of the number of 8 C° or greater reduction hours for both tree scenarios (20% and 50%). This clearly shows that there was a negative linear relationship between the aspect ratio and the ∆PET for both tree densities; however, this varied based on the street’s aspect ratio, orientation, and canyon side, in addition to the percentage of trees changing the overall values in some cases. The 50% tree scenario showed a stronger relationship than the 20% tree scenario in all orientations. The northern, northwest, and northwest showed higher R2 values between the ∆PET and aspect ratio, with values R2 ≥ 0.8 for the 50% tree scenario; however, in the eastern canyons, on both sides, the values were much lower, reaching R2 ≤ 0.72 for side (a) and R2 ≤ 0.77 for side (b).

3.1.3. Conclusion of the Trees’ Performance in the Theoretical Model

On the basis of the analysis of all the results, it has been proven that the performance of the trees varied depending on the aspect ratio, orientation, and side of the urban canyon. The eastern roads are the most in need of a high density of trees. This is because the canyon experiences heat stress throughout the day, and the urban shading on both sides is insufficient to improve the microclimate conditions for the varying aspect ratios. Additionally, the wind speed is extremely low, exacerbating the already poor thermal comfort along this orientation. Northern streets are more shaded by buildings; therefore, increasing the aspect ratio for these orientations is very efficient. Adding trees to moderate to deep canyons will not help enhance the thermal comfort significantly. In addition, the good wind speed helps to enhance thermal comfort when combined with the shade provided by buildings. The northeast and northwest orientations are very similar to the northern canyon, with good canyon shading and moderate wind speed, and the role of trees is not as significant as in the eastern orientation.

3.2. Case Study Results

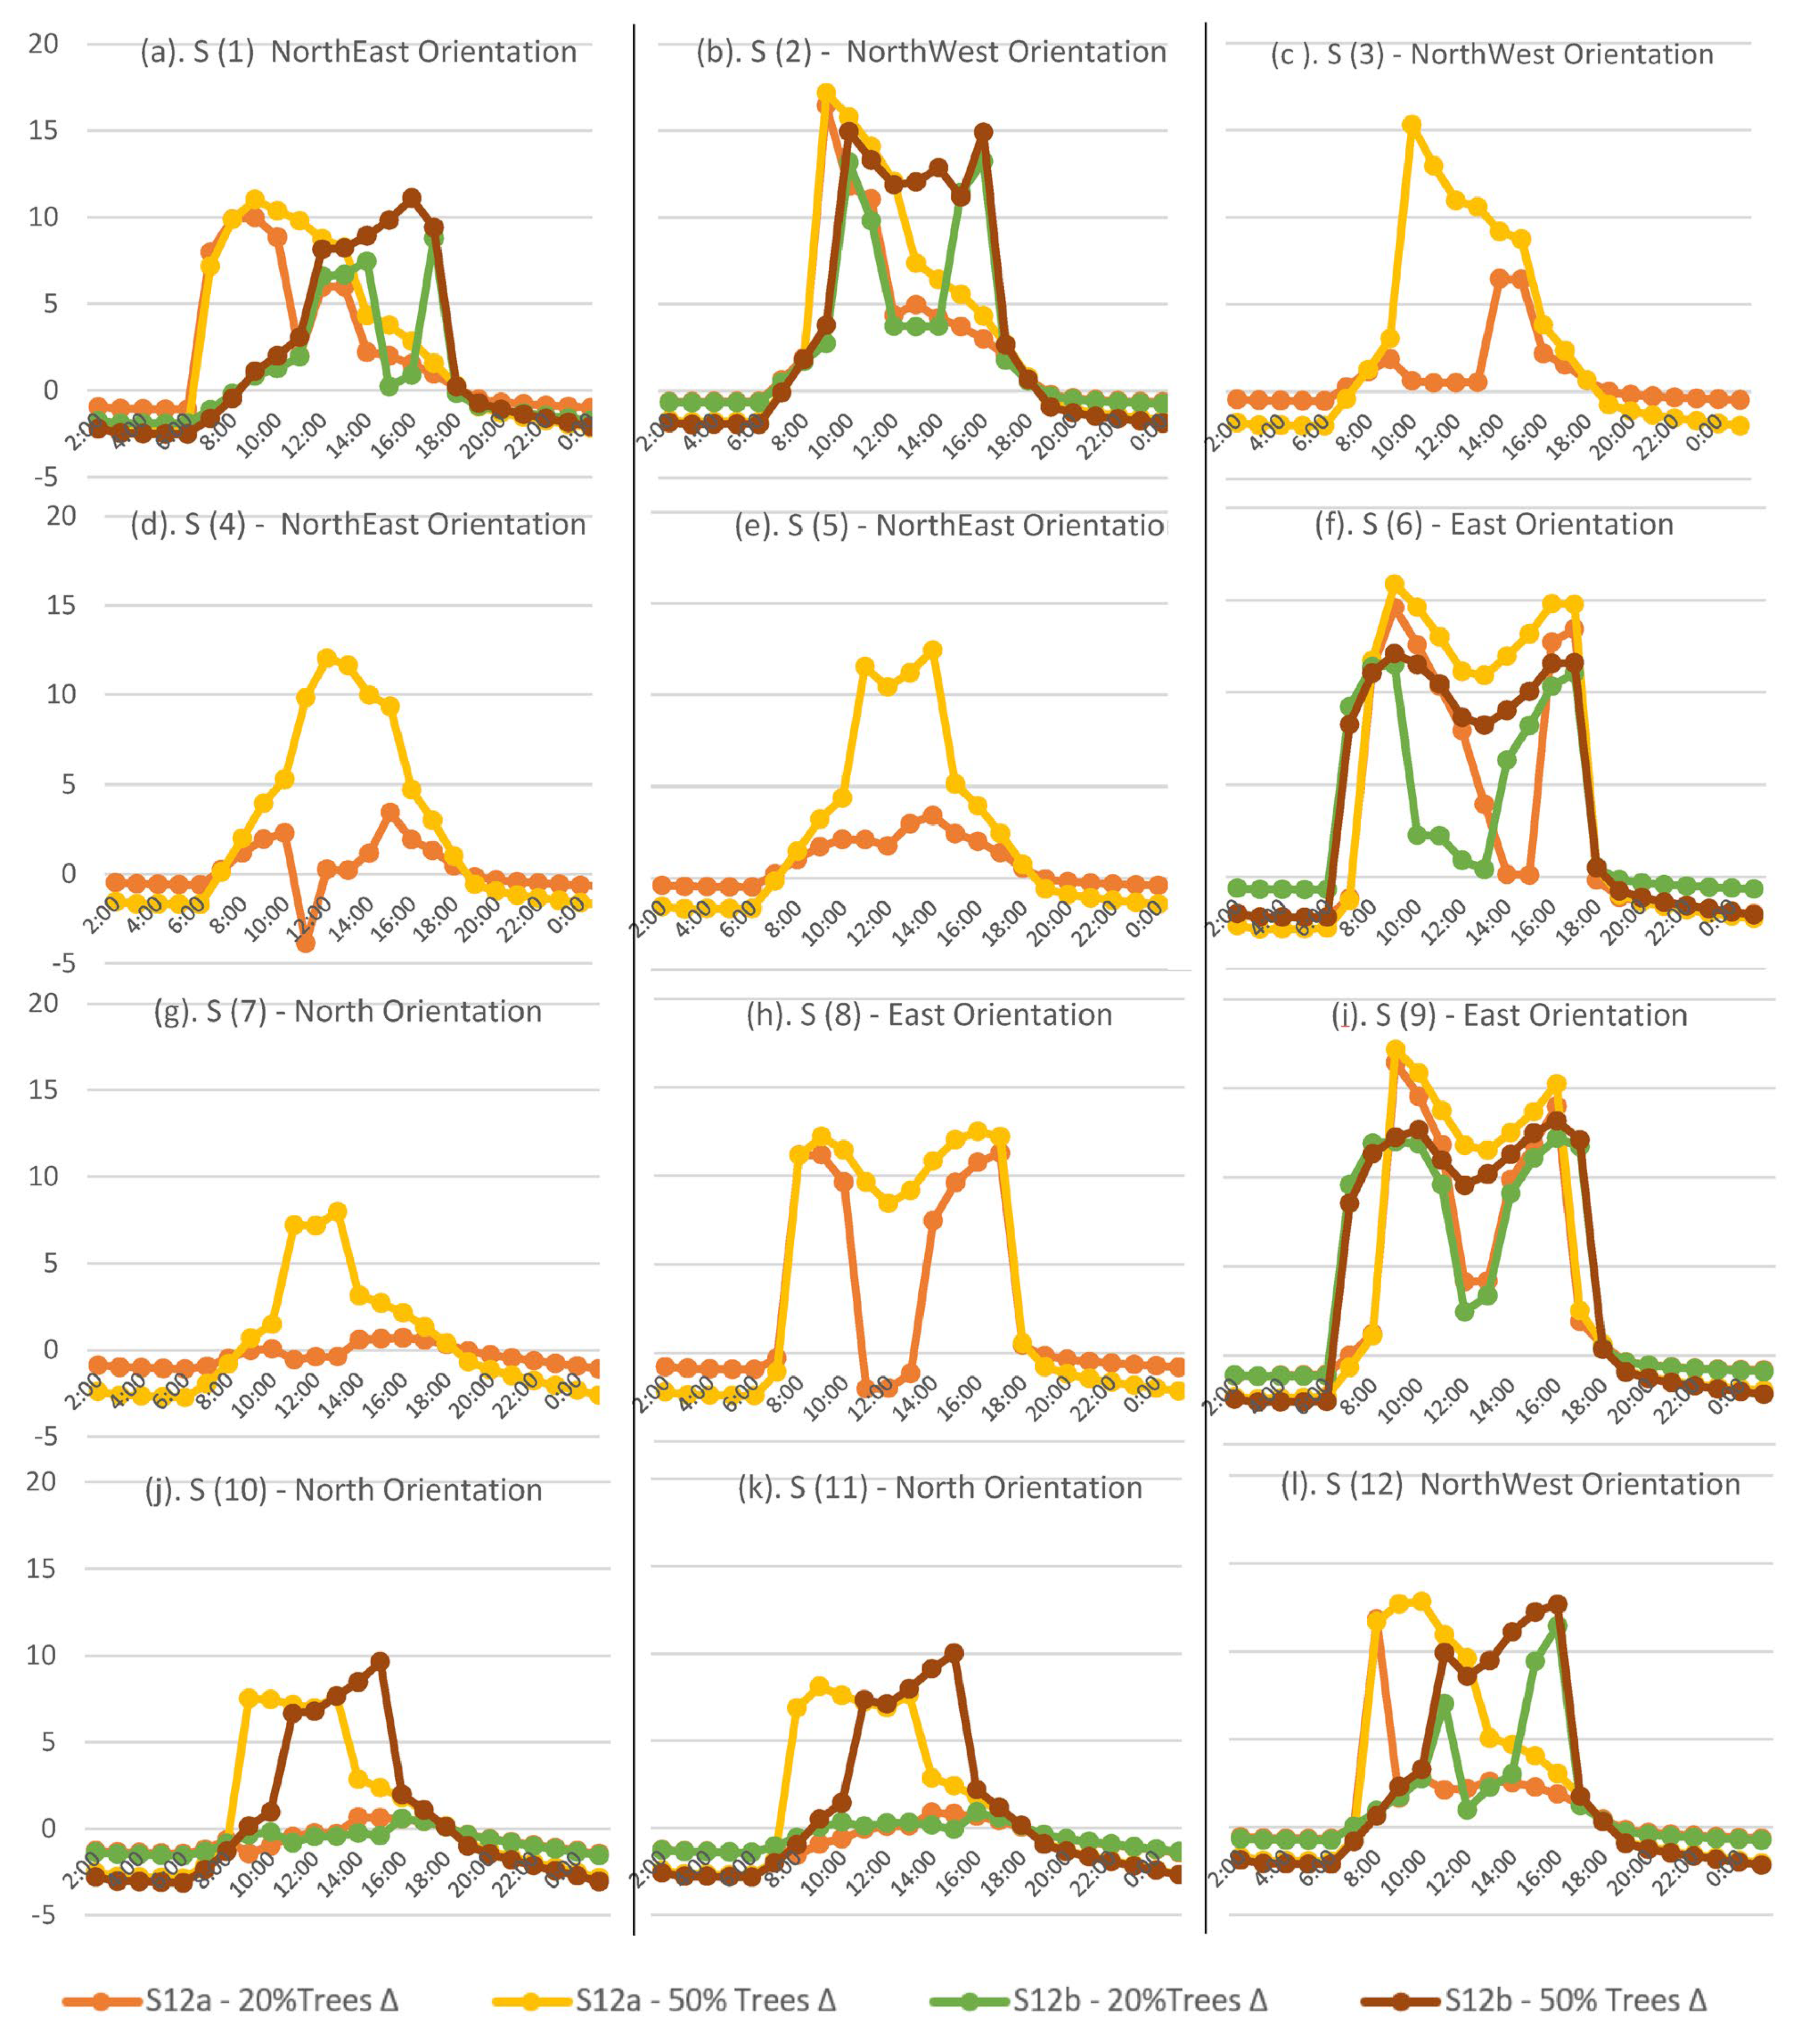
In order to validate the results of the theoretical study, all the findings were compared to the outcomes by implementing the same tree scenarios in the case study area located in downtown Cairo. As shown in Figure 22, after applying different tree densities to different canyon aspect ratios and orientations on both sides, the results are quite similar to the theoretical model’s results for the same tree scenarios. The trees’ impact is very significant in shallow canyons and eastern canyons, as charts (f and i) in Figure 22 for the eastern canyons show significant PET reductions on both sides, in which the PET is reduced by approximately 18 C° as a maximum and reaching an average of a 13 to 14 C° reduction for most of the daytime hours. Significant results were mainly found for the 50% tree scenario with an average of 4 to 5 C° more than in the 20% tree scenario. PET reduction was limited in the other orientations (northern, northeast, and northwest) and hardly exceeded 10 C° PET reductions in very few hours in some canyons. The average PET reduction reached from 4 to 7 C°, which is very similar to the theoretical model’s results. A slight change was measured in S1 (northeast) and S12 (northwest) because the PET reduction was slightly better than the theoretical model’s results but still much less than the enhancement of the eastern canyons.
Figure 23 demonstrates the ∆PET for the same canyon orientation and aspect ratio (S6 and S6′) on both sides (a and b), as shown in Table 2. Although the street widths and buildings heights are irregular, both canyons with the same aspect ratio showed almost the same results, with slight differences occurring most probably because of the irregular building heights in each canyon. The ∆PET difference between both canyons reached 1 to 3 C° in only a very few hours in both canyons on both sides, and this clarifies that as long as the aspect ratio is the same between different canyons, the performance will be very similar regardless of any slight change in the height of the buildings and width of the street, as long as the canyon aspect ratio is still the same.
Figure 24 illustrates the impact of the trees on the entire study area for the 20% and 50% tree scenarios at 12:00 and 15:00. This shows that increasing the tree density is crucial for the eastern canyons, and the blue color (12 to 14 C° ∆PET) represents the four eastern canyons (S6, S6′, S8, and S9). The blue color in Figure 24d for the 50% tree scenario at 15:00in S1 on the (b) side, shows that the trees’ impact was significant because this canyon is very shallow. The performance of the 20% and 50% tree scenarios varied with the different aspect ratios and orientations at 15:00, when the tree performance mixed with the various effects of urban shading based on the aspect ratio and orientation. The maps also show the equal impact of the trees at 12:00 for both tree scenarios when the sun is almost perpendicular, and the effect of the different aspect ratios and orientations disappeared. These maps/results are quite similar to the theoretical study’s maps/results, and slight differences in a very few cases occurred due to irregular aspect ratios, as the buildings’ heights in the existing study area are not exactly the same as those in the theoretical model, which is 100% regular in terms of the building heights and street widths.
By reviewing Figure 25 and Figure 26, which show a comparison of the average ∆PET for the peak time (from 11:00 to 16:00) on both sides for the various aspect ratios and orientations in Figure 25 and a detailed comparison between the total hours of PET reduction of 7 h or more on both sides for the various aspect ratios and orientations in Figure 25, both studies prove that the impact of the trees varied significantly for all shallow canyons in addition to the eastern canyons on both sides. The overall linear shape of each chart in Figure 25 and Figure 26 is very similar to the same charts of the theoretical model analysis, as shown in Figure 19 and Figure 20. This validates the results and findings of the theoretical model; however, in the case study, there are slight differences compared to the theoretical model. This is a normal occurrence that happens because of the irregularity of the existing study area in terms of the aspect ratios and various heights of buildings inside each urban canyon; the existing study area cannot have the same regularity as the theoretical model. Despite this, the overall results match the theoretical model and the existing study area.

4. Discussion

After reviewing the theoretical and case study results, it is obvious that trees are important and add value to different urban canyons. This importance varies depending on the orientation, aspect ratio, and side of the canyon.
The eastern canyon requires a high density of trees, and this is applicable to both sides, particularly the northern side. Moreover, this finding is consistent with those of previous studies [8,14,20]. The northern, northeast, and northwest canyons showed better performance than the eastern canyons. The addition of trees to the Northern canyons improved it slightly, but it was not as significant as the effect of adding trees to the eastern canyons. This aligns with previous findings from other studies [20,30]. For some canyons in the northern, northeastern, and northwestern areas, having tall buildings (moderate to deep canyons) helps keep the area cooler. This is because the buildings block the hot sun from shining directly on the streets. These canyons also have strong winds, which help make them feel cooler. Adding trees to these canyons (moderate and deep canyons in these orientations) might not make much of a difference in how comfortable it feels, and it might even block some of the wind. However, it can be helpful to add trees to one side of the canyons, which is side (b). The trees on side (b) provide shade in the afternoon and make the canyons feel cooler without blocking the wind. Shallow canyons in all orientations and all aspect ratios on both sides of the canyons do not provide enough shading at all. In addition, placing high densities of trees in these canyons is mandatory to enhance thermal comfort conditions, as the canyon effect completely disappears, especially on the northern side of the eastern canyon (side a). Applying a low density of trees on one side of the road (side b) could be useful in deep canyons with northern, northwestern, and northeastern orientations. On the other hand, high density is necessary on both sides of the eastern and shallow canyons. When comparing the results of the theoretical study and the existing case study, it becomes apparent that the unity and regularity of urban canyons will yield slightly different outcomes compared to the irregular canyons found in existing urban areas. However, the main results are similar but not exactly the same due to changes in the urban conditions at the measurement point. Any alteration to the aspect ratio, orientation, or other urban elements will have an impact, albeit not a significant one. It is not feasible to obtain exact numbers from a uniform and regular theoretical model. Slight variations in the results were observed when altering the street widths and building heights while maintaining the same aspect ratio and orientation, which aligns with [42].

5. Conclusions

This study applied an ENVI-met simulation to explore the effect of aspect ratios, orientations, and trees on the microclimate of different sides of urban canyons in Cairo city. Firstly, a total of 144 theoretical cases were simulated to reveal the microclimate’s relationship with urban morphologies and tree densities. Then, a real neighborhood in Cairo was simulated to verify the results obtained from the theoretical cases. The results showed a significant tree performance; this performance became more significant based on the aspect ratio (PET reduction reached 12 C° using a high density of trees in shallow canyons), the canyon orientation (PET reduction reached 14 C° in the eastern orientation compared to the northern orientation of the same deep canyon), and the side of the canyon (PET reduction at the northern side of the eastern canyon reached 6 to 7 C° more than the other side of the same canyon by adding a high density of trees). On the basis of the results of this study, the addition of trees to urban canyons should be based on urban morphology characteristics, such as aspect ratio and orientation. Additionally, careful consideration should be given to the side on which trees are planted, as any alteration to these three elements of urban geometry necessitates a wholly different approach. This guidance is of paramount importance, particularly for cities grappling with significant challenges like heat stress and water scarcity, as is the case in Cairo. The findings of this study are broad and cover the majority of urban cases in Cairo city. They should be considered by stakeholders and decision makers in Cairo’s authorities and municipalities, as this study could be part of design guidelines and city management while developing new communities or upgrading existing areas because the study provides a detailed approach on how applying trees can be optimized to enhance microclimate conditions for pedestrians. The research methodology and approach could be also applied to different urban cases in Cairo city which are not covered in this research, especially cases in which the urban canyon is not fully defined, to reach the same target of optimizing the use of trees.

Author Contributions

Conceptualization, A.Y.A.; Methodology, A.Y.A.; Writing—original draft, A.Y.A.; Writing—review & editing, D.G.; Visualization, A.Y.A.; Supervision, D.G. All authors have read and agreed to the published version of the manuscript.

Funding

The research is not receiving any fund only the APC is funded by the TU Dortmund University.

Data Availability Statement

The data that support the findings of this study (All Envi-met files) are available upon request.

Conflicts of Interest

The authors declare no conflict of interest.

Abbreviations

UHIUrban Heat Island
PETPhysiological Equivalent Temperature
TMRTTotal Mean Radiant Temperature
WS Wind Speed
RH%Relative Humidity
ARAspect Ratio
RMSE Root Mean Square Error
d Index of Agreement

References

  1. Yin, C.; Yuan, M.; Lu, Y.; Huang, Y.; Liu, Y. Effects of urban form on the urban heat island effect based on spatial regression model. Sci. Total Environ. 2018, 634, 696–704. [Google Scholar] [CrossRef]
  2. Theeuwes, N.E.; Steeneveld, G.J.; Ronda, R.J.; Heusinkveld, B.G.; van Hove, L.W.A.; Holtslag, A.A.M. Seasonal dependence of the urban heat island on the street canyon aspect ratio. Q. J. R. Meteorol. Soc. 2014, 140, 2197–2210. [Google Scholar] [CrossRef]
  3. Dimoudi, A.; Kantzioura, A.; Zoras, S.; Pallas, C.; Kosmopoulos, P. Investigation of urban microclimate parameters in an urban center. Energy Build. 2013, 64, 1–9. [Google Scholar] [CrossRef]
  4. Taheri Shahraiyni, H.; Sodoudi, S.; El-Zafarany, A.; Abou El Seoud, T.; Ashraf, H.; Krone, K. A Comprehensive Statistical Study on Daytime Surface Urban Heat Island during Summer in Urban Areas, Case Study: Cairo and Its New Towns. Remote Sens. 2016, 8, 643. [Google Scholar] [CrossRef]
  5. Abutaleb, K.; Ngie, A.; Darwish, A.; Ahmed, M.; Arafat, S.; Ahmed, F. Assessment of urban heat island using remotely sensed imagery over Greater Cairo, Egypt. Adv. Remote Sens. 2015, 04, 35–47. [Google Scholar] [CrossRef]
  6. Shishegar, N. Street Design and Urban Microclimate: Analyzing the Effects of Street Geometry and Orientation on Airflow and Solar Access in Urban Canyons. J. Clean Energy Technol. 2013, 1, 52–56. [Google Scholar] [CrossRef]
  7. Kotharkar, R.; Bagade, A.; Ramesh, A. Assessing urban drivers of canopy layer urban heat island: A numerical modeling approach. Landsc. Urban Plan. 2019, 190, 103586. [Google Scholar] [CrossRef]
  8. Rodríguez-Algeciras, J.; Tablada, A.; Chaos-Yeras, M.; De la Paz, G.; Matzarakis, A. Influence of aspect ratio and orientation on large courtyard thermal conditions in the historical centre of Camagüey-Cuba. Renew. Energy 2018, 125, 840–856. [Google Scholar] [CrossRef]
  9. Morakinyo, T.E.; Kong, L.; Lau, K.K.-L.; Yuan, C.; Ng, E. A study on the impact of shadow-cast and tree species on in-canyon and neighborhood’s thermal comfort. Build. Environ. 2017, 115, 1–17. [Google Scholar] [CrossRef]
  10. Ketterer, C.; Matzarakis, A. Human-biometeorological assessment of heat stress reduction by replanning measures in Stuttgart, Germany. Landsc. Urban Plan. 2014, 122, 78–88. [Google Scholar] [CrossRef]
  11. Qaid, A.; Ossen, D.R. Effect of asymmetrical street aspect ratios on microclimates in hot, humid regions. Int. J. Biometeorol. 2015, 59, 657–677. [Google Scholar] [CrossRef]
  12. Yola, L.; Siong, H.C.; Djaja, K. Climatically responsive urban configuration in residential area: Research gaps. In The 4th International Tropical Renewable Energy Conference (i-TREC 2019); AIP Publishing LLC: Bali, Indonesia, 2020. [Google Scholar]
  13. Wang, Y.; Berardi, U.; Akbari, H. Comparing the effects of urban heat island mitigation strategies for Toronto, Canada. Energy Build. 2016, 114, 2–19. [Google Scholar] [CrossRef]
  14. Andreou, E. Thermal comfort in outdoor spaces and urban canyon microclimate. Renew. Energy 2013, 55, 182–188. [Google Scholar] [CrossRef]
  15. Matzarakis, A.; Amelung, B. Physiological equivalent temperature as indicator for impacts of climate change on thermal comfort of humans. In Seasonal Forecasts, Climatic Change and Human Health: Health and Climate; Springer: Dordrecht, The Netherlands, 2008; pp. 161–172. [Google Scholar]
  16. Morakinyo, T.E.; Lam, Y.F. Simulation study on the impact of tree-configuration, planting pattern and wind condition on street-canyon’s micro-climate and thermal comfort. Build. Environ. 2016, 103, 262–275. [Google Scholar] [CrossRef]
  17. Abdollahzadeh, N.; Biloria, N. Outdoor thermal comfort: Analyzing the impact of urban configurations on the thermal performance of street canyons in the humid subtropical climate of Sydney. Front. Archit. Res. 2021, 10, 394–409. [Google Scholar] [CrossRef]
  18. De, B.; Mukherjee, M. Optimisation of canyon orientation and aspect ratio in warm-humid climate: Case of Rajarhat Newtown, India. Urban Clim. 2018, 24, 887–920. [Google Scholar] [CrossRef]
  19. Memon, R.A.; Leung, D.Y.C.; Liu, C.-H. Effects of building aspect ratio and wind speed on air temperatures in urban-like street canyons. Build. Environ. 2010, 45, 176–188. [Google Scholar] [CrossRef]
  20. Jamei, E.; Ossen, D.R.; Seyedmahmoudian, M.; Sandanayake, M.; Stojcevski, A.; Horan, B. Urban design parameters for heat mitigation in tropics. Renew. Sustain. Energy Rev. 2020, 134, 110362. [Google Scholar] [CrossRef]
  21. Kolokotsa, D.; Lilli, K.; Gobakis, K.; Mavrigiannaki, A.; Haddad, S.; Garshasbi, S.; Mohajer, H.R.H.; Paolini, R.; Vasilakopoulou, K.; Bartesaghi, C.; et al. Analyzing the Impact of Urban Planning and Building Typologies in Urban Heat Island Mitigation. Buildings 2022, 12, 537. [Google Scholar] [CrossRef]
  22. Balany, F.; Ng, A.W.; Muttil, N.; Muthukumaran, S.; Wong, M.S. Green Infrastructure as an Urban Heat Island Mitigation Strategy—A Review. Water 2020, 12, 3577. [Google Scholar] [CrossRef]
  23. Takebayashi, H.; Moriyama, M. Relationships between the properties of an urban street canyon and its radiant environment: Introduction of appropriate urban heat island mitigation technologies. Sol. Energy 2012, 86, 2255–2262. [Google Scholar] [CrossRef]
  24. Lan, H.; Lau, K.K.-L.; Shi, Y.; Ren, C. Improved urban heat island mitigation using bioclimatic redevelopment along an urban waterfront at Victoria Dockside, Hong Kong. Sustain. Cities Soc. 2021, 74, 103172. [Google Scholar] [CrossRef]
  25. Hamdi, R.; Schayes, G. Sensitivity study of the urban heat island intensity to urban characteristics. Int. J. Climatol. A J. R. Meteorol. Soc. 2008, 28, 973–982. [Google Scholar] [CrossRef]
  26. De Lieto Vollaro, A.; De Simone, G.; Romagnoli, R.; Vallati, A.; Botillo, S. Numerical Study of Urban Canyon Microclimate Related to Geometrical Parameters. Sustainability 2014, 6, 7894–7905. [Google Scholar] [CrossRef]
  27. Pioppi, B.; Pigliautile, I.; Pisello, A.L. Human-centric microclimate analysis of Urban Heat Island: Wearable sensing and data-driven techniques for identifying mitigation strategies in New York City. Urban Clim. 2020, 34, 100716. [Google Scholar] [CrossRef]
  28. Andreou, E.; Axarli, K. Investigation of urban canyon microclimate in traditional and contemporary environment. Experimental investigation and parametric analysis. Renew. Energy 2012, 43, 354–363. [Google Scholar] [CrossRef]
  29. Aboelata, A. Vegetation in different street orientations of aspect ratio (H/W 1: 1) to mitigate UHI and reduce buildings’ energy in arid climate. Build. Environ. 2020, 172, 106712. [Google Scholar] [CrossRef]
  30. Lobaccaro, G.; Acero, J.A.; Sanchez Martinez, G.; Padro, A.; Laburu, T.; Fernandez, G. Effects of Orientations, Aspect Ratios, Pavement Materials and Vegetation Elements on Thermal Stress inside Typical Urban Canyons. Int. J. Environ. Res. Public Health 2019, 16, 3574. [Google Scholar] [CrossRef]
  31. Vuckovic, M.; Kiesel, K.; Mahdavi, A. Trees and the microclimate of the urban canyon: A case study. In Proceedings of the 2nd ICAUD International Conference in Architecture and Urban Design, Tirana, Albania, 8–10 May 2014. [Google Scholar]
  32. Mohamed, E. Analysis of urban growth at Cairo, Egypt using remote sensing and GIS. Nat. Sci. 2012, 4, 355–361. [Google Scholar]
  33. Hassan, A.A.M. Dynamic expansion and urbanization of greater Cairo metropolis, Egypt. In Proceedings of the 6th International Conference on Urban Planning—Essen and Regional Development in the Information Society, Essen, Germany, 18–20 May 2011. [Google Scholar]
  34. Zied, E.; Vialard, A. Syntactic Stitching: Towards a Better Integration of Cairo’s Urban Fabric. In Proceedings of the 11th International Space Syntax Symposium, Instituto Superior Técnico—Universidade de Lisboa, Lisbon, Portugal, 3–7 July 2017. [Google Scholar]
  35. Elbardisy, W.M.; Salheen, M.A.; Fahmy, M. Solar Irradiance Reduction Using Optimized Green Infrastructure in Arid Hot Regions: A Case Study in El-Nozha District, Cairo, Egypt. Sustainability 2021, 13, 9617. [Google Scholar] [CrossRef]
  36. Osman, R.; Ferrari, E.; McDonald, S. Water scarcity and irrigation efficiency in Egypt. Water Econ. Policy 2016, 2, 1650009. [Google Scholar] [CrossRef]
  37. Envi-Board. Envi-Met Support Center. Envi-Met. Available online: http://www.envi-hq.com/ (accessed on 30 April 2023).
  38. Middel, A.; Chhetri, N.; Quay, R. Urban forestry and cool roofs: Assessment of heat mitigation strategies in Phoenix residential neighborhoods. Urban For. Urban Green. 2015, 14, 178–186. [Google Scholar] [CrossRef]
  39. Shahidan, M.F.; Shariff, M.K.M.; Jones, P.; Salleh, E.; Abdullah, A.M. A comparison of Mesua ferrea L. and Hura crepitans L. for shade creation and radiation modification in improving thermal comfort. Landsc. Urban Plan. 2010, 97, 168–181. [Google Scholar] [CrossRef]
  40. Weather and Climate. Available online: https://weather-and-climate.com/Cairo-July-averages (accessed on 10 October 2022).
  41. Time and Date. Available online: https://www.timeanddate.com/weather/egypt/cairo/historic?month=7&year=2022 (accessed on 10 October 2022).
  42. Karimimoshaver, M.; Khalvandi, R.; Khalvandi, M. The effect of urban morphology on heat accumulation in urban street canyons and mitigation approach. Sustain. Cities Soc. 2021, 73, 103127. [Google Scholar] [CrossRef]
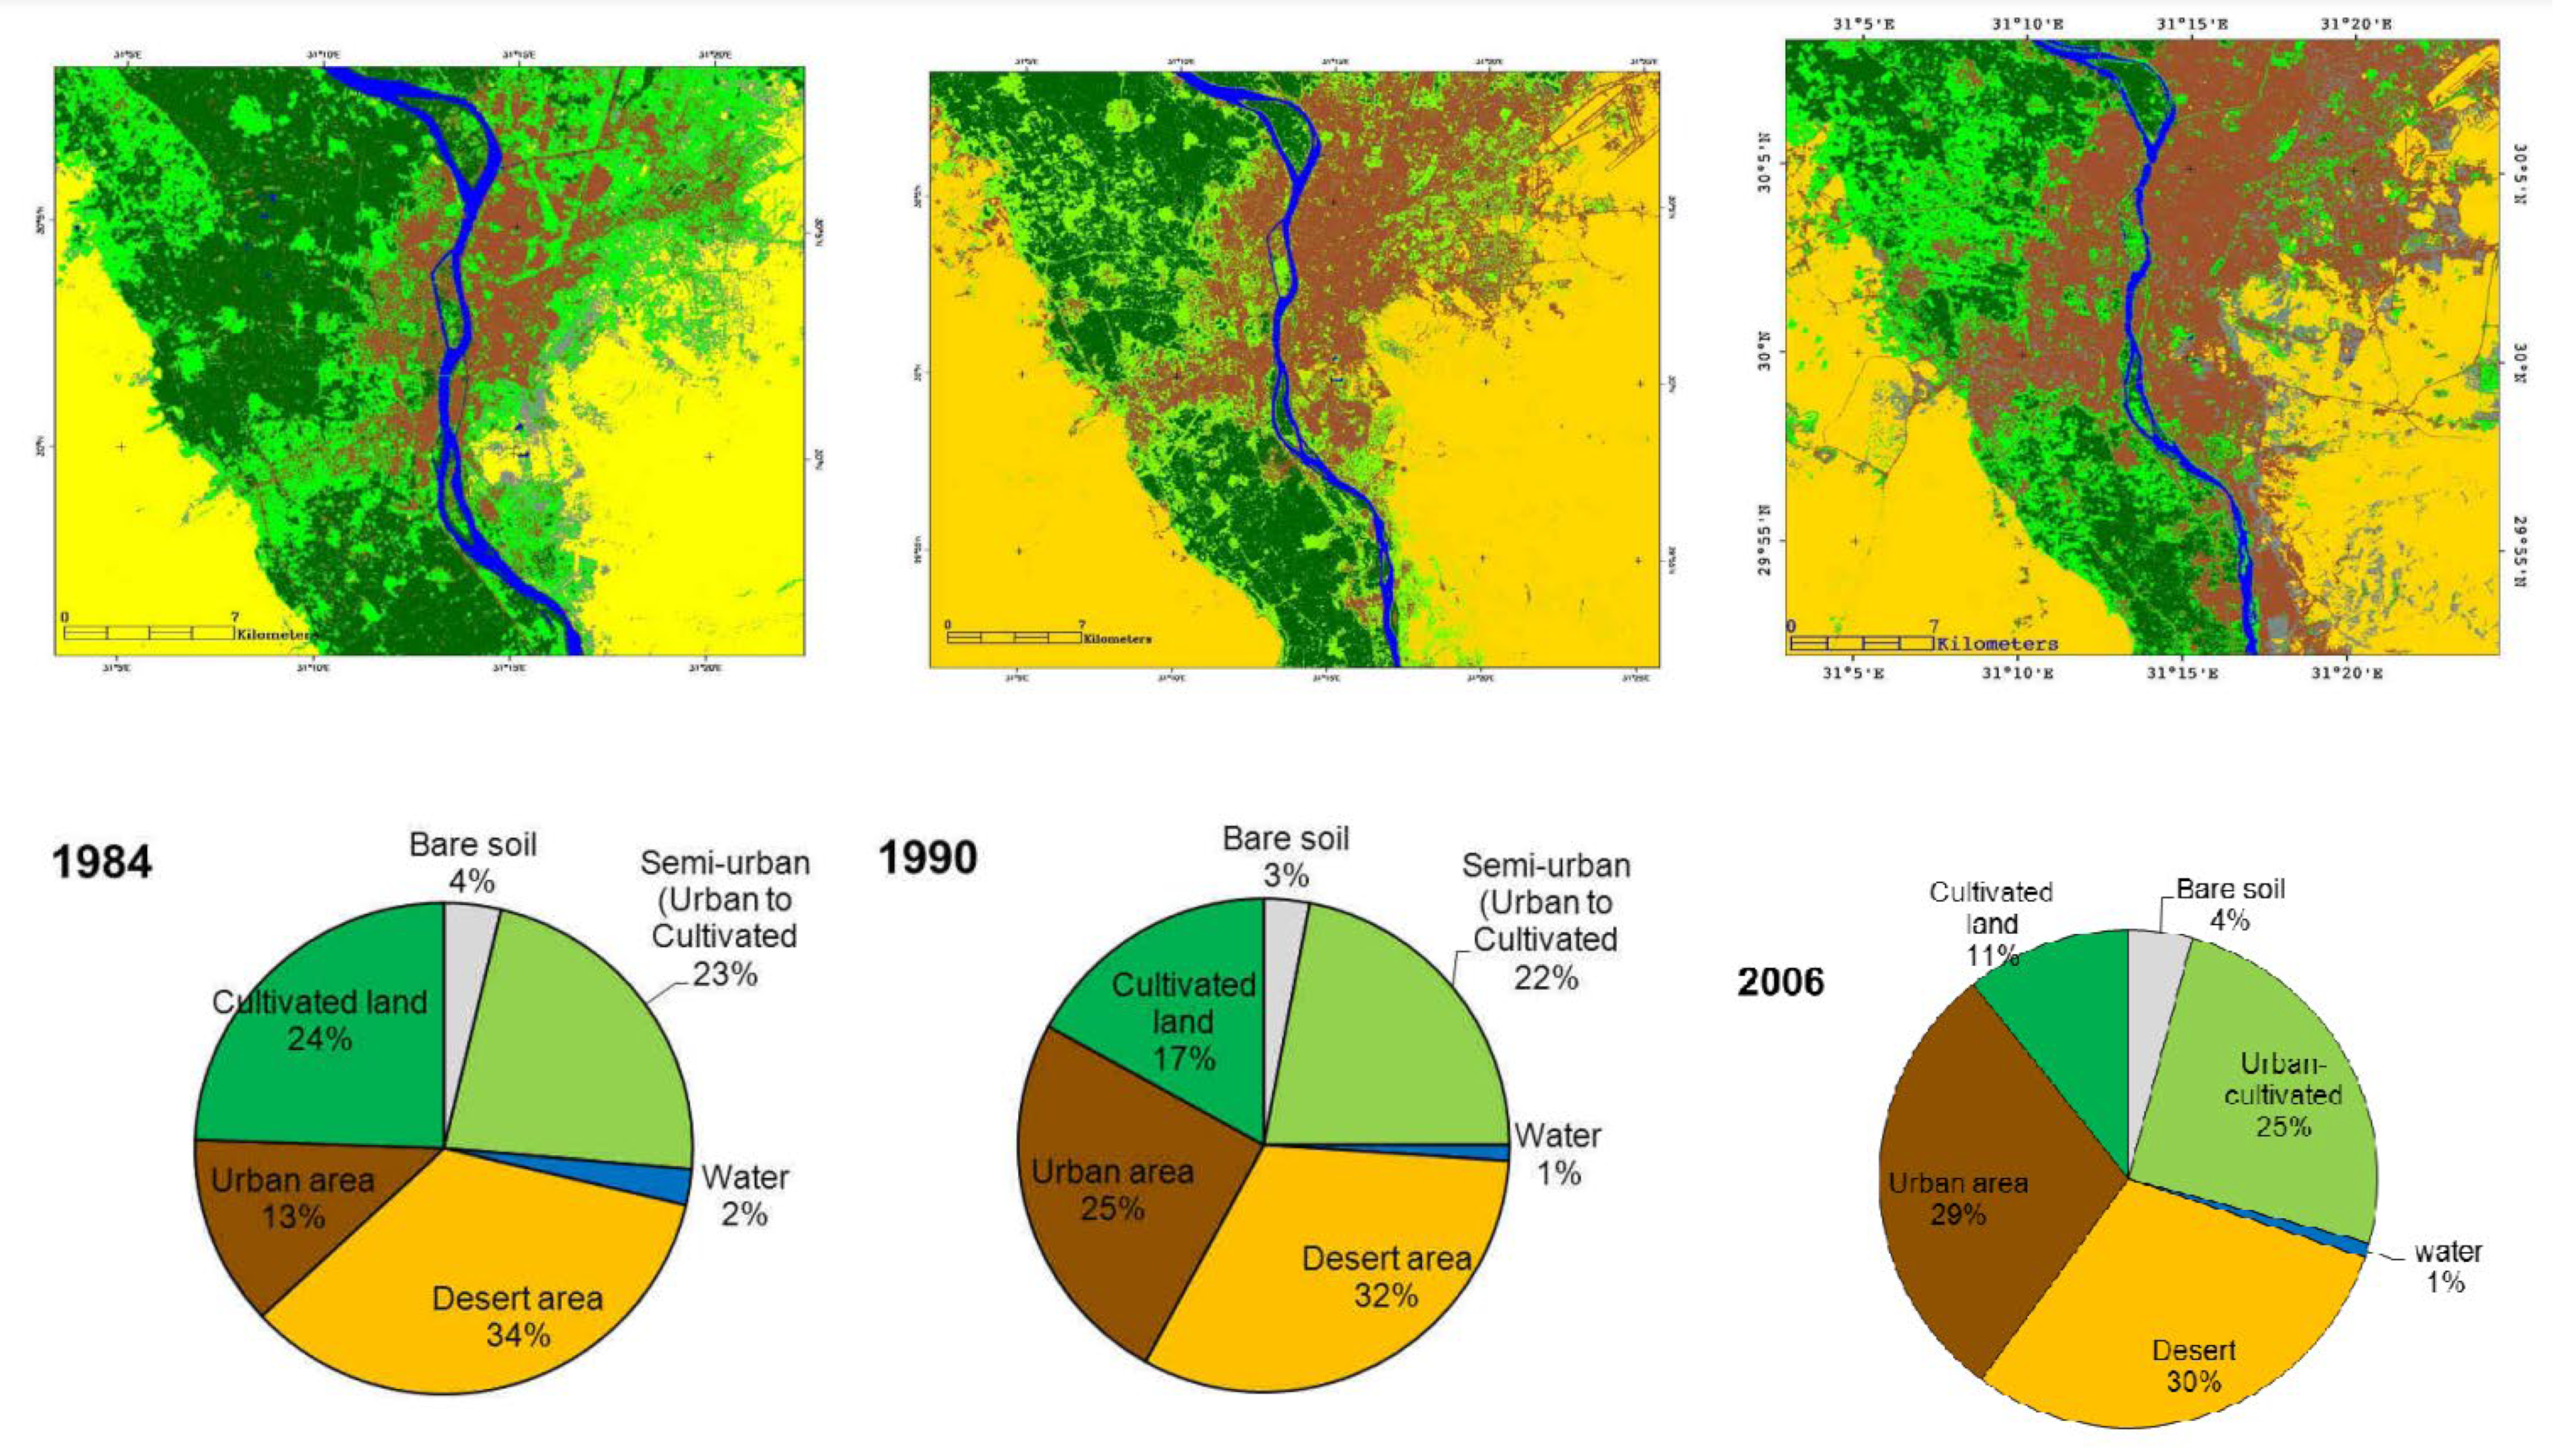
Figure 1. Greater Cairo’s urban growth between 1984 and 2006 [33].
Land 12 02145 g001
Figure 2. Examples of different urban canyon aspect ratios in Cairo city.
Land 12 02145 g002
Figure 3. Research methodology.
Land 12 02145 g003
Figure 4. The theoretical model’s urban geometry: (A) theoretical model’s plan showing the measured canyons and receptors’ locations; (B) 3D view of the theoretical model with trees; (C) full day shading analysis for both orientations; (D) AR cross-sections.
Land 12 02145 g004
Figure 5. Shading distribution for each AR per hour from morning to sunset: (A) north orientation; (B) northeast orientation. Created using SketchUp after aligning the model to the original location of Cairo city.
Land 12 02145 g005
Figure 6. Tree density scenarios: 0%; low density (20%); high density (50%).
Land 12 02145 g006
Figure 7. Existing urban case study: (A) location of the study area; (B) different street widths and building heights; (C) different street orientations; (D) streets selected for this study and location of the receptors for each street on both canyon sides.
Land 12 02145 g007
Figure 8. Tree scenarios for this study: (A) 0%; (B) 20%; (C) 50%.
Land 12 02145 g008
Figure 9. Locations of the receptors (i.e., measuring points) in the middle of each canyon and centralized between trees.
Land 12 02145 g009
Figure 10. Results of the validation: (a,c) comparison between the measured and simulated air temperature and relative humidity; (b) TA RMSE and index of agreement for each model; (d) RH% RMSE and index of agreement for each model.
Land 12 02145 g010
Figure 11. PET values for all aspect ratios of the northern and eastern canyons on both sides at Z = 1.5 m.
Land 12 02145 g011
Figure 12. PET values for all aspect ratios of the northwest and northeast canyons on both sides at Z = 1.5 m.
Land 12 02145 g012
Figure 13. TMRT values for all aspect ratios of the northern, eastern, northeast, and northwest canyons on both sides at Z = 1.5 m.
Land 12 02145 g013
Figure 14. Wind speed values for all aspect ratios of all orientations on both sides at Z = 1.5 m.
Land 12 02145 g014
Figure 15. ∆PET for both sides of each canyon (a side–b side) for the different aspect ratios and orientations at Z = 1.5 m.
Land 12 02145 g015
Figure 16. ∆PET with the 20% and 50% tree scenarios in comparison with the 0% tree scenario for northern and eastern canyons on both sides (a and b) at Z = 1.5 m.
Land 12 02145 g016
Figure 17. ∆PET with the 20% and 50% tree scenarios in comparison with the 0% tree scenario for the northeast and northwest canyons on both sides (a and b) at Z = 1.5 m.
Land 12 02145 g017
Figure 18. ∆PET at Z = 1.5 m for the 20% and 50% tree scenarios compared to the 0% tree scenario for all aspect ratios and orientations at 12:00 (a,c,e,g) and 15:00 (b,d,f,h).
Land 12 02145 g018
Figure 19. Comparing the average ∆PET during the peak daytime period (from 11:00 to 16:00) on both sides for all aspect ratios and orientations at Z = 1.5 m.
Land 12 02145 g019
Figure 20. Comparing the number of hours that the PET was reduced by 8 C° or more on both sides for all aspect ratios and orientations at Z = 1.5 m.
Land 12 02145 g020
Figure 21. The correlation between the aspect ratio and ∆PET of each orientation for both sides (a and b) at Z = 1.5 m.
Land 12 02145 g021
Figure 22. ∆PET with the 20% and 50% tree scenarios compared with the 0% tree scenario for all canyons on both sides (a and b) at Z = 1.5 m.
Land 12 02145 g022
Figure 23. ∆PET for the 20% and 50% tree scenarios in comparison with the 0% tree scenario for S6, and S6′ on both sides (a and b) at Z = 1.5 m.
Land 12 02145 g023
Figure 24. ∆PET at Z = 1.5 m for the 20% and 50% tree scenarios compared to the 0% tree scenario for all aspect ratios and orientations at 12:00 (a,b) and at 15:00 (c,d).
Land 12 02145 g024
Figure 25. Comparing the average ∆PET for the peak daytime hours (from 11:00 to 16:00) on both sides for all aspect ratios and orientations at Z = 1.5 m.
Land 12 02145 g025
Figure 26. Comparing the number of hours that the PET was reduced by 7 C° or more on both sides for all aspect ratios and orientations at Z = 1.5 m.
Land 12 02145 g026
Table 1. All scenarios for the theoretical model.
Urban CanyonCanyon Side
(a or b)
Aspect RatioOrientation 1Orientation 2Tree
Scenario 1
Tree
Scenario 2
Tree
Scenario 3
Total Number of Cases
R1R1a3 to 1North–SouthNE–SW0%20%50%6
R1b3 to 1North–SouthNE–SW0%20%50%6
R2R2a3 to 1East–WestNW–SE0%20%50%6
R2b3 to 1East–WestNW–SE0%20%50%6
R3R3a1 to 2North–SouthNE–SW0%20%50%6
R3b1 to 2North–SouthNE–SW0%20%50%6
R4R4a1 to 2East–WestNW–SE0%20%50%6
R4b1 to 2East–WestNW–SE0%20%50%6
R5R5a1.5 to 1North–SouthNE–SW0%20%50%6
R5b1.5 to 1North–SouthNE–SW0%20%50%6
R6R6a1.5 to 1East–WestNW–SE0%20%50%6
R6b1.5 to 1East–WestNW–SE0%20%50%6
R7R7a1 to 1North–SouthNE–SW0%20%50%6
R7b1 to 1North–SouthNE–SW0%20%50%6
R8R8a1 to 1East–WestNW–SE0%20%50%6
R8b1 to 1East–WestNW–SE0%20%50%6
R9R9a0.5 to 1North–SouthNE–SW0%20%50%6
R9b0.5 to 1North–SouthNE–SW0%20%50%6
R10R10a0.5 to 1East–WestNW–SE0%20%50%6
R10b0.5 to 1East–WestNW–SE0%20%50%6
R11R11a0.25 to 1North–SouthNE–SW0%20%50%6
R11b0.25 to 1North–SouthNE–SW0%20%50%6
R12R12a0.25 to 1East–WestNW–SE0%20%50%6
R12b0.25 to 1East–WestNW–SE0%20%50%6
Total number of cases144
Table 2. Selected urban canyons in the study area and their aspect ratios and orientations.
Abbreviation in Figure 7DStreet NameAvg. Width (m)Avg. Height (m)Aspect Ratio (H/W)OrientationNo. of Cases
S1Rameses St.40200.5 to 1NE ↗6
S2Sayed Anbar St.20211.05 to 1NW ↖6
S3Souq Al-Tawfikiya St.12171.42 to 1NW ↖3
S4Al-Boursa Al-Kadyima St.12242 to 1NE ↗3
S5Al-Boursa Al-Kadyima St.12181.5 to 1NE ↗3
S6Mohamed Bek Al-Alfy St.19180.95 to 1E →6
S6′Waked St.20190.95 to 1E →6
S7Zakriya Ahmed St.9161.8 to 1N ↑3
S8Saraya Al-Azbakiya St.10191.9 to 1E →3
S926 July St.29180.6 to 1E →6
S10Emad Al-Din St.19170.9 to 1N ↑6
S11Bostan Al-Dekkah St.24140.6 to 1N ↑6
S12Suliman Al-Halabi St.20140.7 to 1NW ↖6
Total number of cases63
Table 3. Cases of the theoretical model covered in the study area (highlighted in green).
NStreetNEStreetEStreetNWStreet
1 to 3 1 to 3 1 to 3 1 to 3
1 to 2S71 to 2S41 to 2S81 to 2
1 to 1.5 1 to 1.5S51 to 1.5 1 to 1.5S3
1 to 1S101 to 1 1 to 1S6 and S6′1 to 1S2
1 to 0.5S111 to 0.5S11 to 0.5S91 to 0.5S12
1 to 0.25 1 to 0.25 1 to 0.25 1 to 0.25
Table 4. Model setup and geometry for both the theoretical model and the case study.
Modeling InformationTheoretical ModelCase Study Model
Area sizeX = 165, Y = 140, Z = 30X = 212, Y = 151, Z = 22
Grid resolutionX = 3, Y = 3, Z = 3X = 3, Y = 3, Z = 3
OrientationModel (1) = 0, Model (2) = −450
Split lower grid box into 5 sub cellsYesYes
Telescoping appliedTelescoping factor of 20%, starting at a 63 m heightNot applied, as the maximum building height is not very tall
Maximum model height *198 m66 m
Nesting grids **5 Grids, sandy soil5 Grids, sandy soil
DEMNot applied, as the site is flatNot applied, as the site is flat
SoilAsphalt for roads, concrete for sidewalks, and sand under buildingsAsphalt for roads, concrete for sidewalks, and sand under buildings
Buildings materialsDefault wall—moderate insulationDefault wall—moderate insulation
Tree model and sizeLatin name: Acer Platanoides ***
Height = 15 m; crown width = 7 m
Latin name: Acer Platanoides ***
Height = 15 m; crown width = 7 m
* The model’s height is more than double the height of the tallest building, as recommended by the software [37]. ** Nesting grids were added, in addition to 5 cells from the boundary sides of the model being kept empty, as recommended by the software developers [37]. *** Acer Platanoides was selected from the ENVI-met database, as it met the required criteria of having a large canopy, high LAD, and good canopy height, matching the recommendations in [38,39].
Table 5. Statistical analysis of the correlation between the aspect ratio and the 20% and 50% tree scenarios’ avg. ΔPET (peak hours) for all orientations on both sides.
SPSS Statistics AnalysisN(a) Avg. ΔPET (Peak) 20% TreesN(a) Avg. ΔPET (Peak) 50% TreesN(b) Avg. ΔPET (Peak) 20% TreesN(b) Avg. ΔPET (Peak) 50% TreesE(a) Avg. ΔPET (Peak) 20% TreesE(a) Avg. ΔPETT (Peak) 50% TreesE(b) Avg. ΔPET (Peak) 20% TreesE(b) Avg. ΔPET (Peak) 50% TreesNW(a) Avg. ΔPET (Peak) 20% TreesNW(a) Avg. ΔPET (Peak) 50% TreesNW(b) Avg. ΔPET (Peak) 20% TreesNW(b) Avg. ΔPET (Peak) 50% TreesNE(a) Avg. ΔPET (Peak) 20% TreesNE(a) Avg. ΔPET (Peak) 50% TreesNE(b) Avg. ΔPET (Peak) 20% TreesNE(b) Avg. ΔPET (Peak) 50% Trees
Mean2.6673.5002.8334.1676.00010.0005.3338.1673.6674.0003.1674.8332.6674.8333.1674.000
Std. Deviation3.2042.0743.4882.7871.0951.0951.5062.2291.6332.2802.4012.7142.0662.4831.1692.898
(K-S) Test, c0.1050.200 e0.1210.0410.0560.0560.0690.0120.200 e0.200 e0.200 e0.200 e0.1250.1970.200 e0.094
Correlation AR−0.871 *−0.932 **−0.863 *−0.971 **−0.849 *−0.849 *−0.878 *−0.802−0.929 **−0.858 *−0.887 *−0.911 *−0.853 *−0.936 **−0.900 *−0.794
Sig. (2-tailed)0.0240.0070.0270.0010.0330.0330.0220.0550.0070.0290.0190.0120.0310.0060.0140.059
*Correlation is significant at the 0.05 level (2-tailed).
**Correlation is significant at the 0.01 level (2-tailed).
Kolmogorov–Smirnov test: data are not normally distributed.
Spearman correlation.
Pearson correlation.
cLilliefors significance correction.
eThis is the lower bound of the true significance.
Disclaimer/Publisher’s Note: The statements, opinions and data contained in all publications are solely those of the individual author(s) and contributor(s) and not of MDPI and/or the editor(s). MDPI and/or the editor(s) disclaim responsibility for any injury to people or property resulting from any ideas, methods, instructions or products referred to in the content.