
Plant Community, Soil and Microclimate Attributes after 70 Years of Natural Recovery of an Abandoned Limestone Quarry


Abstract
1. Introduction
2. Materials and Methods
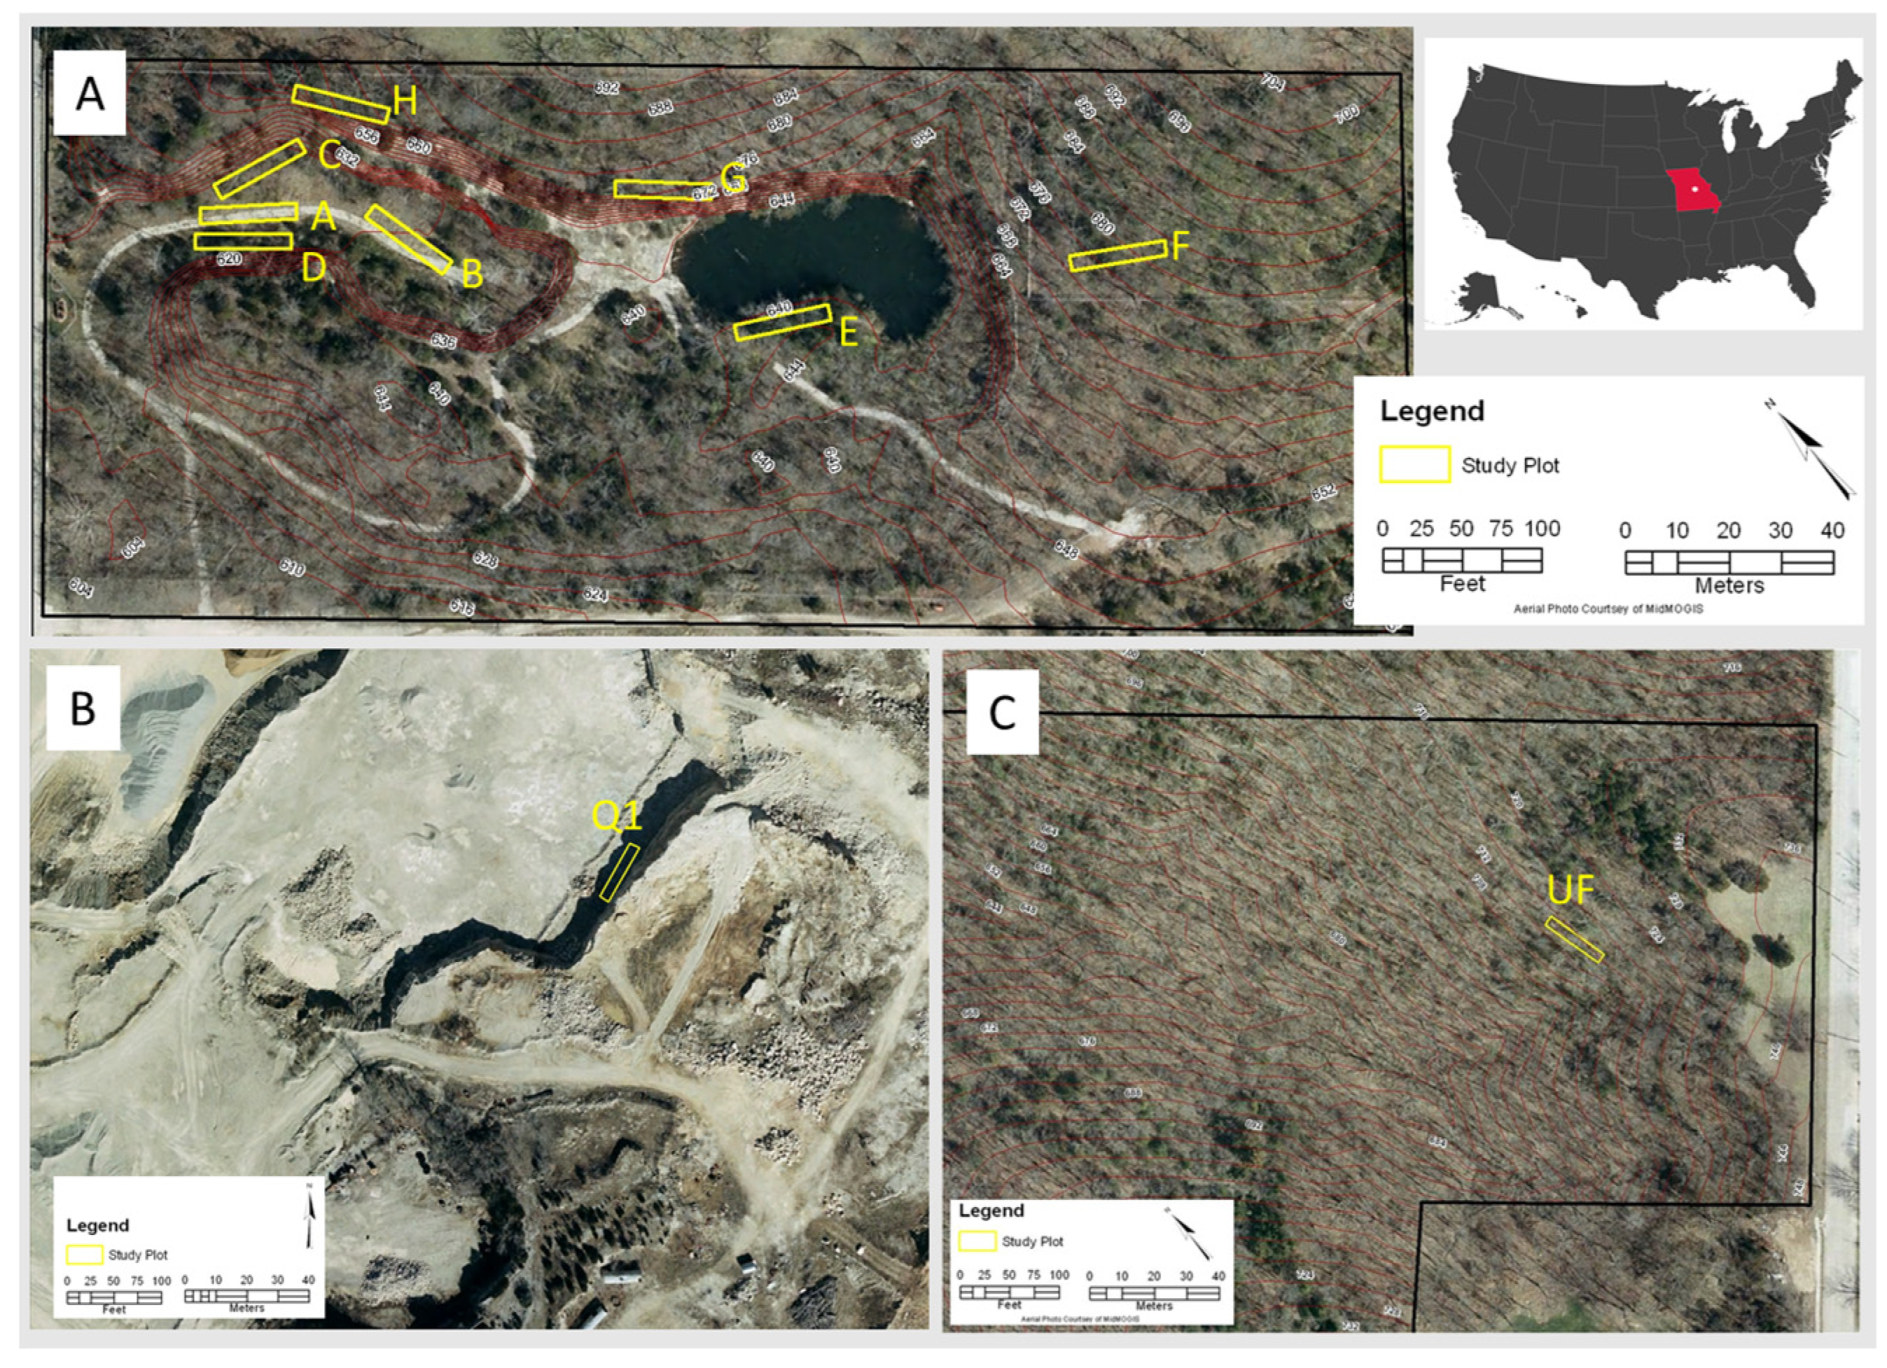
2.1. Study Site
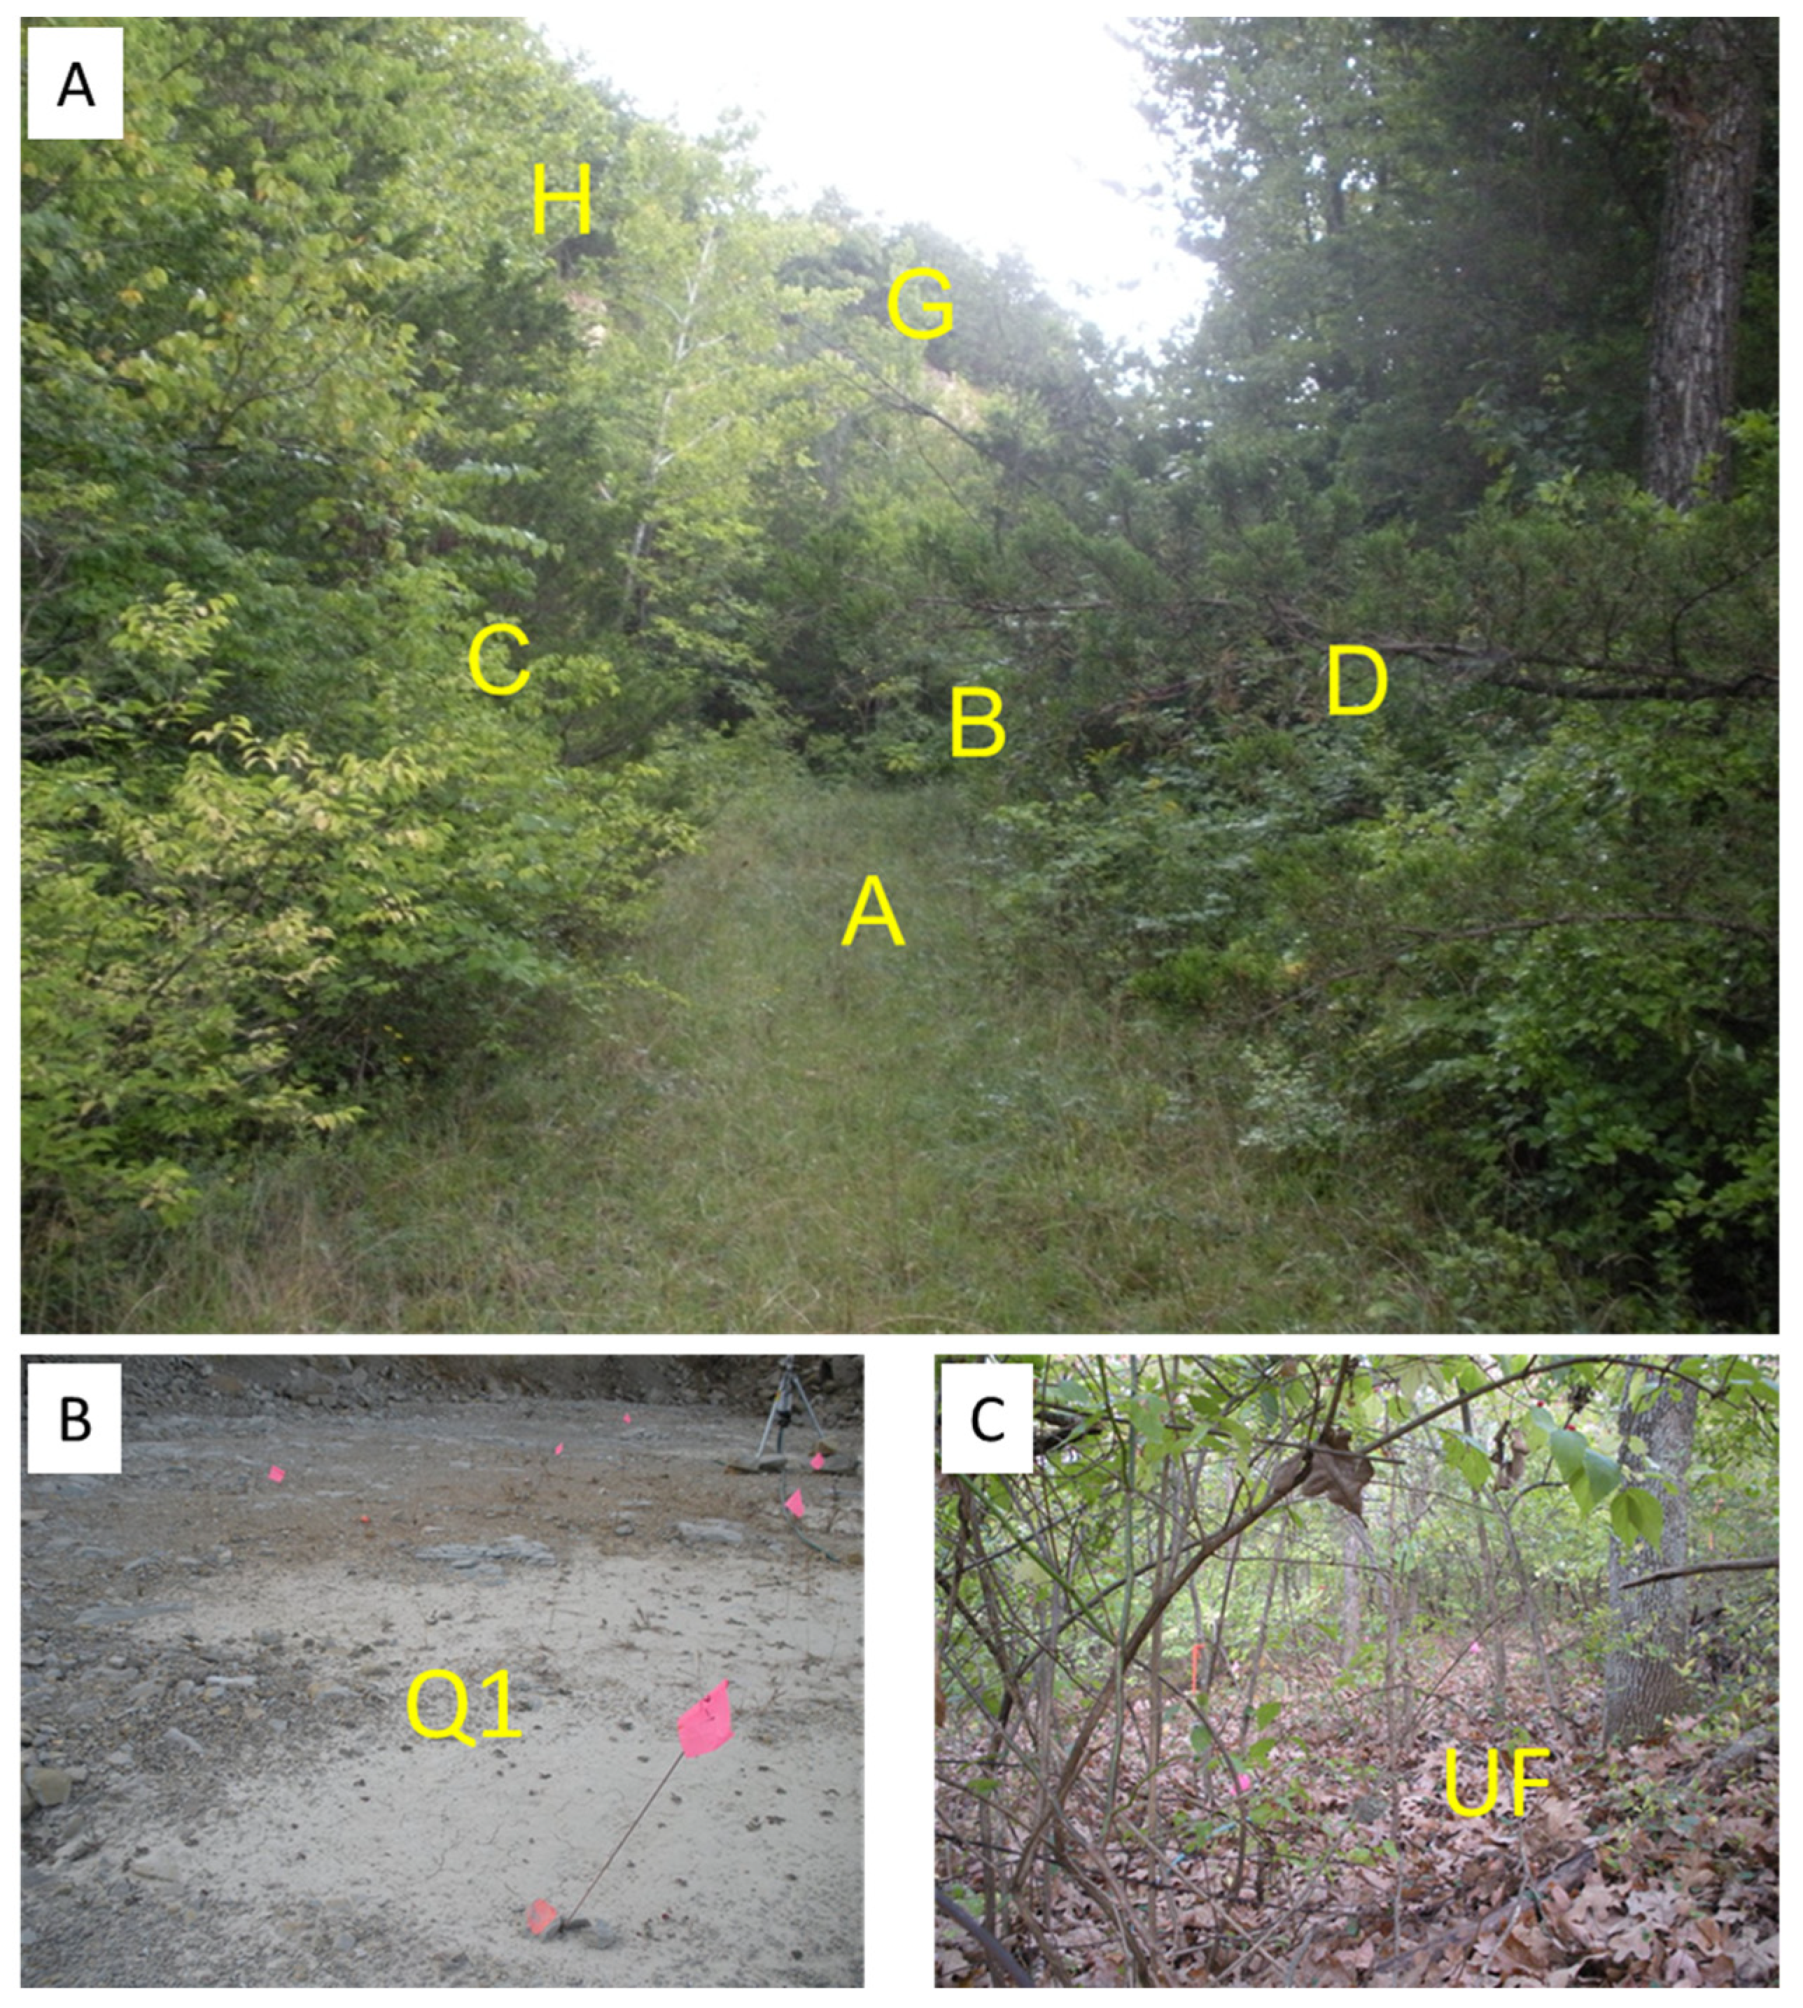
2.2. Data Collection
2.3. Data Analysis
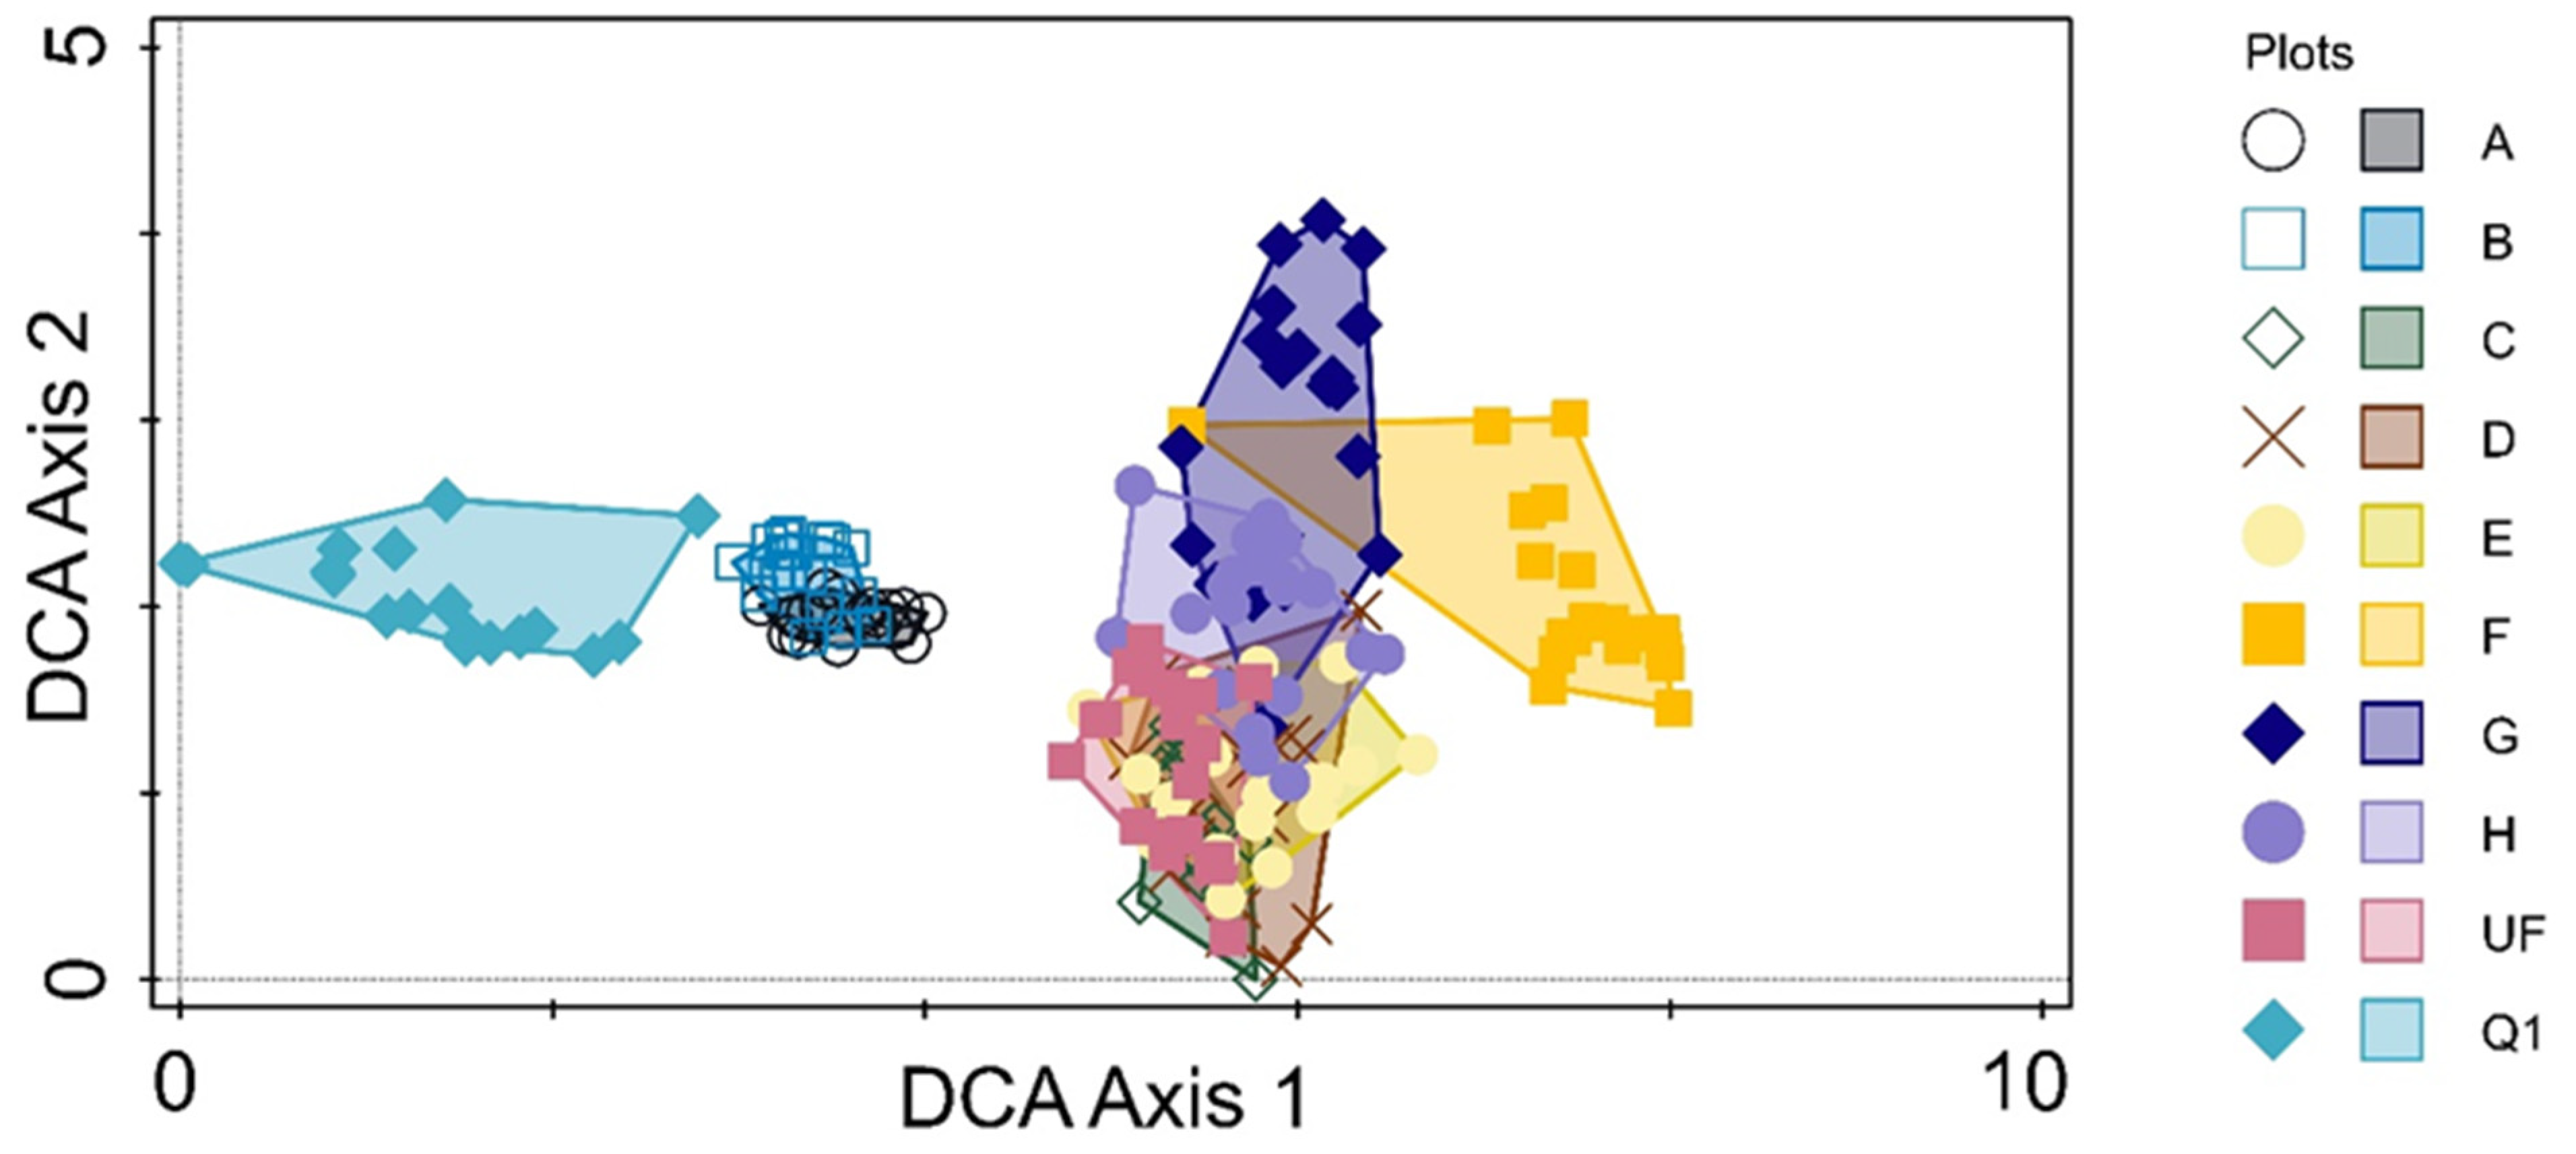
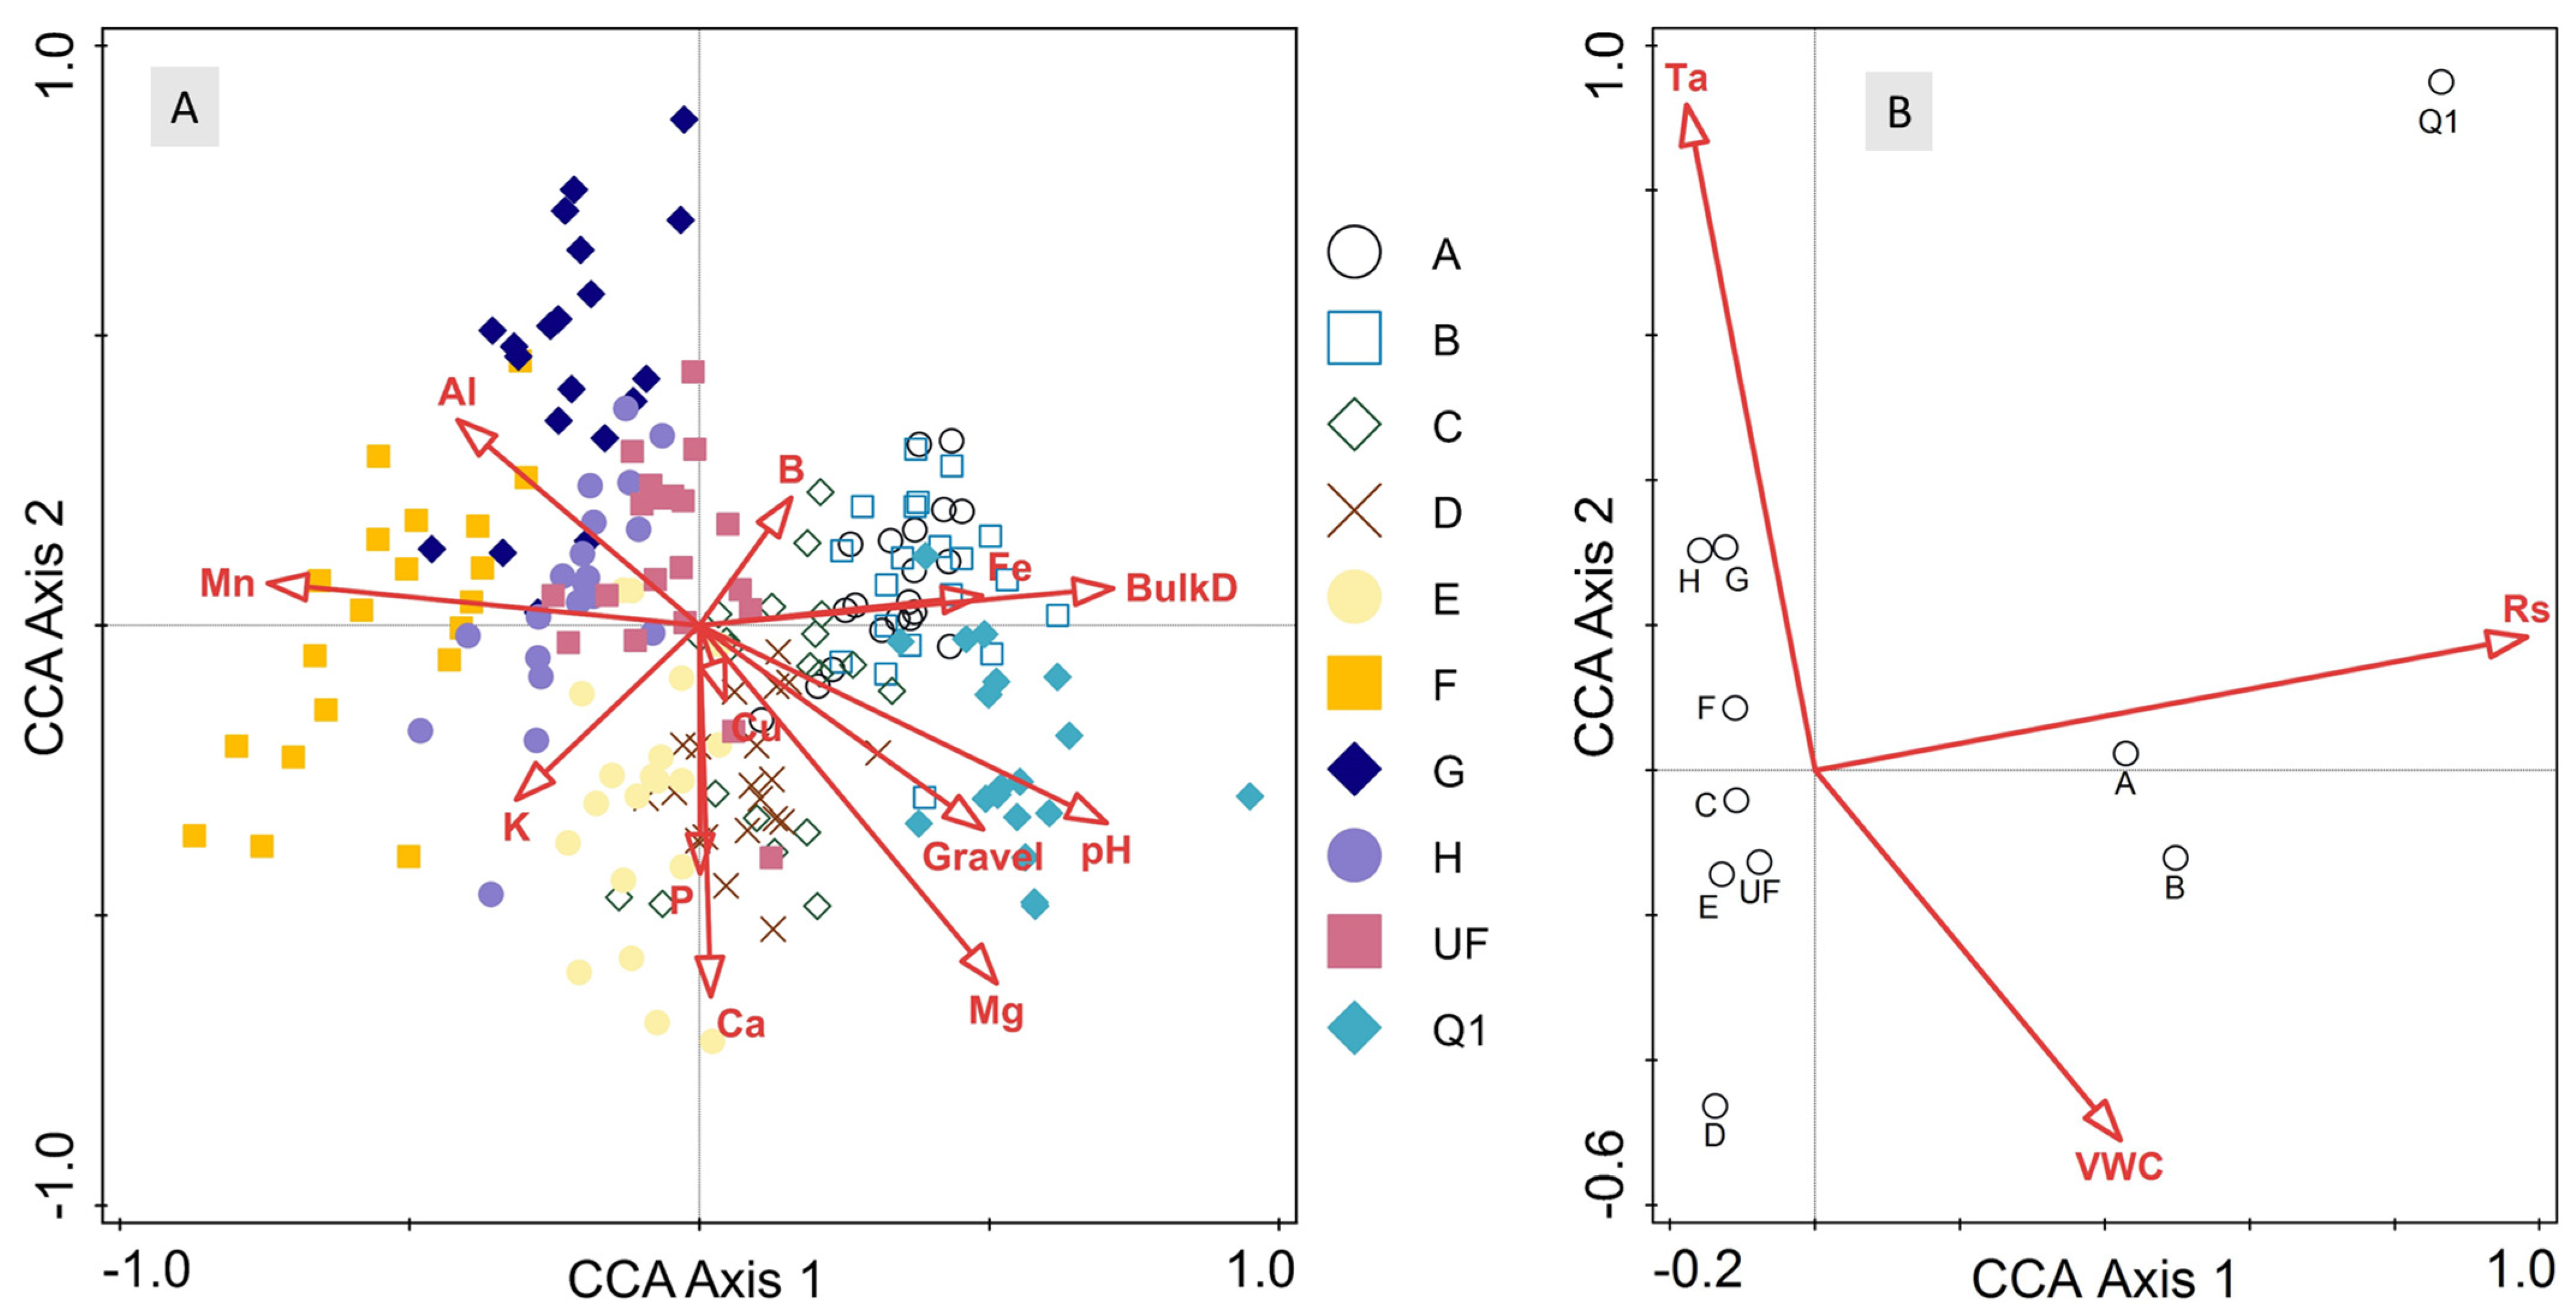
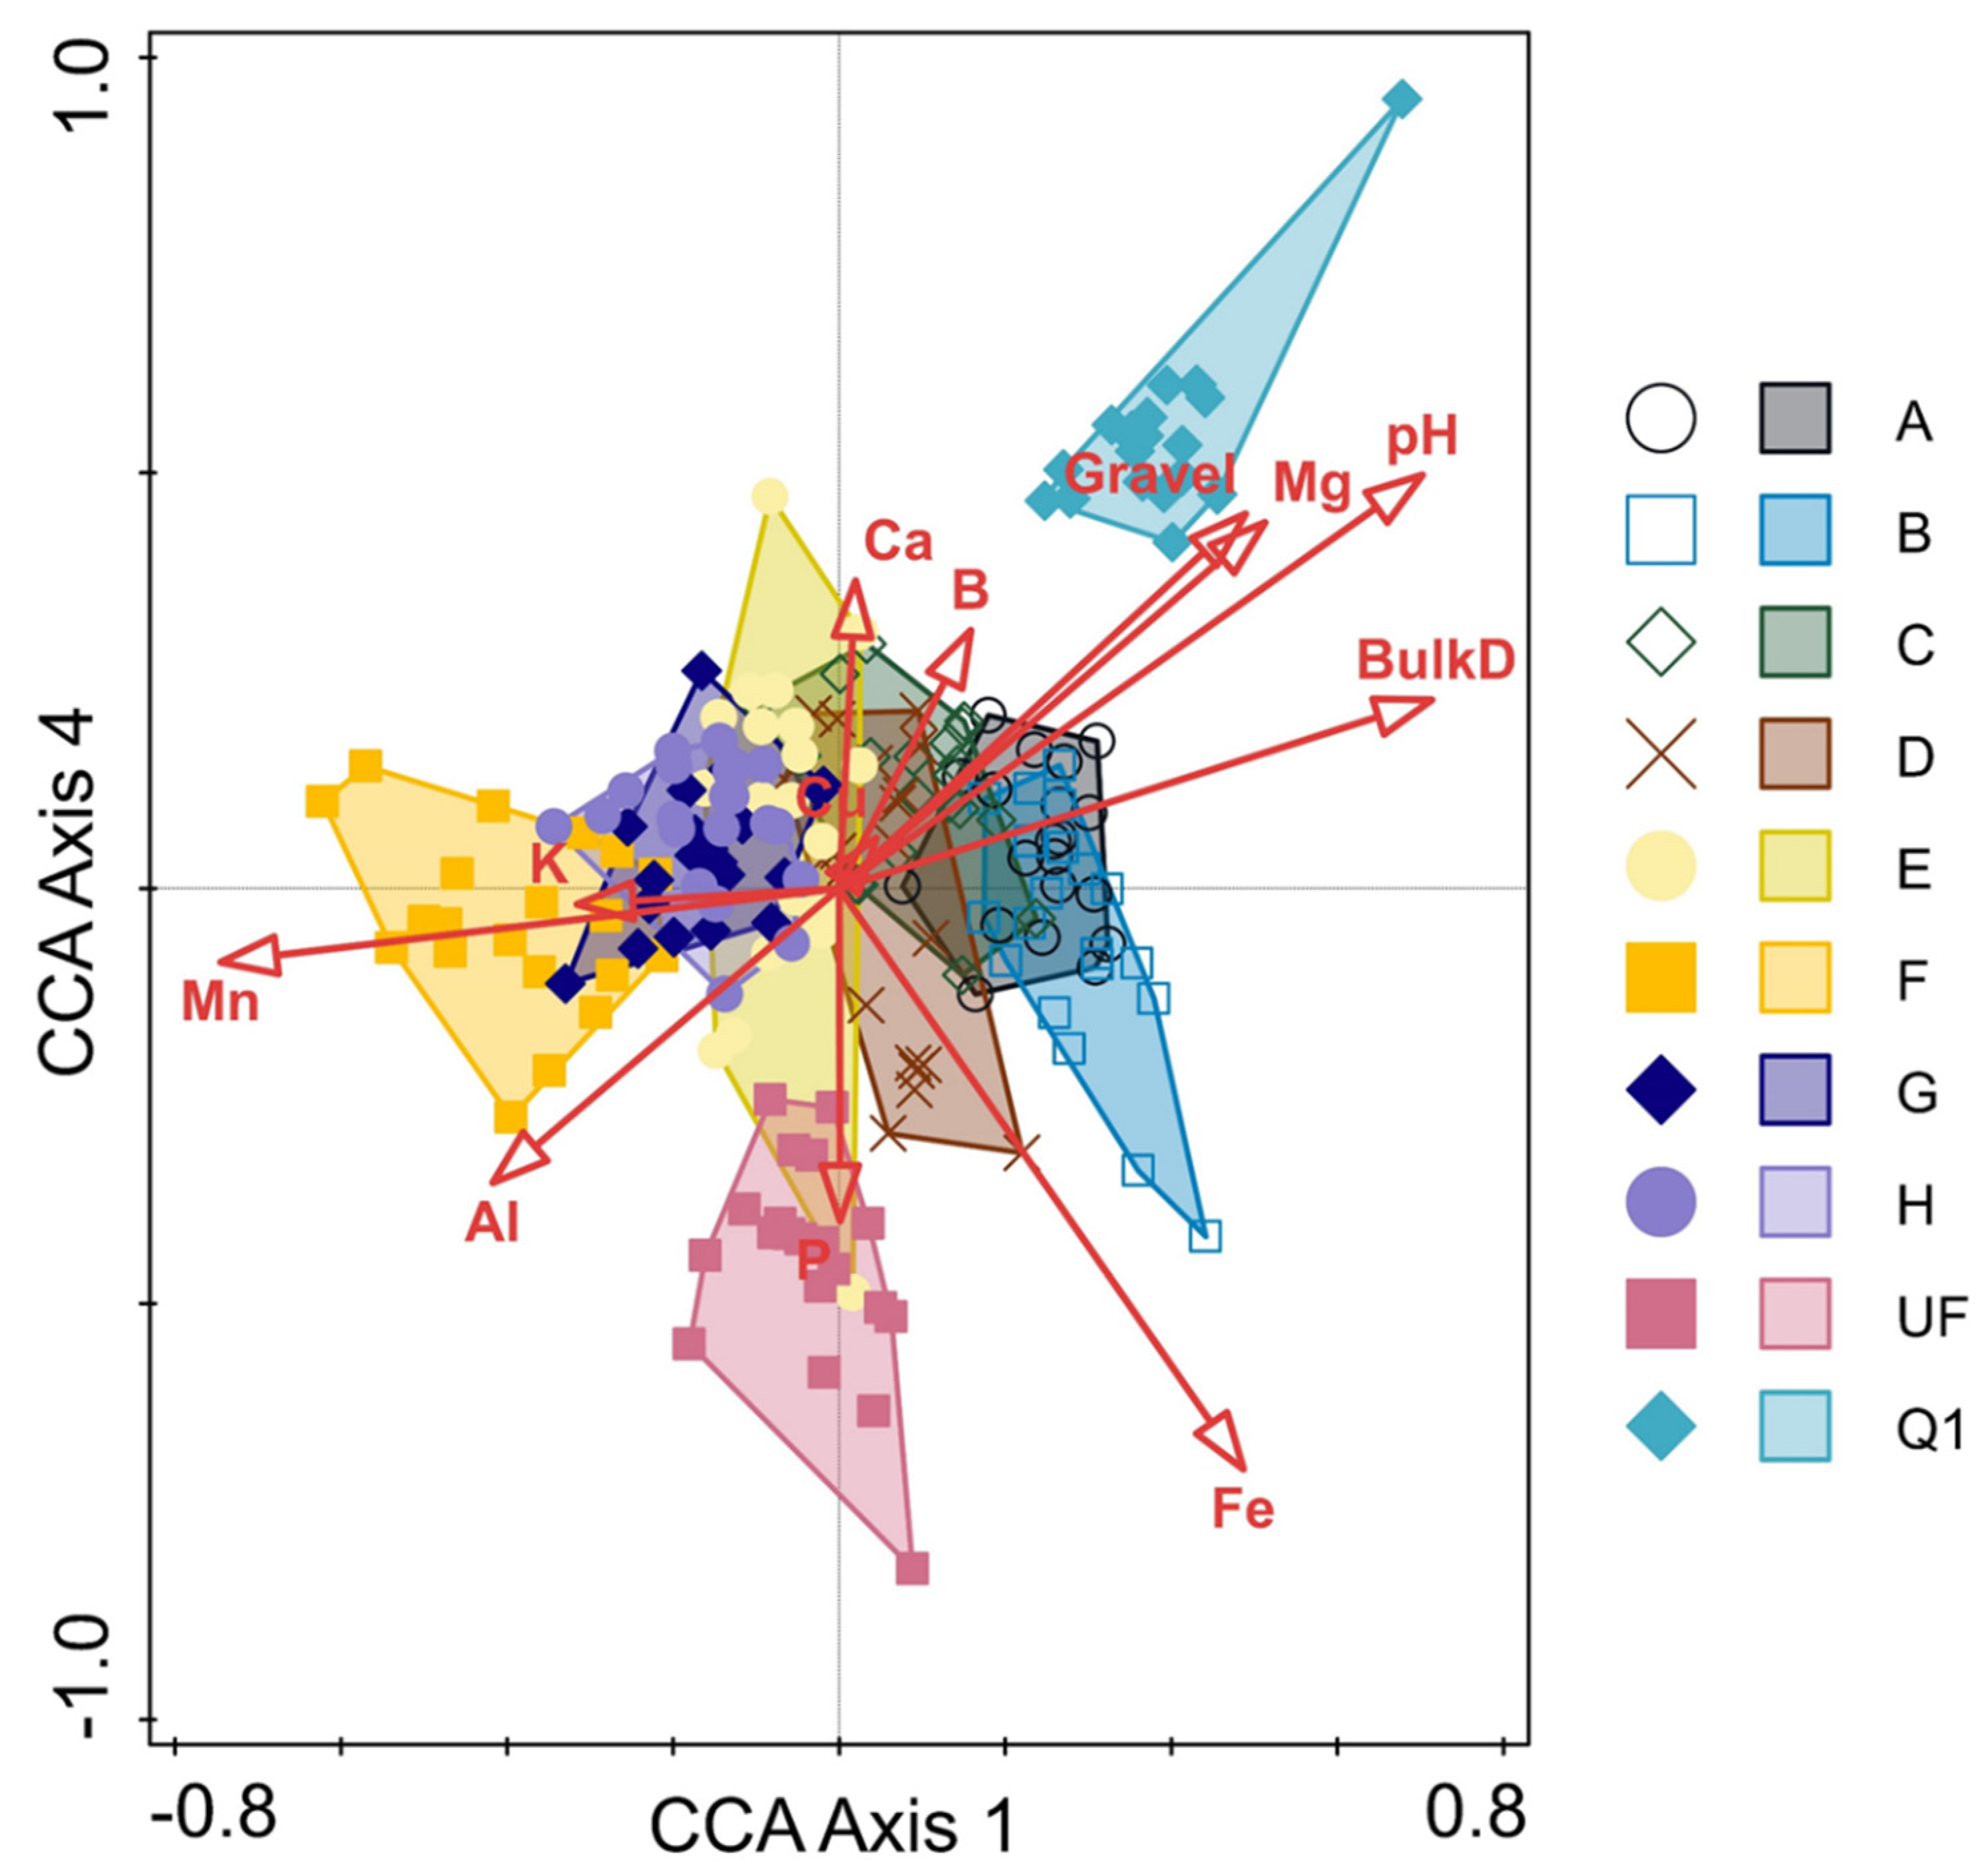
3. Results
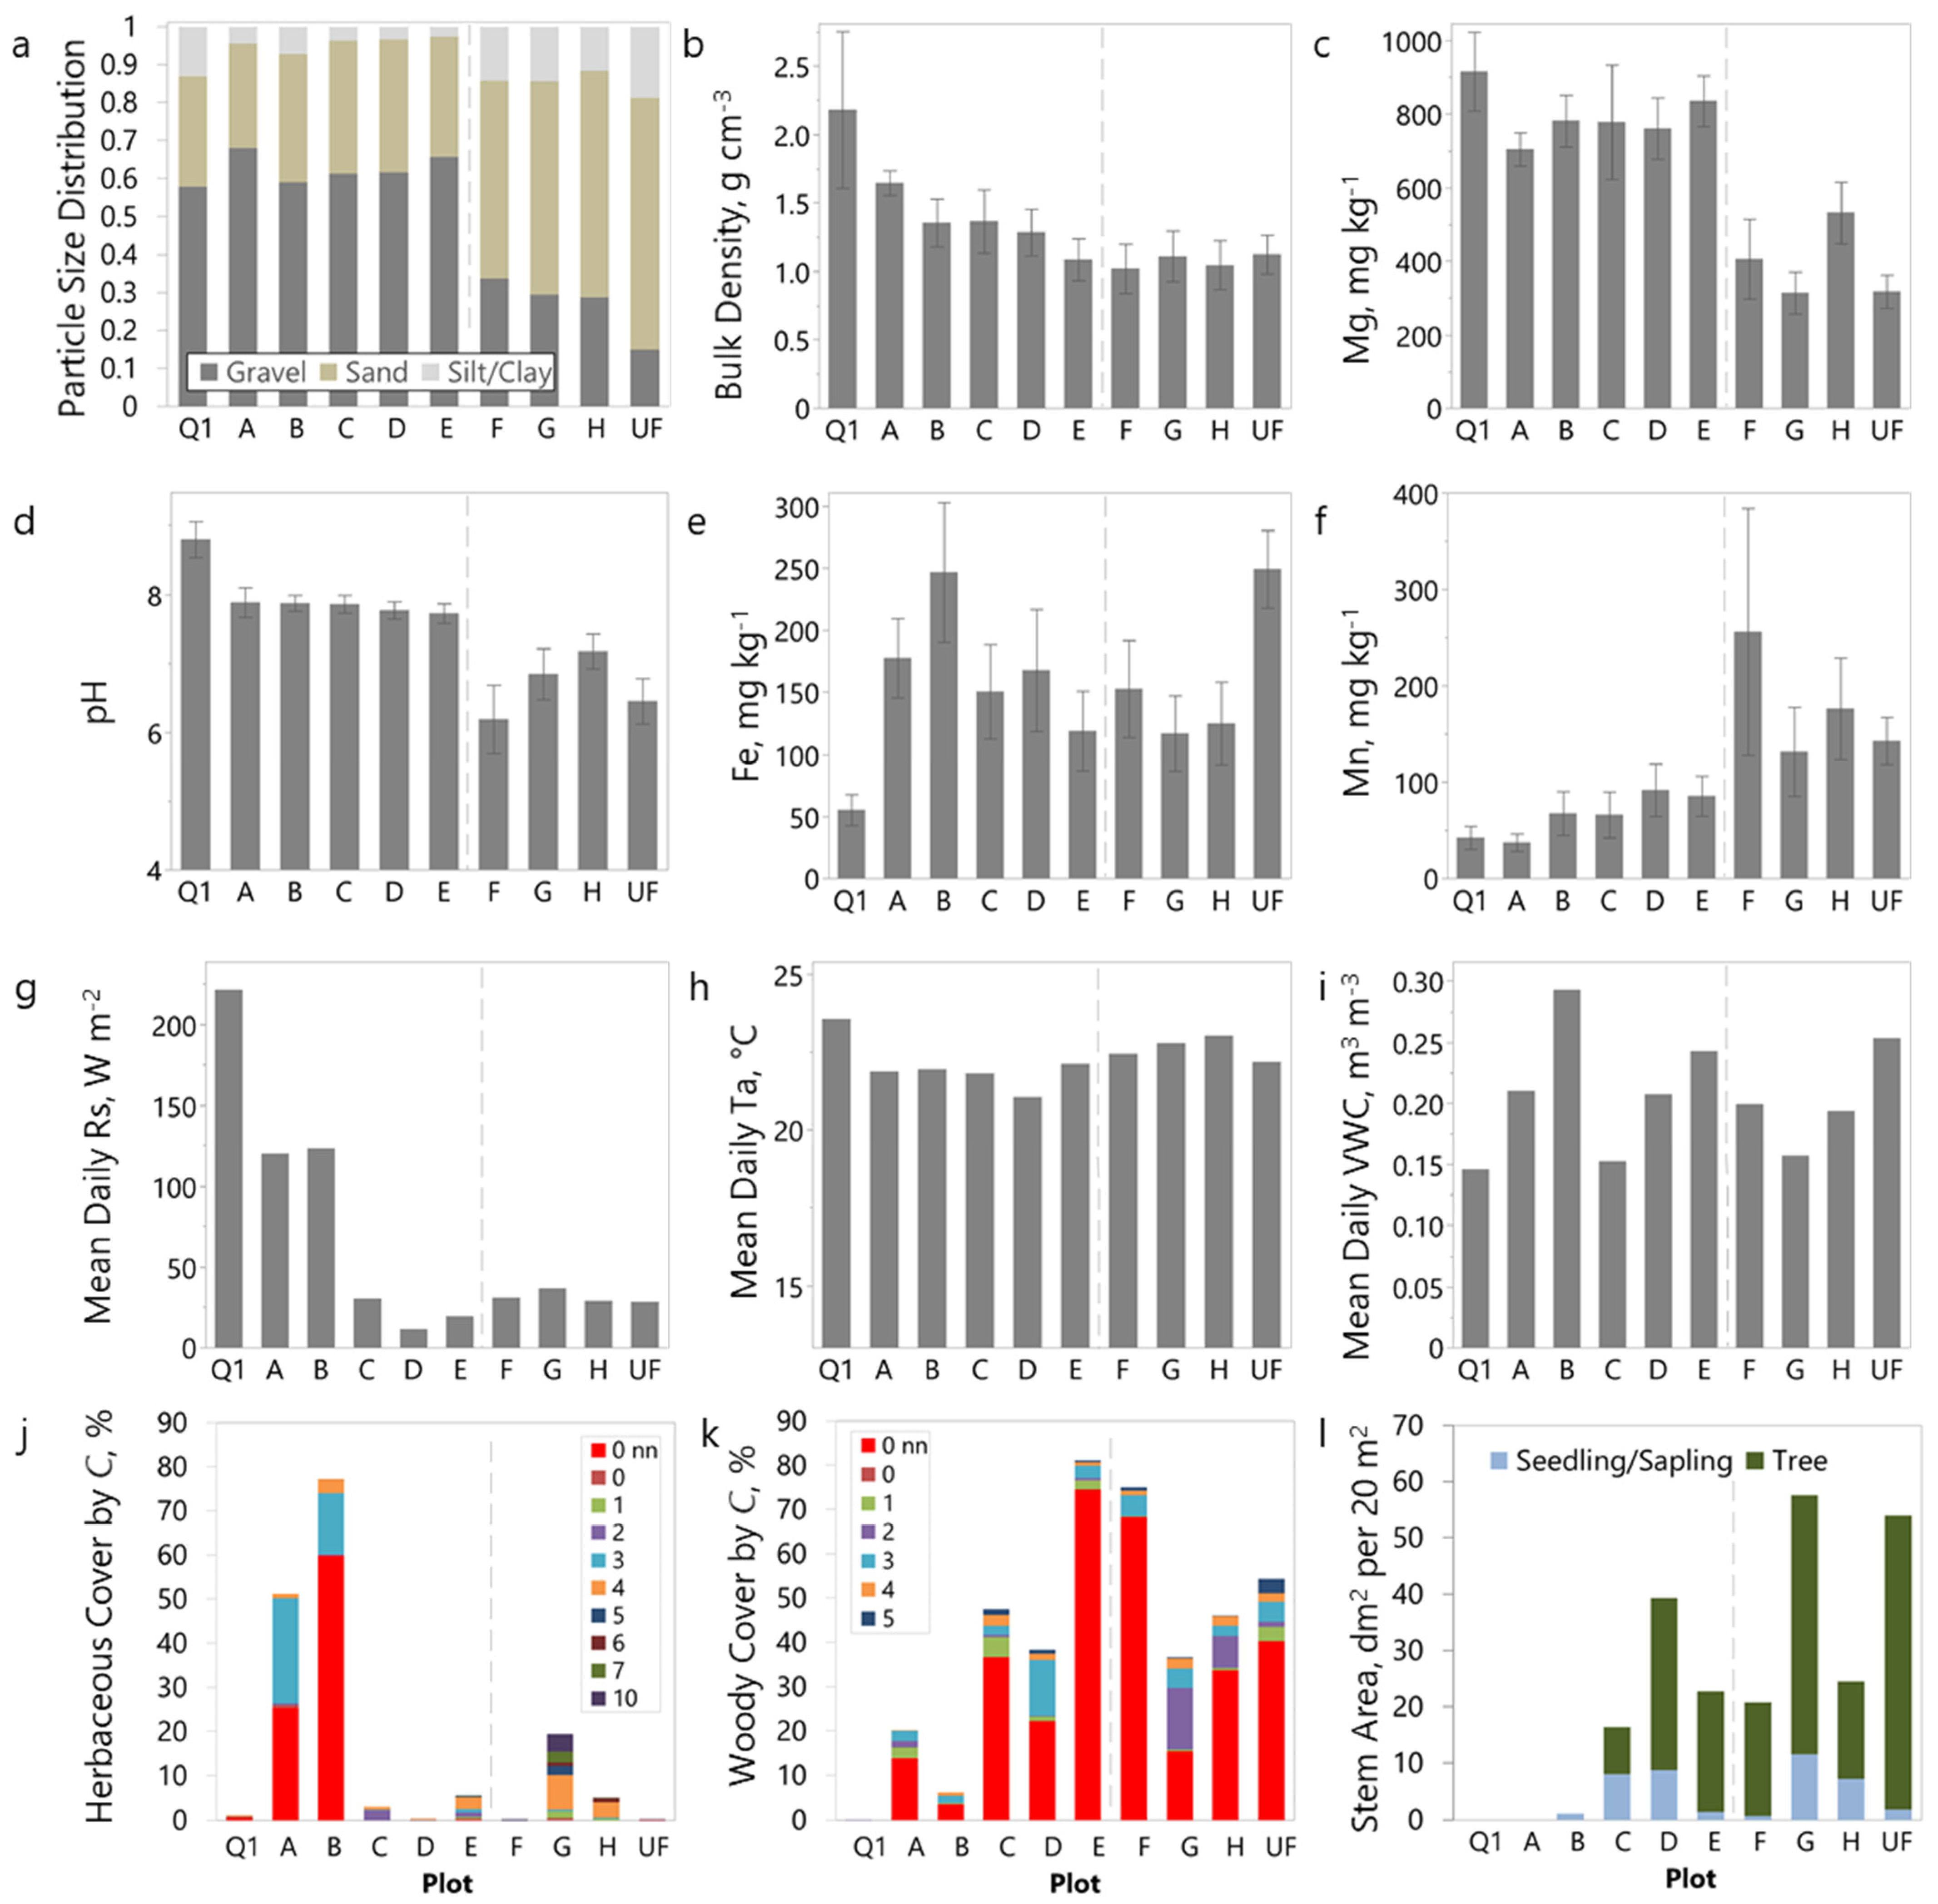
3.1. Soil
3.2. Microclimate and Vegetation
4. Discussion
Study Implications
5. Conclusions
Supplementary Materials
Author Contributions
Funding
Data Availability Statement
Acknowledgments
Conflicts of Interest
Appendix A

References
- Oates, J.A.H. Lime and Limestone: Chemistry and Technology, Production and Uses; Wiley: New York, NY, USA, 2008. [Google Scholar]
- Sparenberg, O.; Heymann, M. Introduction: Resource challenges and constructions of scarcity in the nineteenth and twentieth centuries. Eur. Rev. Hist. Rev. Eur. D’histoire 2020, 27, 243–252. [Google Scholar] [CrossRef]
- Worrell, E.; Price, L.; Martin, N.; Hendriks, C.; Meida, L.O. Carbon Dioxide Emissions From The Global Cement Industry. Annu. Rev. Energy Environ. 2001, 26, 303–329. [Google Scholar] [CrossRef]
- Maus, V.; Giljum, S.; Gutschlhofer, J.; Da Silva, D.M.; Probst, M.; Gass, S.L.B.; Luckeneder, S.; Lieber, M.; McCallum, I. A global-scale data set of mining areas. Sci. Data 2020, 7, 289. [Google Scholar] [CrossRef] [PubMed]
- Wood, L. Global Limestone Market Analysis over the Next Few Yaers. Available online: https://www.businesswire.com/news/home/20200609005311/en/Global-Limestone-Market-Analysis-and-Forecasts-2020-2027---Steady-Growth-Projected-over-the-Next-Few-Years---ResearchAndMarkets.com (accessed on 24 March 2021).
- Gagen, P.; Gunn, J. A geomorphological approach to limestone quarry restoration. Geomorphol. Environ. Plan. 1988, 21, 121–142. [Google Scholar]
- Wheater, C.P.; Cullen, W.R. The Flora and Invertebrate Fauna of Abandoned Limestone Quarries in Derbyshire, United Kingdom. Restor. Ecol. 1997, 5, 77–84. [Google Scholar] [CrossRef]
- Sullivan, J.; Aggett, J.; Amacher, G.; Burger, J. Financial viability of reforesting reclaimed surface mined lands, the burden of site conversion costs, and carbon payments as reforestation incentives. Resour. Policy 2005, 30, 247–258. [Google Scholar] [CrossRef]
- Skousen, J.; Zipper, C.E. Post-mining policies and practices in the Eastern USA coal region. Int. J. Coal Sci. Technol. 2014, 1, 135–151. [Google Scholar] [CrossRef]
- Koca, M.Y.; Kıncal, C. Abandoned stone quarries in and around the Izmir city centre and their geo-environmental impacts—Turkey. Eng. Geol. 2004, 75, 49–67. [Google Scholar] [CrossRef]
- Clemente, A.S.; Werner, C.; Máguas, C.; Cabral, M.S.; Martins-Loução, M.A.; Correia, O. Restoration of a Limestone Quarry: Effect of Soil Amendments on the Establishment of Native Mediterranean Sclerophyllous Shrubs. Restor. Ecol. 2004, 12, 20–28. [Google Scholar] [CrossRef]
- Humphries, R. The establishment of vegetation on quarry materials: Physical and chemical constraints. Ecol. Quarr. 1981, 1, 55–61. [Google Scholar]
- Novák, J.; Prach, K. Vegetation succession in basalt quarries: Pattern on a landscape scale. Appl. Veg. Sci. 2003, 6, 111–116. [Google Scholar] [CrossRef]
- Zobel, M.; van der Maarel, E.; Dupré, C. Species pool: The concept, its determination and significance for community restoration. Appl. Veg. Sci. 1998, 1, 55–66. [Google Scholar] [CrossRef]
- Ballesteros, M.; Cañadas, E.M.; Foronda, A.; Fernández-Ondoño, E.; Peñas, J.; Lorite, J. Vegetation recovery of gypsum quarries: Short-term sowing response to different soil treatments. Appl. Veg. Sci. 2012, 15, 187–197. [Google Scholar] [CrossRef]
- Gentili, R.; Sgorbati, S.; Baroni, C. Plant Species Patterns and Restoration Perspectives in the Highly Disturbed Environment of the Carrara Marble Quarries (Apuan Alps, Italy). Restor. Ecol. 2011, 19, 32–42. [Google Scholar] [CrossRef]
- Gilardelli, F.; Sgorbati, S.; Citterio, S.; Gentili, R. Restoring Limestone Quarries: Hayseed, Commercial Seed Mixture or Spontaneous Succession? Land Degrad. Dev. 2016, 27, 316–324. [Google Scholar] [CrossRef]
- Pyšek, P.; Prach, K.; Müllerová, J.; Joyce, C. The role of vegetation succession in ecosystem restoration: Introduction. Appl. Veg. Sci. 2001, 4, 7–10. [Google Scholar] [CrossRef]
- Prach, K.; Bartha, S.; Joyce, C.B.; Pyšek, P.; van Diggelen, R.; Wiegleb, G. The role of spontaneous vegetation succession in ecosystem restoration: A perspective. Appl. Veg. Sci. 2001, 4, 111–114. [Google Scholar] [CrossRef]
- Tischew, S.; Kirmer, A. Implementation of Basic Studies in the Ecological Restoration of Surface-Mined Land. Restor. Ecol. 2007, 15, 321–325. [Google Scholar] [CrossRef]
- Nicolau, J.-M. Trends in relief design and construction in opencast mining reclamation. Land Degrad. Dev. 2003, 14, 215–226. [Google Scholar] [CrossRef]
- Legwaila, I.A.; Lange, E.; Cripps, J. Quarry reclamation in England: A review of techniques. Jasmr 2015, 4, 55–79. [Google Scholar] [CrossRef]
- Martínez-Ruiz, C.; Fernández-Santos, B.; Putwain, P.D.; Fernández-Gómez, M.J. Natural and man-induced revegetation on mining wastes: Changes in the floristic composition during early succession. Ecol. Eng. 2007, 30, 286–294. [Google Scholar] [CrossRef]
- Navarro-Ramos, S.E.; Sparacino, J.; Rodríguez, J.M.; Filippini, E.; Marsal-Castillo, B.E.; García-Cannata, L.; Renison, D.; Torres, R.C. Active revegetation after mining: What is the contribution of peer-reviewed studies? Heliyon 2022, 8, e09179. [Google Scholar] [CrossRef] [PubMed]
- Řehounková, K.; Řehounek, J.; Prach, K. Near-Natural Restoration vs. Technical Reclamation of Mining Sites in the Czech Republic; University of South Bohemia in České Budějovice: České Budějovice, Czech Republic, 2011; Volume 1, pp. 1–59. [Google Scholar]
- Albaladejo Montoro, J.; Alvarez Rogel, J.; Querejeta, J.; Díaz, E.; Castillo, V. Three hydro-seeding revegetation techniques for soil erosion control on anthropic steep slopes. Land Degrad. Dev. 2000, 11, 315–325. [Google Scholar] [CrossRef]
- Cohen-Fernández, A.C.; Naeth, M.A.; Wilkinson, S.R. Anthroposol development from limestone quarry substrates. Can. J. Soil Sci. 2013, 93, 555–566. [Google Scholar] [CrossRef]
- Carabassa, V.; Domene, X.; Díaz, E.; Alcañiz, J.M. Mid-term effects on ecosystem services of quarry restoration with Technosols under Mediterranean conditions: 10-year impacts on soil organic carbon and vegetation development. Restor. Ecol. 2020, 28, 960–970. [Google Scholar] [CrossRef]
- Richardson, J.A.; Evans, M.E. Restoration of Grassland After Magnesian Limestone Quarrying. J. Appl. Ecol. 1986, 23, 317–332. [Google Scholar] [CrossRef]
- Perrow, M.R.; Davy, A.J. Handbook of Ecological Restoration; Cambridge University Press: Cambridge, UK, 2002; Volume 2, pp. 1–30. [Google Scholar]
- Prach, K.; Hobbs, R.J. Spontaneous Succession versus Technical Reclamation in the Restoration of Disturbed Sites. Restor. Ecol. 2008, 16, 363–366. [Google Scholar] [CrossRef]
- Davis, B.N.K.; Lakhani, K.H.; Brown, M.C.; Park, D.G. Early Seral Communities in a Limestone Quarry: An Experimental Study of Treatment Effects on Cover and Richness of Vegetation. J. Appl. Ecol. 1985, 22, 473–490. [Google Scholar] [CrossRef]
- Kirmer, A.; Mahn, E.-G. Spontaneous and Initiated Succession on Unvegetated Slopes in the Abandoned Lignite-Mining Area of Goitsche, Germany. Appl. Veg. Sci. 2001, 4, 19–27. [Google Scholar] [CrossRef]
- Prach, K.; Pyšek, P. Using spontaneous succession for restoration of human-disturbed habitats: Experience from Central Europe. Ecol. Eng. 2001, 17, 55–62. [Google Scholar] [CrossRef]
- Ursic, K.; Kenkel, N.C.; Larson, D.W. Revegetation dynamics of cliff faces in abandoned limestone quarries. J. Appl. Ecol. 1997, 34, 289–303. [Google Scholar] [CrossRef]
- Davis, B.N.K. Chalk and limestone quarries as wildlife habitats. Miner. Environ. 1979, 1, 48–56. [Google Scholar] [CrossRef]
- Thompson, R.L.; Abbott, J.R.; Shupe, A.E. Vascular Flora from Five Plant Habitats of an Abandoned Limestone Quarry in Clark County, Kentucky. J. Ky. Acad. Sci. 2005, 66, 24–34. [Google Scholar] [CrossRef]
- Šálek, M. Spontaneous succession on opencast mining sites: Implications for bird biodiversity. J. Appl. Ecol. 2012, 49, 1417–1425. [Google Scholar] [CrossRef]
- Tropek, R.; Kadlec, T.; Karesova, P.; Spitzer, L.; Kocarek, P.; Malenovsky, I.; Banar, P.; Tuf, I.H.; Hejda, M.; Konvicka, M. Spontaneous succession in limestone quarries as an effective restoration tool for endangered arthropods and plants. J. Appl. Ecol. 2010, 47, 139–147. [Google Scholar] [CrossRef]
- The Land Reclamation Act. 444.760. 1990. Available online: MO.gov (accessed on 2 December 2022).
- NOAA. NowData-National Oceanic and Atmospheric Administration (NOAA) Online Weather Data. Available online: https://www.weather.gov/wrh/climate?wfo=lsx (accessed on 22 July 2021).
- NRCS. Soil Survey Staff, Natural Resources Conservation Service, United States Department of Agriculture. In Web Soil Survey; NRCS: Washington, DC, USA, 2021. [Google Scholar]
- Nelson, P. The Terrestrial Natural Communities of Missouri; Missouri Natural Areas Committee: Jefferson City, MO, USA, 1985.
- Shannon, C.; Weaver, W. The Mathematical Theory of Communication; University of Illinois Press: Urbana-Champaign, IL, USA, 1949; p. 117. [Google Scholar]
- Ladd, D. Coefficients of Conservatism for Missouri Vascular Flora; The Nature Conservancy: St. Louis, MO, USA, 1993. [Google Scholar]
- Ladd, D. Prairie restoration flora of the St. Louis Region of Illinois and Missouri. Missouriensis 2004, 24, 22–52. [Google Scholar]
- Swink, F.; Wilhelm, G. Plants of the Chicago Region, 4th ed.; Indiana Academy of Science: Indianapolis, IN, USA, 1994. [Google Scholar]
- Wilhelm, G.S.; Masters, L. Floristic Quality Assessment in the Chicago Region and Application Computer Programs; Morton Arboretum: Lisle, IL, USA, 1995; p. 43212-1192. [Google Scholar]
- Hendershot, W.H.; Lalande, H.; Duquette, M. Soil reaction and exchangeable acidity. Soil Sampl. Methods Anal. 2008, 2, 173–178. [Google Scholar]
- Ziadi, N.; Tran, T. Mehlich 3-extractable elements. In Soil Sampling and Methods of Analysis; Carter, M.R., Gregorich, E.G., Eds.; CRC Press: Boca Raton, FL, USA, 2008; pp. 81–88. [Google Scholar]
- Ter Braak, C.J.; Šmilauer, P. Canoco Reference Manual and USER’S Guide: Software for Ordination (Version 5.10); Biometris, Wageningen University & Research: Wageningen, The Netherlands, 2018. [Google Scholar]
- Braak, C.J.F.T. Canonical Correspondence Analysis: A New Eigenvector Technique for Multivariate Direct Gradient Analysis. Ecology 1986, 67, 1167. [Google Scholar] [CrossRef]
- Ter Braak, C.J.F. The Analysis of Vegetation-Environment Relationships by Canonical Correspondence Analysis. Vegetatio 1987, 69, 69–77. [Google Scholar] [CrossRef]
- Kishchuk, B.E. Calcareous Soils, Their Properties and Potential Limitations to Conifer Growth in Southeastern British Columbia and Western Alberta: A Literature Review; Information Report-Northern Forestry Centre, Canadian Forest Service: Edmonton, AB, Canada, 2000. [Google Scholar]
- Rajaniemi, T.K. Why Does Fertilization Reduce Plant Species Diversity? Testing Three Competition-Based Hypotheses. J. Ecol. 2002, 90, 316–324. [Google Scholar] [CrossRef]
- NADN. National Atmospheric Deposition Network NTN Site MO03. Available online: http://nadp2.slh.wisc.edu/data/sites/siteDetails.aspx?net=NTN&id=MO03 (accessed on 13 October 2022).
- Diaz, S.; Cabido, M.; Casanoves, F. Plant functional traits and environmental filters at a regional scale. J. Veg. Sci. 1998, 9, 113–122. [Google Scholar] [CrossRef]
- Ter Braak, C.J.; Smilauer, P. CANOCO Reference Manual and CanoDraw for Windows User’s Guide: Software for Canonical Community Ordination (Version 4.5). 2002. Available online: www.canoco.com (accessed on 15 November 2022).
- Weidlich, E.W.A.; Nelson, C.R.; Maron, J.L.; Callaway, R.M.; Delory, B.M.; Temperton, V.M. Priority effects and ecological restoration. Restor. Ecol. 2021, 29, e13317. [Google Scholar] [CrossRef]
- Ozinga, W.A.; Schaminée, J.H.J.; Bekker, R.M.; Bonn, S.; Poschlod, P.; Tackenberg, O.; Bakker, J.; Groenendael, J.M.v. Predictability of plant species composition from environmental conditions is constrained by dispersal limitation. Oikos 2005, 108, 555–561. [Google Scholar] [CrossRef]
- Knapp, B.O.; Stephan, K.; Hubbart, J.A. Structure and composition of an oak-hickory forest after over 60 years of repeated prescribed burning in Missouri, U.S.A. For. Ecol. Manag. 2015, 344, 95–109. [Google Scholar] [CrossRef]
- Stephan, K.; Hubbart, J. Microclimate, Soil and Vegetation Community Charactersitics in Different Stages of Prairie Restoration. 2022. in preparation. Available online: https://prairiefork.org/ (accessed on 26 December 2022).
- Luken, J.O. Management of Plant Invasions: Implicating Ecological Succession. In Assessment and Management of Plant Invasions; Luken, J.O., Thieret, J.W., Eds.; Springer: New York, NY, USA, 1997; pp. 133–144. [Google Scholar]
- Prach, K.; Řehounková, K.; Lencová, K.; Jírová, A.; Konvalinková, P.; Mudrák, O.; Študent, V.; Vaněček, Z.; Tichý, L.; Petřík, P.; et al. Vegetation succession in restoration of disturbed sites in Central Europe: The direction of succession and species richness across 19 seres. Appl. Veg. Sci. 2014, 17, 193–200. [Google Scholar] [CrossRef]
- Tischew, S.; Lorenz, A. Spontaneous Development of Peri-Urban Woodlands in Lignite Mining Areas of Eastern Germany. In Wild Urban Woodlands: New Perspectives for Urban Forestry; Kowarik, I., Körner, S., Eds.; Springer: Berlin/Heidelberg, Germany, 2005; pp. 163–180. [Google Scholar]
- Zipper, C.E.; Burger, J.A.; Barton, C.D.; Skousen, J.G. Rebuilding Soils on Mined Land for Native Forests in Appalachia. Soil Sci. Soc. Am. J. 2013, 77, 337–349. [Google Scholar] [CrossRef]


| Plot | Cover (dm2 m−2, %) | S | H | C | % Exotic Species | % Exotic Cover | Tree Age | ||||||||||
|---|---|---|---|---|---|---|---|---|---|---|---|---|---|---|---|---|---|
| Herb. | Wd. | Total | Herb. | Wd. | Total | Herb. | Wd. | Total | Herb. | Wd. | Total | Herb. | Wd. | Herb. | Wd. | (y, SD) | |
| Q1 | 1.1 | 0.03 | 1.1 | 13 | 2 | 15 | 2.1 | 0.2 | 2.2 | 1.1 | 2 | 1.1 | 54 | 0 | 42 | 0 | n/a |
| A | 51.2 | 20.1 | 71.4 | 21 | 11 | 32 | 1.3 | 1.2 | 1.9 | 1.5 | 0.6 | 1.2 | 33 | 36 | 50 | 69 | n/a |
| B | 77.2 | 6.3 | 83.5 | 19 | 7 | 26 | 0.8 | 1.2 | 1.1 | 0.7 | 1.4 | 0.8 | 37 | 43 | 77 | 56 | n/a |
| C | 3 | 47.4 | 50.4 | 9 | 20 | 29 | 1.3 | 1.5 | 1.7 | 2.4 | 0.6 | 0.7 | 22 | 30 | 1 | 77 | 28 (10) |
| D | 0.3 | 38.3 | 38.6 | 5 | 18 | 23 | 1 | 2 | 2 | 3.3 | 1.3 | 1.3 | 20 | 33 | 0 | 58 | 42 (19) |
| E | 5.5 | 81.1 | 86.6 | 16 | 22 | 38 | 2.2 | 1.5 | 1.8 | 3.1 | 0.2 | 0.4 | 31 | 32 | 2 | 92 | 46 (10) |
| F | 0.2 | 75 | 75.2 | 1 | 12 | 13 | 0 | 0.4 | 0.4 | 10 | 0.3 | 0.3 | 0 | 33 | 0 | 91 | 63 (19) |
| G | 19.4 | 36.6 | 56 | 17 | 13 | 30 | 2.2 | 1.8 | 2.6 | 5.5 | 1.4 | 2.8 | 0 | 38 | 0 | 42 | 85 (4) |
| H | 5.1 | 46.1 | 51.2 | 10 | 19 | 29 | 1.8 | 1.6 | 2 | 4.2 | 0.7 | 1 | 0 | 26 | 0 | 73 | 57 (5) |
| UF | 0.2 | 54.3 | 54.5 | 4 | 18 | 22 | 0.9 | 1.7 | 1.7 | 3.2 | 0.8 | 0.8 | 25 | 22 | 9 | 74 | 70 (29) |
Disclaimer/Publisher’s Note: The statements, opinions and data contained in all publications are solely those of the individual author(s) and contributor(s) and not of MDPI and/or the editor(s). MDPI and/or the editor(s) disclaim responsibility for any injury to people or property resulting from any ideas, methods, instructions or products referred to in the content. |
© 2022 by the authors. Licensee MDPI, Basel, Switzerland. This article is an open access article distributed under the terms and conditions of the Creative Commons Attribution (CC BY) license (https://creativecommons.org/licenses/by/4.0/).
Share and Cite
Stephan, K.; Hubbart, J.A. Plant Community, Soil and Microclimate Attributes after 70 Years of Natural Recovery of an Abandoned Limestone Quarry. Land 2023, 12, 117. https://doi.org/10.3390/land12010117
Stephan K, Hubbart JA. Plant Community, Soil and Microclimate Attributes after 70 Years of Natural Recovery of an Abandoned Limestone Quarry. Land. 2023; 12(1):117. https://doi.org/10.3390/land12010117
Chicago/Turabian StyleStephan, Kirsten, and Jason A. Hubbart. 2023. "Plant Community, Soil and Microclimate Attributes after 70 Years of Natural Recovery of an Abandoned Limestone Quarry" Land 12, no. 1: 117. https://doi.org/10.3390/land12010117
APA StyleStephan, K., & Hubbart, J. A. (2023). Plant Community, Soil and Microclimate Attributes after 70 Years of Natural Recovery of an Abandoned Limestone Quarry. Land, 12(1), 117. https://doi.org/10.3390/land12010117