Article

Flood Risk Assessment and Management in Urban Communities: The Case of Communities in Wuhan

1
School of Safety Science and Emergency Management, Wuhan University of Technology, Wuhan 430070, China
2
University of Waikato Joint Institute, Zhejiang University City College, Hangzhou 310015, China
3
Waikato Management School, University of Waikato, Hamilton 3240, New Zealand
*
Author to whom correspondence should be addressed.
Land 2023, 12(1), 112; https://doi.org/10.3390/land12010112
Submission received: 27 November 2022 / Revised: 26 December 2022 / Accepted: 27 December 2022 / Published: 29 December 2022

Abstract

:
The likelihood and uncertainty of severe rains and flooding in the middle basin of the Yangtze River have grown due to global warming and growing urbanization. A flood risk assessment index system is built based on resilience theory to assess community flood risk in a significantly changing environment, with communities serving as the primary body to manage flood risk in cities. The flood risk level of communities in Wuhan from 2011 to 2020 was assessed using the Analytic Hierarchical Process (AHP) and Dempster–Shafer (DS) evidence theory, utilizing an example of the typical Wuhan community. The findings indicate that: (1) The weight of hazard-causing factors is the largest and has the greatest influence on the risk of flooding in the community. (2) When looking at time series, the risk of hazard-causing factors gradually rises, while the risks associated with systemic governance, protective works, and community vulnerability steadily decline. Building resilient communities and enhancing flood risk management capability should be priorities for the government, local communities, and citizens.

1. Introduction

Extreme precipitation occurrences are prevalent in the Yangtze River’s middle basin against the backdrop of global warming. Extreme rainfall continues to be more widespread and intense than ever before. Large-scale human activity has increased the density of residential buildings as urbanization picks up speed, which has reduced the amount of greenery on the surface. The capacity of the surface to absorb water has been weakened due to the rise in the impervious area of concrete paving. When it rains heavily, the time it takes for rainwater to confluence is shortened, and surface runoff and river runoff both increasing. The damage caused by heavy rain and flooding will also be made worse by extensive land use, underlying structures, and anthropogenic changes to the local terrain.
Wuhan, Hubei Province’s and China’s central metropolis, has a total size of 8494.41 square kilometers. It is located in the Yangtze River’s middle basin. The Han River, the Yangtze River’s major tributary, and the Yangtze River itself flow through the city’s core. Wuhan has a subtropical monsoon climate, which means that during the summer, when precipitation is concentrated and river flow is substantially higher, it is influenced by the southeast monsoon. Since Wuhan is located in the eastern portion of Jianghan Plain, where there is low topography and restricted drainage, floods are a possibility there. As a result, the frequency of heavy rain and floods have become a pressing concern for community risk management in Wuhan. In this study, the community is used as the fundamental unit to evaluate community flood risk in Wuhan. Besides, communities are becoming more vulnerable to various disaster occurrences on account of the large concentration of community inhabitants and changes in how community residents interact with one another.
Climate change has made community risk governance a research hotspot that frequently has a high priority both domestically and internationally. The publication of the Pilot Program for the Construction of Climate Resilient Cities, NDRC Climate [2016] No. 1687, amply demonstrates the government’s high priority for urban development and community adaptation to climate change risks as well as the pressing need for localities to increase their capacity for managing climate risk [1]. The ability for risk governance and community resilience also plays a role in the assessment of flood risk within communities. As a new urban research direction, the ability to face climate change threats is the essence of resilience. As communities are the smallest organizational units of internal urban management, economic capacity, risk awareness, early warning capabilities, systemic governance have a significant relationship with the severity of community disaster. As a result, assessing the flood risk of communities is indispensably relevant to developing resilient communities.
Current methods for determining community flood risk include Analytic Hierarchical Process (AHP), Geographical Information System, and Indicator-Based Methodology. For instance, Bajracharya Sagar Ratna et al. used qualitative and quantitative methods to assess the Ratu River’s neighborhood flood early notice system [2]. Emmanuel Mavhura et al. evaluated the flood risk of riverside villages in the Mbire district using a weighted 5-point Likert scale [3]. Greater emphasis is placed on communities’ capacity for adaptation, organizing, and learning in order to design a more appropriate indicator system because there is a dearth of research on community resilience in the assessment of community flood risk. Additionally, determining the danger of flooding in a community involves a complex system with many quantitative and qualitative parameters. The split of risk and the determination of each component are not based on a single standard, and there is a significant amount of uncertainty. The creation of a reliable mathematical evaluation model is hampered by these problems.
One of the most significant aspects of risk management and disaster risk reduction is the assessment of flood risk in local areas [4]. Priority needs, activities, and strategies for strengthening community resilience to floods can be precisely determined based on the assessment’s findings. The Dempster–Shafer (DS) evidence theory analysis and research is used in the community flood risk assessment since it can handle confusing data and some of the community indicator data may be suspect. AHP may exactly aid decision-makers in measuring the weight of the indicator system so that they can rapidly understand the significance of the indicators in order to accurately identify the priority of community risk governance. The community flood risk assessment is influenced by each indication to variable degrees. The goal of this paper is to establish a community flood risk assessment index system from the perspective of resilience, identify the shortcomings and priorities of community risk governance, and propose targeted strategies to create resilient communities. It does this by adopting the AHP and DS evidence theory to assess community flood risk. By improving both the flood risk analysis technique and the flood risk decision-making theory, it displays considerable theoretical innovation.

2. Methods

2.1. Model Construction

The ability of a material to recover after deformation by external pressures is referred to as resilience. The term resilience is derived from the Latin word “resillo”, and it was originally used in the field of engineering mechanics [5]. Since then, ecology and sociology have introduced and defined the idea of resilience in numerous ways [6,7]. Three phases are used to describe the idea of “resilience” in planning: prevention and preparedness prior to a disaster, resilience and reaction once a disaster strikes, recovery and reconstruction afterwards [8]. Governments are placing more emphasis on community resilience as global warming worsens [9].
Regional environmental risk assessment is primarily based on three factors, according to the Recommended Methodology for Risk Assessment of Environmental Emergencies in Administrative Regions [10]: environmental risk source intensity, environmental risk receptor vulnerability, environmental risk prevention and emergency response capacity. However, there is a dearth of research on community resilience. Therefore, more emphasis is placed on the learning and recovery capacity of communities in order to build a more reasonable community flood risk assessment index system. As the analytical framework for community flood risk assessment, this study uses the four influencing variables of hazard-causing factors, community vulnerability, protection works, and systemic governance, and many influencing factors are put under them.
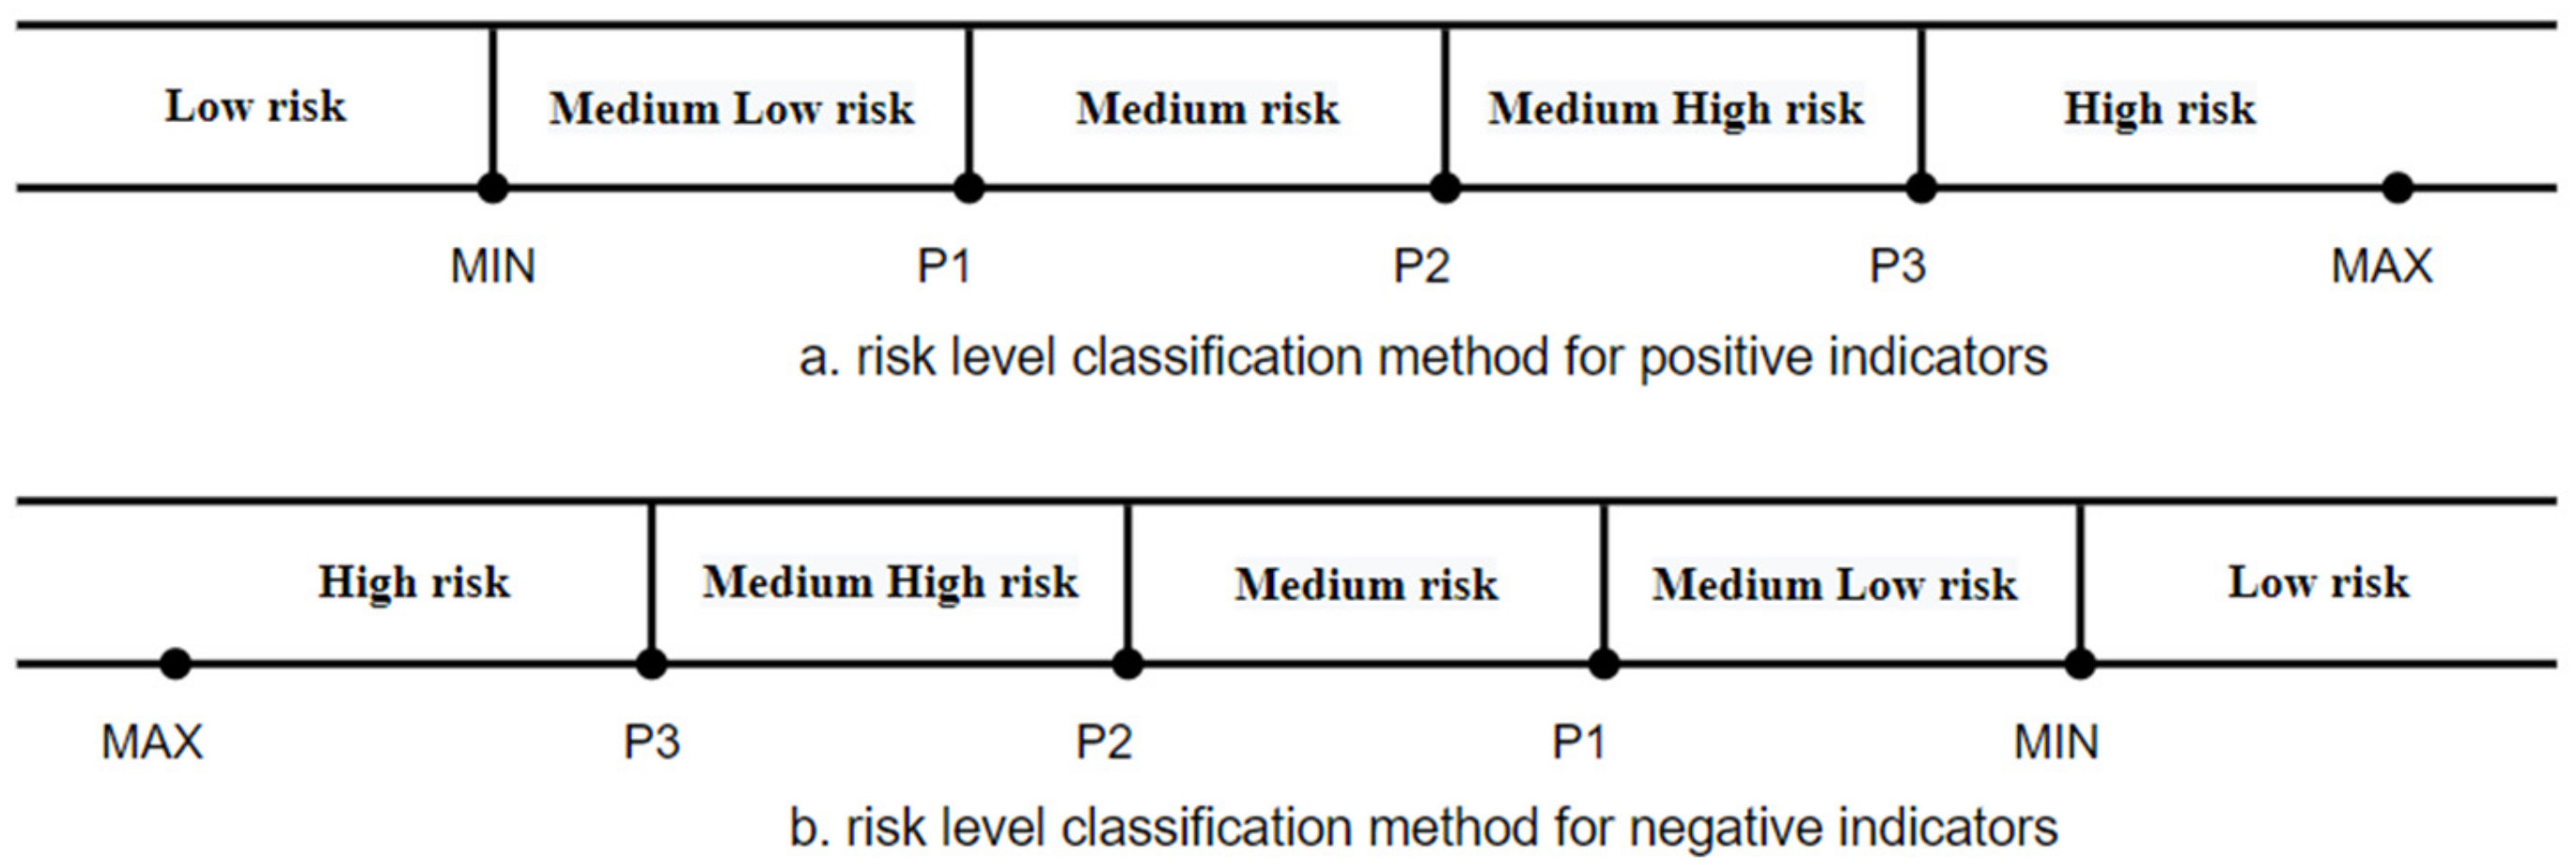
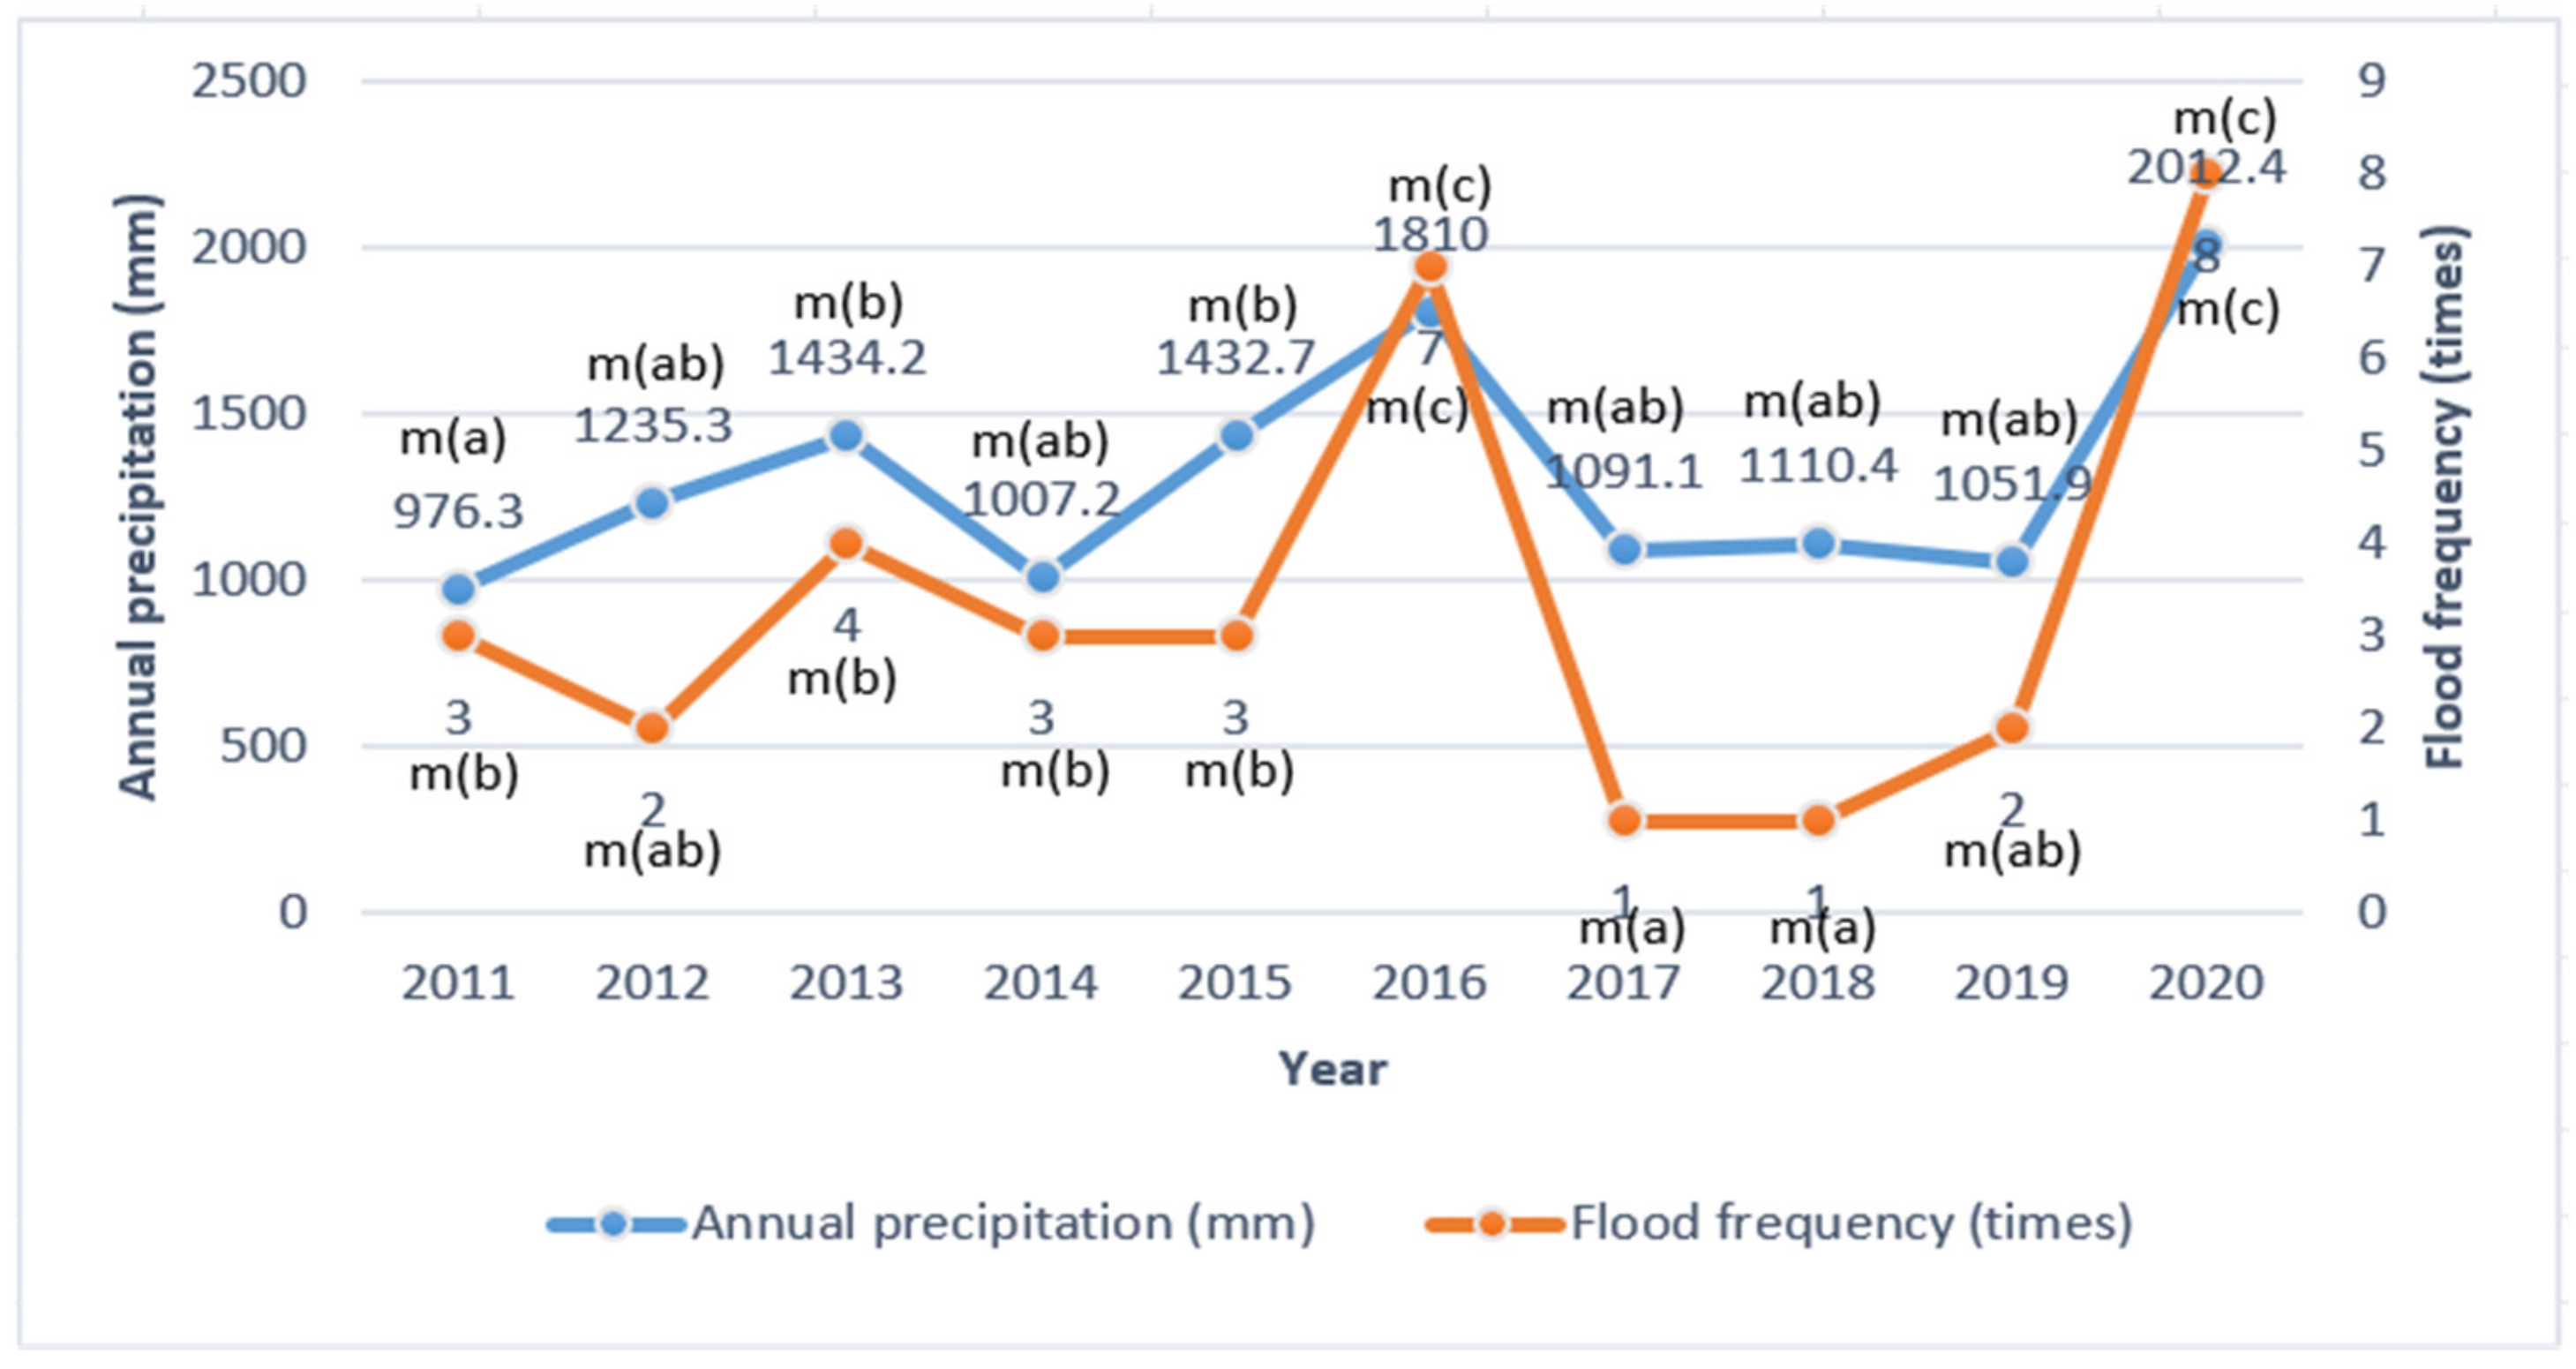
Hazard-causing factor is a naturally occurring factor that affects the community flood risk. The major indicators are the amount of annual precipitation and flood frequency in the region where the community is located [11].
Community vulnerability is the main factor influencing a community’s flood risk. The material security capacity of a community and the social security capacity of its citizens are influenced by its affordability [12]. High economic levels in communities imply stable incomes and ample financial resources for disaster relief work., which is conducive to rapid recovery after disasters. Bringing community effectiveness into full play can unify community residents, stimulate a sense of shared resilience and interactive support, and effectively improve the implementation of community disaster response [13]. It can also encourage communities to resolve conflicting goals and uncertainties in flood prevention plans through widespread participation and consultation. The high proportion of population aged suggests that they are at high risk of disaster. Additionally, they have weak ability to escape, mobile and immune. If they are at risk, more health care resources will be used [14]. The community’s ability to decide whether to stock up on supplies in advance will depend on access to information [15]. High population density will be fewer places of refuge and more persons affected in the case of a disaster [16].
The foundation for influencing how communities evaluate flood risk is protective works. In communities with high plant cover [17], the pooling of surface runoff can be slowed down to some extent, which helps to lessen the likelihood of flooding. The community’s storage space is optimized and increased thanks to the drainage network, which also serves to lessen the risk of flooding [18].
The term “systemic character of governance” describes the entire procedure of proactive prevention, thorough response, and adaptation in the case of flooding [19]. Systemic governance as a whole is consistent with the meaning of “resilience” in planning science. When viewed from the perspective of the entire disaster response cycle, community resilience consists of three stages.
Firstly, the community entails taking proactive steps to get ready for early warning and response to disasters before they happened, mobilizing resources to take effective relief measures to mitigate and avoid events of unexpected disasters. Secondly, comprehensive post-disaster restoration which emphasizes that community facilities can quickly recover and return to normal life. Comprehensive post-disaster rehabilitation places an emphasis on community facilities’ ability to bounce back swiftly and carry out regular daily operations and productive tasks even in trying circumstances. Enhancement of transitional relocation and aid programs for victims following a disaster to protect their livelihoods and offer them psychological support. Thirdly, learning from disaster experiences and improving community risk management are the main focuses of post-disaster learning and adaptation. Finally, grassroots community will reach risk management and emergency management capability spiral rise and build resilient community.
Table 1 displays the community flood risk assessment index system along with the indicators’ sources.

2.2. AHP

Analytic Hierarchical Process (AHP), formally proposed by American operations researcher T.L. saaty [20], is a qualitative and quantitative method that provides a basis for the selection of the optimal solution by breaking down a difficult issue into several levels and components, and by comparing the factors to derive the importance weights of different factors. This method is widely used in the natural sciences because it has the advantages of being clear, simple and systematic. It can organize and quantify the decision-making process. It also can analyze the nature of the problem and the factors involved in the problem more thoroughly.
The basic steps of the Analytic Hierarchical Process are as follows: establish an indicator rating system, decompose each factor concerned into objective, criterion and indicator from top to bottom according to different attributes. Construct a judgment matrix, compare the influencing factors of the same level separately and rate them according to their degree of importance. To calculate the weights and do consistency tests, each judgment matrix is calculated with its maximum characteristic root and corresponding eigenvector, and then consistency tests are done using consistency index (CI), random consistency index (RI) and consistency ratio (CR), and when CR is less than 10%, the above-obtained weight assignments are reasonable.

2.3. DS Evidence Theory

Dempster–Shafer (DS) evidence theory belongs to the category of multiple-criteria decision-making (MCDM)and was first applied to expert systems with the ability to handle indefinite information [21,22]. It provides a forceful tool for the representation and fusion of indefinite information at the decision level. Applicable to information fusion, expert systems, multi-attribute decision analysis and risk assessment [23].
The theory consists mainly of the following basic definitions and rules of combination.
Definition 1.
Frame of discernment: A complete set of mutually incompatible elementary propositions that represents all possible answers to a question, but only one of which is correct.
Definition 2.
Mass function/Basic Probability Assignment (BPA): Let P be the identification frame and a subset of P be called proposition A . The degree of trust assigned to each proposition becomes the BPA. The   m a s s A denotes the degree of trust in A . Then, the function m : 2 p 0 , 1 satisfies the following conditions.
The probability of the improbable event is
m a s s = 0
The sum of the basic probabilities of all the elements in 2 p is
A P m a s s A = 1
If the above conditions are satisfied then m a s s is said to be a basic assignment on 2 p , also known as mass function, indicating a basic trust in A .
Combination rules: Dempster synthesis rules.
For A P , the Dempster synthesis rules for the two mass functions m a s s 1 , m a s s 2 on the recognition frame P are
m a s s A = m a s s 1 m a s s 2 A = 1 1 k A 1 A 2 = A m a s s 1 A 1 m a s s 2 A 2
where K = A 1 A 2 = m a s s 1 A 1 m a s s 2 A 2   K is called the normalization factor and reflects the degree of conflict in the evidence.

2.4. AHP and DS Evidence Theory

The classical DS theory of evidence fails to address the problem of conflicting evidence. When the normalization factor K 1 , the regularization of highly conflicting evidence and the regularization of highly conflicted evidence leads to counterintuitive results, giving rise to the ‘Zadeh’ paradox. The first view is that Dempster’s rule causes the counterintuitive result, in particular its discarded treatment of conflicts. The second view is that the counterintuitive result arises from the source of the evidence rather than from the rules for combining the evidence and that the evidence should be corrected before it is combined. The third view is that the counterintuitive result arises from an incomplete identification framework.
Compared with the approach of amending the body of evidence, altering the combination rule tends to damage the positive traits of Dempster’s rule itself, such as the exchange law and the combination law (Han Deqiang) [24]. Therefore, this paper chooses to modify the body of evidence to cope with the possible highly conflicting evidence combinations and refers to Murphy [25] and Deng Yong [26] to obtain the basic probability assignment function after fusion by using the indicator weights derived from hierarchical analysis to weight the multi-source evidence for multiple fusions using the Dempster combination rule with multiple confidence functions (Equation (4)). Where the number of fusions is the number of indicators n 1 .
m a s s A = m a s s 1 m a s s 2 m a s s n A = 1 1 k A 1 A n = A m a s s 1 A 1 m a s s 2 A 2 m a s s n A n
K = A 1 A n = m a s s 1 A 1 m a s s 2 A 2 m a s s n A n

3. Results and Discussion

3.1. Calculation of Indicator Weights

After collecting 13 expert assessment forms, AHP software was used to calculate the judgment matrices for the objective, criterion and indicator [27]. Experts include Wuhan emergency management experts and deputy director and associate professor of the China Emergency Management Research Center of Wuhan University of Technology, etc. Their research interests include urban public safety, pre-disaster early warning, risk assessment, urban and rural planning and other fields. Since the AHP is highly subjective, the results heavily rely upon on the opinions of experts. Indicator weights for community storm flooding risk assessment are, respectively, shown in Table 2. The following table passes the consistency test (CR ≤ 0.1).

3.2. Data Collection

This paper uses the literature survey method by consulting the Wuhan Statistical Yearbook (2011–2020) to compile the corresponding values of each indicator from 2011 to 2020. The secondary indicators under the risk of hazard-causing factors, community vulnerability, and protection works are all quantitative indicators, and specific values can be obtained. By contrast, the systemic governance indicator is qualitative data, and specific values cannot be obtained. According to expert opinion, it can only be determined that the systematical governance of the community is showing a better state as the years go by. The three indicators under the system governance are qualitative data, which can only be judged as good or bad through artificial judgment, and experts judge the systematic ability of community governance through survey data and empirical judgment. When focusing on a specific community, the system governance of a particular community can be derived through qualitative methods. The DS evidence theory proposed in this paper has the ability to process uncertain information, and can use mass(abc) to correspond to all risk levels, indicating that I do not know how to allocate mass, and finally the risk level results can still be obtained through weighted fusion. Table 3 displays specific information on the indicators.

3.3. Determination of Flood Risk Intervals for Communities in Wuhan

3.3.1. Directional Division of Indicators

The directionality of indicators is a factor in the grading of flood danger levels. Positive and negative indicators play opposing roles in the assessment of flood risk because they affect the level of flood risk in different ways [28]. It is widely acknowledged that the risk of flooding increases with greater values for variables like annual precipitation and the proportion of population aged, which are negative indicators. The risk of flooding decreases when factors like community effectiveness and affordability rise, which are positive indicators. The directionality of the 12 indicators is displayed in Table 4.
For instance, the data supplied for the indicator “Proportion of population aged” is rated as “low risk” if it is lower than a certain threshold, while the indication “ Affordability “ is rated as “high risk” if it is lower than a certain threshold. Table 4 displays the directionality of the 12 indicators.

3.3.2. Data Processing

Processing of the indicator data is mostly done for the directional indicators, and the values of their MAX, MIN, and duration of risk period are found, accordingly [29]. However, the risk limits and intervals cannot be determined because the systemic governance indicators do not have specified values. The processing results for the other indicators are shown in Table 5.
There are 2 risk classification methods according to the indicators’ directionality. Positive indicators have a low risk interval of ( , M I N ], the medium low risk interval is M I N , p 1 ] , the medium risk interval is p 1 , p 2 ] , the medium high risk interval is p 2 , p 3 ] and the high risk interval is p 3 , M A X ] ; Negative indicators have a low risk interval of p 3 , M A X ] , the medium low risk interval is p 2 , p 3 ] , the medium risk interval is p 1 , p 2 ] , the medium high risk interval is M I N , p 1 ] , and the high risk interval is ( , M I N ]. The risk classification method is shown in Figure 1.
Combining the direction of indicators (Table 4) and the processing results (Table 5) can be obtained according to the risk level classification method to divide the risk level interval of each indicator data as shown in Table 6, where the risk level interval of systemic governance cannot be calculated because there is no accurate data.

3.4. BPA Function Generation and Fusion

3.4.1. Creation of the BPA Function

DS evidence theory method called BPA function generation determines the magnitude of probability values for various indicators for each year. The following two procedures are followed by the paper for the generation of the BPA function in conjunction with the five areas of the risk class interval.

3.4.2. Relationship between Focal Elements and Risk Level

The five degrees of community flood risk are low risk, medium low risk, medium risk, medium high risk, and high risk in this study. The focal elements of BPA function must be made up of three elements in order to reflect these five risk categories. Let the three elements be a , b , and c . Then, m a s s a , m a s s a b , m a s s b , m a s s b c , and m a s s c which correspond to the 5 risk levels, are the focal elements of the BPA function, and their correlation is illustrated in Table 7.
The focal element for each indication can be determined using the indicator data in Table 3, the risk class intervals in Table 6, and the correspondence between the risk classes and the focal elements in Table 7. The focal elements for the community flood risk indicators in Wuhan from 2011 to 2020 are shown in Table 8.
Where the focal element (abc) corresponds to all risk levels, indicating that it is not known how to allocate the focal element. Therefore, all three indicators under Governance Systematic correspond to the focal element (abc).

3.4.3. Weighted Synthetic BPA Function

The weighted synthetic BPA function means that the indicators are weighted and averaged according to the weights of each indicator, where the weights of each indicator are given by the indicator weights obtained from AHP (Table 2). The following is an example of the weighted synthetic BPA function using the 2011 data to illustrate both.
m a s s a = 0.34 × 0.45 + 0.26 × 0.18 = 0.1998
m a s s a b = 0.26 × 0.13 = 0.0338
m a s s b = 0.34 × 0.55 = 0.187
m a s s b c = 0
m a s s c = 0.26 × 0.25 + 0.25 + 0.19 + 0.25 = 0.4294
m a s s a b c = 0.15
Similarly, BPA function for the weighted synthesis of data for each indicator for 2011–2020 can be obtained (as shown in Table 9).

3.4.4. Fusion of BPA Functions

The indicator system involves 12 different indicators, each with the different importance of influence on the community’s flood risk, so the weighted generated BPA functions were fused using the AHP and DS evidence theory described previously, using the Dempster combination rule and fused 11 times. Table 10 shows the results of the 11 fusions of the weighted generated BPA functions.

3.4.5. Risk Level Determination

By analyzing the data in Table 10, extracting the main focal element, and combining the correspondence between the risk level and the focal element in Table 7, the risk level determination results for 2011–2020 are shown in Table 11. The focal element with obvious advantages in the BPA function is the main focal element among them. In Table 10, the value used for the five risk levels tending to be “1” is the main focal element.

3.5. Analysis of Weighted Findings

The weights are sorted from greatest to smallest within the criterion indicators in terms of hazard-causing factors, community vulnerability, protective works, and systemic governance. The primary reason are follows: heavy rainfall and frequent flooding are uncontrollable natural factors; community vulnerability represents the fundamental characteristics of a community and is highly volatile; protective works are the physical foundation for flood prevention and drainage in the case of heavy rainfall and flooding; and factors of systemic governance are more subjective and have less of an impact on community risk assessment. Systemic governance also has an important impact on community vulnerability and protective works. Giving full play to the advantages of systemic governance can help reduce community vulnerability, stimulate the effectiveness of protection works, and optimize risk management.
According to an analysis of the secondary indicator weights, affordability and community effectiveness are given more weight; plant cover is more significant and proactive prevention has a greater influence on the assessment of community risk of flash flooding. Therefore, it is crucial to concentrate on preserving people’ capacity for social security, boosting communal flood capital, and enhancing material security. Focus on the effectiveness of the community, neighborly cooperation, prompt assistance during emergencies, and the efficiency of social capital in dealing with emergencies. Adopt new land uses and diverse green space types or plant species through a variety of greening interventions, such as constructing green roofs, unsealing parking lots, enhancing vegetation in community parks, and planting street trees. It also emphasizes the critical role of sustainable drainage systems, such as pavements, rain gardens, and infiltration ditches, to withstand urban flooding [30,31]. The indicator of the proactive prevention given more weight should be referred to from pre-disaster monitoring and early warning, preparation of emergency plans, construction of emergency teams, and safety drills [32,33]. Pre-disaster monitoring and early warning is to identify the risk of flooding and warn the community, so that residents can stay calm when the danger comes. The emergency plan ensures that community managers can quickly implement the tasks specified in the plan after the emergency response is initiated. The community actively publicizes emergency knowledge and organizes self-rescue and escape drills to equip residents with self-rescue capabilities and evacuation skills. In addition, communities should have adequate reserves of emergency supplies to meet the needs of disaster relief and post-disaster recovery. Emergency response teams include emergency personnel and volunteers in the community who can perform tasks such as search and rescue work, care for casualties, evacuate people and distribute supplies after a disaster incident.

3.6. Risk Evaluation Analysis

From the perspective of time series, the flood risk of the community from 2011 to 2020 gradually decreased. However, due to the influence of natural factors, precipitation and flood frequency suddenly increases at times lead to communities are exposed to the medium risk. For example, Wuhan City in 2016 due to the intense rainy period of the plum and the El Nino phenomena, which resulted in extreme torrential rains and floods, exceeding the city’s historically severe flood conditions, giving Wuhan’s community flood risk assessment in 2016 a medium risk category. Wuhan will experience similar precipitation and flood frequency in 2020 as it did in 2016. Fortunately, with the improvement of community risk management capabilities and protection engineering construction standards, the resilience of community disaster prevention has gradually improved, so when the community faces heavy rain and flood again in 2020, it can give full play to the advantages of community disaster prevention to make the community flood risk assessment show low risk.
Annual precipitation and flood frequency show an increasing trend in Figure 2 and the risk level shows an increasing trend. The main reasons are global warming, the alternating El Nino and La Nia phenomena.
As Wuhan City’s development level rises, community vulnerabilities are reduced. For instance, protection works and community governance are getting better and better. However, serious economic losses and a decline in economic capacity due to the sudden outbreak of new crown pneumonia in Wuhan in 2020. Additionally, the proportion of population aged and the risk of population density have shown an increasing trend due to the rapid urbanization process, demographic changes and the decline in the fertility rate of Wuhan. These causes and changes have an impact on the assessment of flood risk in community.

3.7. Analysis of Method

The model combines the AHP and DS evidence theory to determine the flood risk level of communities in Wuhan from 2011 to 2020. Firstly, the indicators affecting the flood risk of the community and their weights are determined (Table 2), and then the data of each indicator is analyzed to delineate the risk level (Table 8). Secondly, the BPA function is weighted based on the indicator data and the corresponding risk level (Table 9). Finally, the generated BPA function is fused (Table 10), and the community flood risk is determined according to the delimited risk level and the fused BPA function (Table 11).
Because of factors such as the man-made or natural environment, the collected data in the information fusion system frequently contains substantial inconsistencies, and the traditional Dempster combination rules are incapable of successfully resolving these inconsistencies. In this paper, an improved method of the Dempster combination rule (2.4 AHP and DS evidence theory), namely the weighted evidence synthesis method, is adopted. This method can effectively deal with interference evidence and has a fast convergence speed, thereby improving the reliability and reasonableness of fusion results in evidence conflicts.
The model can not only determine the weight of each index, identify the priority and measure methods of community risk management, but also determine the risk level of each indicator and the overall flood risk level of the community, which is more conducive to clearly reflecting the change trend of the indicator and the overall flood risk level of the community. It enriches the flood risk analysis method and flood risk decision theory, and shows strong theoretical innovation.
Undoubtedly, the study also has conceptual and methodological limitations. The application of MCDM techniques makes the method highly subjective and largely relies on expert judgment.

4. Conclusions

The rapid increase in precipitation and flood frequency as well as the increased danger of hazard-causing factors in the context of climate change provide a serious test for community flood risk management and community resilience. Building resilient communities in the future will depend heavily on improving community risk management capacities. One of the crucial components of risk management and disaster risk reduction is assessing the flood risk in local areas. An information-fusion-based approach for assessing the flood risk in communities is established by this work. The system’s representation of uncertain information, the synthesis of various parameter data, and the decision-making process in an uncertain environment are some of the core technologies that decision science and information fusion have in common. By improving the flood risk analysis method and flood risk decision-making theory, its application to the development of a community flood risk assessment model exhibits substantial theoretical innovation. From 2011 to 2020, the system applying the AHP and DS evidence theory assesses the flood risk level of communities in Wuhan. The government should focus on constructing sizable greening and drainage network projects in metropolitan areas, according to the main figures in community risk governance. Before, during, and after disasters, communities should be prepared to take preventative measures, respond properly, and adapt. In order to improve government, citizens should be able to learn from catastrophe management. Multi-party community risk management in mid-Yangtze River cities has the potential to improve community risk management capacities and build more resilient communities.

Author Contributions

Conceptualization, W.P.; Data curation, Z.Z.; Formal Analysis, M.Y.; Funding Acquisition, W.P. and M.Y.; Investigation, M.Y.; Methodology, M.Y. and Z.Z.; Project Administration, W.P.; Resources, M.A.G.; Software, M.Y. and Z.Z.; Supervision, W.P. and M.A.G.; Validation, W.P. and M.Y.; Visualization, M.A.G.; Writing—Original Draft, M.Y.; Writing—Review and Editing, W.P. and M.Y. All authors have read and agreed to the published version of the manuscript.

Funding

This work was supported by the National innovation and entrepreneurship training program for college students (312040000212); the Ministry of Education of Humanities and Social Science Project of China (21YJC630104); the National Natural Sciences Foundation of China (72172112).

Data Availability Statement

The data are available on request from the corresponding author.

Conflicts of Interest

The authors declare no conflict of interest.

References

  1. Das, S.; Hazra, S.; Haque, A.; Rahman, M.; Nicholls, R.J.; Ghosh, A.; Ghosh, T.; Salehin, M.; De Campos, R.S. Social vulnerability to environmental hazards in the Ganges-Brahmaputra-Meghna delta, India and Bangladesh. Int. J. Disaster RiskReduct. 2021, 53, 101983. [Google Scholar] [CrossRef]
  2. Bajracharya, S.R.; Khanal, N.R.; Nepal, P.; Rai, S.K.; Ghimire, P.K.; Pradhan, N.S. Community Assessment of Flood Risks and Early Warning System in Ratu Watershed, Koshi Basin, Nepal. Sustainability 2021, 13, 3577. [Google Scholar] [CrossRef]
  3. Mavhura, E.; Manyangadze, T.; Mudavanhu, C.; Pedzisai, E. An assessment of riparian communities’ preparedness to flood risk: The case of Mbire communities in Zimbabwe. GeoJournal 2020, 87, 1671–1693. [Google Scholar] [CrossRef]
  4. Zhen, Y.; Liu, S.; Zhong, G.; Zhou, Z.; Liang, J.; Zheng, W.; Fang, Q. Risk Assessment of Flash Flood to Buildings Using an Indicator-Based Methodology: A Case Study of Mountainous Rural Settlements in Southwest China. Front. Environ. Sci. 2022, 10, 931029. [Google Scholar] [CrossRef]
  5. Boschma, R.; Capone, G. Institutions and diversification: Related versus unrelated diversification in a varieties of capitalism framework. Research Policy 2015, 44, 1902–1914. [Google Scholar] [CrossRef] [Green Version]
  6. Holling, C.S. Resilience and stability of ecological systems. Ann. Rev. Ecol. Syst. 1973, 4, 1–23. [Google Scholar] [CrossRef] [Green Version]
  7. Dakos, V.; Carpenter, S.R.; van Nes, E.H.; Scheffer, M. Resilience indicators: Prospects and limitations for early warnings of regime shifts. Philos. Trans. R. Soc. B Biol. Sci. 2015, 370, 20130263. [Google Scholar] [CrossRef] [Green Version]
  8. Rana, I.A. Disaster and climate change resilience: A bibliometric analysis. Int. J. Disaster Risk Reduct. 2020, 50, 101839. [Google Scholar] [CrossRef]
  9. Plough, A.; Fielding, J.E.; Chandra, A.; Williams, M.; Eisenman, D.; Wells, K.B.; Law, G.Y.; Fogleman, S.; Magaña, A. Building community disaster resilience: Perspectives from a large urban county department of public health. Am. J. Public Health 2013, 103, 1190–1197. [Google Scholar] [CrossRef] [PubMed]
  10. General Office of the Ministry of Environmental Protection. Recommended Methodology for Risk Assessment of Environmental Emergencies in Administrative Regions. Environmental emergency response [2018] Number 9. 11 March 2018. Available online: https://www.changing-transport.org/transfer-project-in-the-philippines/ (accessed on 31 January 2018). (In Chinese).
  11. Sun, R.; Gao, G.; Gong, Z.; Wu, J. A review of risk analysis methods for natural disasters. Natural Hazards 2020, 100, 571–593. [Google Scholar] [CrossRef]
  12. Cutter, S.L.; Ash, K.D.; Emrich, C.T. The geographies of community disaster resilience. Glob. Environ. Chang. 2014, 29, 65–77. [Google Scholar] [CrossRef]
  13. Liang, Y.; Jiang, C.; Ma, L.; Liu, L.; Chen, W.; Liu, L. Government support, social capital and adaptation to urban flooding by residents in the Pearl River Delta area, China. Habitat Int. 2017, 59, 21–31. [Google Scholar] [CrossRef] [Green Version]
  14. Cutter, S.L.; Barnes, L.; Berry, M.; Burton, C.; Evans, E.; Tate, E.; Webb, J. A place-based model for understanding community resilience to natural disasters. Glob. Environ. Chang. 2008, 18, 598–606. [Google Scholar] [CrossRef]
  15. Islam, A.; Ghosh, S. Community-Based Riverine Flood Risk Assessment and Evaluating Its Drivers: Evidence from Rarh Plains of India. Appl. Spat. Anal. Policy 2021, 15, 1–47. [Google Scholar] [CrossRef]
  16. Zin, W.W.; Kawasaki, A.; Takeuchi, W.; San, Z.M.L.T.; Htun, K.Z.; Aye, T.H.; Win, S. Flood Hazard Assessment of Bago River Basin, Myanmar. J. Disaster Res. 2018, 13, 14–21. [Google Scholar] [CrossRef]
  17. Lai, C.; Shao, Q.; Chen, X.; Wang, Z.; Zhou, X.; Yang, B.; Zhang, L. Flood risk zoning using a rule mining based on ant colony algorithm. J. Hydrol. 2016, 542, 268–280. [Google Scholar] [CrossRef]
  18. Shi, P.; Ge, Y.; Yuan, Y.; Guo, W. Integrated Risk Management of Flood Disasters in Metropolitan Areas of China. Int. J. Water Resour. Dev. 2005, 21, 613–627. [Google Scholar] [CrossRef]
  19. Rivera Flórez, L.A.; Rodríguez Gaviria, E.M.; Velásquez Castañeda, C.A.; Guzmán Tenjo, H.P.; Ramírez Madrigal, A. Community risk management. Spatial and environmental justice. Bitacora Urbano Territ. 2020, 30, 205–217. [Google Scholar] [CrossRef]
  20. Saaty, T.L. Some mathematical concepts of the analytic hierarchy process. Behaviormetrika 1991, 18, 1–9. [Google Scholar] [CrossRef]
  21. Zheng, J.C.; Wang, Y.; Lin, C.C.; Zhang, X.L.; Liu, J.; Ji, L.W. A fusion algorithm of target dynamic information for asynchronous multi-sensors. Microsyst. Technol. 2018, 24, 3995–4005. [Google Scholar] [CrossRef]
  22. Muralidharan, C.; Anitha, R. EDSAC–An Efficient Dempster Shafer Algorithm for Classification to Estimate the Service, Security and Privacy Risks with the Service Providers. Wirel. Pers. Commun. 2021, 122, 3649–3669. [Google Scholar] [CrossRef]
  23. Nachappa, T.G.; Piralilou, S.T.; Gholamnia, K.; Ghorbanzadeh, O.; Rahmati, O.; Blaschke, T. Flood susceptibility mapping with machine learning, multi-criteria decision analysis and ensemble using Dempster Shafer Theory. J. Hydrol. 2020, 590, 125275. [Google Scholar] [CrossRef]
  24. FAN, X.; HAN, D.; YANG, Y.; Dezert, J. De-combination of belief function based on optimization. Chin. J. Aeronaut. 2022, 35, 179–193. [Google Scholar] [CrossRef]
  25. Murphy, C.K. Combining belief functions when evidence conflicts. Decis. Support Syst. 2000, 29, 1–9. [Google Scholar] [CrossRef]
  26. Deng, Y.; Su, X.Y.; Jiang, W. A Fuzzy Dempster Shafer Method and its Application in Plant Location Selection. Adv. Mater. Res. 2010, 910, 831–835. [Google Scholar] [CrossRef]
  27. Alexander, C. Micropolitan areas and urbanization processes in the US. Cities 2012, 29, 24–28. [Google Scholar] [CrossRef]
  28. Nachiappan, S.; Ramakrishnan, R. A review of applications of Analytic Hierarchy Process in operations management. Int. J. Prod. 2012, 138, 215–241. [Google Scholar] [CrossRef]
  29. Omasa, T.; Kishimoto, M.; Kawase, M. An attempt at decision making in tissue engineering: Reactor evaluation using the analytic hierarchy process (AHP). Biochem. Eng. J. 2004, 20, 173–179. [Google Scholar] [CrossRef]
  30. D’Ambrosio, R.; Longobardi, A.; Balbo, A.; Rizzo, A. Hybrid Approach for Excess Stormwater Management: Combining Decentralized and Centralized Strategies for the Enhancement of Urban Flooding Resilience. Water 2021, 13, 3635. [Google Scholar] [CrossRef]
  31. Zwierzchowska, I.; Cortinovis, C.; Collier, M.; Mizgajski, A. Urban transitions towards Nature-based Solutions. Urban For. Urban Green. 2022, 74, 127663. [Google Scholar] [CrossRef]
  32. Pratama, A.Y.; Sariffuddin, S. Community-Based Disaster Management: A Lesson Learned from Community Emergency Response Management in Banyumas, Indonesia. IOP Conf. Ser. Earth Environ. Sci. 2018, 123, 012003. [Google Scholar] [CrossRef]
  33. Tambo, E.; Fouad, A.M.; Khater, E.I. Strengthening community emergency preparedness and response in threats and epidemics disasters prevention and management in Saudi Arabia. Int. J. Emerg. Manag. 2017, 13, 288–303. [Google Scholar] [CrossRef]
Figure 1. Risk level classification method for positive indicators and negative indicators.
Land 12 00112 g001
Figure 2. Annual precipitation and Flood frequency from 2011 to 2020 in Wuhan. Note: The m-value is the risk level corresponding to the indicator for that year.
Land 12 00112 g002
Table 1. Community flood risk assessment index system in Wuhan.
ObjectiveCriterionIndicatorMetricsSource of Indicators
Community Flood Risk AssessmentHazard-causing factors (A)Annual precipitation (a1)Annual precipitation in Wuhan (mm)[11]
Flood frequency (a2)Number of times in a year with rainfall ≥ 50 mm in 24 h[11]
Community vulnerability (B)Proportion of population aged (b1)Proportion of population aged 60 and over to total population (%)[14]
Community effectiveness (b2)Number of residents’ self-governing organizations, community committees (number)[13]
Affordability (b3)Disposable income per inhabitant (yuan)[12]
Accessibility of information (b4)Number of Internet users (million)[15]
Population density (b5)Population size/area (persons/km2)[16]
Protective Works (C)Plant cover (c1)Greenery rate (%)[17]
Drainage network (c2)Length of drainage pipes (km)[18]
Systemic governance (D)Proactive prevention (d1)Monitoring and early warning, stockpiling supplies[19]
Universal response (d2)Emergency relief and rapid response[19]
Learning to adapt (d3)Comprehensive post-disaster restoration, potential hazard identification, lessons learned and optimal management[19]
Table 2. Indicator weights for community storm flooding risk assessment in Wuhan.
ObjectiveCriterionIndicator
Community Flood Risk AssessmentHazard-causing factors (0.34)Annual precipitation (0.45)
Flood frequency (0.55)
Community vulnerability (0.26)Proportion of population aged (0.13)
Community effectiveness (0.25)
Affordability (0.25)
Accessibility of information (0.19)
Population density (0.18)
Protection works (0.25)Plant cover (0.68)
Drainage network (0.32)
Systemic governance (0.15)Proactive prevention (0.4)
Universal response (0.3)
Learning to adapt (0.3)
Table 3. Community flood risk assessment indicator data for Wuhan 2011–2020.
Yeara1a2b1b2b3b4b5c1c2
2011976.3315.9309323,738249118037.57909
20121235.3216.7319927,061330119138.98173.15
20131434.2417.7311129,821388120338.99010
20141007.2318.8315229,627390.31206399102
20151432.7319.7311332,478463.5123839.059202
20161810720.6314335,383488.8125639.659316
20171091.1120.9314138,642430127139.659350
20181110.4121.2318242,133495.7129339.88240.46
20191051.9221.4321346,01053213084010,849
20202012.4821.2323644,760553.314534211,422
Note: Data sources are Wuhan Statistical Yearbook (2011–2020): a1 annual precipitation in Wuhan, mm; a2 number of rainfall ≥50 mm in 24 h in a year, times; b1 proportion of population aged 60 and above to total population, %; b2 number of residents’ self-governing organizations and neighborhood committees, units; b3 per capita disposable income of residents, RMB; b4 number of internet users, 10,000; b5 number of people/area, persons/km2; c1 Greening rate, %; c2 Length of drainage pipes, km.
Table 4. Direction of indicators.
IndicatorsDirectionalityIndicatorsDirectionality
Annual precipitationnegativePopulation densitynegative
Flood frequencynegativePlant coverpositive
Proportion of the elderly populationnegativeDrainage networkpositive
Community EffectivenesspositiveProactive preventionpositive
AffordabilitypositiveUniversal restorationpositive
Information accessibilitypositiveLearning to adaptpositive
Table 5. Indicator data processing results.
A1a2b1b2b3b4b5c1c2
MAX2012.480.214323646,010553.314530.4211,422
MIN976.310.159309323,73824911800.3757909
Deviation Δ 1036.170.05514322,272304.32730.0453513
Risk interval p259.0251.750.0137535.75556876.07568.250.01125878.25
Risk threshold p11235.3252.750.172753128.7529,306325.0751248.250.386258787.25
Risk threshold p21494.354.50.18653164.534,874401.151316.50.39759665.5
Risk threshold p31753.3756.250.200253200.2540,442477.2251384.750.4087510,543.75
Note: Deviation Δ = MAX − MIN, p = Δ / 4 , p1 = MIN + p, p2 = MIN + 2p, p3 = MIN + 3p.
Table 6. Classification of risk level intervals.
Low RiskMedium Low RiskMedium RisksMedium High RiskHigh Risk
a1≤976.3(976.3, 1235.325](1235.325, 1494.35](1494.35, 1753.375]≥1753.375
a2≤1(1, 2.75](2.75, 4.5](4.5, 6.25]≥6.25
b1≤0.159(0.150, 0.17275](0.17275, 0.1865](0.1865, 0.20025]≥0.20025
b2>3200.5(3164.5, 3200.25](3128.75, 3164.5](3093, 3128.75]≤3093
b3>40,442(34,874, 40,442](29,306, 34,874](23,738, 29,306]≤23,738
b4>477.225(401.15, 477.225](325.075, 401.15](249, 325.075]≤249
b5≤1180(1180, 1248.25](1248.25, 1316.5](1316.5, 1384.75]>1384.75
c1>0.40875(0.3975, 0.40875](0.38625, 0.3975](0.375, 0.38625]≤0.375
c2>10,543.75(9665.5, 10,543.75](8787.25, 9665.5](7909, 8787.25]≤7909
Table 7. Classification of community flood risk assessment levels.
Risk LevelLow RiskMedium Low RiskMedium RisksMedium High RiskHigh Risk
Focal elementsmass(a)mass(ab)mass(b)mass(bc)mass(c)
Table 8. Indicators corresponding to focal elements.
Yeara1a2b1b2b3b4b5c1c2d1d2d3
2011(a)(b)(ab)(c)(c)(c)(a)(c)(c)(abc)(abc)(abc)
2012(ab)(ab)(ab)(ab)(bc)(b)(ab)(c)(bc)(abc)(abc)(abc)
2013(b)(b)(b)(bc)(b)(b)(ab)(b)(b)(abc)(abc)(abc)
2014(ab)(b)(bc)(b)(b)(b)(ab)(b)(b)(abc)(abc)(abc)
2015(b)(b)(bc)(bc)(b)(ab)(ab)(b)(b)(abc)(abc)(abc)
2016(c)(c)(c)(ab)(ab)(a)(b)(b)(b)(abc)(abc)(abc)
2017(ab)(a)(c)(b)(ab)(ab)(b)(b)(b)(abc)(abc)(abc)
2018(ab)(a)(c)(ab)(a)(a)(b)(ab)(bc)(abc)(abc)(abc)
2019(ab)(ab)(c)(a)(a)(a)(b)(ab)(a)(abc)(abc)(abc)
2020(c)(c)(c)(a)(a)(a)(c)(a)(a)(abc)(abc)(abc)
Note: The focal elements (abc) corresponds to all police limit levels.
Table 9. Weighted synthetic BPA function for community flood risk indicator data from 2011 to 2020 in Wuhan.
YearMass(a)Mass(ab)Mass(b)Mass(bc)Mass(c)Mass(abc)
20110.19980.03380.18700.42940.15
201200.48560.04940.1450.170.15
201300.04680.73820.06500.15
201400.19980.61640.033800.15
201500.09620.6550.098800.15
20160.04940.130.296800.37380.15
20170.1870.26740.361800.03380.15
20180.30140.3880.04680.080.03380.15
20190.25940.510.046800.03380.15
20200.42940000.42060.15
Table 10. Results obtained after 11 fusions of BPA function for weighted synthesis.
YearMass(a)Mass(ab)Mass(b)Mass(bc)Mass(c)Mass(abc)
20110.007000.004700.98830
201200.04060.958400.0010
2013001000
2014001000
2015001000
20160.00080.00010.7600.23910
20170.04480.00050.9547000
20180.94230.00460.0531000
20190.95840.01830.0233000
20200.54570000.45410
Table 11. Flood risk rating for Wuhan communities 2011–2020.
YearMain Focus ElementRisk Level
2011mass(c)High risk
2012mass(b)Medium risk
2013mass(b)Medium risk
2014mass(b)Medium risk
2015mass(b)Medium risk
2016mass(b)Medium risk
2017mass(b)Medium risk
2018mass(a)Low risk
2019mass(a)Low risk
2020mass(a)Low risk
Disclaimer/Publisher’s Note: The statements, opinions and data contained in all publications are solely those of the individual author(s) and contributor(s) and not of MDPI and/or the editor(s). MDPI and/or the editor(s) disclaim responsibility for any injury to people or property resulting from any ideas, methods, instructions or products referred to in the content.

