Article

Ecological Protection Alone Is Not Enough to Conserve Ecosystem Carbon Storage: Evidence from Guangdong, China

1
Key Laboratory of Urban Land Resources Monitoring and Simulation, Ministry of Natural Resources, Shenzhen 518034, China
2
Department of Land Management, Zhejiang University, Hangzhou 310058, China
3
School of Life and Environmental Sciences, Schmid College of Science and Technology, Chapman University, One University Drive, Orange, CA 92866, USA
*
Authors to whom correspondence should be addressed.
Land 2023, 12(1), 111; https://doi.org/10.3390/land12010111
Submission received: 15 November 2022 / Revised: 17 December 2022 / Accepted: 28 December 2022 / Published: 29 December 2022
(This article belongs to the Special Issue Urban Land Development in the Process of Urbanization)

Abstract

:
The increase in atmospheric CO2 caused by land use and land cover change (LUCC) is one of the drivers of the global climate. As one of the most typical high-urbanization areas, the ecological conflicts occurring in Guangdong Province warrant urgent attention. A growing body of evidence suggests LUCC could guide the future ecosystem carbon storage, but most LUCC simulations are simply based on model results without full consistency with the actual situation. Fully combined with the territorial spatial planning project and based on the land use pattern in 2010 and 2020, we have used the Markov and Patch-generating Land Use Simulation (PLUS) model to simulate the future four land use scenarios: the Business as Usual (BU), Ecological Protection (EP), Farmland Protection (FP), and Economic Development (ED) scenario, and the ecosystem carbon storage was assessed by the Integrated Valuation of Ecosystem Services and Tradeoffs (InVEST) model. The results show that the built-up area experience further expansion in all scenarios, the largest scale happened in ED and the smallest in FP. Besides, the forest area in the EP scenario is the largest, while the land use pattern developed based on the previous circumstances in the BU scenario. Furthermore, the carbon storage plunged from 1619.21 Tg C in 2010 to 1606.60 Tg C in 2020, with a total decrease of 12.61 Tg C. Urban expansion caused 79.83% of total carbon losses, of which 31.56% came from farmland. In 2030, the carbon storage dropped in all scenarios, and their storage amount has a relationship of FP > BU > EP > ED. To better resolve the ecological problems and conserve ecosystem carbon storage, not only ecological protection but also the protection of the land near the city such as farmland protection strategies must be considered.

1. Introduction

During the Industrial Revolution from 1850 to 2019, the total increase in global surface temperature caused by human beings range from 0.8–1.3 °C [1], which posed a series of widespread threats to humans [2]. The main global warming was caused due to the sudden rise of atmospheric CO2 concentration [3], which is attributed to the burning of fossil fuels and land use and land cover change (LUCC) caused by deforestation, urbanization, and other anthropogenic activities [4]. LUCC, as one of the most important factors in the augmentation of atmospheric CO2, exerts a profound impact on regional and global climate [5]. On the one hand, from the aspect of the process of LUCC, the carbon in ecosystems has been released by factors such as forest steppe fires and soil erosion. The cumulative carbon emissions caused by those LUCC processes were unexpected in the past few centuries [6,7]. On the other hand, the impact after LUCC alters the biophysical properties of the land surface. For example, when forests are replaced by grasslands and croplands, it leads to a decrease in evaporation and surface roughness as well as an increase in albedo [8,9,10,11]. These biophysical changes have caused severe perturbations to carbon in ecosystems and seriously compromised the capacity of the ecosystem to store carbon [12]. Although the carbon emission caused by LUCC is uncertain [13,14], it has been agreed that the concentration of CO2 in the atmosphere has increased by about 25% in history [15]. Ecosystem’s carbon storage service is a cost-effective nature-based solution for reducing atmospheric CO2 concentrations [16,17,18,19]. Therefore, to meet global carbon challenges it is vital to take full advantage of the ecosystem services, especially in a LUCC way.
Earlier studies of ecosystem carbon storage have shown the importance of LUCC. The carbon storage characteristics differ from the land use type and the conversion between different land use types could cause severe storage change, which has been proved in many places such as Asia, Oceanic, Europe, and America [20,21,22,23]. With the development of the geographic information system (GIS), the large-scale geographic analysis technology is gradually improved, making it more closely integrated with the spatial analysis model, in which the carbon storage and sequestration module in the Integrated Valuation of Ecosystem Services and Tradeoffs (InVEST) model is the most popular evaluation model. Especially in Asia, each ecosystem’s carbon storage change might be derived from LUCC, no matter an increase or decrease. For example, in the eastern coastal areas of Bangladesh from 1988 to 2018, the total carbon stocks rose with the increase in the trees and vegetation around rural settlements [24]. Xishuangbanna area in China witnessed a sharp decline during the 22-year period from 1988 to 2010, which was dominated by the decrease in natural coverage [25]. Moreover, as for China, the national carbon balance (carbon emission and storage) has been investigated, and the results showed that land use changes led to a large amount of carbon loss, mainly because the ecological land was occupied by construction areas [26,27]. With the development of information technology, more accurate land use simulation methods emerge in endlessly. The system dynamics (SD) model and Markov model are applied to future land use demand forecasting, and deep learning based on Cellular Automata (CA) is used in the spatial change strategy analysis, such as the Conversion of Land Use and its Effects (CLUE-S), Future Land Use Simulation Model Software (FLUS), Patch-generating Land Use Simulation (PLUS) model, etc. Combining future LUCC with ecosystem carbon storage is becoming a common trend in this field. Several scholars have undertaken the simulation experiment in plenty of areas, from the southern, central, and northern parts of China, where the model’s applicability and accuracy were verified [28,29,30,31]. However, from previous studies, when predicting future ecosystem carbon storage, the land demand often relies simply on model results, with less or little consideration of integration with relevant planning projections, so the simulation results tend to deviate from the actual situation. Therefore, this study will improve the shortcomings of previous research and set the simulation scenarios in a way that not only fully grasps the development direction but also strictly follows the land use quantity according to relevant planning projections.
Guangdong Province is located at the southern end of the Chinese mainland, with a tropical and subtropical climate. As a strong economic province in China, ecological and environmental problems caused by land use changes such as urban sprawl and farmland expansion recently have become common, resulting in a large number of ecosystem carbon loss. Although the department concerned managed to resolve those ecological issues, the environmental problem continued to have a profound effect on their production and life. Therefore, it is urgent to give full support to the advantages of ecosystem services, to tackle the conflict between LUCC and carbon storage.
In order to learn about the future ecosystem carbon storage spatial pattern in Guangdong, we conducted our research via the following steps. Firstly, after fully considering the territorial spatial planning project, the Markov model was used to predict the future land use demand in 2030 under four scenarios. Then, the PLUS model was utilized to simulate the spatial land use patterns. Finally, the ecosystem carbon storage was assessed by InVEST model in separate scenarios.

2. Materials and Methods
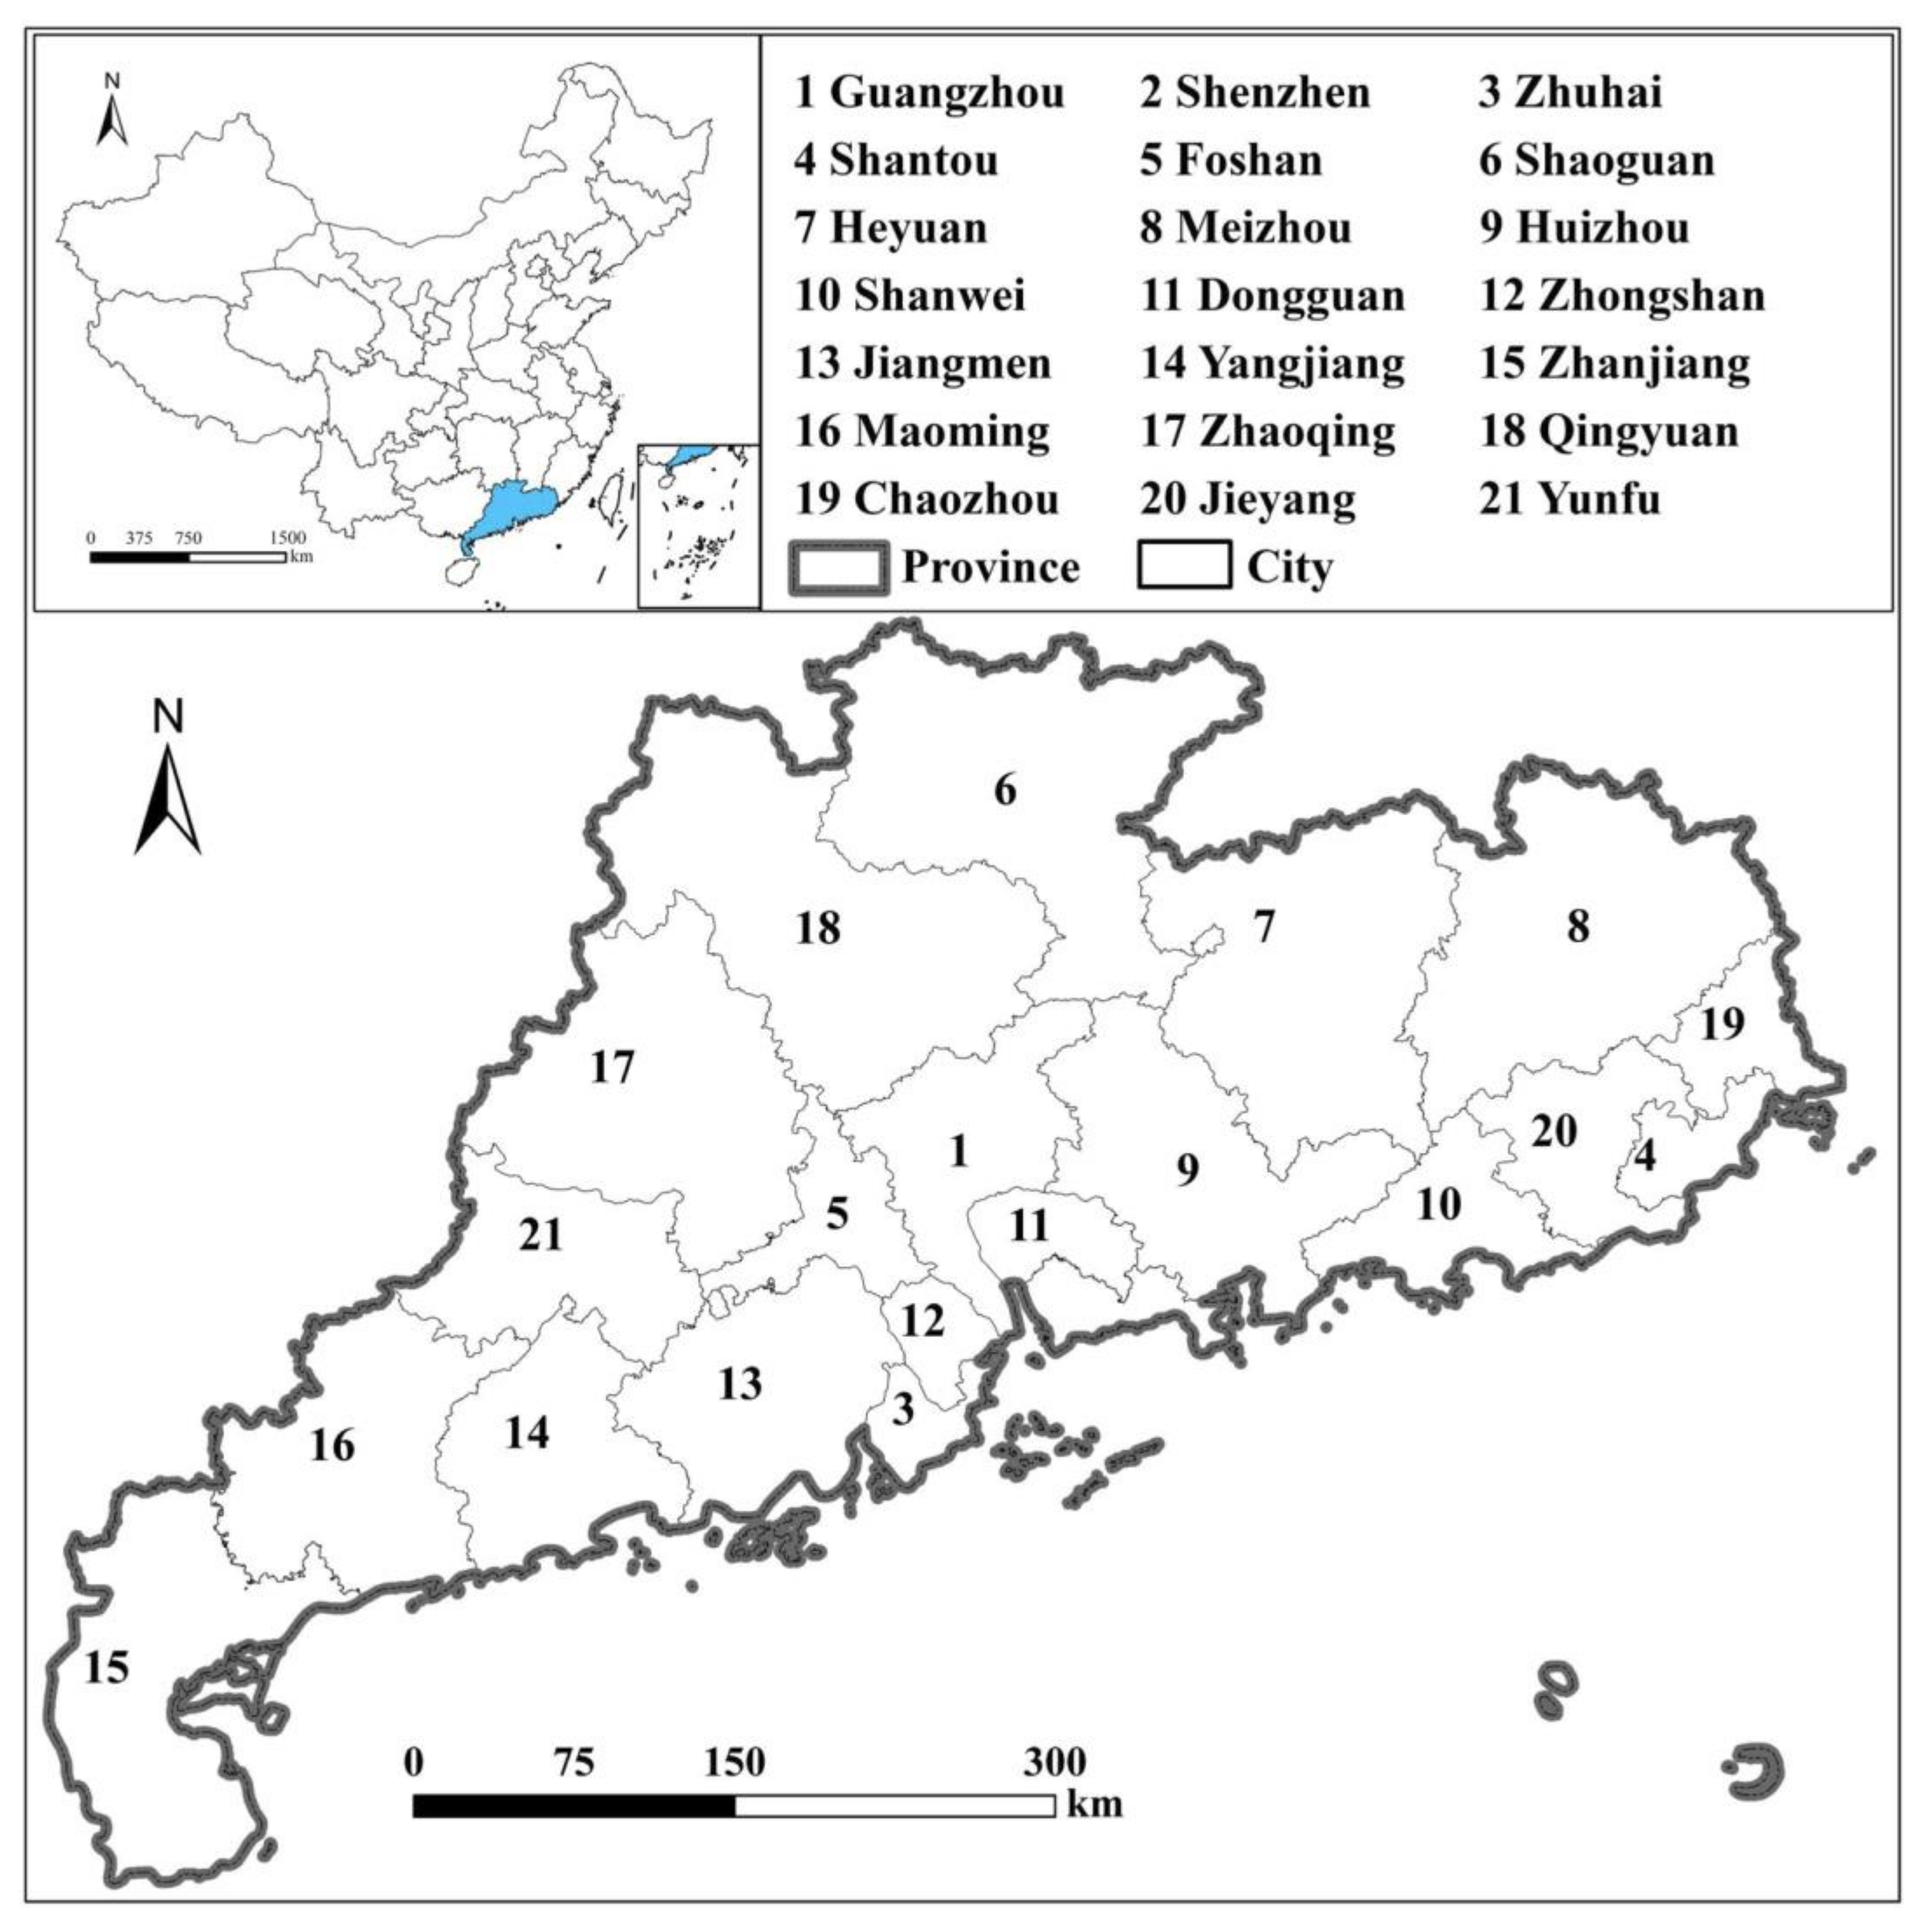
2.1. Study Area

Guangdong Province is located in the southernmost part of mainland China, adjacent to the South China Sea, and across the sea from Hainan Province. There are 21 cities with a total area of 179,725.07 km2. The whole territory lies between 20°09′ N–25°31′ N and 109°45′ E–117°20′ E. The overall topography here is high in the north and low in the south, with complex and diverse landform types (Figure 1). There are mostly mountains and high hills in the north, plains and platforms in the south, and with dense distribution of rivers and lakes. Guangdong has a subtropical monsoon climate, with an annual average precipitation of more than 1500 mm and an average temperature of around 22 °C [32].
In addition, Guangdong is the most economically developed province in China, with a GDP of 12.44 trillion RMB in 2021. The population also ranks first in China, with a total population of 126.24 million in the seventh national census in 2020. Energy consumption also lies at the forefront of China, with electricity consumption reaching 692.6 billion kW·h in 2019, accounting for about 1/10 of the total.

2.2. Data Sources

The spatial data was used to simulate the spatial pattern of land use and ecosystem carbon storage. The LUCC data with a resolution of 100 m, and both GDP (https://doi.org/10.12078/2017121102, accessed on 9 August 2022) and soil type spatial distribution raster data with a resolution of 1 km were obtained from the Resource and Environment Science and Data Center (https://www.resdc.cn/, accessed on 9 August 2022). SRTM-DEM 90 m resolution original elevation data were from the Geospatial Data Cloud site, Computer Network Information Center, Chinese Academy of Sciences (http://www.gscloud.cn, accessed on 9 August 2022), while the slope data were obtained by using DEM data through the spatial analysis tool in ArcGIS 10.8 software. The precipitation and temperature data with a 1 km spatial resolution were accessed from the National Earth System Science Data Center, National Science and Technology Infrastructure of China (http://www.geodata.cn, accessed on 22 April 2022). Besides, 100 m resolution gridded population count data were downloaded from WorldPop (https://www.worldpop.org/, accessed on 8 December 2021). Furthermore, some basic shapefile geographic information data were from the National Geomatics Center of China (http://www.ngcc.cn/ngcc/, accessed on 7 August 2022), such as the administrative center at the county level, the spatial location of highways railways, and rivers. Via the Euclidean Distance tool in ArcGIS 10.8, the distance to those closest sources was calculated in each cell. Finally, the coordinate system of all data is unified, and the spatial resolution is resampled to 100 m.
In order to verify the accuracy of the model, the statistical data of the population in Guangdong Province were used, which were obtained from the Guangdong Bureau of Statistics (http://stats.gd.gov.cn/, accessed on 29 October 2022).

2.3. LUCC Simulation under Multiple Scenarios

In this study, the Markov-PLUS coupling model is used to dynamically simulate the land use/cover types in Guangdong Province, so that we can not only use the Markov model to predict the land use demand in different situations, but also give full play to the ability of the PLUS model to deal with the spatial changes of complex systems with CA, and then simulate the spatiotemporal dynamic characteristics of land use in both quantitative and spatial aspects.

2.3.1. Markov Model

Markov processes are the simplest type of stochastic processes, where it is assumed that the present states (rather than past states) affect the transition to future states (i.e., the so-called Markov characteristics), so the development of the future state can be predicted by capturing the impact of the current state [33,34,35]. Given that the dynamic evolution of LUCC possesses Markov properties, we used this method to simulate the land use demand in Guangdong Province. The principle is shown in Formula (1):
S n = S n 1 × P i j ,
where S(n) means the land use type at moment n, S(n−1) means the land use type at moment n−1; Pij represents the land use type transition probability matrix, as is shown in Formula (2):
P i j = P 11 P 1 n P n 1 P n n ,   0 P i j 1 ,   j = 1 n P i j = 1 ,
where Pij means the transition probability from land use type i to j, and n represents the amount of land use type.

2.3.2. PLUS Model

PLUS model, namely Patch-generating Land Use Simulation model, is a kind of geographic Cellular Automata (CA) modeling to show complex land use/cover systems, so as to achieve the purpose of assisting land policy formulation [36]. However, among the existing CA models, on the one hand, they focused on the improvement of modeling procedures, and few studies on promoting the understanding of the underlying nonlinear relationship of LUCC [37,38]. On the other hand, the research on the causes of land use change is limited [39,40], that is to say, there are certain deficiencies in both the transformation rule mining strategy and the landscape dynamic change simulation strategy. Therefore, a rule mining framework based on Land Expansion Analysis Strategy (LEAS) and a CA model based on multiple random seed (CARS) is proposed, which can mine the driving factors of land expansion and landscape change, resulting in higher simulation accuracy and compatibility with more similar landscapes [41].
In the PLUS model, we first need to use the land expansion analysis strategy (LEAS) to extract the part of all kinds of land use expansion in the two periods, so we can obtain the samples from the increased part. Then, the random forest algorithm was used to explore all kinds of land use expansion and driving forces one by one. This process makes us obtain the development probability of all land use types and also learn the contribution of driving factors to land use expansion in this period. This strategy can well analyze the mechanism of land use change over a period of time and has strong explanatory power. Secondly, based on CARS, this module simulates local microscopic by combining random seed generation and decreasing threshold mechanism for neighborhood scope, neighborhood weight factor, random patch seed probability, and conversion cost settings, and the combined effect of adaptability coefficient, neighborhood effect, and development probability land use competition. Finally, the land use is allocated to each grid by using the CA mechanism, so that the initial land use types are transformed into those with high development probability, which makes the model more reasonable and the simulation accuracy higher [41].
There are 11 historical spatial raster data input in the PLUS model as the LUCC driving factors in our study (Table 1). They are five socio-economic factors (gross domestic product, population, and the distance to the administrative center, highway, and railway,) and six climate-environmental factors (elevation, slope, precipitation, temperature, soil type, and the distance to river). Combined with the earlier research and the availability of data, these factors basically meet the model simulation demand to reflect the impact of LUCC and conform to the actual situation in Guangdong Province [42,43,44].

2.3.3. Scenario Setting

LUCC is a complex process, and the spatial development of Guangdong Province is guided by various policies. In China, territorial spatial planning is a series guide for regional space development and the basis for development, protection, and construction activities, so bringing planning indicators into land use scenario simulation has important practical significance and can better guide practice. Therefore, according to the policy projects such as Guangdong Territorial Planning (2016–2035) and Guangdong Territorial Spatial Planning (2020–2035), four scenarios of business as usual (BU), ecological protection (EP), farmland protection (FP), and economic development (ED) were set up to explore LUCC in different periods and scenarios.
Business as usual (BU) scenario: only based on the expansion law and change characteristics of historical land use in Guangdong Province from 2010 to 2020, regardless of the impact of policy regulation and control. With the Markov model, the scale of land demand in 2030 is predicted.
Ecological protection (EP) scenario: this will be one of the key strategies for future development in Guangdong Province. The importance of forest ecosystems is highlighted while other natural ecosystems are also preserved. The forest land holdings in the Guangdong Territorial Planning (2016–2035) were included in the scenario setting. It is stipulated to reduce the probability of conversion of other land use types to built-up land by 50% for forest land and grassland, and by 30% for watershed and farmland [45].
Farmland protection (FP) scenario: strict implementation of farmland protection is also one of the important tasks in Guangdong Province. In this scenario, the development of farmland will be restricted, that is, farmland will not be transformed into any other land use type. In addition, the probability of conversion of unused to farmland will increase by 50% [46].
Economic development (ED) scenario: based on the rapid economic development and urbanization of Guangdong Province, further priority is given to economic benefits. However, according to China’s actual policy, urban development requires a clear urban development boundary, so the upper threshold of land use development intensity specified in the Guangdong Territorial Planning (2016–2035) is considered when setting this scenario.

2.4. Ecosystem Carbon Storage

The Carbon Storage and Sequestration module from the InVEST model was applied to estimate the carbon storage in the ecosystem of Guangdong Province. The InVEST model uses LUCC maps and carbon storage from four carbon pools (aboveground biomass, belowground biomass, soil, and dead matter) to estimate carbon storage in the current landscape or carbon sequestration over a period. The equation for the total carbon stock is shown in Formulas (3) and (4):
C i = C a b o v e + C b e l o w + C s o i l + C d e a d ,
C t o t a l = i = 1 n C i × A i ,   i = 1 ,   2 , , n
where Ci represents the carbon density on land use type i (t/ha), Cabove means carbon density of aboveground biomass (t/ha); Cbelow means carbon density of belowground biomass (t/ha); Csoil means carbon density of soil (t/ha); Cdead means carbon density of dead matter (t/ha); Ai means the area of land use type i; Ctotal represents total ecosystem carbon storage (t).

3. Results

3.1. LUCC Features in the Historic Period and Future Scenarios

3.1.1. LUCC Features in the Historic Period

According to historical land use data (Table 2), from 2010 to 2020, the land use type with the largest area change was farmland, with a decrease of more than 2 × 10⁵ ha (nearly 5%); the most obvious increase in proportion was built-up land (more than 16%), with a cumulative expansion of nearly 2 × 10⁵ ha; In addition, the area of grassland also increased, but the magnitude was not significant, with an increase of less than 3 × 10⁴ ha (approximately 3% only); the rest of the land use types did not change remarkably. The considerable expansion of built-up area is one of the most noteworthy features of land use change in Guangdong Province.
Spatially, built-up land has spread to different degrees in all parts of the land around the towns during the decade, with the conversion of farmland around cities being the most significant source of expansion (Figure 2). The most obvious expansion occurred in the Pearl River Delta urban agglomeration area, where the scale of built-up land is larger than it was 10 years ago, making it more concentrated and contiguous. In addition, since Guangdong is mostly mountainous and hilly, the eastern part is a plain area with comfortable temperatures and abundant precipitation, which creates natural conditions for orderly development in the east. The built-up areas in the eastern part of Guangdong Province have also undergone significant urban expansion, and according to the relevant plans, this area will be developed into the “Shantou-Chaozhou-Jieyang Metropolitan Area” with the spatial form of a compact combination city.
The increase in the area of forest and grassland is another important feature. Recent years, as one of the fastest-growing urbanized regions, ecological and environmental problems have become increasingly prominent as the economic level continues to rise. For this reason, Guangdong Province has focused on the health and stability of natural ecosystems and has vigorously promoted plantation and ecological restoration, which has resulted in an increase in the area of forest and grassland ecosystems [47].

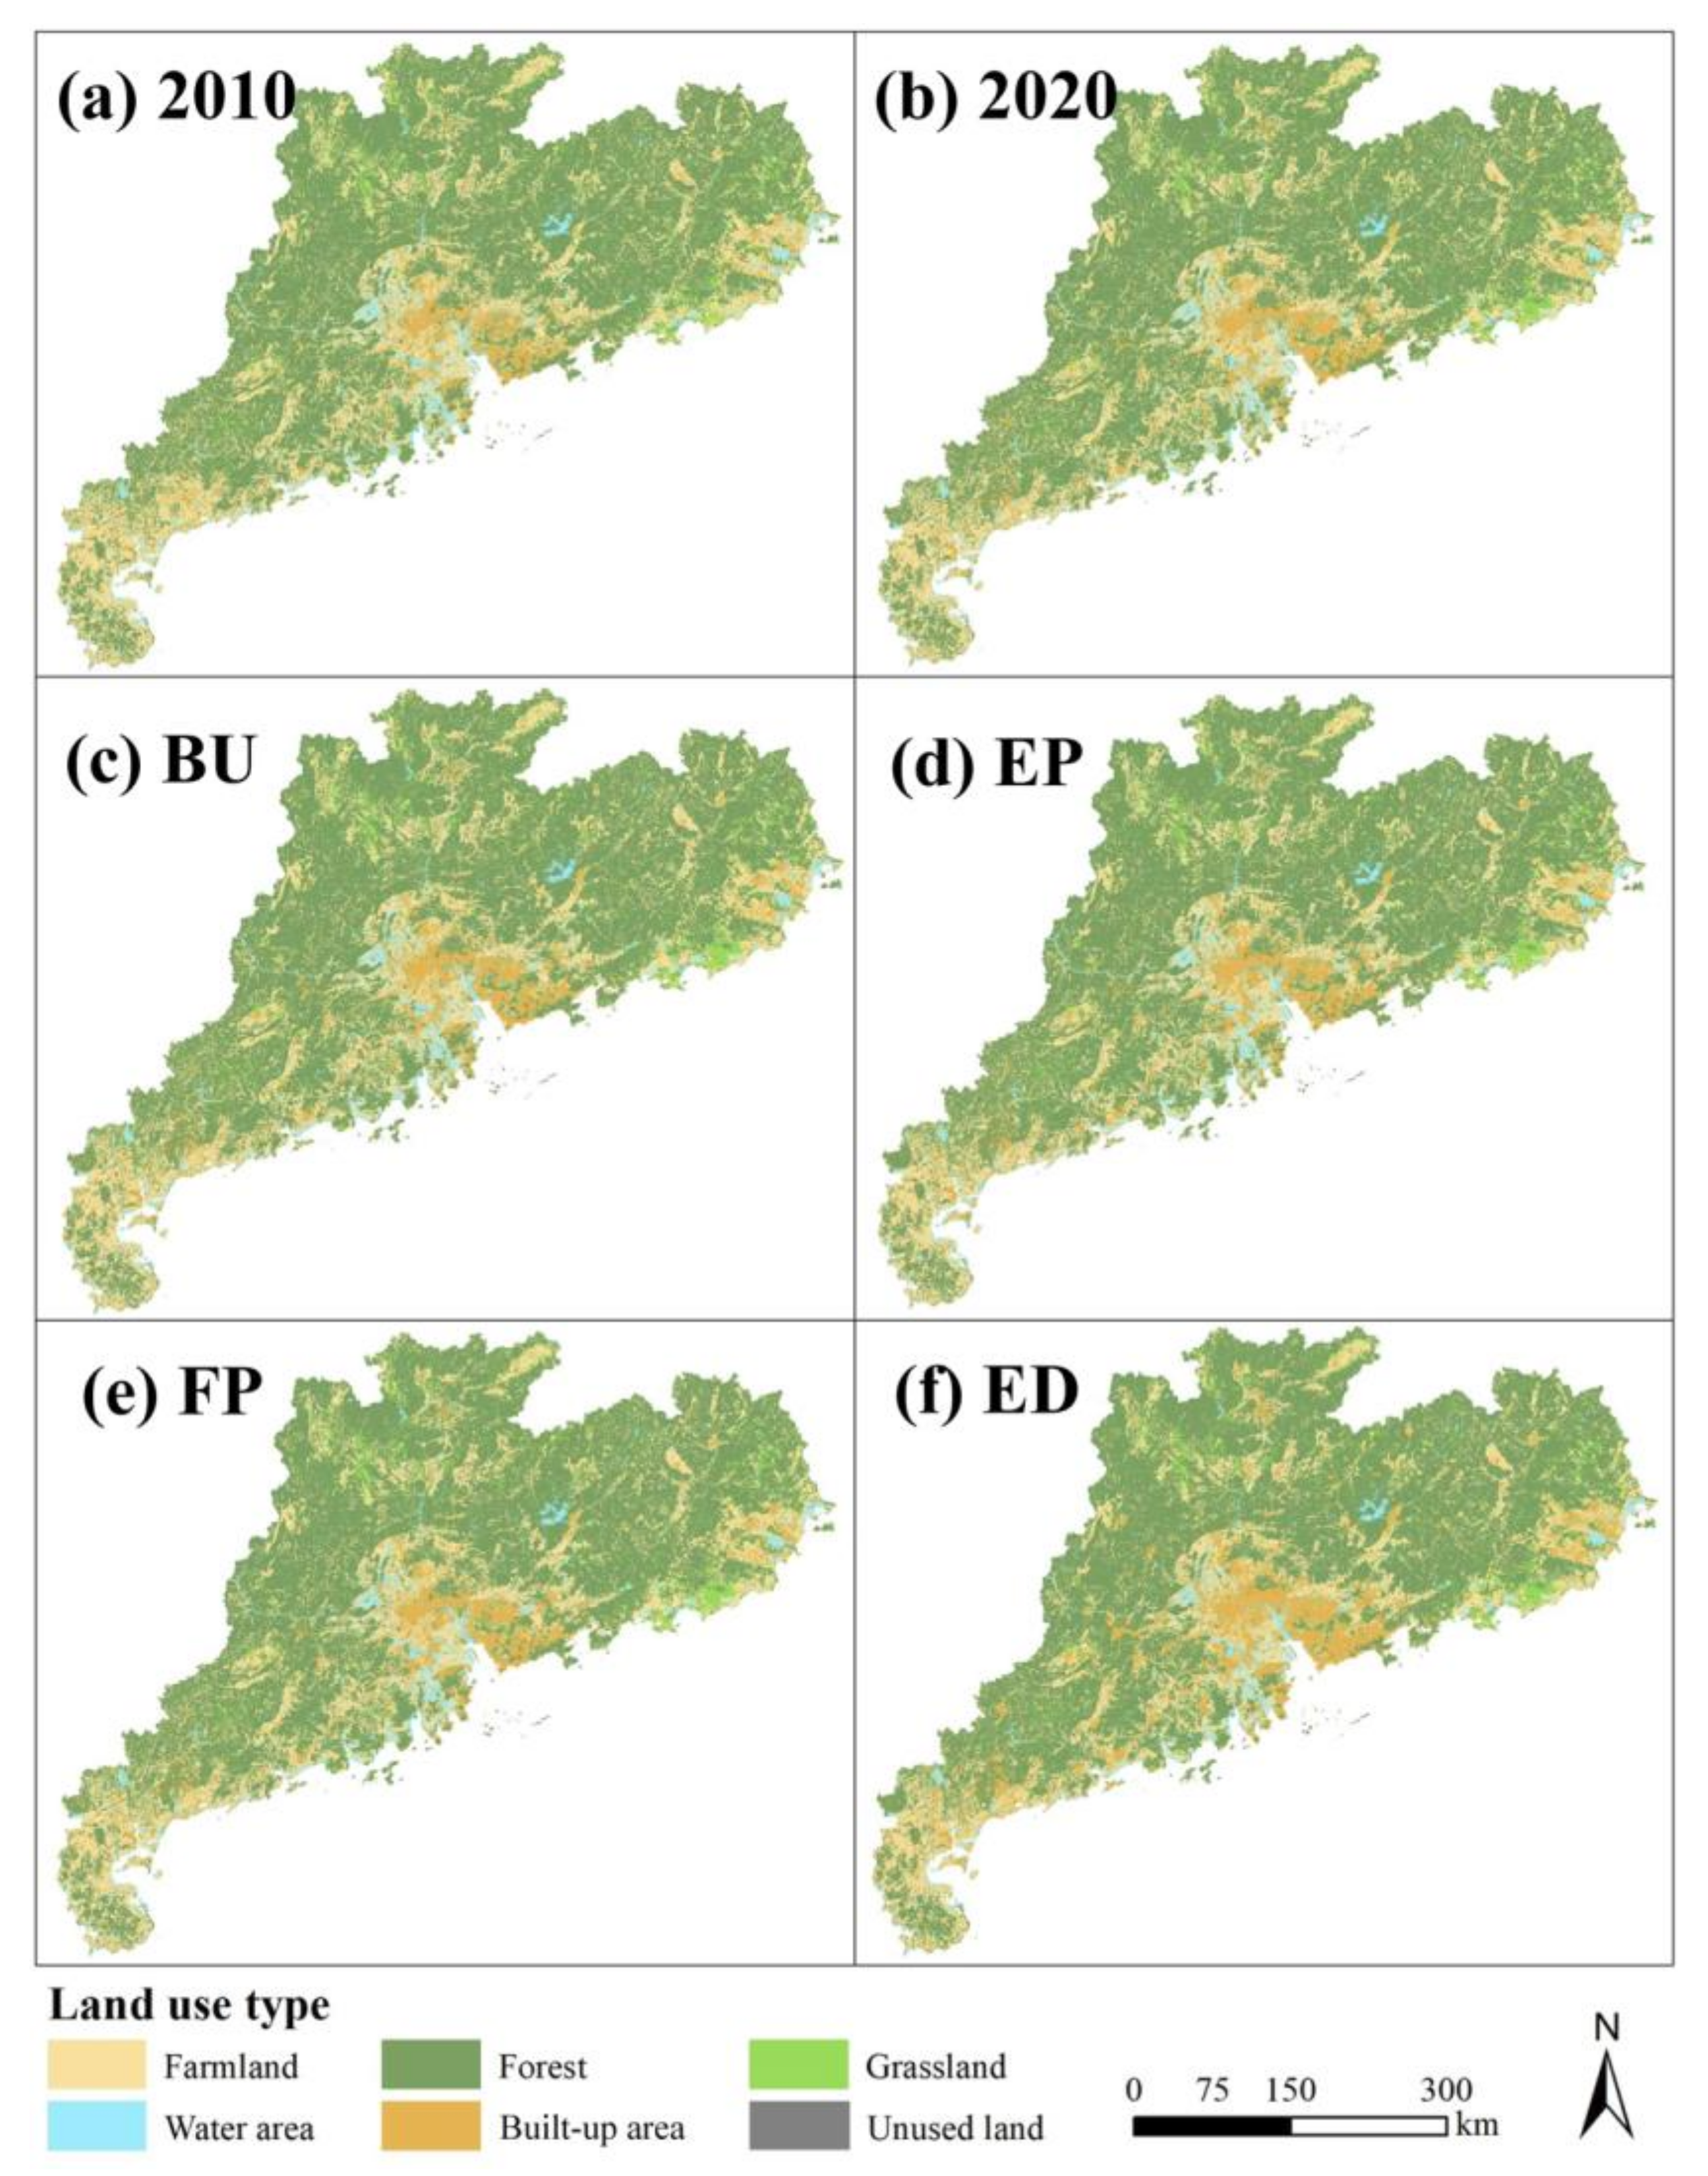
3.1.2. LUCC Features in Future Scenarios

Based on the characteristics of historical land use changes in Guangdong Province, and combined with planning projects such as Guangdong Territorial Planning (2016–2035) and Guangdong Territorial Spatial Planning (2020–2035), the land use pattern under four future scenarios was simulated. The common feature of the four scenarios is that they have carried out different degrees of urban expansion, which is in line with the actual development strategy of Guangdong (Table 2).
In the BU scenario, the farmland around the city will be further occupied, but to a minor extent, and the area of the remaining land use types is essentially the same as in 2020. In the EP scenario, as required in the planning policy to ensure the forest land holdings in 2030, a portion of other natural ecosystems (farmland, grassland, unused land) will be converted to forest land, and those will also convert to built-up land due to the need for urban construction.
In the FP scenario, it is assumed that farmland will not be converted to any other land use types, indicating that they will not be transformed into built-up land. However, the urban expansion will happen still. The forest is generally far away from the city, so important sources of built-up land expansion turn out to be the unused land and grassland around the city, whose land use area is much smaller than farmland, so the city expansion will be on a not big scale.
In the ED scenario, the expansion of towns and cities is greatly increased for the pursuit of economic interests. Under the premise of meeting the upper limit of development intensity in the planning projects concerned, the built-up land will no longer be restricted by spatial conditions, and the farmland, forest, grassland, and unused land around them will be utilized. In this scenario, the built-up land in the entire Pearl River Delta will be more concentrated and larger in scale than ever before. The spatial mapping of land use under each scenario is shown in Figure 2.

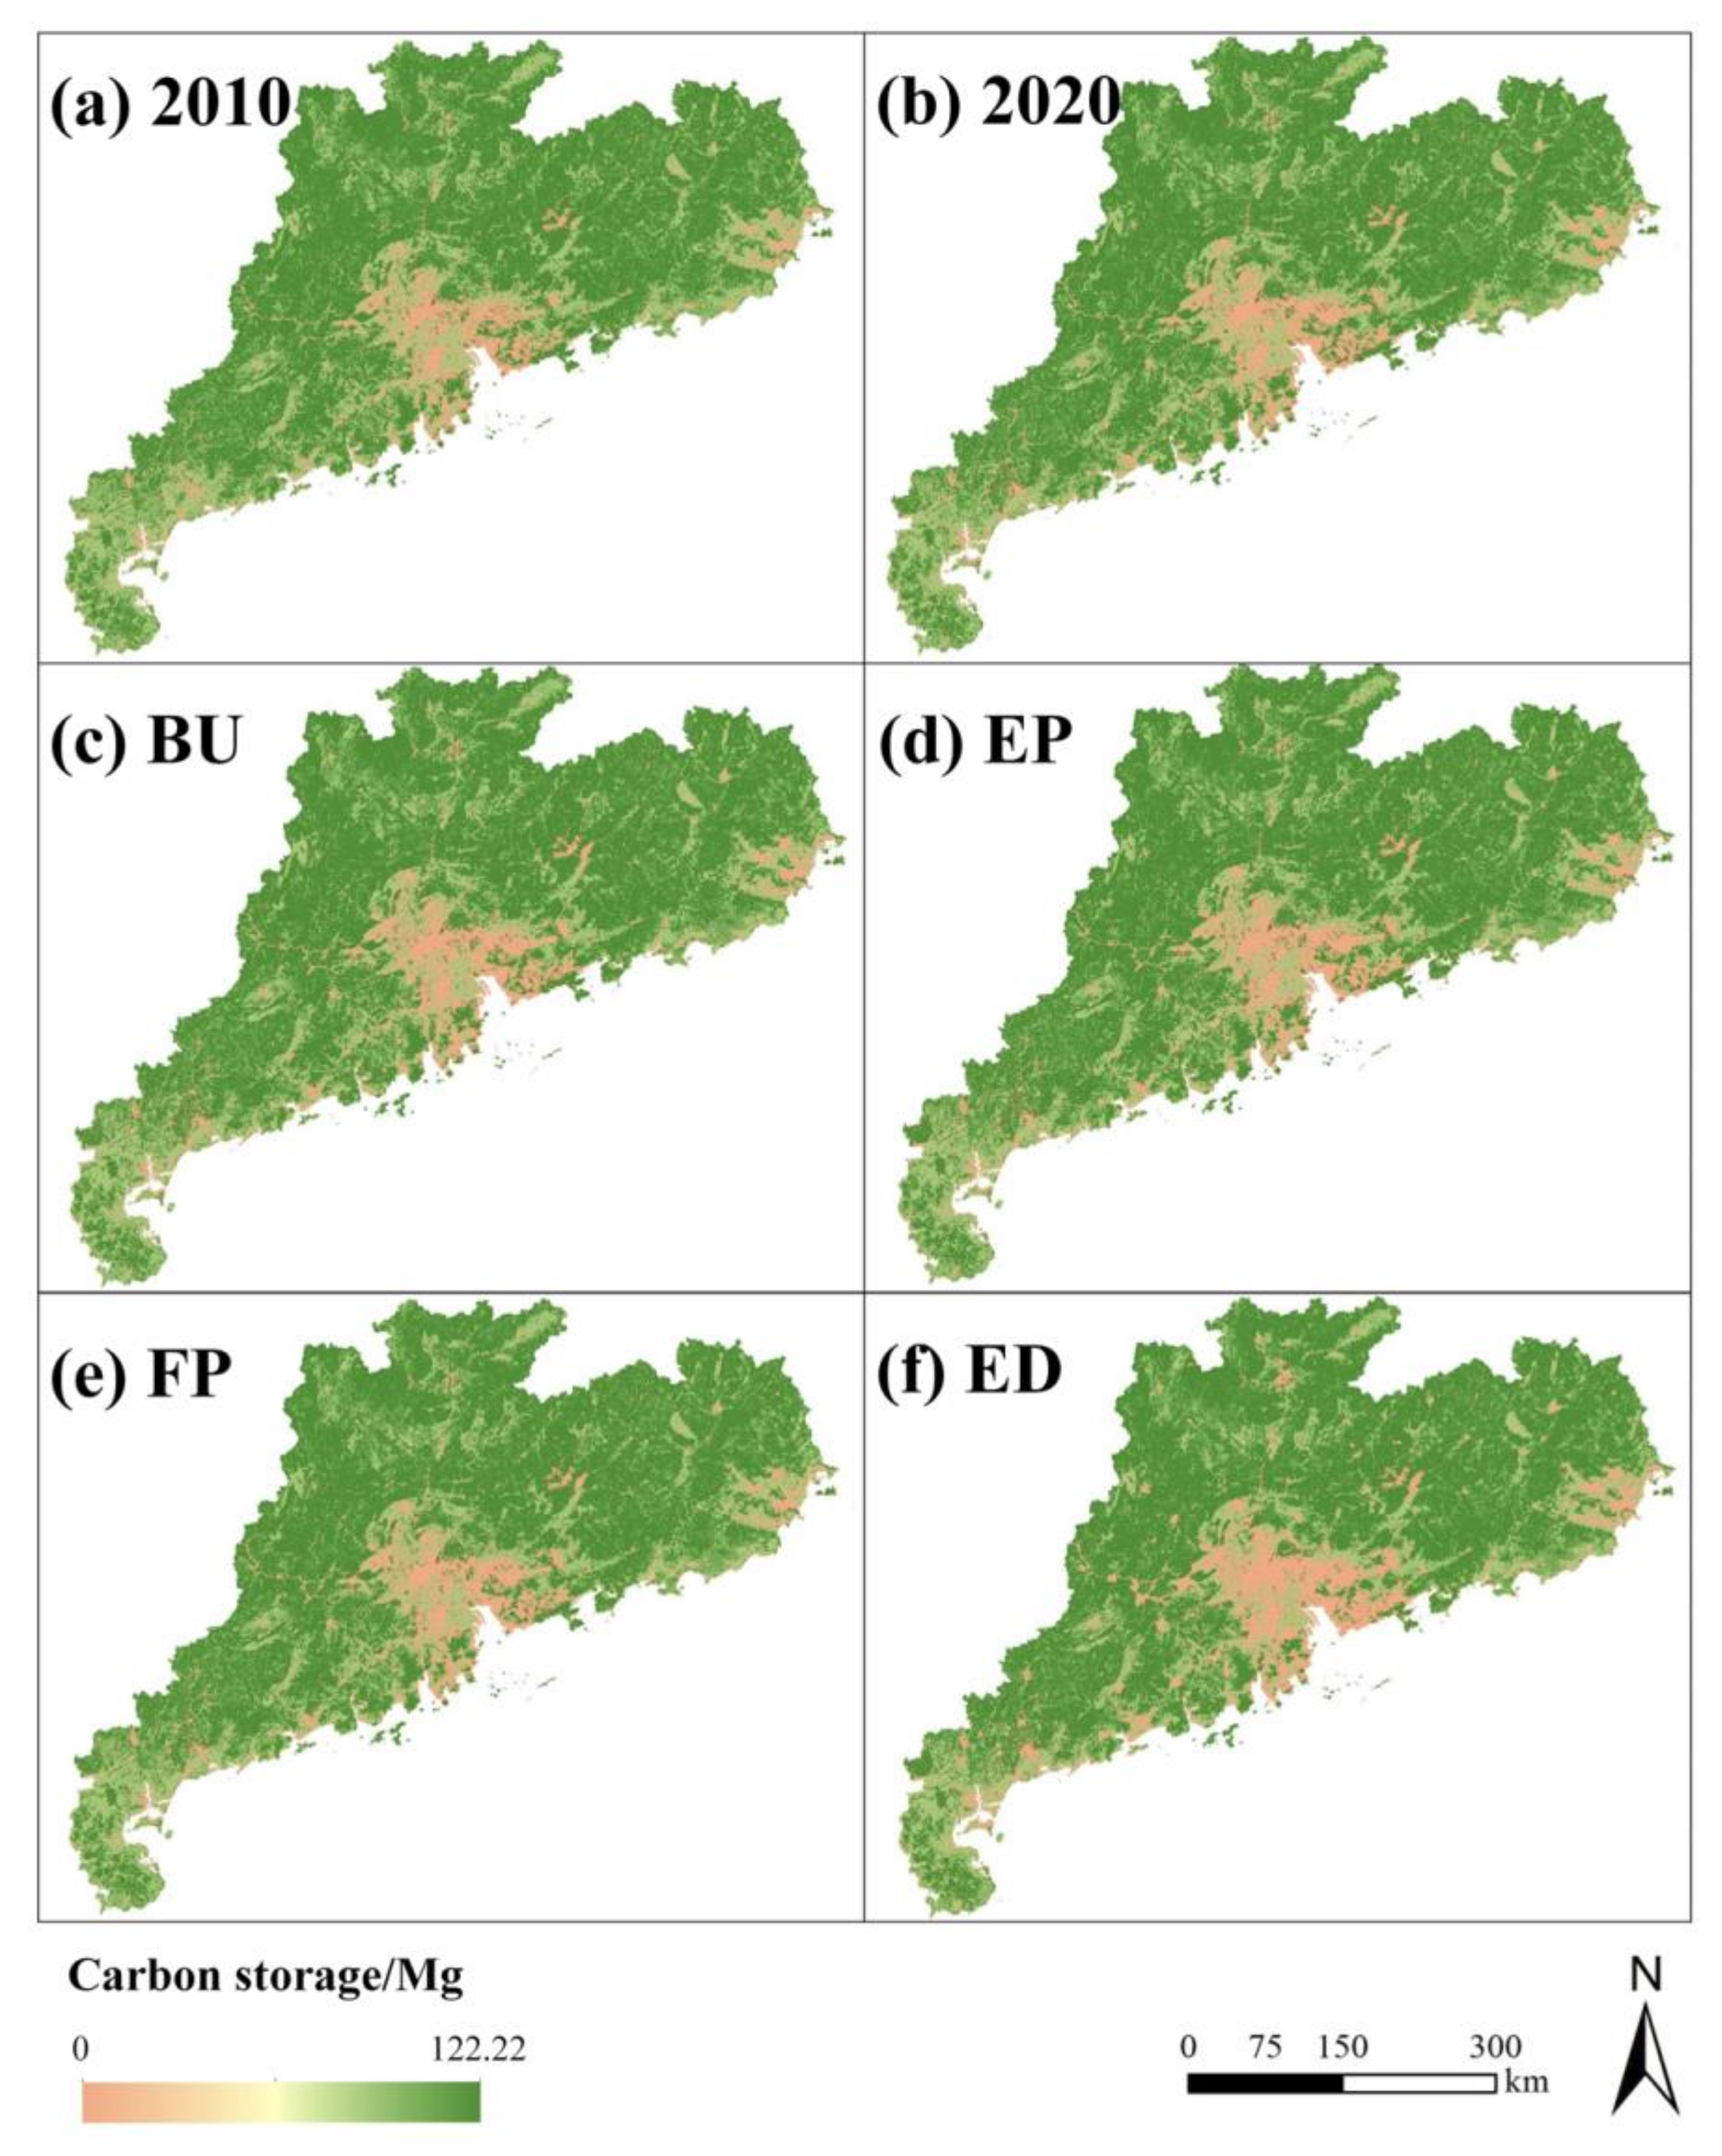
3.2. Ecosystem Carbon Storage

From the perspective of Table 3, the carbon reserves decreased significantly from 2010 to 2020, which decreased 12.61 Tg C. During this decade, drastic urban expansion has taken place in Guangdong Province, and the area of built-up land increased from 115.38 × 10⁴ ha in 2010 to 133.98 × 10⁴ ha in 2020, resulting in the transformation of a large area of natural ecosystem to built-up land. There are 79.83% of carbon loss areas are caused by the conversion of other land use types to built-up areas, among which the conversion of farmland to built-up land is the largest (31.56%).
In each scenario, carbon storage will further reduce. In the BU scenario, there will be a loss of 4.19 Tg C. Only the carbon storage in the FP scenario is higher than that in the BU, with merely a small loss (0.09 Tg C). The carbon storage of the other scenarios has decreased significantly. The remaining scenarios showed a significant decline in carbon storage, with the ED scenario reaching the upper limit of development in terms of urban expansion and incurring the most carbon loss of any scenario, with a loss of 47.62 Tg C, which is 3.7 times the amount lost in 2010–2020. The EP scenario is second only to the ED scenario in terms of carbon loss (4.68 Tg C).
In 2030, urban expansion under each scenario will continue, and various natural ecosystems will be transformed into built-up land at different scales, so carbon storage will decline in each scenario. In the ED scenario, the urban development intensity will reach saturation, while the cities, such as the Pearl River Delta, will occupy large areas of farmland, grassland, forest, so the carbon storage will decline significantly. The carbon storage in the FP scenario will be higher than that in the EP scenario, indicating that the interaction between spatially adjacent elements cannot be ignored when the planned land use amount meets the need.
Considering the actual situation in Guangdong Province (Figure 3), since farmland is key to providing food and other consumer goods for the residents in the town, most of the farmland is also distributed around the city. In the FP scenario, farmland is strictly restricted, so while protecting farmland, it also greatly constrains the sprawl of towns and cities and reduces the damage to natural ecosystems and carbon loss. In the EP scenario, the protection of forest land and grassland is often emphasized, they are far away from the city, so the phenomenon of urban expansion in this scenario is still obvious enough. In order to increase ecosystem carbon storage, it is also important to consider the significance of farmland along with ecological protection.

4. Discussion

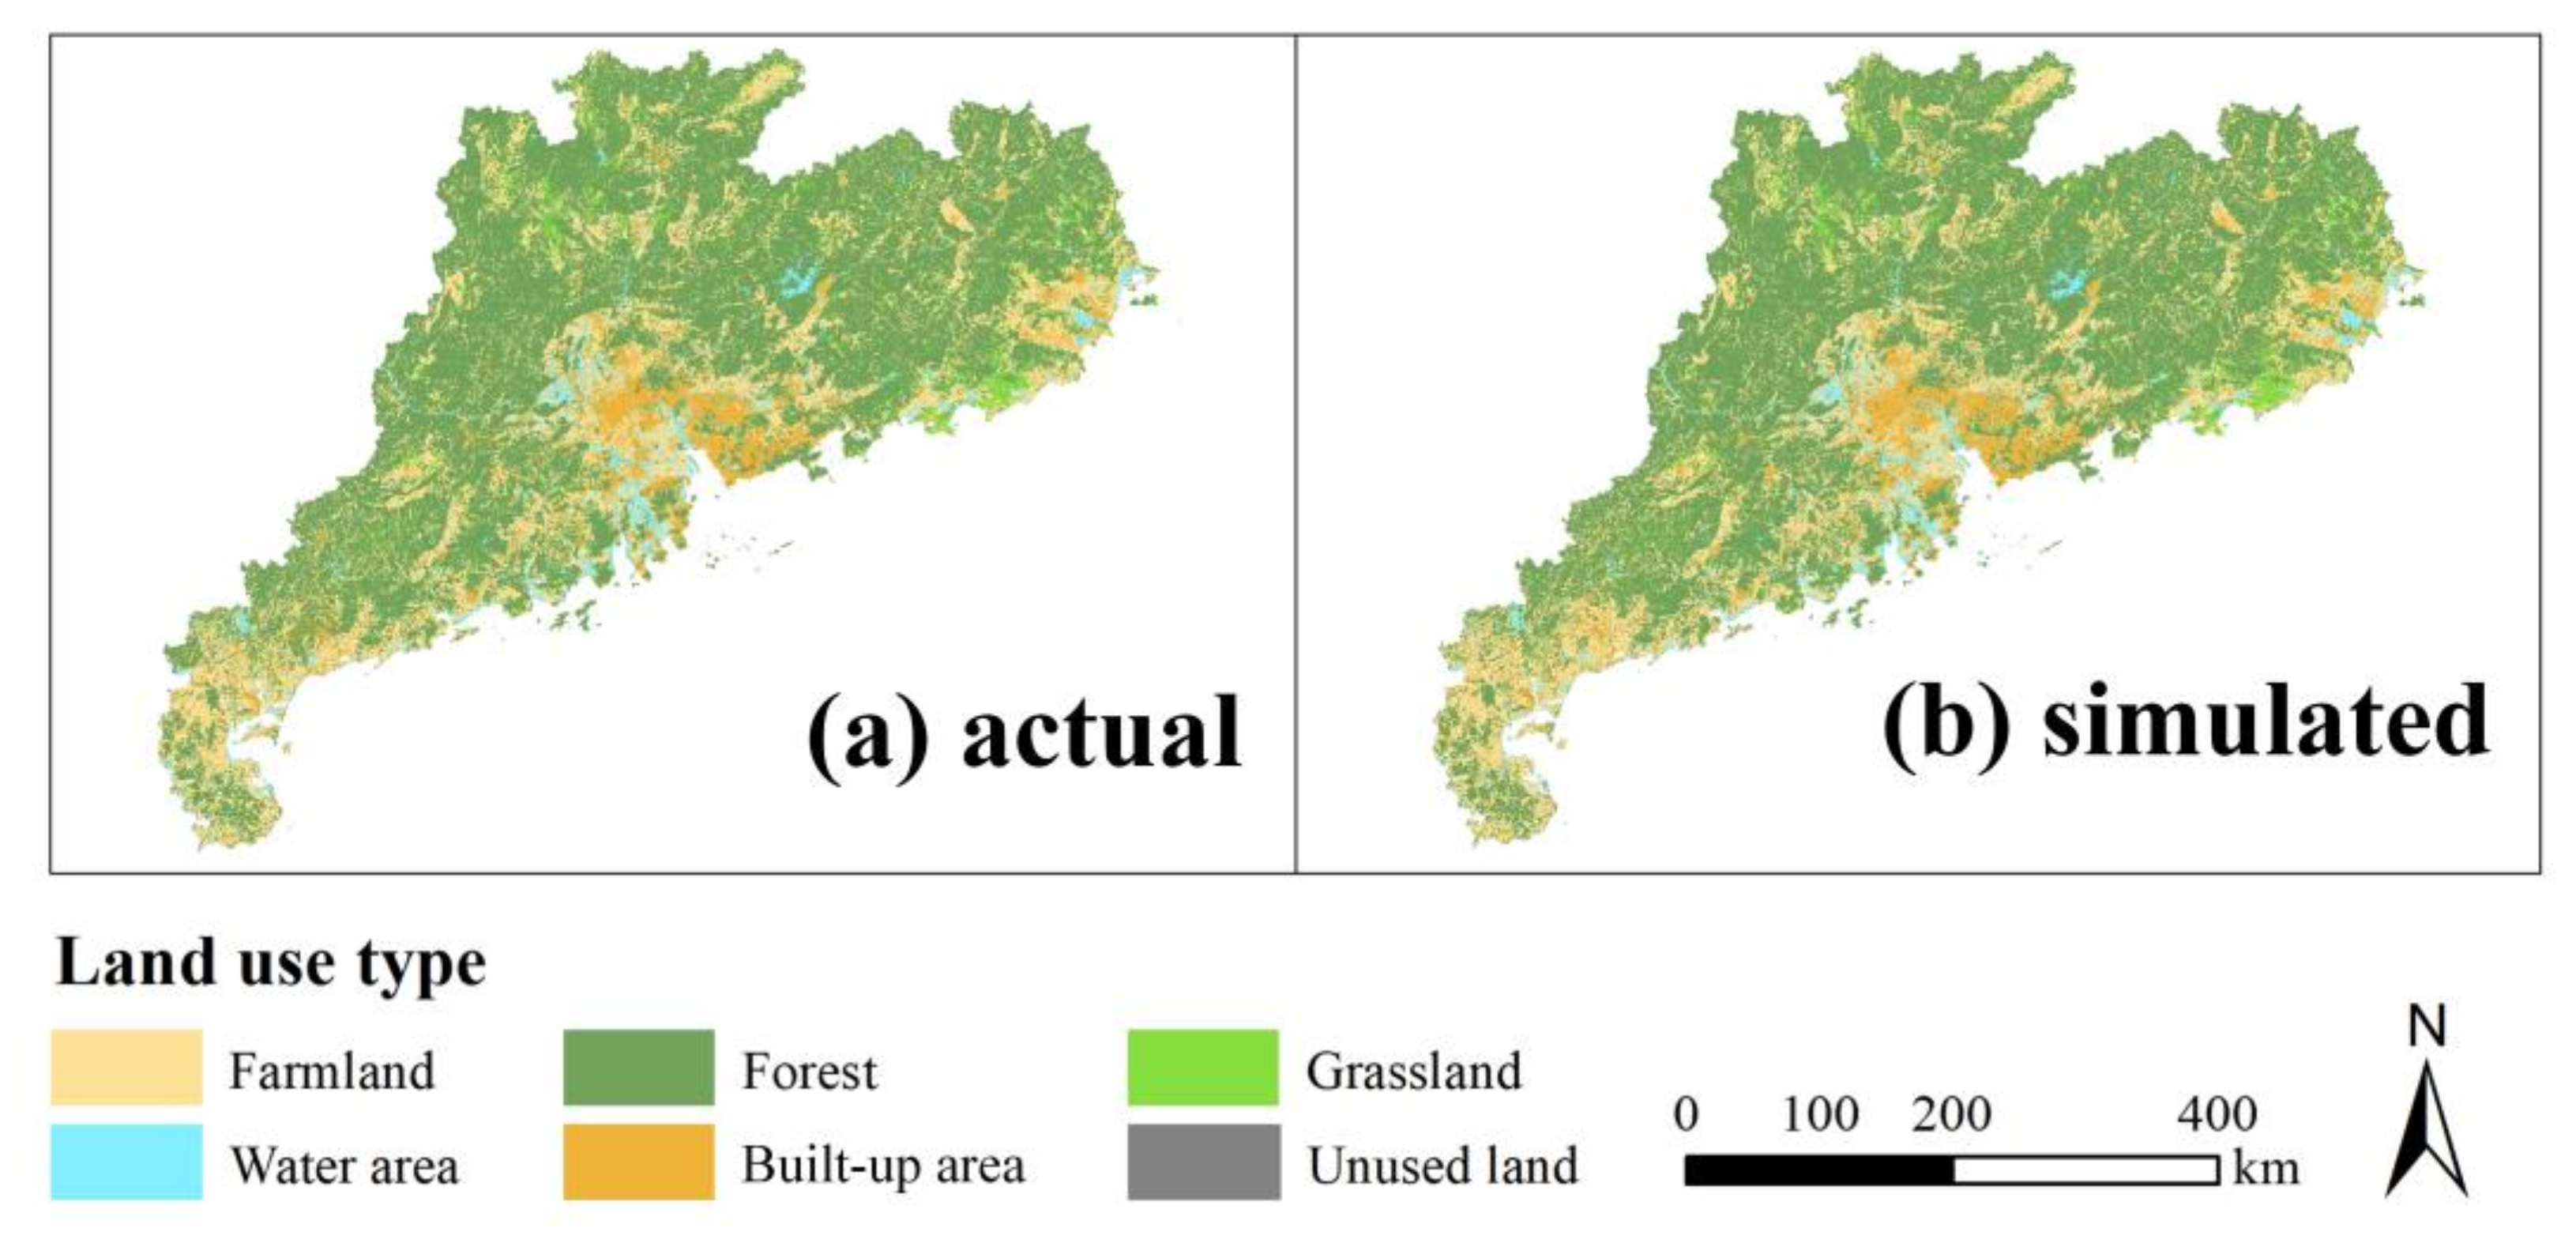
4.1. Verification of PLUS Model

Studies have shown that in the context of global change, population size and built-up area tend to be positively correlated [48,49]. This study explores future urban scale changes through the trend of the future population, thereby verifying the demand for land use. As machine learning is increasingly considered an effective tool for future population prediction, three methods, Holt-Winters, Damped Holt-Winters method, and ARIMA Model, have proven to be effective tools [50,51]. In this study, by using the forecast and tseries packages in R language, the predictions of the future population of Guangdong Province are made by the above three models.
Each model passes the goodness-of-fit test and is statistically significant. The population number prediction results can be seen in Table 4. Although there are differences in the prediction results of each model, it is affirmative that the population of Guangdong Province will further increase by 2030, so it is presumed that the scale of built-up land will also increase accordingly. The area of built-up land will increase from each scenario, so the land use demand can be proved to be correct.
Taking 2010 as the base period, the PLUS model simulated the LUCC in Guangdong Province in 2020 by combining a variety of LUCC drivers. Compared with the actual situation, it can be concluded (Figure 4) that there is an extremely high spatial distribution similarity between those two. From the quantitative relationship, the Kappa coefficient is 0.8571, which shows the applicability of the model and the accuracy of the driving force selection.

4.2. Comparison of Carbon Storage Result

In this study, ecosystem carbon storage was calculated by the InVEST model. In order to make the research results more objective and accurate, a set of carbon density by land use type under different carbon pools was derived by comparing it with other scholars’ studies. The specific data and reference sources are shown in Table 5.
In addition, the ecosystem carbon storage in other regions of China with similar natural background characteristics was compared. Due to the large differences in the study area between different study results and the lack of comparability of the respective total carbon storage, the amount of contained carbon per unit area, i.e., carbon density, was used for comparing with each other [56].
The result of this study and others (Table 6) are in the same order of magnitude, which can demonstrate the accuracy of the results. On the other hand, the carbon density of ecosystems in Guangdong Province is not as high as in other regions with similar natural background characteristics. Although Guangdong Province has low latitude, adjacent to the ocean, and has year-round high temperatures, humid climate, and evergreen seasons, which are suitable for vegetation growth, the urbanization rate of Guangdong Province is among the highest in China. Large areas of natural ecosystems have been developed into built-up land, which is the main reason for the low carbon storage level.

4.3. Suggestions for the Conservation of Carbon

According to the Climate Action from the United Nations, it is imperative to take credible actions to achieve the Net-zero goal. Net zero means the remaining emissions are reabsorbed from the atmosphere by the natural ecosystem. Therefore, the ability to store carbon is of vital importance to avoid the catastrophic impacts of climate change and preserve a livable planet. Many countries pledged to achieve the net-zero target, including some big emission objects, like China.
Although China plays the biggest emission role all around the world, the government aims to cut its CO2 emissions to zero by 2060. China takes up-to-down measurements to make this commitment come true, indicating that the provincial governments were required to achieve their Net-zero goal. Taking Guangdong Province as an example, several planning documents were released in 2021 to guide the departments concerned to achieve the net-zero target, the 14th Five-Year Plan of Ecological Environment Protection and the 14th Five-Year Plan for Ecological Civilization Construction for instance. These two documents are updated every five years, and the Net-zero goal became one of the most essential objectives for the first time. However, to take advantage of the absorption ability of the ecosystem, both two planning documents proposed the explicit protection target indicators to the proportion of forest coverage, wetland protection, and green infrastructure area, but the contribution of farmland was ignored. There are multiple documents aiming to achieve the Net-zero goal that only concentrates on ecological protection approaches, and lacks the consideration of farmland protection methods.
To sum up, it is highly advisable that the importance of both ecological and farmland protection indicators should be taken seriously in future planning documents concerned in not only China but also in other countries or areas.

4.4. Limitations and Prospects

As society evolves and population numbers further rise, more necessities such as food, energy, and water will be obtained from natural ecosystems, resulting in a further complex relationship between humans and natural ecosystems [62]. However, in this study, only the characteristics of historical changes and the constraints of planning projects on future LUCC were considered in the simulation of LUCC, but the coupling of human-land systems was less considered. Few major LUCC events were taken into consideration, such as logging, river damming, and forest fires.
Moreover, the climbing population is bound to cause higher-intensity human activities, and anthropogenic processes have already produced significant changes to the climate [63]. However, this study took less account of the effects of climate change when predicting future land use patterns. It is hoped that more indicators that can reflect these two points will be incorporated into the influencing factors of LUCC simulations in further studies.
Besides, the model can properly be implemented in a local area such as Guangdong Province, but whether this model is appropriate for a larger scale is not explored, in our future studies we will be able to consider answering such important questions.

5. Conclusions

We integrated the Markov-PLUS-InVEST model to simulate the land use pattern of Guangdong Province in 2030 based on the land use pattern in 2010 and 2020 and assessed the ecosystem carbon storage under each historical and future land use scenario. The main conclusions are as follows.
During 2010–2020, the area of built-up land in Guangdong Province increases significantly, the area of farmland decreases by nearly 5%, the area of grassland increased by about 3%, and the area of the remaining land use types does not change much. The scale of built-up land increases in all four future scenarios, but the scale of expansion varies due to the constraints of spatial patterns and policies. Due to the location limitation, construction land expansion is minimal in the FP scenario, and the area of natural ecosystems such as farmland and forest land grows significantly; the land use change in the BU scenario is a continuation of 2010 and 2020. Forests are well protected in the EP scenario, but due to the lack of constraints on urban sprawl, the expansion is still obvious. In the ED scenario, with economic development as the guide, the urban sprawl encroaches on many natural ecosystems.
The ecosystem carbon storage declined significantly during the last decade 2010–2020, this could be due to urban expansion. In the four scenarios in 2030, the further development of urban size will decrease carbon storage, and there will be a relationship of FP > BU > EP > ED for ecosystem carbon storage. Therefore, it is suggested that not only the quantitative coordination of land use should be considered in planning but also the spatial locational factors need to be taken into account, so as to enhance the protection of land use types close to cities such as farmland. This could simultaneously increase ecosystem carbon storage in terms of both limiting urban sprawl and increasing ecosystem carbon potential, which makes it an efficient nature-based solution to reserve carbon.

Author Contributions

Conceptualization, L.C. and S.Z.; data curation, L.C. and W.T.; formal analysis, W.T., S.Z. and R.P.S.; funding acquisition, S.Z.; investigation, W.T.; methodology, L.C. and S.Z.; supervision, S.Z.; validation, W.T., L.C. and R.P.S.; writing—original draft, L.C. and W.T.; writing—review and editing, L.C., W.T., S.Z. and R.P.S. All authors have read and agreed to the published version of the manuscript.

Funding

This research was funded by the Open Fund of Key Laboratory of Urban Land Resources Monitoring and Simulation, Ministry of Natural Resources (Grant No. KF-2021-06-068), and the National Natural Science Foundation of China (Grant No. 42007194).

Institutional Review Board Statement

Not applicable.

Informed Consent Statement

Not applicable.

Data Availability Statement

The data in the article are detailed in Section 2.2. All the data used are reflected in the article. If you need other relevant data, please contact the authors.

Acknowledgments

The authors are grateful to WorldPop (www.worldpop.org, accessed on 8 December 2021) for making gridded population count data available. Acknowledgment for the data support from the National Earth System Science Data Center, National Science & Technology Infrastructure of China. (http://www.geodata.cn, accessed on 22 April 2022). The authors are grateful to the three anonymous referees for their useful comments/suggestions which have helped us to improve the earlier version of the manuscript.

Conflicts of Interest

The authors declare no conflict of interest.

References

  1. IPCC. Climate Change 2021: The Physical Science Basis. Contribution of Working Group I to the Sixth Assessment Report of the Intergovernmental Panel on Climate Change; Cambridge University Press: Cambridge, UK; New York, NY, USA, 2021; pp. 2061–2086. [Google Scholar]
  2. Mora, C.; Spirandelli, D.; Franklin, E.C.; Lynham, J.; Kantar, M.B.; Miles, W.; Smith, C.Z.; Freel, K.; Moy, J.; Louis, L.V.; et al. Broad threat to humanity from cumulative climate hazards intensified by greenhouse gas emissions. Nat. Clim. Chang. 2018, 8, 1062–1071. [Google Scholar] [CrossRef]
  3. IPCC. Climate change 2014 Synthesis Report. Contribution of Working Groups I, II, and III to the Fifth Assessment Report of the Intergovernmental Panel on Climate Change; IPCC: Geneva, Switzerland, 2014. [Google Scholar]
  4. Hutyra, L.R.; Duren, R.M.; Gurney, K.R.; Grimm, N.B.; Kort, E.A.; Larson, E.K.; Shrestha, G. Urbanization and the carbon cycle: Current capabilities and research outlook from the natural sciences perspective. Earth’s Future 2014, 2, 473–495. [Google Scholar] [CrossRef] [Green Version]
  5. Lawrence, D.M.; Hurtt, G.C.; Arneth, A.; Brovkin, V.; Calvin, K.V.; Jones, A.D.; Jones, C.D.; Lawrence, P.J.; de Noblet-Ducoudré, N.; Pongratz, J.; et al. The Land Use Model Intercomparison Project (LUMIP) contribution to CMIP6: Rationale and experimental design. Geosci. Model Dev. 2016, 9, 2973–2998. [Google Scholar] [CrossRef] [Green Version]
  6. Xu, L.; Saatchi, S.S.; Yang, Y.; Yu, Y.; Pongratz, J.; Bloom, A.A.; Bowman, K.; Worden, J.; Liu, J.; Yin, Y.; et al. Changes in global terrestrial live biomass over the 21st century. Sci. Adv. 2021, 7, e9829. [Google Scholar] [CrossRef]
  7. Erb, K.; Kastner, T.; Plutzar, C.; Bais, A.L.S.; Carvalhais, N.; Fetzel, T.; Gingrich, S.; Haberl, H.; Lauk, C.; Niedertscheider, M.; et al. Unexpectedly large impact of forest management and grazing on global vegetation biomass. Nature 2018, 553, 73–76. [Google Scholar] [CrossRef] [PubMed]
  8. Bonan, G.B. Forests and Climate Change: Forcings, Feedbacks, and the Climate Benefits of Forests. Science 2008, 320, 1444–1449. [Google Scholar] [CrossRef] [PubMed] [Green Version]
  9. Davin, E.L.; de Noblet-Ducoudre, N. Climatic Impact of Global-Scale Deforestation: Radiative versus Nonradiative Processes. J. Clim. 2010, 23, 97–112. [Google Scholar] [CrossRef]
  10. Li, Y.; Zhao, M.; Motesharrei, S.; Mu, Q.; Kalnay, E.; Li, S. Local cooling and warming effects of forests based on satellite observations. Nat. Commun. 2015, 6, 6603. [Google Scholar] [CrossRef] [Green Version]
  11. Silvério, D.V.; Brando, P.M.; Macedo, M.N.; Beck, P.S.A.; Bustamante, M.; Coe, M.T. Agricultural expansion dominates climate changes in southeastern Amazonia: The overlooked non-GHG forcing. Environ. Res. Lett. 2015, 10, 104015. [Google Scholar] [CrossRef]
  12. Li, Y.; Brando, P.M.; Morton, D.C.; Lawrence, D.M.; Yang, H.; Randerson, J.T. Deforestation-induced climate change reduces carbon storage in remaining tropical forests. Nat. Commun. 2022, 13, 1964. [Google Scholar] [CrossRef]
  13. Friedlingstein, P.; O Sullivan, M.; Jones, M.W.; Andrew, R.M.; Hauck, J.; Olsen, A.; Peters, G.P.; Peters, W.; Pongratz, J.; Sitch, S.A.; et al. Global Carbon Budget 2020. Earth Syst. Sci. Data 2020, 12, 3269–3340. [Google Scholar] [CrossRef]
  14. Houghton, R.A.; House, J.I.; Pongratz, J.; van der Werf, G.R.; DeFries, R.S.; Hansen, M.C.; Le Quéré, C.; Ramankutty, N. Carbon emissions from land use and land-cover change. Biogeosciences 2012, 9, 5125–5142. [Google Scholar] [CrossRef] [Green Version]
  15. IPCC. Climate Change 2013—The Physical Science Basis: Working Group I Contribution to the Fifth Assessment Report of the Intergovernmental Panel on Climate Change; Cambridge University Press: Cambridge, UK, 2014; ISBN 9781107057999. [Google Scholar]
  16. Cox, P.M.; Pearson, D.; Booth, B.B.; Friedlingstein, P.; Huntingford, C.; Jones, C.D.; Luke, C.M. Sensitivity of tropical carbon to climate change constrained by carbon dioxide variability. Nature 2013, 494, 341–344. [Google Scholar] [CrossRef] [PubMed] [Green Version]
  17. Davidson, E.A.; de Araújo, A.C.; Artaxo, P.; Balch, J.K.; Brown, I.F.; Bustamante, C.M.M.; Coe, M.T.; DeFries, R.S.; Keller, M.; Longo, M.; et al. The Amazon basin in transition. Nature 2012, 481, 321–328. [Google Scholar] [CrossRef]
  18. Cardinale, B.J.; Duffy, J.E.; Gonzalez, A.; Hooper, D.U.; Perrings, C.; Venail, P.; Narwani, A.; Mace, G.M.; Tilman, D.; Wardle, D.A. Biodiversity loss and its impact on humanity. Nature 2012, 486, 59–67. [Google Scholar] [CrossRef] [Green Version]
  19. Fargione, J.E.; Bassett, S.; Boucher, T.; Bridgham, S.D.; Conant, R.T.; Cook-Patton, S.C.; Ellis, P.W.; Falcucci, A.; Fourqurean, J.W.; Gopalakrishna, T. Natural climate solutions for the United States. Sci. Adv. 2018, 4, t1869. [Google Scholar] [CrossRef] [PubMed] [Green Version]
  20. Janes-Bassett, V.; Bassett, R.; Rowe, E.C.; Tipping, E.; Yumashev, D.; Davies, J. Changes in carbon storage since the pre-industrial era: A national scale analysis. Anthropocene 2021, 34, 100289. [Google Scholar] [CrossRef]
  21. Porfirio, L.L.; Steffen, W.; Barrett, D.J.; Berry, S.L. The net ecosystem carbon exchange of human-modified environments in the Australian Capital Region. Reg. Environ. Chang. 2010, 10, 1–12. [Google Scholar] [CrossRef]
  22. Meena, V.S.; Mondal, T.; Pandey, B.M.; Mukherjee, A.; Yadav, R.P.; Choudhary, M.; Singh, S.; Bisht, J.K.; Pattanayak, A. Land use changes: Strategies to improve soil carbon and nitrogen storage pattern in the mid-Himalaya ecosystem, India. Geoderma 2018, 321, 69–78. [Google Scholar] [CrossRef]
  23. Farley, K.A.; Bremer, L.L.; Harden, C.P. Changes in carbon storage under alternative land uses in biodiverse Andean grasslands: Implications for payment for ecosystem services. Conserv. Lett. 2013, 6, 21–27. [Google Scholar] [CrossRef]
  24. Islam, I.; Cui, S.; Hoque, M.Z.; Abdullah, H.M.; Tonny, K.F.; Ahmed, M.; Ferdush, J.; Xu, L.; Ding, S. Dynamics of Tree outside Forest Land Cover Development and Ecosystem Carbon Storage Change in Eastern Coastal Zone, Bangladesh. Land 2022, 11, 76. [Google Scholar] [CrossRef]
  25. Sarathchandra, C.; Alemu Abebe, Y.; Worthy, F.R.; Lakmali Wijerathne, I.; Ma, H.; Yingfeng, B.; Jiayu, G.; Chen, H.; Yan, Q.; Geng, Y.; et al. Impact of land use and land cover changes on carbon storage in rubber dominated tropical Xishuangbanna, South West China. Ecosyst. Health Sustain. 2021, 7, 1915183. [Google Scholar] [CrossRef]
  26. Li, J.; Guo, X.; Chuai, X.; Xie, F.; Yang, F.; Gao, R.; Ji, X. Reexamine China’s terrestrial ecosystem carbon balance under land use-type and climate change. Land Use Policy 2021, 102, 105275. [Google Scholar] [CrossRef]
  27. Zheng, S.; Huang, Y.; Sun, Y. Effects of Urban Form on Carbon Emissions in China: Implications for Low-Carbon Urban Planning. Land 2022, 11, 1343. [Google Scholar] [CrossRef]
  28. Tang, W.; Cui, L.; Zheng, S.; Hu, W. Multi-Scenario Simulation of Land Use Carbon Emissions from Energy Consumption in Shenzhen, China. Land 2022, 11, 1673. [Google Scholar] [CrossRef]
  29. Yang, H.; Huang, J.; Liu, D. Linking climate change and socioeconomic development to urban land use simulation: Analysis of their concurrent effects on carbon storage. Appl. Geogr. 2020, 115, 102135. [Google Scholar] [CrossRef]
  30. Zhu, W.; Zhang, J.; Cui, Y.; Zhu, L. Ecosystem carbon storage under different scenarios of land use change in Qihe catchment, China. J. Geogr. Sci. 2020, 30, 1507–1522. [Google Scholar] [CrossRef]
  31. Zhu, G.; Qiu, D.; Zhang, Z.; Sang, L.; Liu, Y.; Wang, L.; Zhao, K.; Ma, H.; Xu, Y.; Wan, Q. Land-use changes lead to a decrease in carbon storage in arid region, China. Ecol. Indic. 2021, 127, 107770. [Google Scholar] [CrossRef]
  32. Tian, L.; Tao, Y.; Fu, W.; Li, T.; Ren, F.; Li, M. Dynamic Simulation of Land Use/Cover Change and Assessment of Forest Ecosystem Carbon Storage under Climate Change Scenarios in Guangdong Province, China. Remote. Sens. 2022, 14, 2330. [Google Scholar] [CrossRef]
  33. Ghosh, I. Chapter 7—Bayesian Methods. In Handbook of Statistics; Gudivada, V.N., Rao, C.R., Eds.; Elsevier: Amsterdam, The Netherlands, 2018; Volume 38, pp. 173–196. ISBN 0169-7161. [Google Scholar]
  34. Tjakra, J.D.; Bao, J.; Hudon, N.; Yang, R. Modeling collective dynamics of particulate systems under time-varying operating conditions based on Markov chains. Adv. Powder Technol. 2013, 24, 451–458. [Google Scholar] [CrossRef]
  35. Guan, D.; Zhao, Z.; Tan, J. Dynamic simulation of land use change based on logistic-CA-Markov and WLC-CA-Markov models: A case study in three gorges reservoir area of Chongqing, China. Environ. Sci. Pollut. Res. 2019, 26, 20669–20688. [Google Scholar] [CrossRef]
  36. Sohl, T.L.; Claggett, P.R. Clarity versus complexity: Land-use modeling as a practical tool for decision-makers. J. Environ. Manag. 2013, 129, 235–243. [Google Scholar] [CrossRef]
  37. Cao, M.; Tang, G.A.; Shen, Q.; Wang, Y. A new discovery of transition rules for cellular automata by using cuckoo search algorithm. Int. J. Geogr. Inf. Sci. 2015, 29, 806–824. [Google Scholar] [CrossRef]
  38. Engelen, G.; White, R.; Maarten, V.; Hahn, B. Sustainable Developments of Islands: A Policy Support Framework for the Integrated Assessment of Socio-Economic and Environmental Development; Academia Sinica and SARCS Secretariat: Taipei, Taiwan, 2002; pp. 251–287. [Google Scholar]
  39. Yang, J.; Gong, J.; Tang, W.; Liu, C. Patch-based cellular automata model of urban growth simulation: Integrating feedback between quantitative composition and spatial configuration. Comput. Environ. Urban Syst. 2020, 79, 101402. [Google Scholar] [CrossRef]
  40. Meentemeyer, R.K.; Tang, W.; Dorning, M.A.; Vogler, J.B.; Cunniffe, N.J.; Shoemaker, D.A. FUTURES: Multilevel Simulations of Emerging Urban–Rural Landscape Structure Using a Stochastic Patch-Growing Algorithm. Ann. Assoc. Am. Geogr. 2013, 103, 785–807. [Google Scholar] [CrossRef] [Green Version]
  41. Liang, X.; Guan, Q.; Clarke, K.C.; Liu, S.; Wang, B.; Yao, Y. Understanding the drivers of sustainable land expansion using a patch-generating land use simulation (PLUS) model: A case study in Wuhan, China. Comput. Environ. Urban Syst. 2021, 85, 101569. [Google Scholar] [CrossRef]
  42. Wang, J.; Zhang, J.; Xiong, N.; Liang, B.; Wang, Z.; Cressey, E.L. Spatial and Temporal Variation, Simulation and Prediction of Land Use in Ecological Conservation Area of Western Beijing. Remote. Sens. 2022, 14, 1452. [Google Scholar] [CrossRef]
  43. Zhang, S.; Zhong, Q.; Cheng, D.; Xu, C.; Chang, Y.; Lin, Y.; Li, B. Landscape ecological risk projection based on the PLUS model under the localized shared socioeconomic pathways in the Fujian Delta region. Ecol. Indic. 2022, 136, 108642. [Google Scholar] [CrossRef]
  44. Gao, L.; Tao, F.; Liu, R.; Wang, Z.; Leng, H.; Zhou, T. Multi-scenario simulation and ecological risk analysis of land use based on the PLUS model: A case study of Nanjing. Sustain. Cities Soc. 2022, 85, 104055. [Google Scholar] [CrossRef]
  45. Liting, C.; Haisheng, C.; Ting, Z.; Xueling, Z.; Xing, Z. Land use multi-scenario simulation analysis of Rao River Basin based on Markov-FLUS model. Acta Ecol. Sin. 2022, 42, 3947–3958. [Google Scholar] [CrossRef]
  46. Guozhen, L. Land Use Change and Simulation in Shenzhen Based on FLUS Model. Master’s Thesis, Wuhan University, Wuhan, China, 1 May 2018. [Google Scholar]
  47. Xu, K.; Wang, Y.; Su, H.; Yang, J.; Li, L.; Liu, C. Effect of land-use changes on nonpoint source pollution in the Xizhi River watershed, Guangdong, China. Hydrol. Process. 2013, 27, 2557–2566. [Google Scholar] [CrossRef]
  48. Freire, S.; Schiavina, M.; Florczyk, A.J.; MacManus, K.; Pesaresi, M.; Corbane, C.; Borkovska, O.; Mills, J.; Pistolesi, L.; Squires, J.; et al. Enhanced data and methods for improving open and free global population grids: Putting ‘leaving no one behind’ into practice. Int. J. Digit. Earth 2020, 13, 61–77. [Google Scholar] [CrossRef] [Green Version]
  49. Manuel, C.F.S.; Kytt, M.; Martino, P.; Erin, D.; Jane, M. Development of new open and free multi-temporal global population grids at 250 m resolution. In Proceedings of the 19th AGILE Conference on Geographic Information Science, Helsinki, Finland, 14–17 June 2016. [Google Scholar]
  50. Supriatna, A.; Susanti, D.; Hertini, E. Application of Holt exponential smoothing and ARIMA method for data population in West Java. IOP Conf. Ser. Mater. Sci. Eng. 2017, 166, 12034. [Google Scholar] [CrossRef] [Green Version]
  51. Li, W.; Su, Z.; Guo, P. A prediction model for population change using ARIMA model based on feature extraction. J. Phys. Conf. Ser. 2019, 1324, 12083. [Google Scholar] [CrossRef] [Green Version]
  52. Xiaojuan, L.; Xia, L.; Xun, L.; Hong, S.; Jinpei, O. Simulating the Change of Terrestrial Carbon Storage in China Based on the FLUS-InVEST Model. Trop. Geogr. 2019, 39, 397–409. [Google Scholar] [CrossRef]
  53. Jingyun, F.; Jianxiao, Z. Carbon Budgets of Forest Ecosystems in China; Science Press: Beijing, China, 2021; ISBN 978-7-03-070155-8. [Google Scholar]
  54. Li, T.; Li, M.; Tian, L. Dynamics of Carbon Storage and Its Drivers in Guangdong Province from 1979 to 2012. Forests 2021, 12, 1482. [Google Scholar] [CrossRef]
  55. Zhiqiang, Z.; Xiaoshuang, M.; Hong, H. Spatio-temporal Evolution and Prediction of Ecosystem Carbon Stocks in Guangzhou City by Coupling FLUS-InVEST Models. Bull. Soil Water Conserv. 2021, 41, 222–229. [Google Scholar] [CrossRef]
  56. Bultan, S.; Nabel, J.E.M.S.; Hartung, K.; Ganzenmüller, R.; Xu, L.; Saatchi, S.; Pongratz, J. Tracking 21st century anthropogenic and natural carbon fluxes through model-data integration. Nat. Commun. 2022, 13, 5516. [Google Scholar] [CrossRef] [PubMed]
  57. Kaiqi, Z.; Jianjun, C.; Jiankun, H.; Guoqing, Z.; Haotian, Y.; Xiaowen, H. Study on sustainable development of carbon storage in Guilin coupled with InVEST and GeoSOS-FLUS model. China Environ. Sci. 2022, 42, 2799–2809. [Google Scholar] [CrossRef]
  58. Fu, Q.; Xu, L.; Zheng, H.; Chen, J. Spatiotemporal Dynamics of Carbon Storage in Response to Urbanization: A Case Study in the Su-Xi-Chang Region, China. Processes 2019, 7, 836. [Google Scholar] [CrossRef]
  59. Liu, Q.; Yang, D.; Cao, L.; Anderson, B. Assessment and Prediction of Carbon Storage Based on Land Use/Land Cover Dynamics in the Tropics: A Case Study of Hainan Island, China. Land 2022, 11, 244. [Google Scholar] [CrossRef]
  60. Zhou, R.; Lin, M.; Gong, J.; Wu, Z. Spatiotemporal heterogeneity and influencing mechanism of ecosystem services in the Pearl River Delta from the perspective of LUCC. J. Geogr. Sci. 2019, 29, 831–845. [Google Scholar] [CrossRef] [Green Version]
  61. Ke, G.; Huiliang, X.; Xinlei, L.; Ming, C.; Chengzhang, Y.; Yu, Y. Risk Perception of Mountain Hazards and Assessment of Emergency Management of Western Communities in China—A Case Study of Xiaoyudong Town in Pengzhou City, Sichuan Province. Bull. Soil Water Conserv. 2018, 38, 183–188. [Google Scholar] [CrossRef]
  62. Chen, S.; Chen, B. Urban energy–water nexus: A network perspective. Appl. Energy 2016, 184, 905–914. [Google Scholar] [CrossRef]
  63. Moss, R.H.; Edmonds, J.A.; Hibbard, K.A.; Manning, M.R.; Rose, S.K.; van Vuuren, D.P.; Carter, T.R.; Emori, S.; Kainuma, M.; Kram, T.; et al. The next generation of scenarios for climate change research and assessment. Nature 2010, 463, 747–756. [Google Scholar] [CrossRef]
Figure 1. Administrative divisions in Guangdong Province, China. The blue area represents the Guangdong province in China.
Land 12 00111 g001
Figure 2. Spatial distribution of various land use types in (a) 2010, (b) 2020, and 2030 under (c) business as usual (BU), (d) ecological protection (EP), (e) farmland protection (FP), and (f) economic development (ED) scenario.
Land 12 00111 g002
Figure 3. Spatial distribution of carbon storage in (a) 2010, (b) 2020, and 2030 under (c) BU, (d) EP, (e) FP, and (f) ED scenario.
Land 12 00111 g003
Figure 4. The comparison between (a) actual and (b) stimulated LUCC in 2020.
Land 12 00111 g004
Table 1. LUCC driving factors.
CategoryFactor DefinitionData Source
Socio-economicGross Domestic Product (GDP)https://www.resdc.cn/
accessed on 9 August 2022
Populationhttps://hub.worldpop.org/
accessed on 8 December 2021
Distance to administrative centerhttp://www.ngcc.cn/ngcc
accessed on 7 August 2022
Distance to highway
Distance to railway
Climate-environmentElevationhttp://www.gscloud.cn
accessed on 9 August 2022
Slope
Precipitationhttp://www.geodata.cn/
accessed on 8 December 2021
Temperature
Soil typehttps://www.resdc.cn/
accessed on 9 August 2022
Distance to riverhttp://www.ngcc.cn/ngcc/
accessed on 7 August 2022
Table 2. Land use area in 2010, 2020, and 2030 under multi-scenario (Business as Usual, Economic Development, Ecological Protection, and Farmland Protection, unit: 104 ha).
Year/ScenarioFarmlandForestGrasslandWaterBuilt-UpUnused
Previous period2010429.921078.5673.6277.73115.381.28
2020409.831079.1276.4377.88133.981.05
Future scenario in 2030Business as Usual405.031078.4676.8477.88139.081.01
Ecological Protection396.971084.5075.9379.57140.400.94
Farmland Protection410.641079.4975.5977.62134.000.96
Economic Development370.011064.8176.3771.09195.230.80
Table 3. Carbon storage amount in 2010, 2020 and 2030 in future scenarios (Business as Usual, Economic Development, Ecological Protection, and Farmland Protection).
Year/ScenarioCarbon Storage/Tg
Previous period20101619.21
20201606.60
Future scenario in 2030Business as Usual1602.41
Ecological Protection1601.92
Farmland Protection1606.51
Economic Development1558.98
Table 4. Predicted population by different machine learning methods.
YearHolt’s MethodDamped Holt’s MethodARIMA Model
20209783.091
203010,721.533 *10,089.474 **10,643.284 *
Note: * p < 0.05; ** p < 0.01.
Table 5. Carbon density in different carbon pool on diverse LUCC and their references.
LUCCCabove
(Mg/ha)
Cbelow
(Mg/ha)
Csoil
(Mg/ha)
Cdead
(Mg/ha)
Reference
Farmland27.89247.521[52,53]
Forest48.188.349.246.5[52,53,54]
Grass38.245.250.451.9[52,53,55]
Water0000-
Built-up land0000-
Unused land30.232040.755[52,55]
Table 6. Carbon storage in previous studies.
Author(s)Study RegionYearCarbon Density (Mg/ha)
This studyGuangdong Province201090.09
202089.39
Kaiqi, Z. et al. [57]Guilin City2010199.13
2020197.92
Qi, F. et al. [58]Su-Xi-Chang Region201048.44
Qing, L. et al. [59]Hainan Province2010127.37
Rubo, Z. et al. [60]Pearl River Delta2000115.00
2015115.48
Zhiqiang, Z. et al. [61]Guangzhou City201050.54
Disclaimer/Publisher’s Note: The statements, opinions and data contained in all publications are solely those of the individual author(s) and contributor(s) and not of MDPI and/or the editor(s). MDPI and/or the editor(s) disclaim responsibility for any injury to people or property resulting from any ideas, methods, instructions or products referred to in the content.

