Abstract
Based on the concept of high-quality development, this paper constructs an urban ecological welfare evaluation framework, measures the urban ecological welfare performance in Jiangsu Province from 2005 to 2019 using a stochastic frontier production function model, and conducts a spatial and temporal divergence feature analysis, combining a spatial panel econometric model and a threshold panel regression model to explore the spatial effects and mechanisms of urban ecological welfare performance. The results show that: (1) The urban ecological welfare performance in Jiangsu province has been increasing every year, and the spatial divergence between north and south is significant, with the overall trend of southern Jiangsu > central Jiangsu > northern Jiangsu. (2) The differences in urban ecological welfare performance among the three regions are gradually decreasing, with the high values expanding and the low values decreasing, and the urban ecological welfare performance in northern Jiangsu Province is gradually approaching that in southern Jiangsu Province, and the urban ecological welfare performance level tends to be balanced. (3) There are significant negative spillover effects of industrial structure, city scale, and economic development level on urban ecological welfare performance, as well as significant threshold effects of innovation level, industrial structure, foreign trade dependence, and economic development, and significant differences in the degree of influence of urbanization on urban ecological welfare performance under different threshold variables. (4) The urbanization and economic development levels are the fundamental factors driving urban ecological welfare performance improvement. Industrial structure optimization, city scale, technological innovation, and foreign trade dependence positively contribute to urban welfare performance, and government financial pressure constrains the performance level improvement. In the future, a long-term mechanism for high-quality green development should be constructed, spatial spillover channels should be continuously improved, welfare thresholds should be effectively circumvented, and urban ecological welfare performance should be promoted in a concerted manner.
1. Introduction
Neoclassical economics usually assumes that natural resources exist as a neutral and infinite supply, that unrestricted economic growth can sustainably bring human welfare, and that the development of human society is sustainable as long as the increase in human-made capital is greater than the decrease in natural capital [1,2]. However, with the steady progress of ecological civilization construction and the “Two Mountain Theory”, this view has been questioned and criticized by the academic community. Sustainable economics considers economic systems as subsystems of ecosystems, and economic growth plays a mediating effect in the process of human welfare enhancement, while ecosystems are the material basis and guarantee of a good human life [3,4]. As Herman E. Daly, a leading theorist of sustainable development economics, has expressed, human society has transitioned from an “empty world” of relatively abundant natural capital to a “full world” of increasingly tight ecological constraints [5]. Scarcity of natural capital has become a major constraint to human development in a “full world”, and the high entropy of waste generated by human activities has not fully transformed human-made capital into human welfare [6]. The concept of “high-quality development” was first introduced at the 19th National Congress, and since then, high-quality development has become a basic requirement for China to enter a new stage of development, to deeply implement the new development concept, and accelerate the construction of a new development pattern. How to balance the effective integration of the three systems of economic development, social life, and ecological environment, while coming out of a high-quality green development path in harmony with people and land is an issue of the times common to human society.
Sustainability economics uses ecological welfare performance to measure the extent to which a region is sustainable and its potential for sustainable development [7]. The goal is to maximize welfare with minimal ecological consumption, and to be able to truly reflect the relationship between the local ecological environment and people’s well-being [8]. China’s social economy has entered a “high quality” development stage with the transformation of old and new dynamics, and the development mode has shifted from “high speed” to “efficiency and quality” improvement [9]. Eco-welfare performance takes comprehensive human development as the fundamental goal of ecological inputs, avoiding pure GDPism and being more in line with the overall requirements of high-quality development [10]. Based on the steady-state economic theory, ecological welfare performance was initially defined as the ratio of services to fluxes, mostly characterized by the ratio of the amount of social welfare value to the physical amount of ecological resources consumed [11]. Subsequently, concepts such as the Human Development Index (HDI) and the ecological footprint were introduced to enrich the meaning of ecological welfare performance [12,13]. Research related to eco-welfare performance began late in China and has received much attention with the construction of the ecological civilization. It mainly focuses on two major aspects: (1) Measurement and evaluation. The first is from the perspective of the scaling algorithm, where the indicator measuring the level of social welfare is used as the numerator and the indicator measuring ecological consumption is used as the denominator. Zang et al. used the ratio of life expectancy to ecological footprint per capita to quantify the level of ecological welfare performance [10]. Feng et al. argue that the welfare level should be measured as a composite representation of health, economic, and educational aspects, using the ratio of HDI to ecological footprint per capita metric [14]. Fu et al. placed the sustainable use of resources in a complex system of “nature-economy-society” and proposed the Resource Welfare Index (RWI) [15]. Secondly, from the perspective of the “input-output” framework, including the stochastic frontier production function model (SFA) or the data envelopment analysis (DEA), two types of methods, the method is more comprehensive and objective, and the evaluation results are more realistic and credible. To distinguish the concept of “efficiency” in neoclassical economics, Zhu et al. define ecological welfare performance as the ability of humans to transform natural consumption into a level of welfare [16], which provides a reference for other scholars [10,17]. (2) Influencing factors, convergence, and spatial effects, etc. Li et al. used SBM models and spatial error models to test the factors influencing inter-provincial ecological welfare performance in China [18]. Du et al. found a convergence effect on ecological welfare performance in the central and western regions of China [19]. Fang et al. found strong spatial correlations and path dependence in ecological welfare performance in China [20]. Xiao et al. used the SFA model and dynamic spatial Durbin model to explore the convergence of ecological welfare performance in the Yellow River basin [21]. Some scholars have also explored the factors influencing ecological welfare performance using LMDI decomposition, cross-sectional regression models, and panel Tobit models (14, 16–17). Some scholars have also explored the factors influencing ecological welfare performance using LMDI decomposition, cross-sectional regression models, and panel Tobit models, but the conclusions obtained vary widely. The scale of the study was expanded from the national level [16] to different levels such as regional [22,23], inter-provincial [24], and city levels [25].
In summary, there have been many studies on ecological welfare performance, but the following points need to be explored in depth. (1) The construction of the index system is the key to ecological welfare measurement, and a scientific and reasonable index system is the core of ecological welfare quantification. With the proposal of high-quality development, the construction of the index system takes the concept of high-quality development and realistic needs less into account. (2) Little research has been conducted on the spatio-temporal dynamic evolutionary pathways, evolutionary laws, and driving mechanisms of ecological welfare performance. (3) The mainstream measurement method, the DEA model, does not take into account the influence of random factors, which makes the obtained results biased, while the SFA model can overcome this shortcoming. Jiangsu Province is located in the core of China’s Yangtze River Delta and is one of the important provinces supporting and leading China’s economic development. The rapid urbanization in the past has brought many real problems such as habitat destruction, urban–rural dichotomy, and regional differences, etc. How to accomplish the synergy and progress of urban economic, social, and ecological systems is an urgent question to be considered in the process of regional integrated and high-quality development. In view of this, based on the concept of high-quality development, this paper adopts the SFA model to measure urban ecological welfare performance from 2005 to 2019 based on the concept of high-quality development in Jiangsu Province, China, and analyzes its evolutionary characteristics and driving mechanisms by combining the spatial panel econometric model and the threshold panel regression model, aiming to provide policy implications for ecological protection and high-quality development in Jiangsu Province, China.
2. Study Area and Data Sources
2.1. Study Area
Jiangsu Province was selected as the research area and is shown in detail in Figure 1. Jiangsu Province is an important economic growth pole in China’s eastern coastal region, located in the eastern part of China’s land area, downstream of the Yangtze River and Huai River, adjacent to the Yellow Sea, bordering Shandong Province and Anhui Province, and adjacent to Zhejiang Province and Shanghai, with superior location conditions. Jiangsu Province’s industrial structure adjustment accelerated, and as of 2020, the annual gross regional product exceeded 10 trillion yuan, the value-added ratio of the three industries was adjusted to 4.4:43.1:52.5, the development of high-tech industries was significantly enhanced, the year-end urban registered unemployment rate remained low at 3.2%, and the GDP per capita and livelihood index were at the forefront of the provinces.
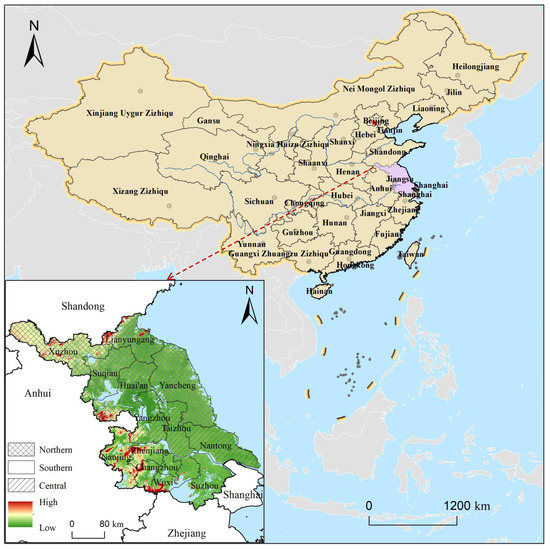
Figure 1.
Map of Jiangsu province location.
Jiangsu Province has 13 prefecture-level cities, divided into three regions: Southern Jiangsu, Central Jiangsu, and Northern Jiangsu. The southern region includes five prefecture-level cities, including Nanjing, Suzhou, Wuxi, Changzhou, and Zhenjiang; the northern region includes five prefecture-level cities, including Xuzhou, Lianyungang, Suqian, Huaian, and Yancheng. The central region includes three prefecture-level cities, including Yangzhou, Taizhou, and Nantong. The regional economy is high in the south and low in the north, and the unbalanced development trend is noticeable. Southern Jiangsu is socio-economically developed, but industrial integration and ecological environment face challenges. The socio-economic development of central Jiangsu is between southern Jiangsu and northern Jiangsu, and the industrial structure is similar, producing the phenomenon of homogeneous competition and homogeneous development, with a low efficiency of spatial resource utilization. The socio-economic development of northern Jiangsu falls relatively behind, and the problems of non-agriculturalization of arable land and ecological risks raise concerns. Along with the rapid economic development, the land use structure has undergone a large transformation, and the human–land system is facing many problems such as tightening resource constraints, local degradation of the ecosystem, and imperfect linkage mechanisms in the three regions.
As a resource-constrained province as well as a pilot reform and opening-up zone, Jiangsu Province is important for driving the development of the coastal and Yangtze River economic belts and contributing to the integrated development of the Yangtze River Delta, but with 1.12% of the country’s land resources carrying 10.10% of GDP and 5.80% of the population, the high population density and insufficient amount of resources in the region highlight the regional differences and the urgent need to optimize the relationship between economic and ecological development. There is an urgent need to optimize the relationship between economic development and ecological resources consumption. Therefore, Jiangsu Province is selected as a case study to reveal ways to achieve the sustainable improvement of human welfare and quality of life under the premise of natural capital constraints, which is representative for guiding regional high-quality development.
2.2. Theoretical Framework and Indicator Construction
High-quality development is not only consistent with the view of sustainable development, but also a perfect interpretation of the “two mountains theory”, the core meaning of which is to achieve the synergistic development of economic, social, and ecological benefits. This thesis uses cities as a vehicle to construct a theoretical framework for high-quality ecological welfare performance by combining the concept of high-quality development and welfare performance evaluation. As shown in Figure 2, with the input–output framework [26], this paper is oriented to “ecological priority and green development”, based on the five major concepts of coordination, innovation, green, sharing, and openness of the theory of high-quality development, with the goal of improving people’s well-being and regional sustainable development and upholding the principle of obtaining the maximum level of urban welfare with less ecological input and resource consumption, and finally to achieve the synergistic development of the three systems of economy, environment, and society.
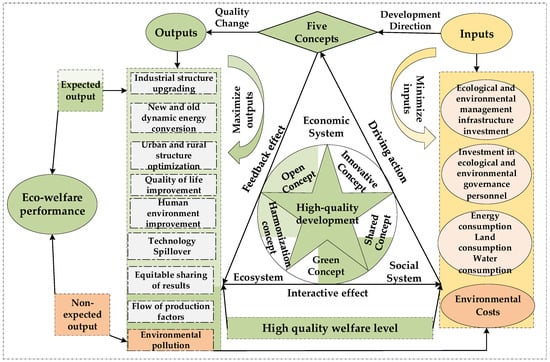
Figure 2.
Theoretical framework of urban eco-welfare performance.
According to the theoretical framework in Figure 2, following the principles of objectivity, namely the representativeness and operability of the indicator selection, the input–output evaluation index system of urban ecological welfare performance is constructed (Table 1). The input indicators were selected based on the following: referring to the ideas of other scholars [27], input indicators consider the basic factors of production in economics (i.e., resources, capital, and labor). Combined with the concept of high-quality development, the ecological welfare level is more concerned about the synergistic promotion of ecological protection and economic growth through ecological governance investment, committed to the harmonious coexistence of human and nature, and attaches importance to the maintenance of ecological level. Therefore, input indicators cannot be limited to negative indicators such as resource consumption and environmental costs, but also need to introduce positive indicators of ecological capital to emphasize ecological governance. Referring to relevant studies [21], this paper uses two indicators of ecological governance infrastructure and ecological governance personnel to characterize ecological governance, and three indicators from land resource consumption, energy consumption, and water consumption to characterize resource consumption.
Output indicators include expected output and non-expected output. In this study, the expected output is set as the level of high-quality welfare. Referring to Zhang’s criteria for perceiving a complex and multidimensional high-quality system [28], this paper measures the level of high-quality welfare in five dimensions: coordination, innovation, green, sharing, and openness. The specific logic is described as follows: innovation, as the primary technological driver of development, is the endogenous driving force that catalyzes economic development and breaks the traditional inefficient solidification, drawing on the concept of innovation from previous studies [29], of which the main indicators selected are scientific and technological output, capital productivity, and labor productivity. Coordinated development mainly addresses the problem of unbalanced development, focusing on industrial structure and demand structure, and industrial structure draws on Cui et al. [30] to select indicators such as rationalization and advanced industrial structure. Demand structure is the synergy between urban and rural spaces in terms of consumption, income, and employment, drawing on Liu et al. [31] to select indicators such as urbanization income gap, consumption contribution rate, and registered unemployment rate of urban residents. Green development attaches great importance to ecological improvement and pollution control, and draws on the research of Xu et al. to select four indicators for comprehensive expression [27]. Open development is mainly a measure of the degree of opening up of the regional economy to the outside world, which is mainly measured in terms of foreign trade dependency and the output value of foreign-invested enterprises, drawing on the experience of studies such as Guo et al. [32]. Shared development emphasizes people-oriented and fair sharing, whereby income distribution justice, basic public service levels, and quality of life are included in the factor layer, and six indicators are selected for comprehensive expression with reference to the sharing concept of Liu et al. [31]. The five major dimensional indicators are based on the comprehensive evaluation model [32] to obtain the comprehensive index of high-quality development of each city as the expected output. The non-expected output is expressed as the emission of environmental pollution, which has been studied mainly in three dimensions: solid waste emission, wastewater emission, and exhaust gas emission, while PM2.5 has been shown to be more related to industrial eco-efficiency [33], so this study adds PM2.5 to characterize air quality, with a total of four non-expected output indicators. With reference to the relevant literature [34] and model applicability, non-desired outputs such as PM2.5, industrial wastewater, SO2, and soot (dust) emissions are integrated as a composite index of industrial pollution as an environmental cost to measure the negative externalities of the input process. The indicator selection process in this study downplayed the total indicators and focused on comprehensive performance evaluation. To avoid the problem of multiple cointegration, the cointegration test was conducted with the help of the inflation factor analysis and the Pearson correlation coefficient test, and all the indicators passed the test, indicating that the selection of indicators was reasonable. In total, there are 11 input indicators and 22 output indicators (Table 1).

Table 1.
Comprehensive evaluation system of urban ecological welfare performance.
2.3. Data Source and Processing
According to the availability of data of administrative units in the study period, the original values involved in the evaluation indices of this study are mainly obtained from the Jiangsu Provincial Statistical Yearbook, the China Urban Statistical Yearbook, the China Statistical Yearbook, as well as the statistical yearbooks of prefecture-level cities in Jiangsu Province and the statistical bulletin of national economic and social development (2006–2020). The study period was selected from the most rapid land use change in Jiangsu Province to 2019, and the spatial granularity was 13 municipalities in Jiangsu Province. The administrative zoning map was obtained from the “Yangtze River Delta Science Data Center, National Earth System Science Data Sharing Infrastructure, National Science & Technology Infrastructure of China(http://nnu.geodata.cn/) (accessed on 18 September 2022)”. It is worth noting that in order to ensure the consistency of the time series spanning 15 years, the economic data of different years are processed at constant prices with 2005 as the base period; in addition, when the statistical caliber of some data is not uniform, the study takes the data released by the statistical institutions at a higher level as the basis.
3. Methodology
3.1. Stochastic Frontier Production Function Model
The stochastic frontier model (SFA) is one of the more commonly used methods to evaluate technical efficiency [36,37]. Economic high quality development in the actual production process may be constrained by two major factors, namely stochastic perturbations and technical inefficiencies, referring to the setting of the model by Battese et al. [38], a high-quality welfare performance function model based on the Cobb–Douglas function form:
where denotes the level of high-quality welfare; is the constant term; is the coefficient of the input variable; denotes the input variable; t is the study time and i denotes the sample size (I = 1, 2, …, 13); is the random error term; is the variance; is the average value; denotes the technical inefficiency term obeying the average value and variance.
where is the constant term; is the parameter of interest; indicates the influence factor; and is the random error term.
Using the maximum likelihood method to estimate Formulas (1) and (2), the high-quality welfare performance of prefecture i city in year t is:
3.2. Spatial Autocorrelation Analysis
Spatial autocorrelation refers to the potential interdependence between observations of some variables within the same distribution. Spatial autocorrelation analysis reflects the degree of association between the value of an attribute on one regional unit and the value of the same attribute on neighboring regional units. This study reflects the degree of spatial correlation of spatial neighboring unit attribute values altogether, based on the full domain Moran’s index I (Moran’s I), which has a value domain of [−1, 1] [39], and according to which the closer the value is to 1, the stronger the spatial autocorrelation, indicating that the attributes of neighboring regions tend to cluster. The spatial weights were selected as first-order Rook adjacency matrix, and the results were tested by Z. The Moran index was significant if |Z| > 1.96, i.e., the p-value was less than 0.05. Where, when Moran’s I > 0, it indicates positive spatial correlation, and the larger its value, the more obvious spatial correlation. When Moran’s I < 0, it indicates negative spatial correlation, and the smaller its value, the greater the spatial difference; otherwise, when Moran’s I = 0, the space is random. The Global Moran’s I Index formula is:
where: I is the Global Moran’s I index; xi and xj are the observed values of the i-th urban ecological welfare performance evaluation unit and the j-th urban ecological welfare performance evaluation unit, respectively; Wij is the spatial weight matrix between unit i and unit j which is the mean of the observed values; n is the sample size, i.e., the total number of urban ecological welfare performance evaluation units in the study area.
3.3. Spatial Panel Econometric Model
Spatial panel econometric models include three main forms: spatial lag model (SLM), spatial error model (SEM), and spatial Durbin model (SDM), which are applicable to different spatio-temporal interaction effect patterns [40]. The spatial panel Durbin model is a combined extension of SLM and SEM [41], and its expression is shown as follows:
where: denotes time; denotes the spatial element; denotes the spatial autocorrelation coefficient of the error term; is the explained variable; is the influence factor; is the influence factor coefficient; is the spatial fixed effect; is the time fixed effect; is the spatial matrix; denotes the coefficient of the spatially lagged explanatory variable; is the random error term that obeys independent identical distribution.
3.4. Panel Threshold Model
The “threshold effect” refers to the phenomenon of a parameter reaching a specific value, consequently causing a sharp change in another parameter, transforming it into other forms of development. In this study, the Hansen panel threshold regression model was used to determine the threshold value using the residual sum of the squares minimization and significance test. In order to determine the threshold estimates and the confidence interval of the true value, the threshold variable statistics need to be constructed to test, and if the null hypothesis cannot be rejected, indicating the existence of at least one threshold, the second and third thresholds are searched for by analogy until the original hypothesis cannot be rejected, based on which the final threshold number is determined. This study constructs a segmentation function with urbanization as the threshold variable to verify the non-linear relationship between the effect of urbanization on high-quality welfare performance, and the specific formula can be found in the literature [42].
4. Research Results
4.1. Time-Series Evolutionary Characteristics of Urban Ecological Welfare Performance
A stochastic frontier model (SFA) was used to measure the urban ecological welfare performance values in Jiangsu Province from 2005 to 2019. The kernel density functions of urban ecological welfare performance for four-time cross-sections, 2005, 2010, 2015, and 2019, were selected (Figure 3a). The wave form shows a significant “single-peak” distribution, with the overall process of flattening to steepening, showing an inverted “U”-shaped change, characteristic of “rising then falling”, and the ecological welfare performance curve along with the main peak gradually advance to the right, indicating that the ecological welfare performance of each city continues to improve. The peak height of the wave is generally on the rise, and the left side of the distribution curve indents to the right while the double-tailed extension continues to narrow, indicating that the high-value area and low-value area fluctuate more, from the balanced distribution in 2005 to the convergence of high values in 2019, indicating that the non-homogeneity between regions has slowed down, and the ecological welfare performance of the cities has improved more significantly.
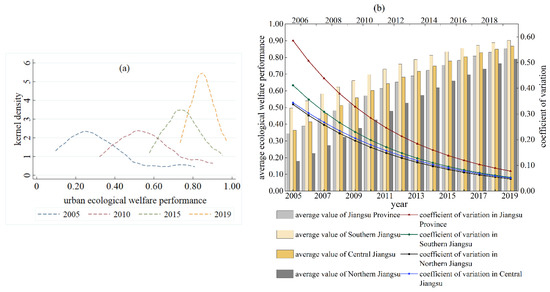
Figure 3.
(a) shows the kernel density of urban eco-welfare performance in Jiangsu Province, 2005–2019, and (b) shows the trend of urban eco-welfare performance in Jiangsu Province, 2005–2019.
The overall view (Figure 3b) of urban ecological welfare performance in Jiangsu Province has been increasing yearly, from 0.344 in 2005 to 0.852 in 2019, with an average annual growth rate of 6.76%. With the tightening of resource constraints and the localized degradation of ecosystems, the government pays more attention to the concept of green development and increases the investment in ecological and environmental management while attaching importance to economic growth, while the economic development has led to the increase in residents’ income and the gradual improvement of the social security system, medical level, and education level, which makes the urban ecological welfare performance in Jiangsu province increasingly better. The coefficient of variation of urban ecological welfare performance decreases from 0.586 in 2005 to 0.078 in 2019, indicating that the differences between cities gradually decrease and urban ecological welfare performance tends to develop in a balanced manner. In terms of sub-regions, the urban ecological welfare performance in southern Jiangsu, central Jiangsu, and northern Jiangsu all showed a steady upward trend, with performance averages of 0.737, 0.656, and 0.510, respectively, with more obvious differences in the gradients of the three major regions. Southern Jiangsu tops the list with an absolute advantage, from 0.497 in 2005 to 0.903 in 2019, with an average annual growth rate of 4.36%. This is likely due to the superior location of southern Jiangsu, its proximity to Shanghai and significant radiation by it, and the higher industrial agglomeration effect with the advantage of green innovation and technology to reduce the negative ecological effects of high energy consumption of economic growth, coupled with a more complete medical and education system, which ensures the regional urban ecological welfare performance is at the leading level. Central Jiangsu is the second highest, rising from 0.365 in 2005 to 0.868 in 2019, with an average annual growth rate of 6.38%, the closest to the overall level of Jiangsu Province. The lowest is northern Jiangsu, rising from 0.180 in 2005 to 0.791 in 2019, with an average annual growth rate of up to 11.15%, the overall level is not high, and there is room for an improvement of nearly 20% in the future. This may be related to the fact that the northern Jiangsu region is located in the “Yangtze River Delta” peripheral area, which implies a weaker radiation from the economic center, and the lack of scale effects of resource development, weak industrial base, and insufficient endogenous power for industrial transformation. The coefficient of variation of urban ecological welfare performance in the three major regions has decreased yearly. In the past 15 years, southern Jiangsu has dropped from 0.412 to 0.053, central Jiangsu has dropped from 0.345 to 0.051, and northern Jiangsu has dropped from 0.337 to 0.047, with roughly the same decrease rate. This shows that the differences in urban ecological welfare performance in all three regions are gradually narrowing and tend to develop in a synergistic manner.
4.2. Spatial Pattern Evolution of Urban Ecological Welfare Performance
The urban ecological welfare performance values for four-time cross-sections, namely 2005, 2010, 2015, and 2019, were selected for visualization, and the performance values were graded according to 0~0.2, 0.2~0.4, 0.4~0.6, 0.6~0.8, and 0.8~1.0, and defined as low welfare zone, relatively low welfare zone, moderate welfare zone, relatively high welfare zone, and high welfare zone, respectively (Figure 4).
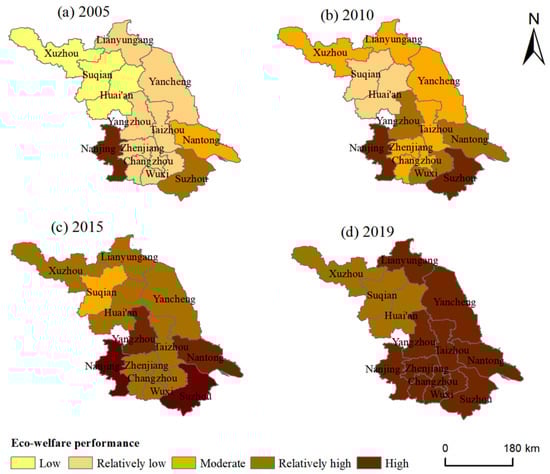
Figure 4.
Spatial patterns of urban ecological welfare performance in Jiangsu province.
The spatial divergence of the urban ecological welfare performance in Jiangsu Province from 2005 to 2019 is obvious, generally following the pattern of gradual decrease from south to north. Each city showed an improvement trend of different magnitudes, and the overall spatial pattern was in the order of Southern Jiangsu > Central Jiangsu > Northern Jiangsu. Specifically, the cities were dominated by low and relatively low welfare in 2005, accounting for 76.92% of the total, with moderate and relatively high welfare areas in Nanjing, Suzhou, and Nantong. Among them, Nantong is the only city in central Jiangsu with a high urban ecological welfare performance, mainly due to its proximity to Shanghai and Suzhou, and it is easily affected by the trickle-down effect of its economic development, exhibiting better living standards. In 2010, the spatial patterns of cities in Jiangsu province are distributed in moderate and relatively high welfare spreading groups, and all low welfare levels move to higher levels. Compared to 2005, the low levels move to the higher levels of the adjacent levels, and only Xuzhou, Yangzhou, and Wuxi move across levels. In 2015, the urban ecological welfare performance of Jiangsu Province spreads in an inclined “M” shape with a relatively high welfare zone extending to most of Jiangsu Province, with only Suqian in a moderate welfare zone. In 2019, the high welfare zone was further expanded to the entire southern Jiangsu region, the central Jiangsu region, as well as Lianyungang and Yancheng in northern Jiangsu. With the higher level of welfare gradually narrowing and the stepwise divergence between the high south and low north becoming more pronounced, it is worth mentioning that Nanjing has been in a high welfare level that has remained unchanged from 2005 to 2019, mainly because Nanjing, as the capital city of Jiangsu Province, focuses on the integrated allocation of resources, a high degree of intensive land use, and the industrial introduction threshold, while also focusing on clean production. Therefore, it is situated in the high welfare zone.
From the perspective of growth rate, the urban ecological welfare performance in Jiangsu Province varies widely, with the average annual growth rate in northern Jiangsu being much faster than that in southern Jiangsu. Among the cities in northern Jiangsu, Xuzhou (11.57%), Huai’an (13.19%), Taizhou (10.50%), and Suqian (15.57%) have an average annual growth rate of more than 10%. These cities lack transportation advantages and industrialization has been slow, but with the promotion of urbanization and the implementation of integrated regional development strategies, these areas have developed rapidly, resulting in the improvement of people’s living standards and social security systems, a higher level of quality development, and a consequent increase in ecological welfare performance. However, among the cities in southern Jiangsu, Nanjing (1.31%), Suzhou (2.50%), Wuxi (6.36%), and Nantong (4.34%) have a better foundation for economic development and are already ahead of other cities in Jiangsu Province in terms of high-quality welfare levels in the base period, so even though the eco-welfare performance remained at a high level in the later period and increased compared to the earlier period, the overall increase was low compared to the ecological welfare performance in northern Jiangsu province. The reason for which the urban ecological welfare performance of southern Jiangsu has been leading is more related to the more successful regional development strategy of the region. First of all, in terms of natural conditions, southern Jiangsu is not only a vast plain, but also backed by the Yangtze River facing Taihu Lake. Rich in water resources, the Yangtze River runs across the east and west, based on the traditional shipping, and internal links can also be connected by ship, from the Ming and Qing dynasties to the present. Southern Jiangsu has always been an important distribution center for trade in goods, saving a large part of the infrastructure costs in the accumulation phase of the economy. Secondly, the proximity of Southern Jiangsu to Shanghai, to which the title of Shanghai’s backyard is owed, has amplified the extent of the linkage with Shanghai. Shanghai has the most advanced technology accumulation in China and is the frontier in terms of opening-up to the outside world, but land resources in Shanghai are scarce, while the GDP growth rate of southern Jiangsu is very fast due to its flat terrain and cheap land. Combined with Shanghai’s advanced management experience and sufficient capital, the three cities of Suzhou, Wuxi, and Changzhou, in particular, are leading the way. This was especially the case in 2001, after the WTO accession economic growth rate had exceeded 20%, and township enterprises began mushrooming while the world-famous Huaxi Village was born. Finally, the open policy in southern Jiangsu is also a major factor in helping to improve its eco-welfare performance. Jiangsu has opened-up many foreign trade parks in southern Jiangsu dedicated to attracting foreign investment, which not only promotes fast overall approval, but also has counterpart support policies, giving full play to its own geographical advantages.
4.3. Evolutionary Mechanisms of Urban Ecological Welfare Performance
4.3.1. Analysis of Spatial Spillover Effects
Spatial Correlation Analysis
The Moran’s I value of urban ecological welfare performance was measured using OpenGeoDa software (Figure 5). The Moran’s I value increased from 0.2141 in 2005 to 0.3389 in 2019, with an overall annual increase, and |Z| > 1.96, i.e., the p-value is less than 0.05, indicating that the Moran’s I value passed the 5% significance level test. This shows that its distribution corresponds to a spatial agglomeration pattern, and the existence of spatial effects cannot be ignored.
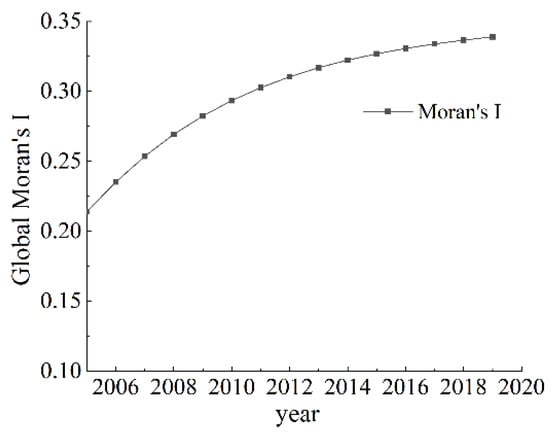
Figure 5.
The Moran’s I value of urban ecological welfare performance in 2005–2019.
Selection of Influence Variables
The previous section has demonstrated that urban ecological welfare performance is spatially correlated, which requires further in-depth study using a spatial panel econometric model. Drawing on previous relevant studies [43,44,45], using urban ecological welfare performance as the explanatory variable (Y), the following influencing factors were selected (Table 2): ① Level of economic development (X1). Economic development is an important driving force for the improvement of high-quality welfare levels; the better the economic level of the region, the better the urban basic service facilities and social security system, the higher the welfare level of the residents, using GDP per capita to characterize the level of economic development. ② Urbanization level (X2). Urbanization development brings great changes to urban spatial structure and residents’ lifestyles, etc., which directly affects the residents’ high-quality welfare levels, and the urbanization rate is used to reflect the urbanization level. ③ Industrial structure (X3). This plays a decisive role in the effectiveness of resource allocation and production efficiency and is characterized by the ratio of the three industries to the two industries. ④ City size (X4). City size reflects the distribution of urban population and defines whether its size is large enough to lead to spatial congestion, while a smaller size may result in the inefficient spatial allocation of resource factors. City size is characterized by population density. ⑤ Technological innovation (X5). This is a driving force for social development and progress, and it plays a positive role in aspects such as green production efficiency and ecological governance in cities, which may be responded to by the number of patents granted. ⑥ Fiscal pressure (X6). This reflects the government’s financial commitment to perform services for urban development and may be characterized by the ratio of fiscal expenditure to general budget revenue. ⑦ Degree of openness to the outside world (X7). The technology spillover effect of the degree of openness to the outside world can stimulate the transformation of local economic development, but also increase local resource consumption and environmental pollution. The degree of openness to the outside world can be characterized by the actual use of foreign capital.
Table 2.
Index selection of factors influencing urban ecological welfare performance.
Model Testing and Identification
First, the screening of SEM models and SLM models needs to be carried out by LM test and Robust LM test before selecting the models, and the test results are shown in Table 3. The results found that LM-lag, Robust LM-lag, and Robust LM-error passed the significance test, indicating that both spatial lag and spatial error terms exist in the spatial dependence of urban ecological welfare performance. Second, Walds and LR tests are used to determine whether SPDM can be degraded to SEM and SLM. As shown in Table 3, the results of the Walds test and LR tests of urban ecological welfare performance pass the significance test and the original hypothesis is rejected. That is, the SPDM model of urban ecological welfare performance in Jiangsu province cannot be degraded to SLM or SEM. Finally, the Hausman test was used to determine the choice of random effects or fixed effects in the SPDM model, and the results show that the Hausman test results passed the significance test, so it was determined that the SPDM model chose fixed effects.
Table 3.
Test results of the spatial panel econometric model.
Analysis of Spillover Effects
Regressions were conducted with three models, including individual fixed effects, time fixed effects, and double fixed effects, and significance tests were performed (Table 4). Based on the magnitude of the log-likelihood and dispersion (sigma2) of the three models, it can be seen that the double fixed effects fit is significantly better than the individual fixed effects and time fixed effects; therefore, the double fixed effects spatial panel Durbin model (SPDM) is chosen for the analysis. From the results, the significance of industrial structure, city size, government pressure, degree of openness to the outside world, urbanization, and economic development level passed the test and their elasticity coefficients were 0.2124, 0.799, −0.0815, 0.1398, 1.8948, and 0.236, respectively. This shows that industrial structure, city size, openness to the outside world, urbanization, and economic development have a significant positive contribution to urban welfare performance, while government fiscal pressure constrains the improvement of urban welfare performance. Innovation technology did not pass the significance test. The first possible reason is due to the fact that innovation R&D needs time to accumulate before it is systematized, and the second reason may be due to the fact that local protectionism may prevent the flow of innovation factors across regions, fundamentally weakening the spillover effects of technological progress. Therefore, the contribution of innovative technologies to urban ecological welfare performance is not significant. The spatial lag term elasticity coefficients of government financial pressure, innovation and technology, and economic development are all negative, indicating that changes in economic development, technological innovation, and government financial pressure in neighboring cities have negative effects on local welfare enhancement. The effects of economic development and government financial pressure, in particular, are more significant, suggesting that economic development and government regulation in neighboring cities are not conducive to local ecological welfare performance enhancement, which may be due to the competition effect among regional cities and the negative externalities of ecological welfare.
Table 4.
Estimation results of the SPDM model.
To accurately reflect the marginal effects of the estimated parameters of the model, partial differential equations were used to calculate the direct effects, spillover effects, and total effects of the independent variables (Table 5). ① Direct effects. The direct effects of industrial structure, city size, government fiscal pressure, openness to the outside world, innovation level, urbanization, and economic development are 0.1187, 0.6552, −0.0624, 0.1334, 0.0266, 1.7584, and 0.4130, respectively. Among them, the city size, government financial pressure, openness to the outside world, urbanization, and economic development levels are the key factors affecting urban ecological welfare performance. Each 1% increase in city size, openness to the outside world, urbanization, and economic development promotes a 0.655%, 0.133%, 1.758%, and 0.413% increase in local urban ecological welfare performance, respectively. The reason may be due to the transformation of regional urban development factors after the 21st century, the massive influx of rural labor into cities, the expansion of urban scale, and the promotion of urban secondary and tertiary industries, as well as the expansion of production scale, the alleviation of local employment pressure, and the promotion of economic growth, which have a driving effect on the improvement of ecological welfare performance. Each 1% decrease in government financial pressure inhibits the local urban ecological welfare performance by 0.062%, likely due to the fact that the increase in financial pressure forces local governments to seek new ideas for economic development, leading to a gradual increase in the proportion of secondary production and increased industrial pollution, which inhibits the improvement of green economic efficiency, and because environmental management is a long-term process that requires financial support from local governments. ② Spillover effects. The spillover effects of industrial structure, city size, government fiscal pressure, openness to the outside world, innovation level, industrialization, urbanization, and economic development are −1.4474, −1.412, −0.3476, 0.1029, 0.0967, 0.922, and −2.7931, respectively. The degree of external openness, innovation levels, and urbanization have a synergistic effect on the urban ecological welfare performance of neighboring regions, with each 1% change in the urban ecological welfare performance of neighboring regions resulting in an increase of 0.1029%, 0.0967%, and 0.922%, respectively. However, industrial structure, city size, government financial pressure, and economic development have inhibitory effects on the urban ecological welfare performance of neighboring areas. Each 1% increase in urban ecological welfare performance of adjacent areas results in a decrease of 1.4474%, 1.412%, 0.3476%, and 2.793%, respectively. Among them, industrial structure, city size, and economic development levels are the key factors affecting the urban ecological welfare performance of adjacent areas. Although the transfer of manufacturing industries and large amounts of foreign investment from developed countries has led to employment and economic growth, it has also increased resource consumption and environmental pollution in local and neighboring areas, which has become an obstacle to the high-quality urban development. The research and development of new technologies and materials may benefit the neighboring regions’ “free riding”. While improving local welfare, it plays an exemplary and driving role in the neighboring regions, leading to improved ecological welfare performance in the neighboring regions through knowledge spillover. ③ Total effect. The total effect evaluates the promotion of improvement of local high-quality welfare levels by affecting the ecological welfare performance of neighboring regions. It can be seen that the external spillover coefficients of the influencing factors on urban welfare performance are almost identical to the positive and negative effects of the obtained feedback coefficients, indicating that the spillover effect of urban welfare performance in Jiangsu province is similar to its feedback effect. With the implementation of the regional integration policy, the resource sharing and linkage development among cities promotes the gradual strengthening of the radiating and leading role among the cities within the region. On the basis of promoting the development of regional integration, it can achieve the improvement of its own high-quality welfare.
Table 5.
Direct effect, spillover effect, and total effect of influencing factors on urban ecological welfare performance.
4.3.2. Threshold Effects of Urban Ecological Welfare Performance
Robustness Tests and Threshold Estimation
The analysis shows that the influence coefficients of urbanization on urban ecological welfare performance vary widely. Therefore, urban ecological welfare performance is used as the explanatory variable, urbanization as the core variable, and industrial structure, city size, government fiscal pressure, openness to the outside world, innovation level, and economic development indicators as control variables for threshold estimation. First, Levin–Lin–Chu and Im–Pesaran–Shin are used to test the stationarity of the variables, and the results show that there is no unit root for all variables. Therefore, there is no pseudo-regression problem for non-stationary series. Second, the variance inflation factor diagnoses VIF values of less than 10 for each factor. The Hausman test showed that the fitting effect of the fixed effects model was the best, up to 94.64%. Finally, Bootstrap was used to test for threshold effects, and the number of thresholds was determined by the p-value (Table 6). The study shows the existence of a double threshold for innovation and technology, with thresholds of 2095 and 6341 pieces, which are significant at the 1% and 10% statistical levels, respectively. A single threshold exists for industrial structure, degree of openness to the outside world, and economic development, with threshold values of CNY1.2626, CNY 0.0229, and CNY 35181, respectively, and all of them pass the significance test.
Table 6.
Threshold estimates and tests of the threshold variables.
Analysis of Regression Results
Further analysis of the impact of threshold variables on urbanization in different threshold intervals is conducted (Table 7). ① When the innovation technology is used as the threshold variable, the elasticity coefficient is 0.0149 when the innovation level (the number of patents granted) is lower than 2095; the elasticity coefficient becomes 0.0156 when the innovation level is between 2095 and 6341; the elasticity coefficient is 0.0150 when the innovation level is higher than 6341. Technological innovation is a new engine for urban eco-welfare performance improvement using the reorganization of factor forms such as knowledge and technology, and it has been a positive driver of urban eco-welfare performance. ② When industrial structure is used as the threshold variable, and the industrial structure is lower than 1.2626, the elasticity coefficient is 0.0158; when the industrial structure crosses the threshold value of 1.2626, the elasticity coefficient decreases to 0.0142, and the impact of urbanization on ecological welfare performance is weakened. As the urbanization process advances, the industrial structure is transitioning from industrial-led to tri-product-led, which tends to be more rationalized. However, only a coordinated industrial ratio can avoid the “bubble” economy and promote the sustainable optimization of ecological welfare. ③ Urbanization has a positive effect on urban ecological welfare performance under the threshold of the degree of external openness. When the degree of external openness is lower than 0.0229, the elasticity coefficient of urbanization is 0.0164, and when the degree of external openness is higher than 0.0229, the elasticity coefficient of urbanization increases to 0.0170, and the effect on ecological welfare performance is strengthened. The higher level of external openness in Jiangsu province allows for the inflow of foreign capital to drive the employment of local labor and economic growth, and also improve urban production efficiency through technological spillover. This is conducive to the improvement of urban ecological welfare performance. ④ When the level of economic development is used as a threshold variable, urbanization has a significant positive effect on urban ecological welfare performance. The elasticity coefficient is 0.01299 when the economic development (GDP per capita) is lower than CNY 35,181; when the economic development level crosses the threshold of CNY 35,181, the urbanization impact coefficient is 0.0139. As urbanization progresses, the increased level of economic development promotes the spatial concentration of urban production factors and economic growth accumulates capital for urbanization development. With the proposed construction of new urbanization, a series of policies such as environmental protection, governance, and production technology improvement have been implemented to alleviate the pressure on resources and the environment and promote the improvement of urban ecological welfare performance.
Table 7.
Regression results for the threshold effect of each variable.
4.3.3. Drive Mechanism
In summary, the evolution of urban ecological welfare performance is a cyclical accumulation and comprehensive effect of multiple factors such as urbanization, economic development, industrial structure, city size, government fiscal expenditure structure, technological innovation, degree of openness to the outside world, and ecological environmental management, and it is inextricably linked to the internal factor resource endowment and external development environment of the region (Figure 6). In the early stage of urbanization, the economic system operates within the ecosystem boundary, and economic development and urbanization are the core drivers for the improvement of the high-quality welfare level of cities. In the process of urbanization, the resource allocation capacity of many factors, such as capital, population, industry, and technology, is gradually enhanced, and the development of secondary and tertiary industries is promoted through agglomeration and diffusion effects, thus promoting economic growth. Economic growth is also an important supporting force for the development of urbanization. Economic growth has led to higher income levels, a dramatic increase in employment opportunities, and a rising level of social security systems and public services, which are to some extent the intrinsic driving force behind the rise in urban high-quality welfare levels. With the advancement of urbanization, the spillover of technology and knowledge in the process of high-quality development should not be underestimated. Innovation and technology are important drivers for the high-quality development of the urban economy, as innovation input provides important support for economic growth, and innovation output provides the material basis for economic growth. Technological progress has led to the gradual release of urban development from over-dependence on production factors, prompting a reduction in energy consumption per unit and promoting the overall industrial structure toward industrial advancement. As an important economic growth pole in China’s eastern coastal region, Jiangsu province has its own location advantages that are highly attractive to foreign investment. The technology spillover that accompanies foreign direct investment has a significant impact on local development. The introduction of foreign advanced management experience and technology facilitates industrial upgrading, absorbs local employment, and promotes a high spatial agglomeration of industries and economies, thus improving urban ecological welfare performance. Both city size and industrial structure have an impact on the lives of residents. Social undertakings are the “engine” to promote human welfare. As the level of economic development improves, livelihood projects such as medical and education, social security systems, employment and transportation, and ecological construction are gradually improved, and the well-being of residents is enhanced. However, as the economy continues to grow, the economic system begins to break through the boundary of the ecosystem, and the rough economic growth causes space congestion, resource constraints, price increases, environmental pollution, and other problems, resulting in the negative effects of resources and environment increase. The construction of ecological civilization and the “two mountain theory” have led to a consensus on “green transformation and development”. The administration must improve quality and efficiency, increase the cost of environmental management, strictly control high pollution and high consumption, implement energy saving as well as emission reduction and green growth, and achieve economic transformation from “quantity” to “quality”.
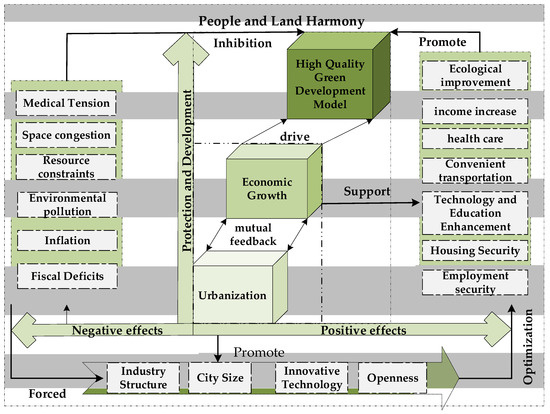
Figure 6.
Driving effect mechanism of urban ecological welfare performance.
5. Discussion and Conclusions
5.1. Discussion
5.1.1. Exploring the Relationship between Economic Development and Environmental Pollution behind the Urban Eco-Welfare Performance in Jiangsu Province
Urban ecological welfare performance is the maximization of welfare under the constraints of resources and environment, which may reflect the level of sustainable development of a city and the relationship between economic development and the resources and environment of the region. Jiangsu province’s “14th Five-Year Plan” points out that the total economic volume of Jiangsu province crossed three trillion yuan in a row and exceeded ten trillion yuan, contributing more than one-tenth of the national economic growth. The per capita gross domestic product reached CNY 125,000, ranking first in the country’s provinces (regions). The general public budget revenue reached CNY 905.9 billion, with an average annual growth rate of 2.4%. The total labor productivity reached CNY 215,000. The investment structure continued to be optimized, with the proportion of private investment reaching about 68.5%. The scale of the actual use of foreign investment and total import and export ranked first and second, respectively, in the country, and the quality and efficiency of development were further improved. Based on this, statistics of GDP per capita and the environmental pollution index (industrial soot, industrial wastewater, industrial sulfur dioxide, and PM2.5, etc., combined) of Jiangsu cities during 2005–2019 are used to analyze the relationship between economic development and environmental pollution in Jiangsu province, as can be seen in Figure 7. During the study period, the GDP per capita of each city followed a steady increase, and the pollution index of each city showed a decreasing and then increasing trend with an inflection point at 2014 and finally a steady decrease. The reason for this is that the “11th Five-Year Plan” period (2006–2010) is a critical period for Jiangsu to implement the scientific concept of development and build a moderately prosperous society. During the period of rapid economic strength, the ability of scientific and technological innovation is not strong enough, and there is a lack of core technologies and brands with independent intellectual property rights, resulting in the development of the service industry falls relatively behind. Economic growth mainly relies on capital investment, and while the resource and energy consumption patterns have not yet fundamentally changed, the pressure on resources and the environment has increased, and so has so the economic growth during this period despite environmental pollution being relatively serious. During the “12th Five-Year Plan” period (2011–2015), Jiangsu province moved forward from building a moderately prosperous society to generally achieving modernization. With the global wave of low-carbon development, and with Jiangsu province as a major resource-consuming province, in order to ease the resource and environmental bottleneck constraints, the construction of a resource-saving, environmentally friendly society is the urgent task of the period. The development of a circular economy and the promotion of low-carbon technology is the development trend of this period. The development level of new industrialization and informationization continues to rise. The industrial structure was adjusted, and the proportion of tertiary industry exceeded that of the secondary industry. Strategic emerging industries developed rapidly, and the regional innovation capacity ranked first in the country for six consecutive years. Therefore, the environmental pollution in this period fluctuates in a downward manner. During the “13th Five-Year Plan” period (2016 to 2019), Jiangsu’s development is at a critical stage of transformation and upgrading. The implementation of major national strategies such as “One Belt, One Road”, Yangtze River Economic Belt, and the integration of regional development in the Yangtze River Delta provides new opportunities for development. We consciously practice the high-quality development concept of innovation, coordination, green, openness, and sharing. In 2016, the “two reduction, six treatment and three upgrading” project was implemented to improve the ecological and environmental problems brought by the development of Jiangsu. Therefore, the environmental pollution in the period is on a continuous downward trend.
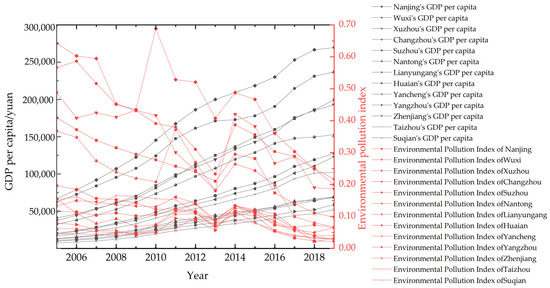
Figure 7.
GDP per capita and environmental pollution index of cities in Jiangsu province, 2005–2019.
5.1.2. Comparative Analysis with Other Studies on Urban Ecological Welfare Performance
In contrast with other studies, Guo et al. measured the ecological welfare performance of the Yangtze River Economic Zone from 2004 to 2018 using the super-efficient SBM model, and using the human development index as the desired output indicator. The human development index (HDI) measures the level of welfare and represents it through three dimensions: the level of economic development, the level of educational development, and the level of health care [46]. Xu et al. applied a stochastic frontier analysis model to measure the level of ecological welfare in the Yellow River Basin through three dimensions: the level of economic development, the level of educational development, and the level of health care as output indicators [47]. Wang et al. measured the ecological welfare performance of the Yangtze River Economic Belt by using economic welfare, social welfare, and environmental welfare as welfare output indicators [23]. Hu et al. measured the evolutionary process and mechanism of urban ecological welfare performance in the Yangtze River Delta based on the integrated welfare perspectives of economic welfare, social welfare, and green welfare [43]. Feng et al. found a decreasing trend in ecological welfare performance in 12 provinces in China based on the ratio of the value of welfare to the physical quantity of ecological resources consumed [14]. Bian et al. constructed a theoretical framework of urban ecological welfare performance using the “strong sustainable development idea” and evaluated the ecological welfare performance of 30 provincial capital cities in China [48]. Common et al. used the ratio of human satisfaction to environmental inputs to measure ecological well-being performance in 75 countries, and the study concluded that richer countries performed worse in terms of ecological well-being performance [49]. Knight et al. used the average of micro-individual “life satisfaction” to measure the welfare level of the country [50]. However, China’s economic development is now gradually changing from high growth to high quality. In the context of high-quality development, the measurement of urban welfare levels should not be limited to simple indicators such as GDP, life expectancy, and education. It should be combined with the general context of high-quality development and integrate multiple dimensions, reflecting the concept of high-quality development to reflect the actual situation of urban economic and social development more comprehensively. Based on the five major concepts of high-quality development, this study insists on the unification of five major development systems, such as innovation, coordination, green, openness, and sharing. The evaluation index system of urban ecological welfare performance is improved from the perspective of promoting the synergistic development of economic–natural–social systems, which is more conducive to reflecting the residents’ welfare objectively and comprehensively.
5.1.3. Implications for the Coordinated Development of Jiangsu Province
From the results of this study, it is clear that urban ecological welfare performance is influenced by the interaction and influence of natural endowments and socio-economic factors. Cities with higher initial urban eco-welfare performance have good ecological capital and exhibit increasing marginal returns to capital, leading to differences in the level of high-quality urban welfare depending on their own resource endowments. With the excessive concentration of population, capital, technology, and industry, the spatial congestion effect gradually becomes prominent, putting pressure on the ecological environment, leading to a decline in the well-being of urban residents and forcing the transfer of some high-quality factors. When the polarization effect is dominant, the city’s strong economic base, advanced technology, and superior living environment can attract ecological factors from neighboring cities to continuously flow in and spatially cluster, strengthening its urban ecological welfare performance [21]. When the diffusion effect is dominant, cities with high quality welfare performance levels will improve the quality performance levels of neighboring cities through green economy technologies [51]. Located at the core of the Yangtze River Delta, Jiangsu province is one of the important provinces that support and lead the country’s economic development. The core belt of “Suzhou Wuxi Changzhou area” and “Nanjing metropolitan area” has a good economic foundation. The economic pattern of “tertiary industry, secondary industry and primary industry” is gradually formed, environmental protection systems and regulations have been gradually improved, cleaner production technology has been promoted [52], and the urban ecological welfare performance of the region is at a high level. However, some cities such as Xuzhou, Suqian, Huai’an, and other cities on the edge of the Yangtze River Delta are under greater pressure regarding resources and the environment due to the lack of better energy saving and emission reduction initiatives as well as insufficient independent innovation. Therefore, the level of high-quality welfare is low. Additionally, in the process of future economic development, in order to effectively improve high-quality welfare, the concept of green and sustainable development should be comprehensively implemented and the traditional model of simply pursuing GDP assessment standards should be abandoned. Based on the satisfaction and happiness index of residents’ lives, indicators of welfare performance, ecological environmental protection, and governance effectiveness should be incorporated into the local performance appraisal system, and welfare enhancement should be fully penetrated and deeply integrated into the process of economic and social development, especially in low welfare areas such as northern Jiangsu. It is necessary to strengthen the residents’ education, employment, medical care, and other social security conditions further, make up for the shortcomings of people’s livelihood, guide the balanced spatial distribution of production factors such as capital and talent, and narrow the welfare gap within the region.
5.1.4. Shortcomings and Future Prospects
The present study still leaves room for improvement. The spatial and temporal variation of urban ecological welfare performance has multi-scale characteristics and complex driving factors. In the future, we will analyze its evolutionary process and formation mechanism from different scales, and in parallel, we will select different typical cases from multi-dimensional composite perspectives to study the driving mechanism in depth and broaden the research scope to improve the theoretical system of welfare geography.
5.2. Conclusions
Based on the concept of “high-quality development”, the spatial and temporal patterns, spatial effects, and evolutionary mechanisms of urban ecological welfare performance in Jiangsu province from 2005 to 2019 are analyzed, and the following conclusions can be drawn.
The average value of urban ecological welfare performance in Jiangsu increased from 0.344 in 2005 to 0.852 in 2019, exhibiting a yearly increase trend. Spatially, there is a significant north–south divergence, with the overall trend of South Jiangsu > Central Jiangsu > North Jiangsu. The high-welfare performance areas are mainly distributed in the cities in South Jiangsu, followed by Central Jiangsu and the lowest in North Jiangsu. The differences in ecological welfare levels among the three regions are gradually decreasing, with the high value area continuing to expand and the low value area continuing to decrease, while the welfare of cities in northern Jiangsu catch up with cities in southern Jiangsu, with urban welfare performance tending to develop in a balanced manner.
The spillover effect of urban ecological welfare performance in Jiangsu province is influenced by the combined effects of urbanization levels, economic development, industrial structure, city scale, technological innovation, degree of openness to the outside world, and government financial pressure. Each 1% increase in industrial structure, city scale, and economic development levels reduces the urban ecological welfare performance of neighboring areas by 1.4474%, 1.412%, and 2.793%, respectively, which are the key factors affecting the urban ecological welfare performance of neighboring areas.
There are significant threshold effects for innovation and technology, industrial structure, degree of openness to the outside world, and economic development. There is a double threshold for innovation and technology, with threshold values of 2095 and 6341 pieces, respectively. There are single thresholds for industrial structure, degree of openness to the outside world, and economic development, with threshold values of 1.2626, 0.0229, and 35181, respectively. The degree of urbanization’s impact on urban ecological high-quality welfare performance varies significantly under the effect of different threshold variables.
Urbanization and economic development are the fundamental factors driving the growth of urban eco-welfare performance; industrial structure, city size, innovation and technology, as well as openness to the outside world have a positive impact on the residents’ quality of life, and government financial pressure inhibits the improvement of welfare performance.
The urban ecological welfare performance of Jiangsu province has been continuously optimized and improved. In order to avoid energy consumption rebound in individual cities, a regional spatial layout intensification is needed to maximize spatial efficiency to achieve energy saving and consumption reduction, promote urban development into a green development mode with high efficiency and low consumption, truly realize the comprehensive and coordinated development of urban population, resources, environment, economy, and society, and create high-quality urban welfare performance for residents.
This study was supported by the Key Projects of the National Natural Science Fund of China (No.42071229 and No. 41671174).
Author Contributions
Conceptualization, S.H. and B.F.; methodology, S.H.; software, S.H. and X.X.; validation, S.H. and X.X.; formal analysis, S.H.; investigation, S.H.; resources, S.H.; data curation, S.H. and X.X.; writing—original draft preparation, S.H.; writing—review and editing, B.F.; visualization, S.H.; supervision, B.F.; project administration, B.F.; funding acquisition, B.F. All authors have read and agreed to the published version of the manuscript.
Funding
This research was funded by the National Natural Science Foundation of China, grant number 42071229, 41671174 and the Priority Academic Program Development of Jiangsu Higher Education Institutions, grant number 164320H116.
Data Availability Statement
The sources and preprocessing of data can be found in Section 2.3 and Section 3. Other relevant data to support this study are available from the authors upon request.
Conflicts of Interest
The authors declare no conflict of interest.
References
- Hartwick, J. Interregional equity and the investing of rents from exhaustible resources. Am. Econ. Rev. 1977, 67, 972–974. [Google Scholar]
- Solow, R.M. The Economics of Resources or the Resources of Economics; Palgrave Macmillan Books: London, UK, 1974; Volume 64, pp. 1–14. [Google Scholar]
- Costanza, R.; Daly, L.; Fioramonti, L.; Giovannini, E.; Kubiszewski, I.; Mortensen, L.; Pickett, K.; Ragnarsdottir, K.; De Vogli, R.; Wilkinson, R. Modelling and measuring sustainable wellbeing in connection with the UN Sustainable Development Goals. Ecol. Econ. 2016, 130, 350–355. [Google Scholar] [CrossRef]
- Victor, P. Questioning economic growth. Nature 2010, 468, 370–371. [Google Scholar] [CrossRef] [PubMed]
- Daly, H.E. Economics in a Full World. Sci. Am. 2005, 293, 100–107. [Google Scholar] [CrossRef]
- Hringer, C.B.; Jochem, P.E.P. Measuring the immeasurable—A survey of sustainability indices. Ecol. Econ. 2007, 63, 1–8. [Google Scholar] [CrossRef]
- Feng, J.; Yuan, J. Ecological welfare performance—A new analysis tool for sustainable development. Sci. Technol. Manag. Res. 2016, 36, 240–244. [Google Scholar]
- Ma, L.; Yu, Z. Analysis of influencing factors of average life expectancy in China. Econ. Res. Guide 2009, 9, 161–162. [Google Scholar]
- Zeng, G.; Hu, S. Spatial evolution process of China’s regional development pattern in big changes unseen in a Century. Econ. Geogr. 2021, 41, 42–48 + 69. [Google Scholar]
- Zang, M.; Zhu, D.; Liu, G. Ecological well-being performance: Concept, connotation and empirical of G20. China Popul. Resour. Environ. 2013, 23, 118–124. [Google Scholar]
- Daly, H.E. Beyond Growth: The economics of sustainable development. Popul. Dev. Rev. 1996, 22, 783–789. [Google Scholar]
- Rees, W.E. Ecological footprints and appropriated carrying capacity: What urban economics leaves out. Environ. Urban. 1992, 4, 121–130. [Google Scholar] [CrossRef]
- United Nations Development Programme (UNDP). Human Development Report 1990: Concept and Measurement of Human Development; UNDP: New York, NY, USA, 1990; pp. 15–18. [Google Scholar]
- Feng, J.; Yuan, J. On Chinese regional ecological well-being performance and its influence factors. Forum Sci. Technol. China 2016, 3, 100–105. [Google Scholar]
- Fu, W.; Zhao, J.; Du, G. The evaluation of resources sustainable utilization—Based on empirical analysis of resources welfare index. J. Nat. Resour. 2014, 29, 1902–1915. [Google Scholar]
- Zhu, D.; Zhang, S. Research on ecological wellbeing performance and its relationship with economic growth. China Popul. Resour. Environ. 2014, 24, 59–67. [Google Scholar]
- Long, L.; Wang, X.; Guo, B. Evaluation of urban ecological well-being performance based on revised DEA model—A case study of 35 major cities in China. J. Nat. Resour. 2017, 32, 595–605. [Google Scholar]
- Li, C.; Zhang, S.; Zhang, W.; Liao, X. Measurement and influencing factors of inter-provincial ecological measurement and influencing factors of inter-provincial ecological well-being performance in China. Sci. Geogr. Sin. 2019, 39, 1875–1883. [Google Scholar]
- Du, H.; Huang, L.; Zhang, C.; He, J. Research on the regional differences decomposition and convergence mechanism of ecological well-being performance. Ecol. Econ. 2019, 35, 187–193. [Google Scholar]
- Fang, S.; Xiao, Q. Research on regional ecological well-being performance and spatial effect in China. China Popul. Resour. Environ. 2019, 29, 1–10. [Google Scholar]
- Xiao, L.; Xiao, Q. Study on the differentiation and spatial convergence of Urban Ecological Welfare performance patterns in the Yellow River Basin. Soft Sci. 2021, 35, 46–53. [Google Scholar]
- Guo, B.; Bu, Y. Performance evaluation and influencing factors of Urban Ecological Welfare in the Yangtze River Economic Belt--a case study of 110 cities in the Yangtze River Economic Belt. Enterp. Econ. 2018, 37, 30–37. [Google Scholar]
- Wang, Z.; Wang, Z. Spatial pattern evolution and influencing factors of Ecological Welfare performance in the Yangtze River Economic Belt—Based on super efficiency SBM model. Resour. Environ. Yangtze Basin 2021, 30, 2822–2832. [Google Scholar]
- Wang, S.; Han, Y.; Ren, H.; Li, J. Evaluation of provincial ecological well- being performance and its driving effect decomposition in China. Resour. Sci. 2020, 42, 840–855. [Google Scholar] [CrossRef]
- Long, L. Evaluation of urban ecological well-being performance of Chinese major cities based on twostage super efficiency network SBM Model. China Popul. Resour. Environ. 2019, 29, 1–10. [Google Scholar]
- Yu, B.; Su, Y. Research on the impact of industrial structure adjustment on Land Use Efficiency and Spillover Effect: An Empirical Analysis Based on PSDM Model and PTR Model. China Land Sci. 2020, 34, 57–66. [Google Scholar]
- Xu, Y.; Wang, H. The construction and empirical evidence of the index system of regional high-quality development based on "five development concepts. Stat. Decis. 2020, 36, 98–102. 27. [Google Scholar]
- Zhang, J.; Hou, Y.; Liu, P.; He, J.; Zhuo, X. The target requirements and strategic path of high quality development. Manag. World 2019, 35, 1–7. [Google Scholar]
- Li, M.; Ren, B. Comprehensive evaluation and path choice of China’s High-Quality development in the New Era. Financ. Econ. 2019, 5, 26–40. [Google Scholar]
- Cui, P.; Zhao, Y.; Xia, S.; Yan, J. Level measures and temporal and spatial coupling analysis of ecological environment and High Quality development in the Yellow River Basin. Econ. Geogr. 2021, 40, 49–57+80. [Google Scholar]
- Liu, L.; Liang, L.; Gao, P.; Fan, C.; Wang, H.; Wang, H. Coupling relationship and interactive response between ecological protection and high-quality development in theYellow River Basin. J. Nat. Resour. 2021, 36, 176–195. [Google Scholar]
- Guo, G.; Gao, Y. Construction and evaluation of statistical index system of Five Development Concepts. Stat. Decis. 2020, 36, 96–99. [Google Scholar]
- Li, Z.; Hu, M.; Zhang, A.; Zhou, N. Influence and spillover effect of industrial eco-efficiency on PM2.5 pollution. J. Nat. Resour. 2021, 36, 737–751. [Google Scholar] [CrossRef]
- Chen, S. Energy consumption CO2 emissionand sustainable development in Chinese industry. Econ. Res. J. 2009, 44, 41–55. [Google Scholar]
- Bai, X.; Du, J. Interactive mechanism and empirical on independent innovation and High-Quality Development. J. Tech. Econ. Manag. 2019, 39–44. [Google Scholar]
- Meeusen, W.; Julien, V.D.B. Efficiency estimation from Cobb-Douglas Production Functions with composed error. Int. Econ. Rev. 1977, 18, 435–444. [Google Scholar] [CrossRef]
- Aigner, D.; Lovell, C.; Schmidt, P. Formulation and estimation of stochastic frontier production function models. J. Econom. 1977, 6, 21–37. [Google Scholar] [CrossRef]
- Battese, G.E.; Coelli, T.J. Frontier production functions, technical efficiency and panel data: With application to paddy farmers in India. J. Prod. Anal. 1992, 3, 153–169. [Google Scholar] [CrossRef]
- Moran, P.A. Notes on continuous stochastic phenomena. Biometrika 1950, 37, 17–23. [Google Scholar] [CrossRef]
- Elhorst; Paul, J. Specification and estimation of Spatial Panel Data Models. Int. Reg. Sci. Rev. 2003, 26, 244–268. [Google Scholar] [CrossRef]
- Lesage, J.; Pace, R.K. Introduction to Spatial Econometrics; Chapman and Hall/CRC: London, UK, 2009; pp. 19–44. [Google Scholar]
- Yan, X.; Cheng, C.; Yi, G.; Bai, J. Economic Threshold Effect of urbanization on energy consumption: Take the Yangtze River Economic Zone as an example. Econ. Geogr. 2019, 39, 73–81. [Google Scholar]
- Hu, M.; Li, Z.; Hou, B. The effect and formation mechanism of“Well-being Threshold”in cities of Yangtze River Delta. Econ. Geogr. 2021, 41, 62–72. [Google Scholar]
- Higgins, S.L.; Thomas, F.; Goldsmith, B.; Brooks, S.J.; White, P. Urban freshwaters, biodiversity, and human health and well-being: Setting an interdisciplinary research agenda. Wiley Interdiscip. Rev. Water 2019, 6, e1339. [Google Scholar] [CrossRef]
- Zhang, X.; Liu, Y.; Yang, X.; Liu, Q. Dynamic externalities, agglomeration patterns on urban welfare levels. Urban Probl. 2016, 35, 4–12. [Google Scholar]
- Guo, B.; Tang, L.; Jiang, Y.; Zhang, H. Regional differences and spatial convergence of Ecological Welfare Performance in Yangtze River Economic Belt. Ecol. Econ. 2022, 38, 167–175. [Google Scholar]
- Xu, Z.; Xu, W.; Liu, C. Dynamic evolution and driving mechanisms of urban ecological welfare performance of cities in theYellow River Basin. Urban Probl. 2021, 36, 114–130. [Google Scholar]
- Bian, J.; Ren, H.; Liu, P. Evaluation of urban ecological well-being performance in China: A case study of 30 provincial capital cities. J. Clean. Prod. 2020, 254, 120109. [Google Scholar] [CrossRef]
- Common, M. Measuring national economic performance without using prices. Ecol. Econ. 2007, 64, 92–102. [Google Scholar] [CrossRef]
- Knight, K.W.; Rosa, E.A. The environmental efficiency of well-being: A cross-national analysis. Soc. Sci. Res. 2011, 40, 931–949. [Google Scholar] [CrossRef]
- Li, B.; Zhou, Q.; Yue, H. Can the agglomeration of producer services contribute to the High-quality Development of cities in the Yellow River Basin? Econ. Surv. 2022, 39, 88–98. [Google Scholar]
- Li, X.; Fang, B.; Yin, R.; Rong, H. Spatial-temporal change and collaboration/trade-off relationship of "production-living-ecological" functions in county area of Jiangsu province. J. Nat. Resour. 2019, 34, 2363–2377. [Google Scholar]


Publisher’s Note: MDPI stays neutral with regard to jurisdictional claims in published maps and institutional affiliations. |
© 2022 by the authors. Licensee MDPI, Basel, Switzerland. This article is an open access article distributed under the terms and conditions of the Creative Commons Attribution (CC BY) license (https://creativecommons.org/licenses/by/4.0/).