1. Introduction
Land is the foundation of human life and social development, as well as an indispensable resource for human activities. Land cover change is an important indicator that characterizes the impacts of human activities on the natural ecosystems [
1]. In recent years, land cover change is also a hot issue in global climate change research. In 2005, the Global Land Project (GLP), in collaboration with the international geosphere and biosphere program (IGBP) and human factors of the Global Change Program (IHDP), a key step in resolving the mutually beneficial relationship between man and land [
2]. Under the joint promotion of IGBP and IHDP, the research on land cover has become one of the research cores of global environmental change [
3,
4,
5]. Land cover change has an obvious impact on river runoff, biological abundance, and soil erosion. If the land cover is unreasonable, it may cause adverse effects on the ecological environment security of the Yellow River Basin (YRB) of the China area. The analysis of land cover change and its driving forces can provide a scientific basis for rational allocation of water and land resources.
The Yellow River, the mother river of China, has a very special status, and has been nourishing the residents lived in the Yellow River Basin (YRB) of China for thousands of years. At present, there are 107 million peoples lived in the YRB area, where the area of cropland is 13 million km
2. YRB crosses the arid, semi-arid, and semi-humid areas of China. YRB is an important ecological barrier in northern China, including the Qinghai-Tibet Plateau, Loess Plateau, and North China Plain [
6]. The western part of YRB is located in the frigid zone. The northwest part is adjacent to the Gobi desert, the northern part has a large area of desert, and the central part is an area with serious soil erosion; the ecological environment is fragile. The midstream area and downstream area of YRB are one of the regions where the relationship between man and land is relatively tense. Along with the influence of climate change and human activities, the ecological environment question also further highlights in the YRB area [
7].
At present, many scholars have studied land cover in different research areas with different emphases, related research combining land cover change has been extensively conducted, which included the process, pattern, land cover transition [
8,
9], dynamic driving forces, and eco-environmental effects of land cover change [
10,
11,
12]. For example, Surya et al. analyzed the spatial interaction and sustainable development, in terms of land cover change in the Metropolitan Urban Areas, South Sulawesi Province, Indonesia [
13]. Teklay et al. investigated the effects of accounting dynamic land cover on hydrological responses in Gummara watershed, Ethiopia [
14]. Lambin et al. examined the relationship between land cover and socioeconomic economy [
8]. Rimal et al. explicated the relationship among urbanization, land cover dynamics, and multiple disaster and risk analysis in the Pokhara Valley from 1990 to 2013 [
9]. Dewan am et al. analyzed land cover dynamics in Dhaka, Bangladesh, based on the satellite imagery [
15]. Kalnay E et al. described the impacts of climate change on land cover change [
16]. Qingliu et al. evaluated and forecast the carbon storage of Hainan Island, based on land cover dynamics [
17].
Moreover, there are also many efforts to analyze the driving factors of land cover change and have further supplemented the research on land cover change. The current analysis of the driving factors of land cover change mainly includes qualitative and quantitative analysis. Qualitative analysis methods cannot quantitatively express the impact of various drivers on land cover change [
18,
19], while quantitative methods can quantify the impact of various drivers on land cover change [
20,
21]. However, neither method can reflect the relationship between driving factors and land cover changes in spatial location [
22]. GeoDetector is a statistical method that detects spatial differences to analyze their drivers [
23,
24]. The GeoDetector method can be used to analyze the spatial relationship between different driving factors of land cover change [
25,
26,
27,
28].
With the rapid population and economic growth, as well as climate change, land cover of YRB occurred a series of dramatic changes since 1990. Therefore, regarding how to explicitly analyze the spatiotemporal dynamics of land cover and clearly explicate the key driving forces of land cover in the YRB area since 1990, it is helpful to clearly understand the changes of vegetation cover and formulate relevant plans in a timely and effective manner to better protect the ecological environment in the YRB area. The paper is aimed to clearly explicate the spatiotemporal dynamics of land cover and their driving forces in the YRB area during the period from 1990 to 2020, based on the spatial data of land cover in 1990, 2000, 2010, and 2020.
3. Results
3.1. Spatial Distribution of Land Cover in YRB
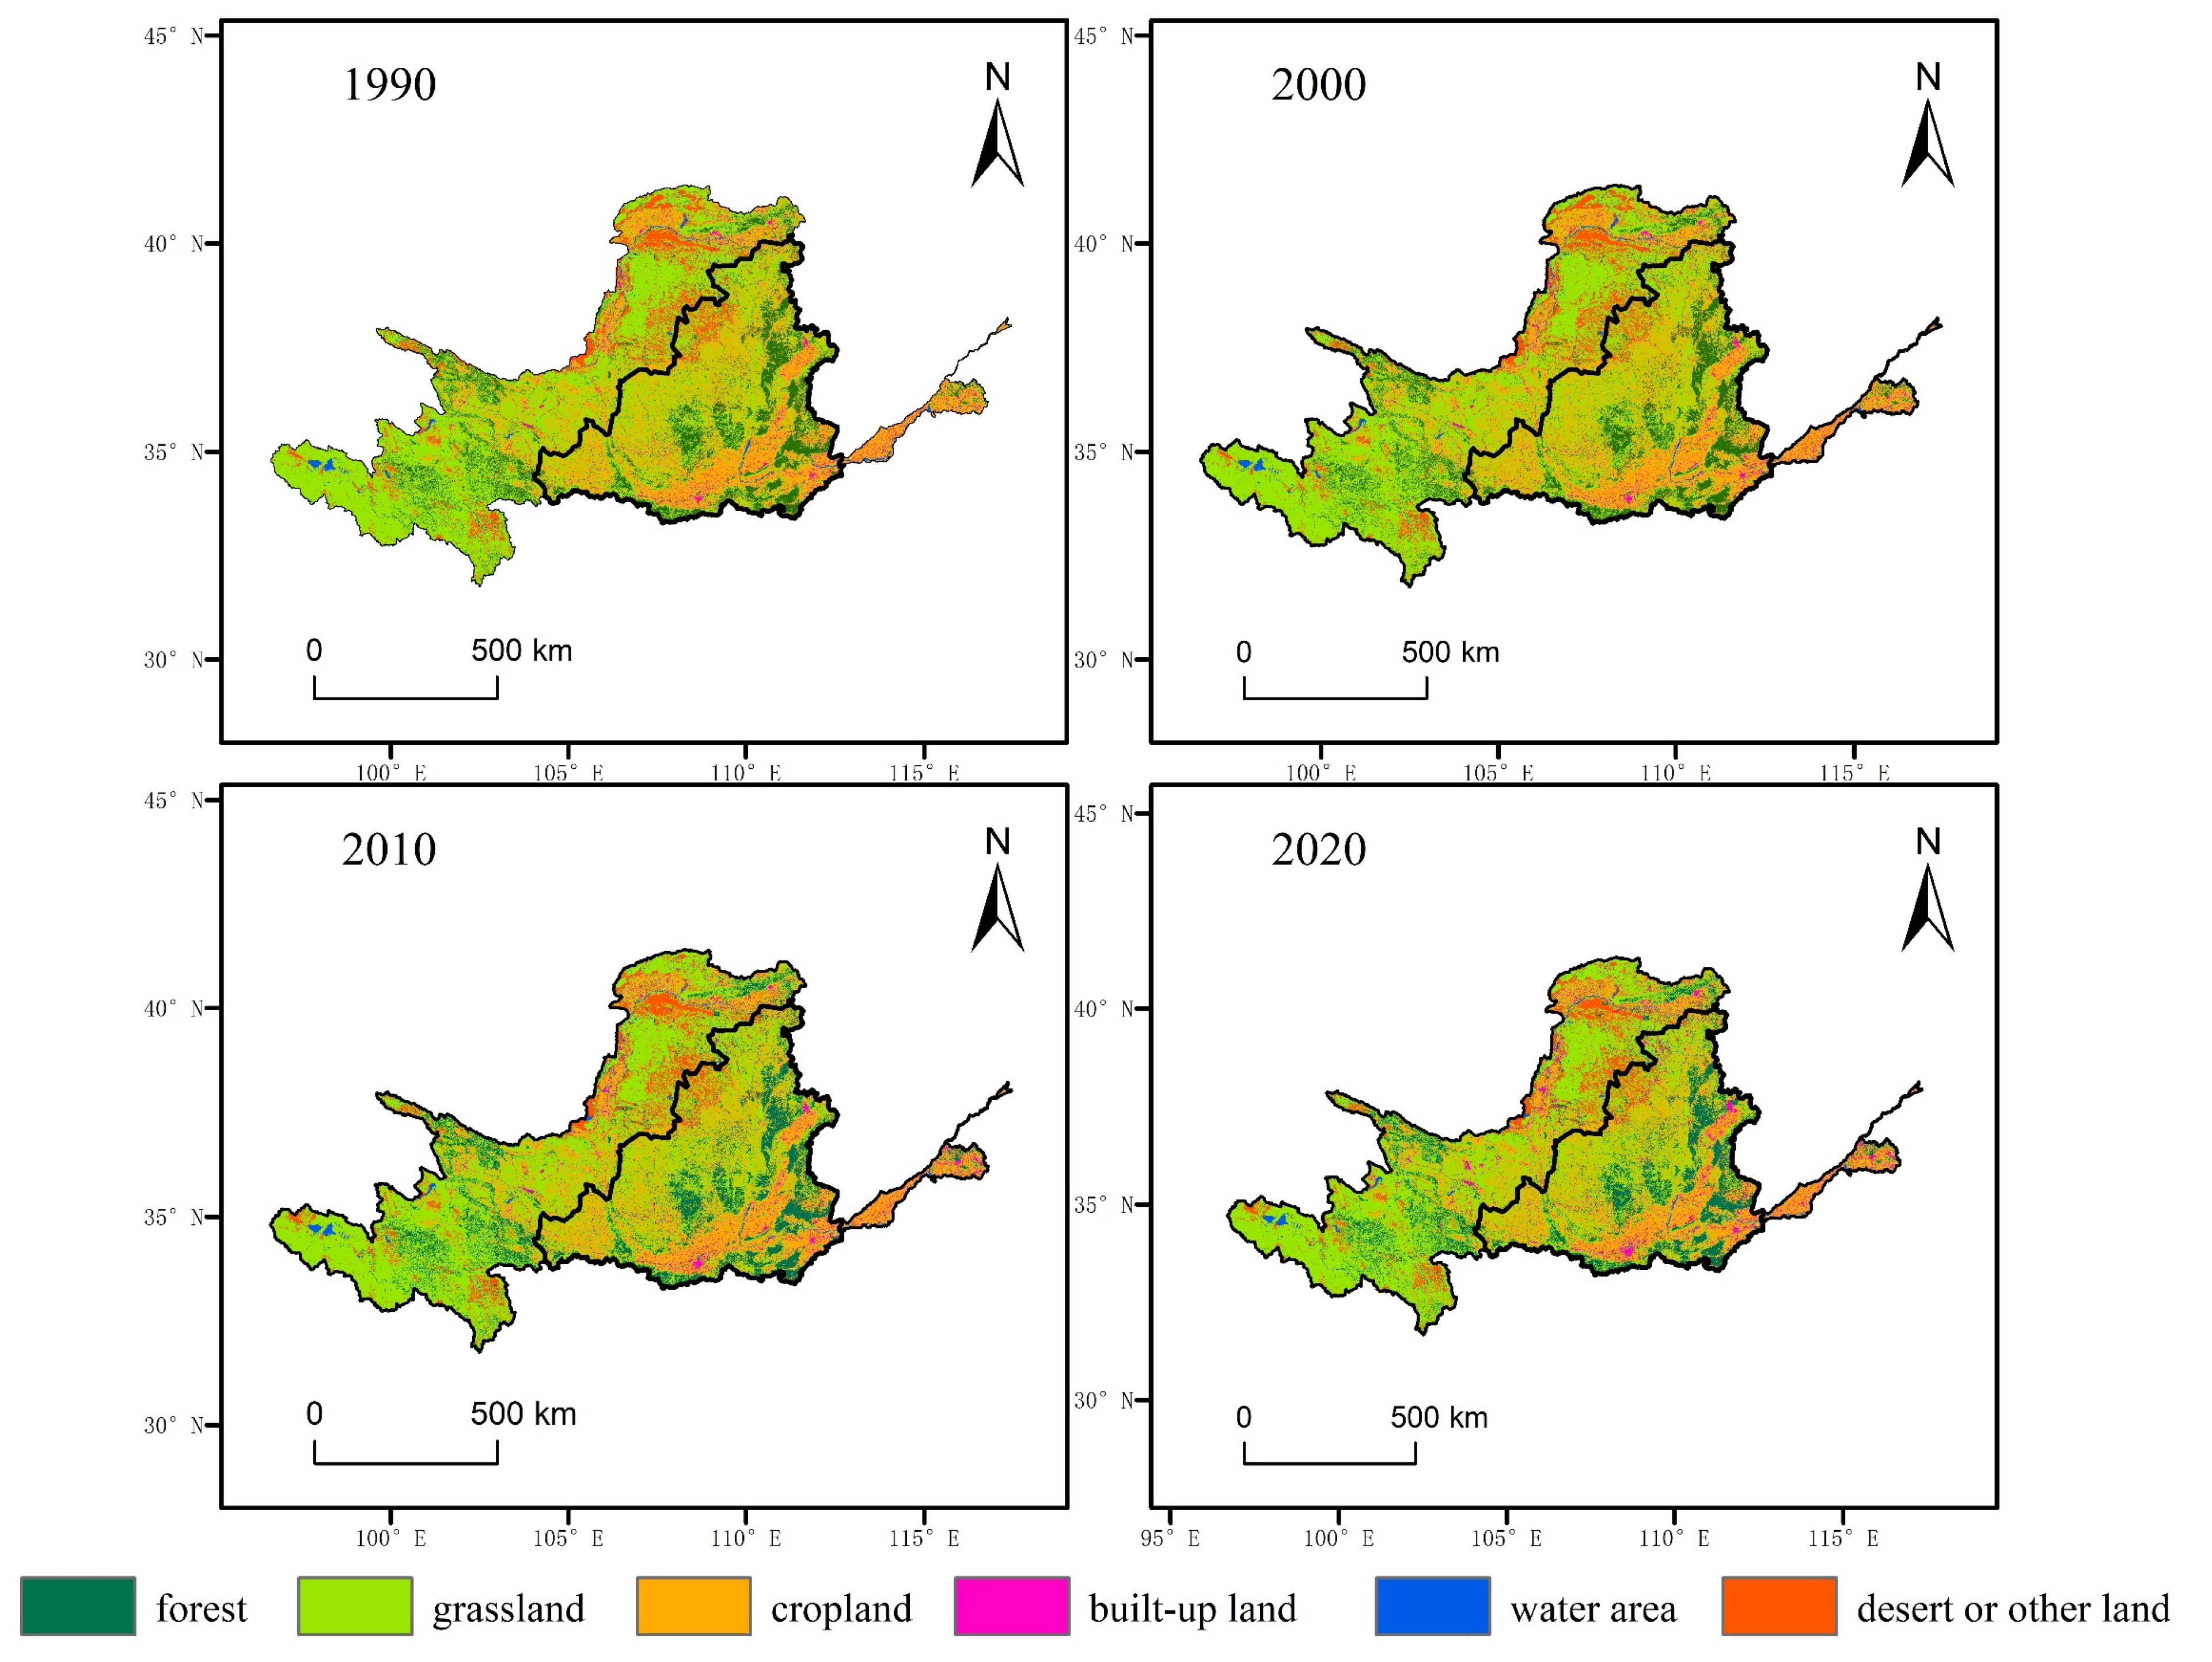
The distribution pattern of land cover in YRB area clearly shows a spatial difference from the upstream area to downstream area (
Figure 2). The forest is mainly distributed in the mountains and hilly areas of upstream and midstream areas of YRB, especially in Hengduan Mountains, Qilian Mountains, Qinling Mountains, and Ziwu mountains. The grassland of the YRB is mainly distributed in the plateau and highland areas in the YRB, such as the eastern part of Qinghai-Tibet Plateau, middle and north of Loess Plateau, and southwest of Inner Mongolia Plateau. Cropland is mainly located in the basin and plain area of YRB, such as the Weihe Basin and the North China Plain. Built-up land is mainly distributed in the urbans and their adjacent areas in the YRB. In addition to the Yellow River itself, the water area is mainly distributed in the headwater areas of the upstream area of YRB. Desert or other land is mainly distributed in the upstream area of the YRB and Inner Mongolia Plateau.
The analyzed results (
Table 1) show that the area of grassland was the largest, accounting for 48.62% of the total area of YRB between 1990 and 2020. The area of water area was the least, accounting for 1.77% of the total area of YRB. The terrain surface of YRB was dominated by the three land cover types of forest, grassland, and cropland, and the ratio of area was up to 85% of the total area of YRB. In the upstream area of YRB, the land cover was dominated by grassland, accounting for more than 60% of the whole upstream area, followed by cropland, desert, and other land. In the midstream area of YRB, cropland and grassland were the mainly land cover types, and the ratio of that is about 70% of the whole midstream area. In the downstream area of YRB, cropland is the mainly land cover type, and its ratio accounts for more than 65% of the downstream area.
3.2. Area Change of Land Cover in YRB
The analyzed results of land cover changes between 1990 and 2020 in the YRB area (
Figure 2 and
Table 1) show that cropland and grassland showed a continual decreasing trend, with average decreases of 3125.22 and 1259.42 km
2, respectively, per decade. Built-up land showed a continual increasing trend, with average increased by 3788.93 km
2 per decade. Forest and water area generally showed an increasing trend, with respectively average increased by 981.07 and 35.67 km
2, respectively, per decade. Desert or other land generally showed a decreasing trend, with average decreased by 421.03 km
2 per decade.
From the upstream, midstream, and downstream area of YRB perspectives, in the upstream area of YRB, built-up land had the largest increasing ratio, with average increased by 20.14% per decade between 1990 and 2020. Cropland had the largest decreasing ratio, with average decreased by 0.53% per decade.
In the midstream area of YRB, built-up land also had the largest increasing ratio, with average increased by 26.14% per decade between 1990 and 2020. Desert or other land had the largest decreasing ratio, with average decreased by 2.53% per decade.
In the downstream area of YRB, built-up land still had the largest increasing ratio, with average increased by 14.98% per decade between 1990 and 2020. Desert or other land had the largest decreasing ratio, with average decreased by 19.85% per decade.
3.3. Dynamic Degree of Land Cover Change in YRB
The calculated results of the dynamic degrees of each land cover type during the three periods from 1990 to 2000, 2000 to 2010, and 2010 to 2020 were listed as
Table 2. From 1990 to 2020, the dynamic degrees of water area and grassland were the least number, respectively, at only 0.03% and −0.03% per year. The dynamic degree of forest and built-up land showed an increasing trend, especially that of built-up land is the highest growth rate (2.23% per year). The dynamic degree of cropland had the highest negative growth rate (−0.15% per year). The dynamic degree of forest was small (0.09% per year) between 1990 and 2010, with the biggest (0.32% per year) between 2000 and 2010. The dynamic degree of grassland and water area was stable than that of other land cover types during the periods from 1990 to 2020. The dynamic change of desert or other land between 1990 and 2010 was small (−0.07% per year), and that between 2000 and 2010 was the largest (0.32% per year). The dynamic degree built-up land was the largest (3.38% per year) between 2010 and 2020.
3.4. Transform Trend of Land Cover in YRB
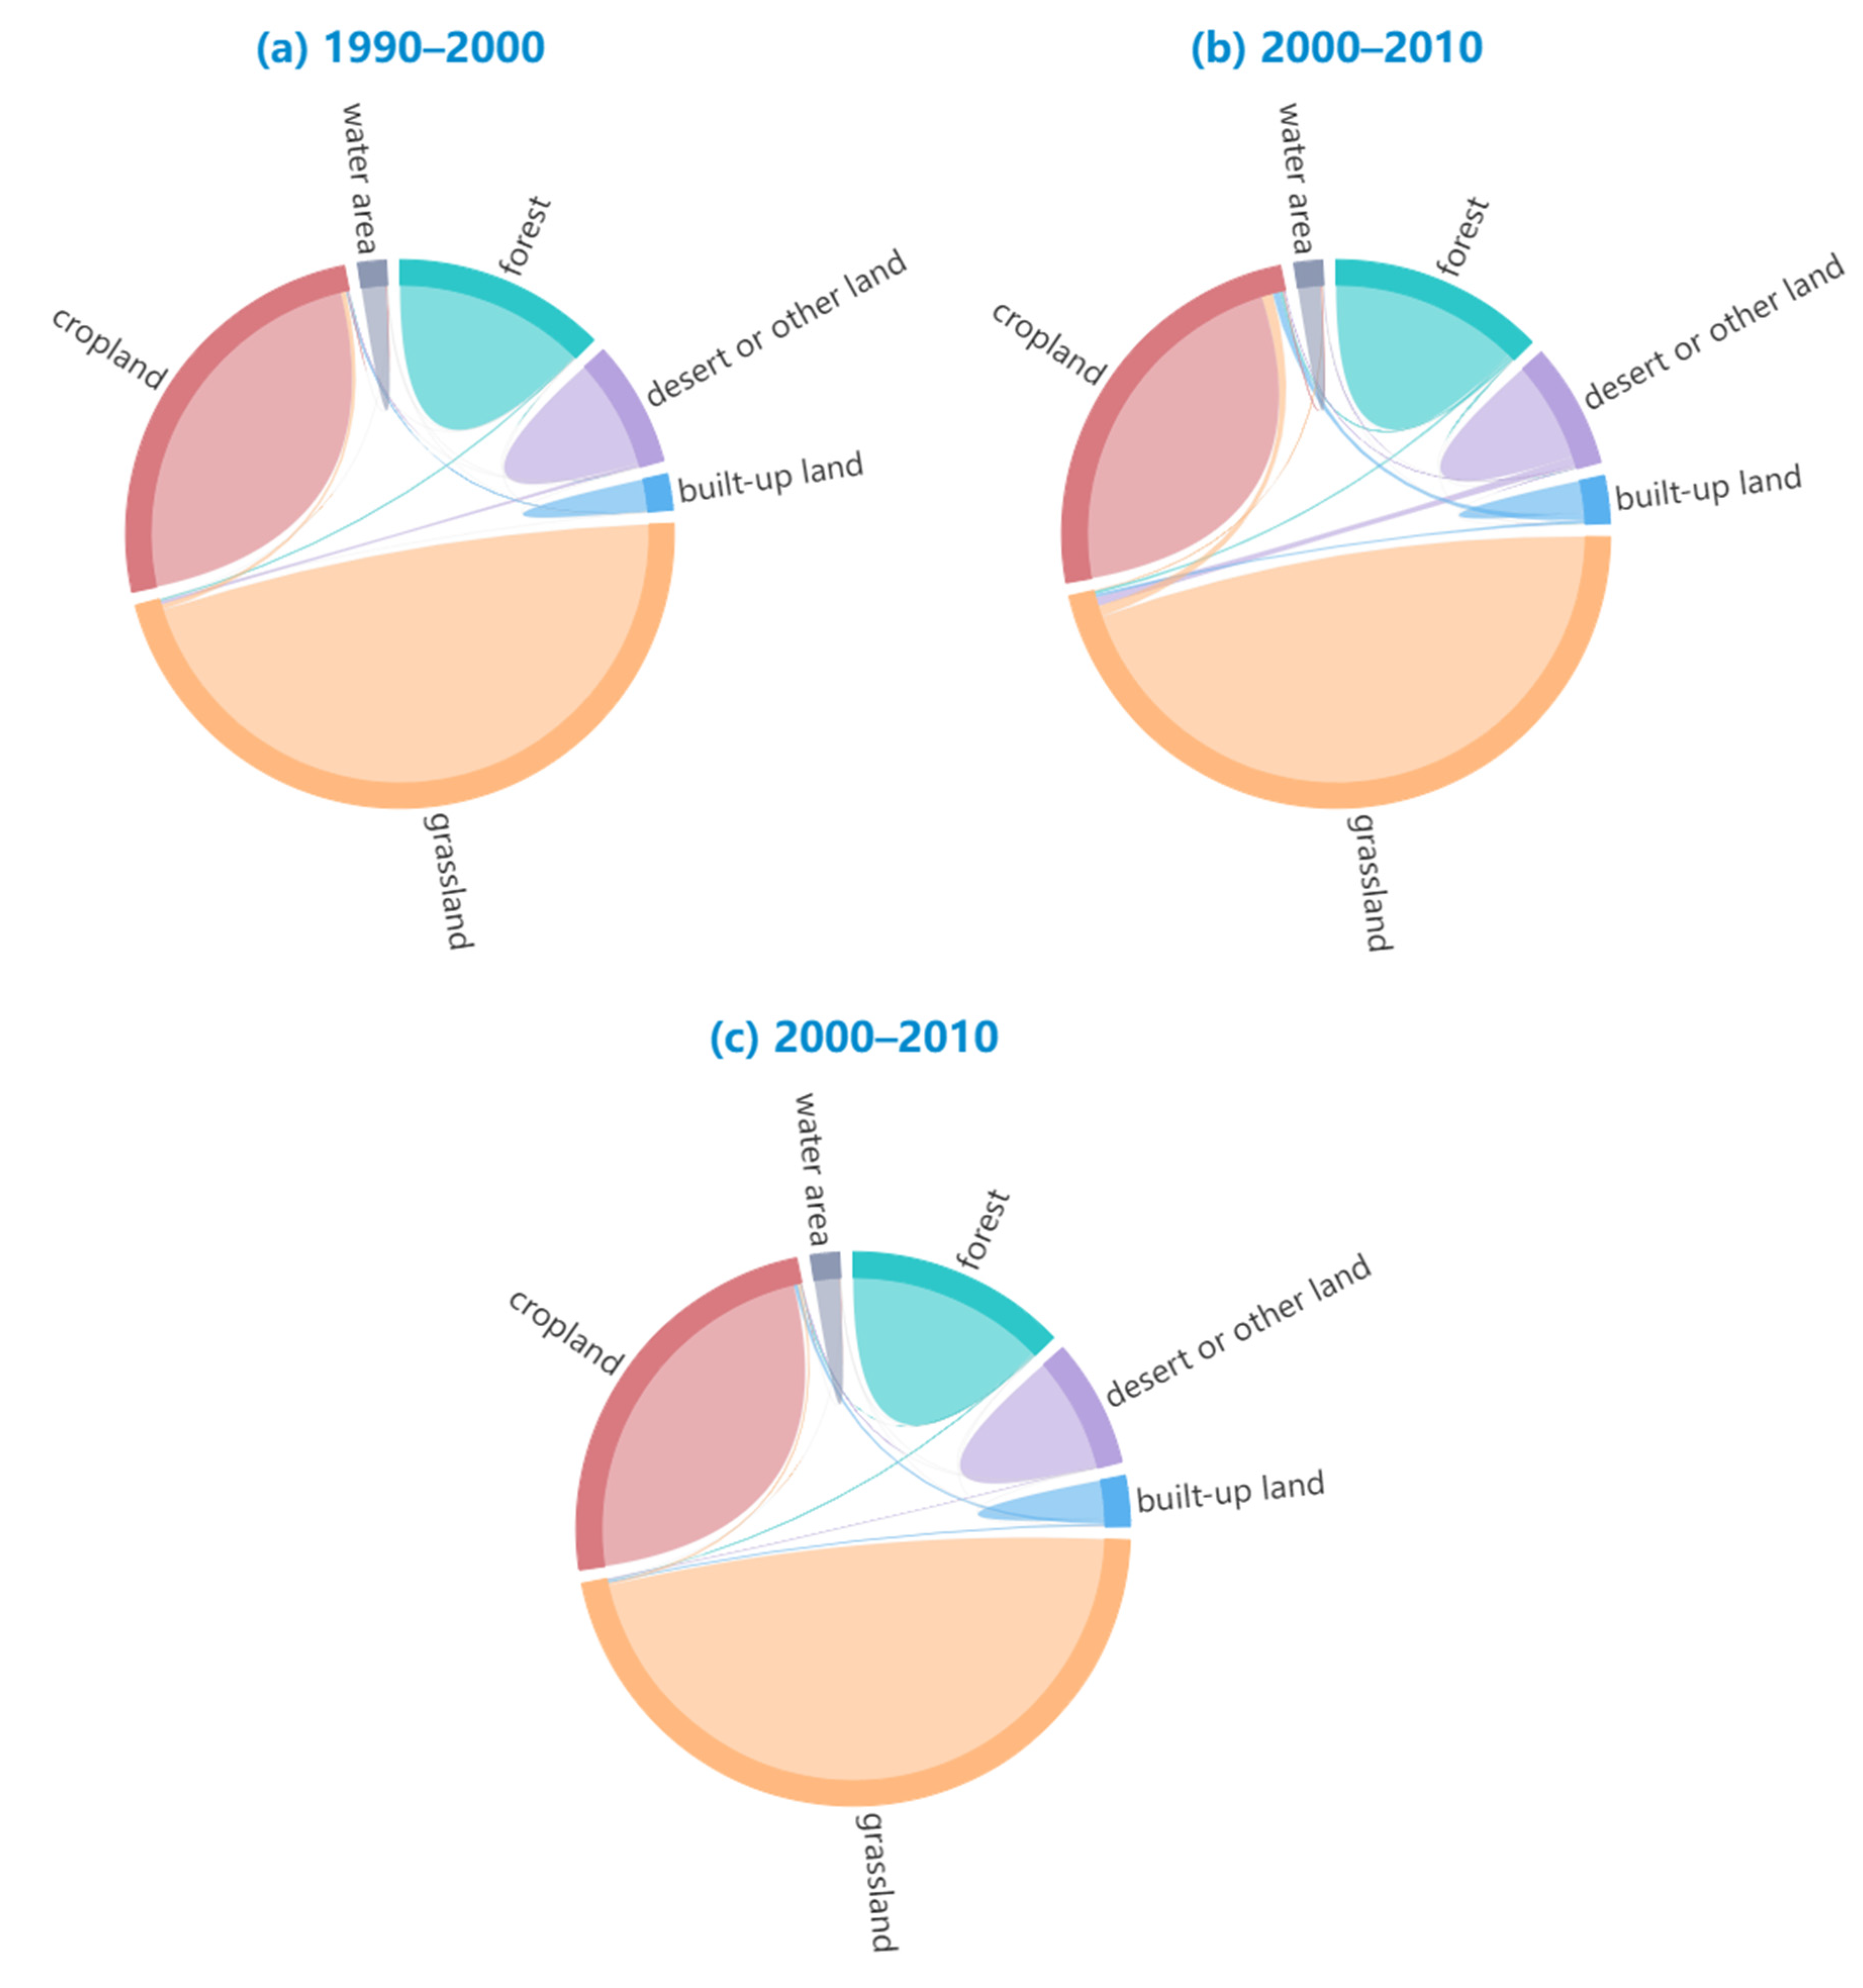
In order to directly reflect the distribution patterns of land cover and the transform relationship between different land cover types, we calculated the transfer matrix of land cover and drew the transform charts of land cover type (
Figure 3) from 1990 to 2000, 2000 to 2010, and 2010 to 2020. In the
Figure 3, the arrows indicate the conversion direction of different land cover types, and the thickness arrows represent the transformed area of different land cover type. The analyzed results of transform between different land cover types show that the major change patterns of different land cove types were the mutual conversion between grassland and desert or other land, grassland and cropland, and that between cropland and built-up land.
Between 1990 and 2000 (
Table 3), there was 1211.09 km
2 water area transferred to other land cover types, accounting for 8.51% of the area of water area in 1990. There was 3246.23 km
2 desert or other land transferred to other land cover types, accounting for 5.20% of the area of desert or other land in 1990. The transformed area of built-up land is less than that of other land cover types, which was only 5 km
2. Among them, 75.05% of the desert or other land type land was transformed to grassland, and 74.36% of the forest was converted to grasslands.
Between 2000 and 2010 (
Table 4), there was 1671.11 km
2 water area transferred to other land cover types, accounting for 12.17% of the area of water area in 2000. There was 6627.46 km
2 desert or other land transferred to other land cover types, accounting for 10.88% of the area of desert or other land in 1990. Additionally, there was 19,036.32 km
2 cropland transferred to other land cover types, accounting for 9.02% of the area of cropland in 2000. The transformed area of built-up land is less than that of other land cover types, which was only 1400.09 km
2. Among them, 67.42% of the desert or other land was transformed to grassland, and 59.64% of the built-up land was converted to cropland.
Between 2010 and 2020 (
Table 5), there was 602.04 km
2 water area transferred to other land cover types, accounting for 4.27% of the area of water area in 2010. There was 6178.43 km
2 cropland transferred to other land cover types, accounting for 3.05% of the area of cropland in 2010. The transformed area of built-up land is less than that of other land cover types, which was only 400.02 km
2. Among them, 85.00% of the built-up land was transformed to cropland, and 67.43% of the cropland was converted to built-up land.
The mutual converted types of land cover were mainly occurred between cropland, grassland, forest, desert, or other land during the three periods from 1990 to 2000, 2000 to 2010, and 2010 to 2020, while most of the increased built-up land was mainly transformed from cropland.
3.5. Drivcing Forces of Land Cover Change
3.5.1. Single Factor Analysis
In this study, the change of land cover type is taken as the dependent variables, and the elevation, precipitation, temperature, NDVI, population density, and GDP were taken as the independent variables.
According to the factor detector, the influence of each factor on the land cover change in the YRB was revealed, and the
q value of each driving factor was not very high. The detected results were list in
Table 6. Take 2020 as an example. The order of explanatory power of land cover drivers was population density > elevation > temperature > precipitation > GDP > NDVI. The population density is the first dominant factor affecting the land cover change in the YRB area, which average contribution rate is up to 0.264; the second dominant factor is elevation, with an average contribution rate of 0.234. So, human activities, such as regional urbanization processes, as reflected by population density, are the most important economic and social factors affecting land cover change, and the explanatory power of elevation and temperature factors on land cover exceeds 20%, which is the natural factor that causes the main impact, while the explanatory influence of individual factors, such as average annual precipitation, NDVI, and GDP, is relatively small.
3.5.2. Detection of Factor Interactions
The interaction detector assesses whether the explanatory powers of two factors are enhanced, weakened, or independent of each other. First, the q values of two factors X1 and X2 for Y were calculated (q(X1) and q(X2)). Then, the q value of interaction was calculated (q(X1 ∩ X2)) and compared with q(X1) and q(X2) to indicate the interaction type between two variables.
Taking the 2010 results as an example (the results of 1990, 2000, and 2020 are the same as their mode of action), green represents bilinear enhancement of two factors, i.e.,
q(
X1 ∩
X2) > Max (
q(
X1),
q(
X2)), yellow represents nonlinear enhancement of two factors, i.e.,
q(
X1 ∩
X2) > (
q(
X1) +
q(
X2)), and unfilled numbers represent the force of single factor action. It can be seen from the interaction detection results (
Table 7), the interaction of each factor shows a nonlinear enhancement and two-factor enhancement, and the overall performance is that the interaction of each factor is enhanced, indicating that there is significant coordination and correlation between the factors. Combining the results of single-factor detection and multi-factor interaction detection, we can see that the
q value of any two driving factors on the spatial distribution of land cover is higher than that of a single driving factor.
The six groups of interaction factors with strong explanatory power for land cover change were elevation ∩ precipitation > elevation ∩ NDVI > temperature ∩ NDVI > precipitation ∩ temperature > elevation ∩ population density > population density ∩ temperature. The multi-factor interaction analyzed results show that land cover change in YRB was most driven by the interaction between elevation and precipitation, and the second influence on land cover change was the interaction between elevation and NDVI in YRB area from 1990 to 2020, which indicates the joint driving influence of natural factors and human factors could be better to express the explanatory power of the distribution change of land cover.
3.5.3. Significant Differences between Factors
Taking 2010 as an example (
Table 8), we use the ecological detector to judge whether the effects of the two factors on land cover changes are significantly different at a confidence level of 0.95. Y represents that there is a significant difference in the effects of the two factors on land cover changes, and N represents no significant difference.
Except for temperature and elevation, GDP and precipitation, and GDP and NDVI, most factors have significantly different effects on land cover change (
Table 8). We found that the factor population density, which had greater contributions, all had statistically significant differences with other factors. In addition, elevation and temperature are also basically statistically different from other factors. Therefore, population density is the most critical factor affecting land cover change in the YRB area, followed by factors such as elevation and temperature.
Through single-factor detection analyzations, the land cover change in the YRB area was significantly driven by the factors of population density, elevation, and temperature. The multi-factor interaction detection analysis shows that the influence degree of any two driving factors interaction was greater than that of a single factor (
Table 6 and
Table 7). Moreover, the statistical test analysis of the ecological detector indicates that the population density, elevation, and temperature show the statistically significantly difference from other factors. The single factor detection and factor interaction detection show that the larger the
q value of a single factor, the larger the
q value of the corresponding factor interaction [
36]. Therefore, it can be speculated that the change of land cover was driven by multiple factors.
4. Discussion
Since the 1990s, large-scale reclamation in the YRB area has led to a series of ecological and environmental problems, such as soil erosion, local ecosystem degradation, and reduced water conservation functions [
37]. The study of land cover change in the YRB is an important basis for the rational development and utilization of land resources and ecological restoration in the YRB area. Based on the land cover data of the YRB in 1990, 2000, 2010, and 2020, this study introduced a land cover dynamic index model and a land cover transition matrix to quantitatively analyze the dynamic changes of land cover and explicate the change trend of land cover in the YRB area since 1990. The results show that grasslands, forests, and croplands are the three major land cover types in the YRB area, and their area covered about 85% of the whole area, in which the area of grassland is the largest. In general, the dominated land cover type in UA, MA, and DA were grasslands, croplands, and croplands, respectively.
In recent years, Chinese government has paid more and more attention to improving the ecological environment, especially in the YRB area. The implementation of ecological protection policies (such as GGP program) was the leading driving force for the conversion of cropland to forest and grassland in China. Due to rebuilding a graceful northwest with green mountains and clean water, a national arable land reserve program (called the GGP) of China was released in 1999. The GGP program is considered one of the largest conservation projects in the world [
38], in which the cropland with a slope more than 25° were transformed to woodland and grassland. By analyzing the changes in land cover from 1990 to 2020, we found the area of forest and grassland has been increasing since 2000, while the area of cropland has decreased; there were many transfers between croplands, forests, and grasslands, which indicates that the policy has played an important role in the YRB area and has greatly promoted the improvement of the ecological environment and the sustainable development of the region.
With the acceleration of China’s industrialization and urbanization, the distribution of land cover has undergone a series of changes. Built-up land has continued to increase, from less than 2.14% in 1990 up to 3.57% in 2020, even occupying some cropland. For this reason, the Chinese government has formulated a series of land cover policies to deal with these problems and challenges, including “requisition-compensation balance of arable land” and “increasing vs. decreasing balance of urban-rural built land” [
39], which are aimed at reducing cropland occupied by built-up land and protecting cropland. Through the implementation of these policies, part of the rural built-up land has been reclaimed into cropland, which has promoted the conversion of built-up land and unused land into cropland. However, the implementation of these policies has not effectively slowed down the rate of urban expansion taking up cropland. Our research results show that there was 4166.29 km
2 of cropland converted to built-up land, accounting for 55.16% of the total area converted to built-up land during the period from 2010 to 2020. Obviously, the implementation of land management policies has not effectively prevented the expansion of built-up land. While urban expansion occupies cropland, China has also emphasized the replenishment of cropland through the integration of vacant residential land, industrial and mining land, and other land cover types.
Land cover change is influenced by the interaction of multiple drivers. This paper explicitly analyzes the driving forces of social and natural factors on land cover changes, based on GeoDetector. Through single-factor detection, the dominant factor of land cover change was population density, with an average contribution rate of 0.264. Additionally, the population growth has long been considered a major factor leading to land cover changes [
40]. The detection of significant differences between the driving factors by the ecological detector shows that there were statistically significant differences between population density and other factors. The second most dominant factor in the spatial distribution of land cover is elevation. As altitude increases, NDVI decreases, and human activity decreases, resulting in spatial differences in land cover. In addition, the analysis of single factor driving also conducts further research on the spatial distribution of land cover from the aspect of multi-factor interaction. From the multi-factor interaction test results, it can be concluded that land cover change is most driven by the interaction between elevation and precipitation; the second influence on land cover change is the interaction between elevation and NDVI. Through the joint driving influence of natural factors and human factors, the explanatory power of the spatial distribution of land cover is stronger.
The spatial distribution of land cover was influenced by many driving factors including nature, society, and human [
22,
41,
42]. Thus, it should be pay more attention to focus on understating the impact of human activities on land cover change, especially in the ecologically fragile areas of YRB, which is an important basis for promoting social economic development and maintaining the balance tween human needs and ecological environment health. Moreover, policy influence on land cover change should be considered in the future work.
5. Conclusions
Based on the land cover data of the YRB in 1990, 2000, 2010, and 2020, the methods of dynamic degree index, transfer matrix, and GeoDetector were introduced to explicate the spatiotemporal change of land cover and analyze their driving forces in the YRB area. The results show that, from 1990 to 2020, the grassland, cropland, and forest were the major land cover type in the YRB area. The dominated type of land cover in UA, MA, and DA were grassland, cropland, and cropland, respectively. The area of forest and grassland showed an increasing trend, area of cropland showed a continual decreasing trend, and area of built-up land showed a continual increased trend science 2000. Mutual conversions between cropland, grassland, forest, desert, or other land were the transform patterns of land cover change in the YRB area during the period from 1990 to 2020. Most of the built-up land was transferred from cropland, especially in the period from 2010 to 2020. In addition, the analyzed of driving factors on land cover change indicates that population density was the key influence factor, followed by the impact of elevation and temperature on land cover change in the YRB area during the period from 1990 to 2020.


