Article

Multi-Scenario Simulation of Land-Use Change and Delineation of Urban Growth Boundaries in County Area: A Case Study of Xinxing County, Guangdong Province

1
School of Geography and Remote Sensing, Guangzhou University, Guangzhou 510006, China
2
Center of GeoInformatics for Public Security, Guangzhou University, Guangzhou 510006, China
*
Author to whom correspondence should be addressed.
Land 2022, 11(9), 1598; https://doi.org/10.3390/land11091598
Submission received: 22 August 2022 / Revised: 10 September 2022 / Accepted: 15 September 2022 / Published: 17 September 2022

Abstract

:
Delineating urban growth boundaries (UGBs) by combining the land-use/land-cover (LULC) change simulation method has become common in recent studies. However, few of the existing studies have integrated multi-source big data to analyze the driving factors of LULC dynamics in the simulation. Moreover, most of previous studies mainly focused on the UGBs delineation in macroscale areas rather than small-scale areas, such as the county area. In this study, taking Xinxing County of Guangdong Province as the study area, we coupled a system dynamics (SD) model and a patch-generating land-use simulation (PLUS) model to propose a framework for the LULC change simulation and UGBs delineation in the county area. Multi-source big data such as points of interest (POIs), night-time light (NTL) data and Tencent user density (TUD) were integrated to analyze the driving forces of LULC change. The validation results indicate that the coupled model received high accuracy both in the land-use demand projection and LULC distribution simulation. The combination of multi-source big data can effectively describe the influence of human socio-economic factors on the expansion of urban land and industrial land. The UGBs delineation results have similar spatial patterns with the LULC change simulation results, which indicates that the proposed UGBs delineation method can effectively transform the LULC simulation results into available UGBs for the county area. It has been proven that the proposed framework in this study is effective for the LULC change simulation and UGBs delineation in the county area, which can provide insight on territorial spatial planning in the county area.

1. Introduction

Since the Reform and Opening-Up policy in 1978, China has been undergoing intense urbanization. Urban sprawl that occurs from the fast development of the economy and population has become a huge challenge for urban planning and urban sustainable development [1,2]. Similar to other developing countries, in China, the urban sprawl is also inevitable at the expense of occupying essential ecological resources (farmland, forestland or grassland) that contributes significantly to the urban environment from development [1,3,4,5]. This phenomenon has become more serious due to the lack of scientific and efficient approaches for the urban planner to deal with this problem [3]. In order to manage the disorderly urban expansion, many practical works have been proposed in previous research [6,7,8,9]. Among these, the delineation of urban growth boundaries (UGBs) is suggested to be an efficient method to assist urban planners to guide the direction of urban land expansion [10,11,12]. The initial spatial pattern of the UGBs can be traced back to the city green belt in the 1930s, which was well-employed in the later urban planning of London [13]. Jun employed UGBs for the optimization of spatial patterns to restrain disorderly urban sprawl in Portland [14]. After that, a growing volume of research has paid more attention to the use of UGBs to assist the urban planner in constructing scientific urban land policies, to restrict future urban shapes within predefined boundaries [15,16,17].
Prior methods to delineate UGBs can be summarized into two major categories, including the approaches dependent on land-use/land-cover (LULC) suitability evaluation, and the approaches based on future LULC change simulation [1,18]. The former can be easily conducted by considering a series of native features (e.g., location, transportation and natural conditions) and have been largely applied in previous studies [19,20]. Nevertheless, evaluating the suitability of LULC requires a comprehensive understanding of the research area, because these factors can implicitly drive urban change at different spatial–temporal scales in a complex way [16]. Moreover, the determination of the weight of each factor in the scoring process is mainly based on the personal experience of planners, which may sometimes lead to a biased conclusion [21]. Hence, some UGBs delineation approaches based on LULC change simulation models have emerged accordingly. Among them, cellular automata (CA) models have been employed in many studies for establishing UGBs, due to the ability to simulate LULC dynamics at each cell by considering the transition rules and neighborhood effect [22,23]. Nevertheless, the “bottom-up” CA models in previous studies are incapable of capturing the macro socio-economic effect of urban growth, which is a kind of “top-down” effect [16,24]. Generally, this macro-effect is related to the future demand of different kinds of LULCs, which is an important basis for building urban planning policies for different scenarios.
To overcome this shortcoming, a series of CA models that combine the top-down quantitative estimation methods have been proposed. These CA models generally start from the prediction of land-use demand, such as ANN-CA [25], CLUE-S [26], Logistic-CA [27] and FLUS [1,16,17,28,29]. However, these models have lack the ability to analyze the contributions of each driving factor in the LULC process and fail to operate the simulation of multiple LULC patches. Recently, the newly proposed patch-generating land-use simulation (PLUS) model not only maintains the strength of self-adaptive inertia and the competition mechanism of the existing LULC change simulation models [28], but also introduces a new data mining framework [30]. In the traditional CA models, it is necessary to use two phases of data to mine the transition rules and verify the model with new data [25,27]. However, the PLUS model further developed the CA models by using the random forest (RF) algorithm to explore the contribution of each driving force to LULC conversion in two phases of data and to generate the probability of occurrences of land-use types, enabling the user to analyze the LULC change mechanism and receive higher accuracy in the applications of the LULC change simulation [31,32,33,34,35]. However, most previous studies only considered the conventional LULC change factors such as natural factors, transportation factors and location factors when simulating LULC change [36,37]. Although some of the studies have mentioned that human socio-economic factors are non-negligible driving forces for LULC change [38], few studies have tried to further extend this work due to the lack of data that illustrates human socio-economic factors. The emergence of multi-source big data brings new opportunities to explore the influence of human socio-economic factors to LULC change. Existing studies have confirmed that multi-source big data such as nighttime light (NTL) remote sensing data and Tencent user density (TUD) data can reflect human socio-economic activities at fine spatial resolutions [39,40,41,42]. Therefore, it is necessary to integrate such valuable data to the LULC simulation to explore the underlying driving forces of LULC change, especially the influence of human socio-economic factors.
UGBs delineation by simulating future LULC change under different scenarios has become common in current research [24,43,44]. Evaluating the influence of how different planning policies affect the future spatial patterns of urban areas, UGBs examined in different scenarios can provide the urban planner with useful information about the impacts of different development policies on urban management [16]. However, in terms of exiting studies related to UGBs delineation, most of them primarily focus on the large-scale areas, such as developed cities and provincial- or national-scale areas; few of them consider the delineation of UGBs in small-scale areas such as the county area.
In contemporary China, the county is an administrative unit between the urban and the village area, which works as a bridge to connect the development of urban and rural areas. Since the 19th Communist Party of China National Congress, the county area has played an essential role in integrating urban and rural area development. Owing to the support of government policies and the tide of industrial transfer from big cities, the county area has gradually become a potential area of urbanization [21,45]. However, due to the lack of timely scientific methods to manage urban development, the disorderly urban expansion in county areas may convert essential natural land into construction land, which may lead to irreversible ecological loss, such as the reduction of biological diversity [46], the weakening of ecological functions [47] and the instability of the ecosystem structure [48]. Hence, in order to realize the balance of development and environmental protection in county areas during urbanization, it is of great significance to delineate reasonable UGBs in advance to limit the development of unreasonable developing areas, which can effectively alleviate the increasingly acute conflict between urbanization and natural resource protection.
Therefore, we have proposed a UGBs-delineation framework for the county area by integrating multi-source big data. In this framework, we coupled the SD model, Markov model and PLUS model to simulate future LULC change of the county area. The Markov model and SD model were used to predict the land-use demand, and the PLUS model was used to simulate the LULC spatial distribution pattern. In addition, multi-source big data such as nighttime light (NTL) remote sensing images, points of interest (POIs) and Tencent user density (TUD) big data were introduced to analyze the driving factors of LULC dynamics. Eventually, based on the LULC change simulation results, the UGBs under different scenarios were delineated. The proposed framework was applied to Xinxing County of Guangdong Province. Xinxing County is one of the most rapidly developing counties in Guangdong Province and is undergoing fast urban land expansion. The goals of this study were: (1) to use multi-source big data to analyze the driving factors of LULC dynamics at the county level; (2) to construct a comprehensive simulation framework to predict the LULC dynamics of the county area from 2020 to 2035 under different developing scenarios; and (3) to delineate UGBs based on multi-scenarios to provide scientific references for the UGBs delineation of spatial–territorial planning in county areas of China.

2. Study Area and Data
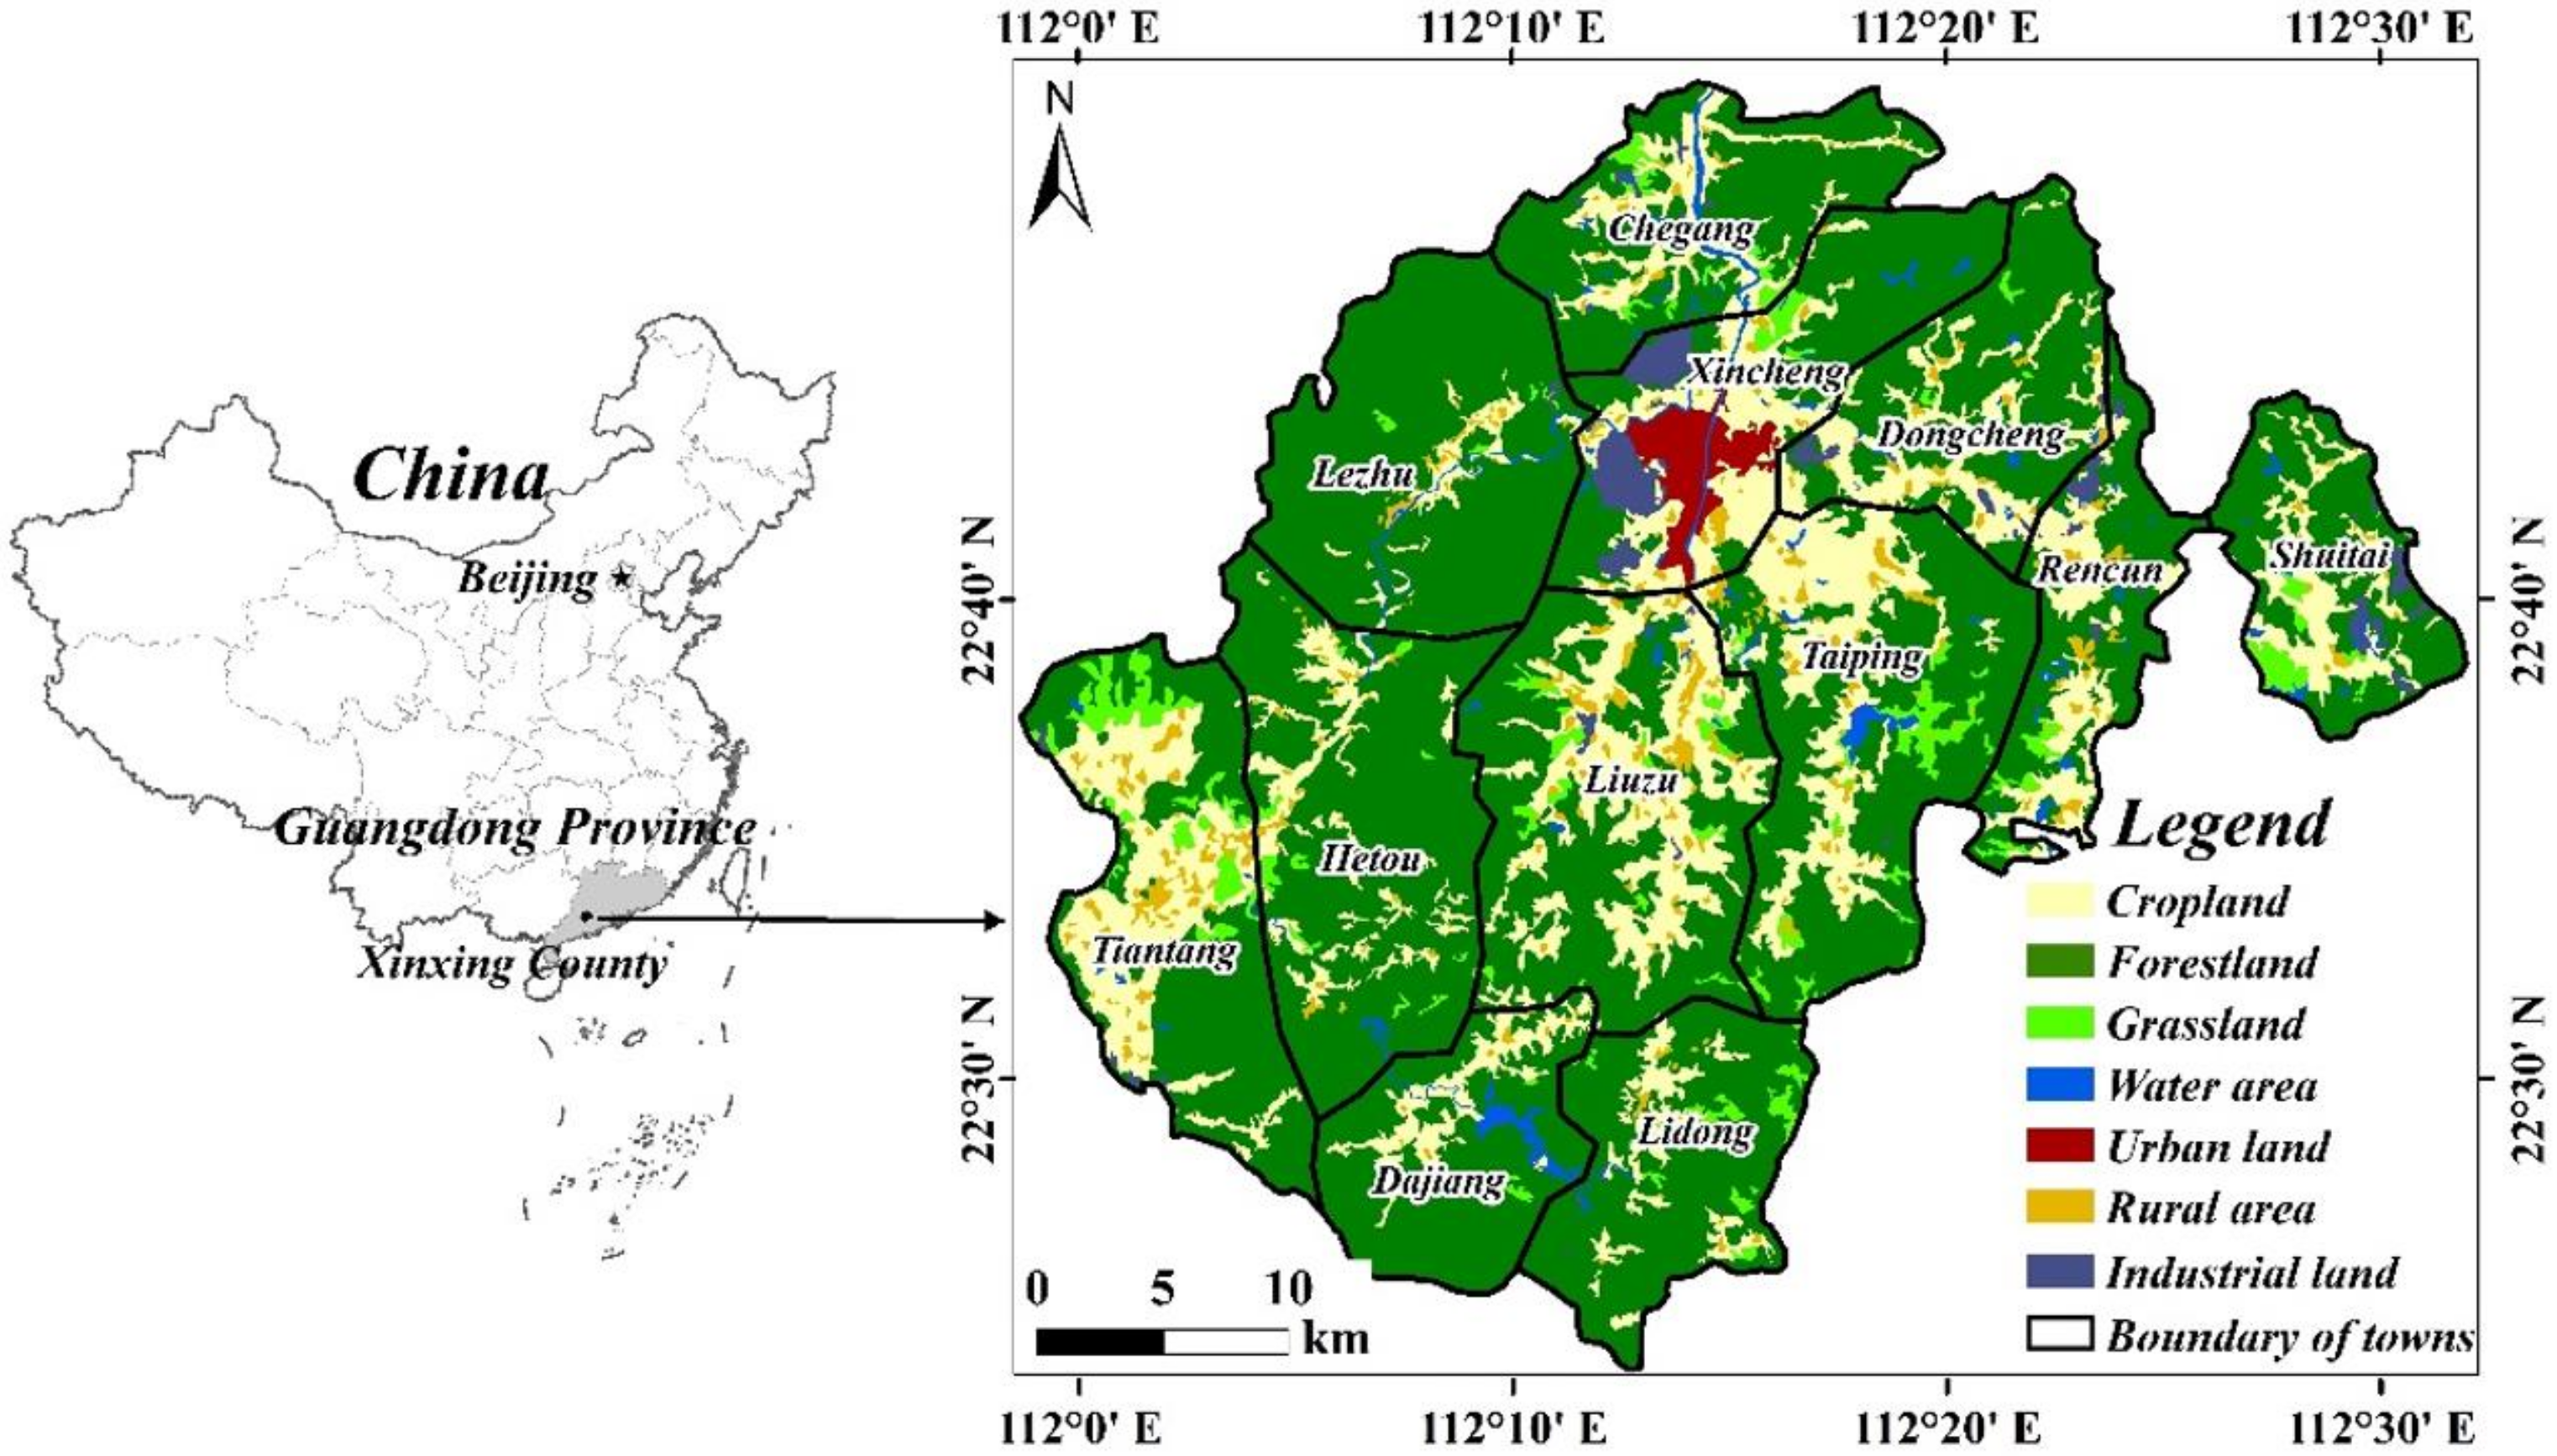
2.1. Study Area

Xinxing County is located in the southeast of Yunfu City (22°22′–22°50′ N, 111°57′–112°31′ E) in the western–central area of Guangdong Province, China (Figure 1). The total area of the county is 1502.77 km2, of which 89% is forestland and farmland and 6% is construction land, including urban land and industrial land. Xinxing County is one of the rapidly urbanizing areas in Guangdong Province, and its economy has developed rapidly over the last decades. The per capita gross domestic product (GDP) of Xinxing County grew from 27,688 to 63,868 Yuan RMB (according to the Yunfu Statistical Yearbook, 2020). The urban population grew from 76,846 to 221,905, and the urbanization level increased from 17.94% to 46.23%. According to the classification of county leading function types [49], Xinxing County is a leading agricultural county of Yunfu City. With socio-economic development, the area of urban land and industrial land of Xinxing County has expanded from 11.92 km2 and 16.63 km2 to 16.33 km2 and 25.62 km2 between 2015 and 2020, which implies an average annual expansion rate of 36.97% and 54.1%, respectively. However, the fast development of the construction land (urban land and industrial land) comes at the expense of the decreasing area of farmland and forestland by 2.78% and 1.97%, posing a threat to the sustainable development of food safety and ecological safety. Hence, delineating UGBs reasonably to control the direction of urban expansion effectively and protect natural resources are the main goal to be accomplished during the process of urbanization of Xinxing County.

2.2. Data Sources and Pre-Processing
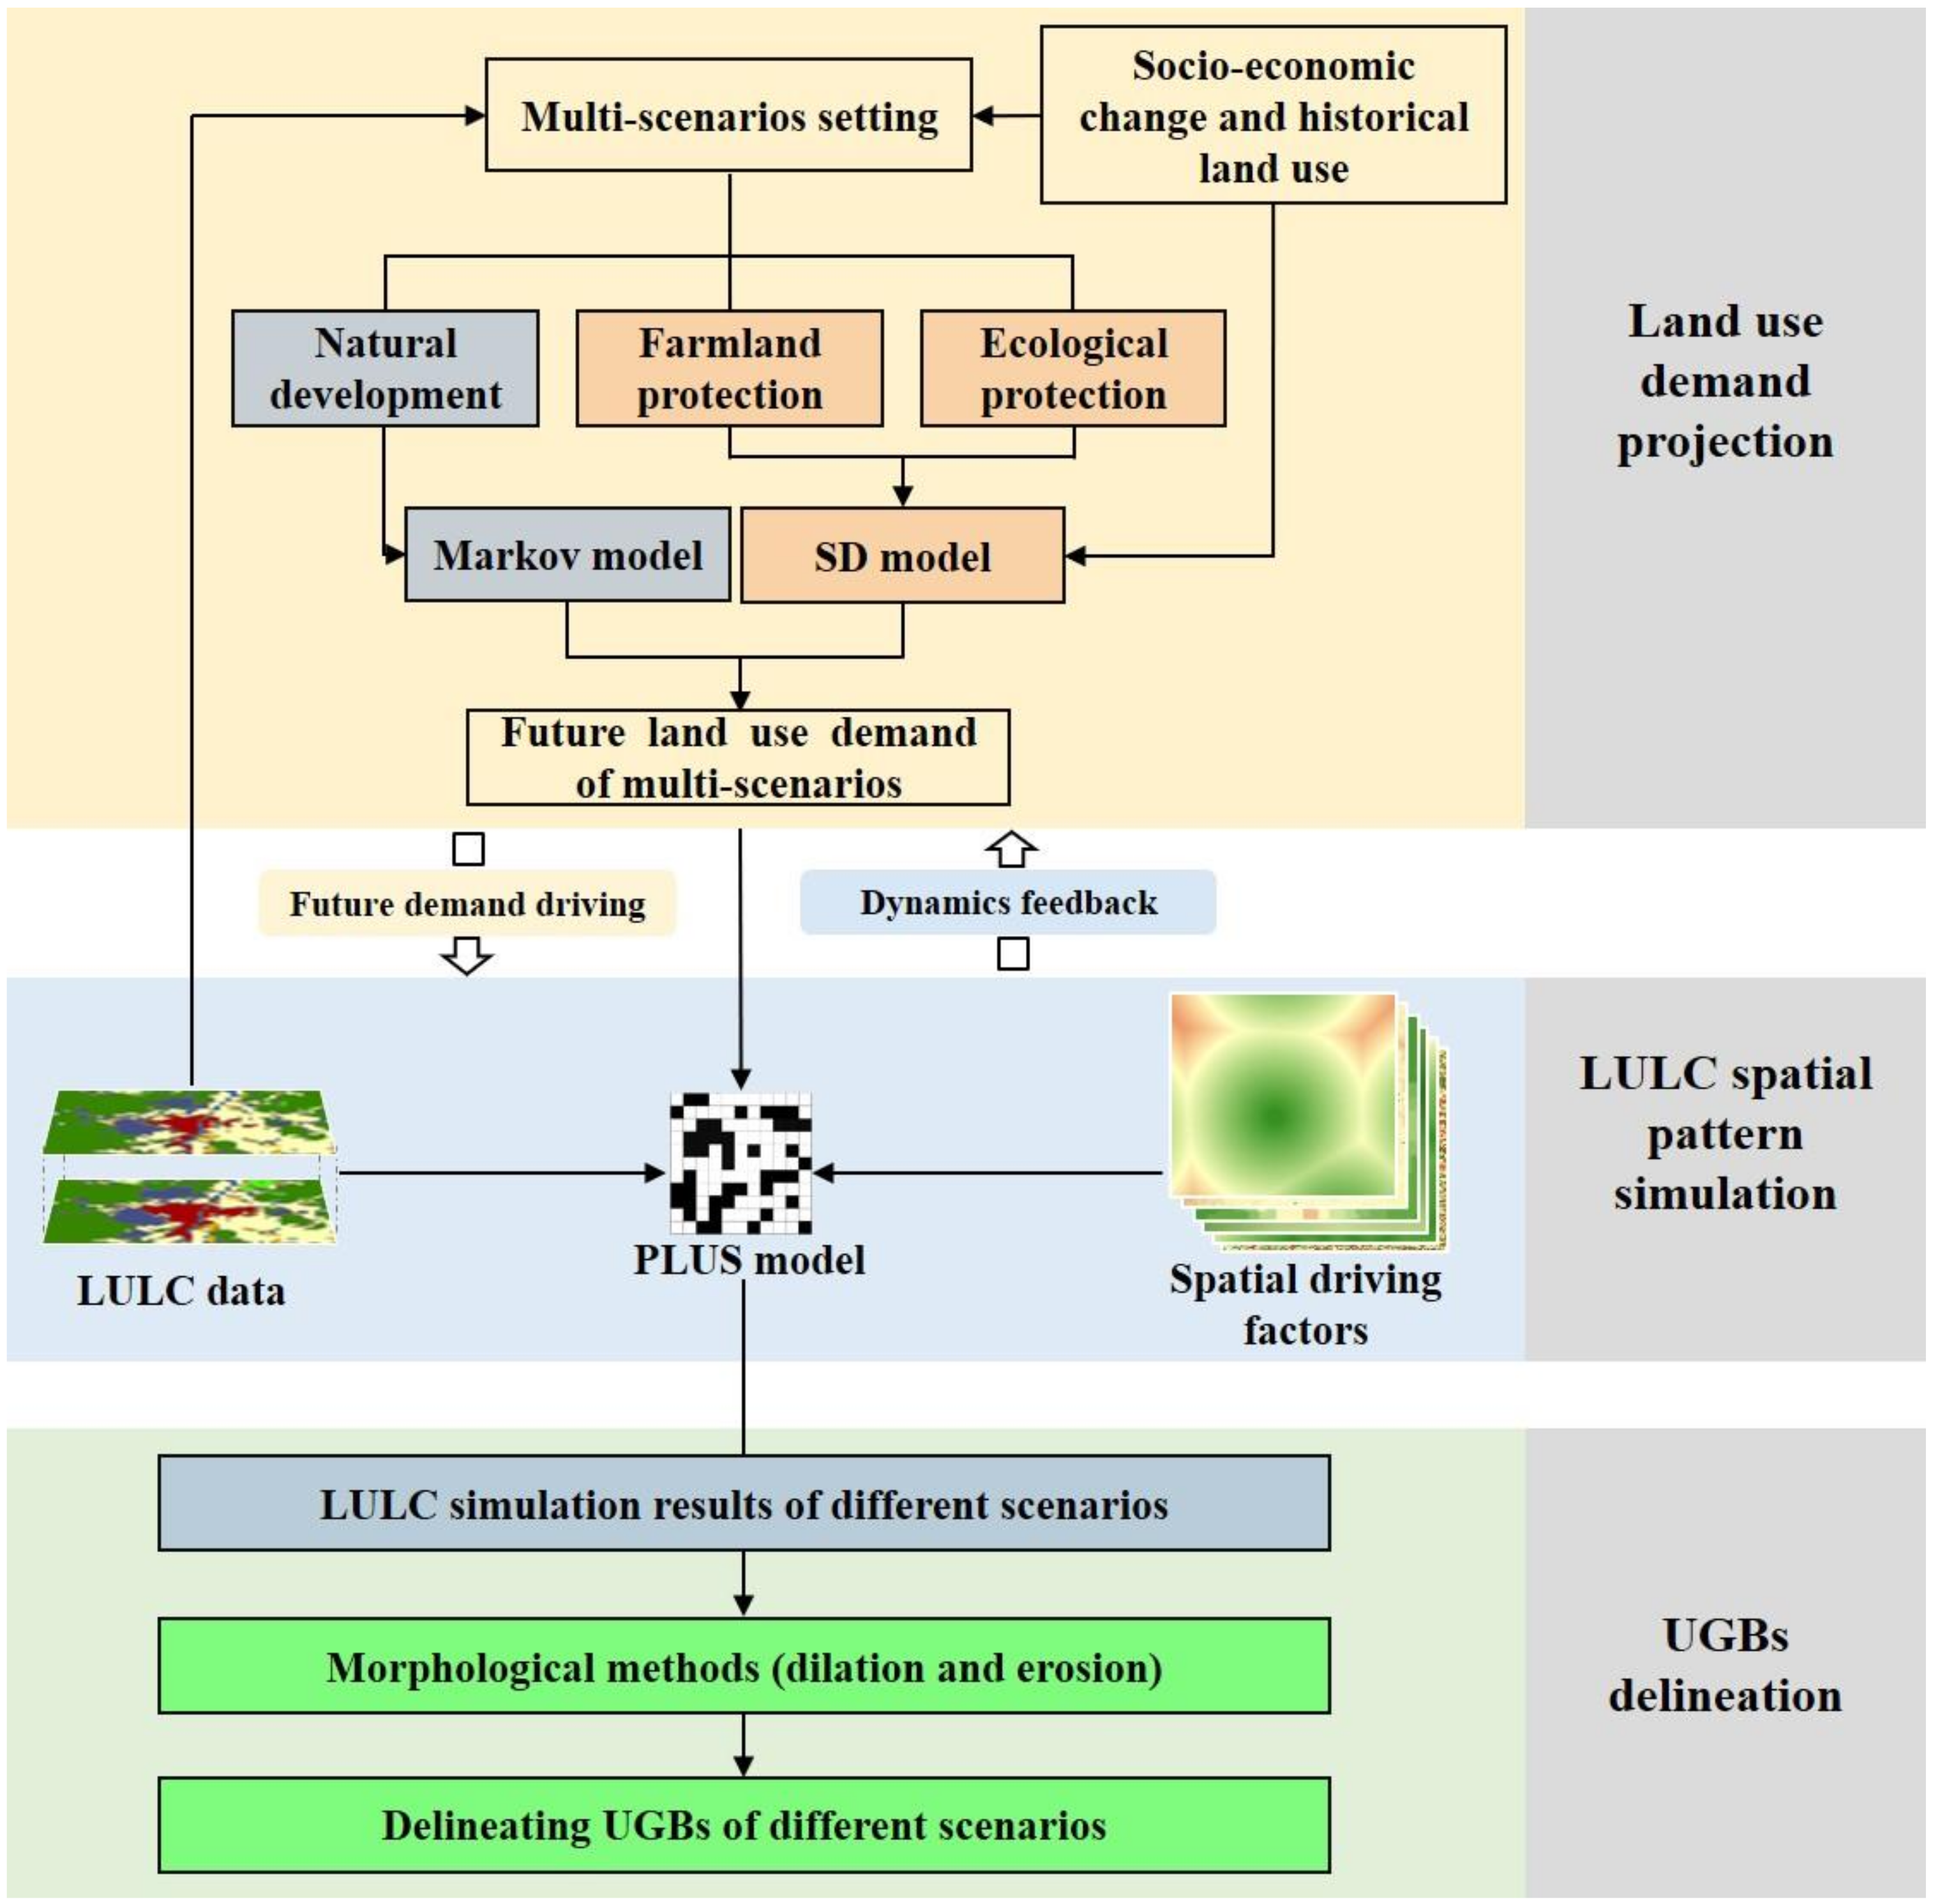
Several datasets were used in this study according to the different requirements of the models (Table 1). The data used in the SD model include land-use data and socio-economic data. The land-use data of Xinxing County for 2015 and 2020 used in this study were obtained from the Geographical Information Monitoring Cloud Platform. In this study, we reclassified the original land-use data into seven categories: farmland, forestland, grassland, water, urban land, rural area and industrial land. The socio-economic data such as population, GDP and food production were obtained from the Yunfu City Statistical Yearbook from 2015 to 2020. The land-use data used in the Markov model are the same as that used in the SD model. The PLUS model mainly requires land-use data, driving factors data and spatial restricted area data. The land-use data used in the PLUS model are the same data used in the SD and Markov models. The prime farmland protection areas and ecologically sensitive areas are the main dataset used for constructing different simulation scenarios. The former was obtained from the government of Xinxing County, and the latter was generated by the spatial analysis tool in ArcMap 10.2 [50]. As for the driving factors data (Figure 2)—other than the conventional natural, transportation and location factors—we also consider some factors that are related to human socio-economic activities by introducing multi-source big data. Previous studies have shown that nighttime light (NTL) remote sensing images have a high correlation with regional economic status [51]. Therefore, we used the NPP/VIIRS (National Polar-orbiting Partnership/Visible Infrared Imaging Radiometer Suite) data for 2019 to characterize the economic development of Xinxing County. Moreover, points of interest (POIs) of public facilities and industrial companies, acquired from the Social Big Data Platform of East China Normal University, were used to represent the densities of public facilities and industrial companies by the kernel density tool of ArcMap 10.2. Owing to the features of high spatio-temporal resolution and relevance to human activity, Tencent user density (TUD) big data has the capability to reflect the fine-grained urban population information. According to the findings of Huang et al. [39], annual TUD data can be synthesized by sampling holiday and non-holiday TUD data. In this study, we used synthesized TUD data for 2019 to characterize the population density. The spatial data involved above were processed into raster data with a resolution of 30 m using ArcMap 10.2.

3. Methodology

In this study, we proposed the framework of UGB delineation for the county area. The framework includes: (1) land-use demand projection, (2) LULC spatial pattern simulation and (3) future UGBs delineation. The flowchart of the proposed framework is shown in Figure 3.

3.1. Land-Use Demand Projection

Different development scenarios will influence the direction of land-use projection. According to the scenario setting in previous studies [36,37] and specific regional LULC characteristics, we set up three different scenarios, which include a natural development (ND) scenario, farmland protection (FP) scenario and ecological protection (EP) scenario (Table 2). Since the LULC of the ND scenario is only affected by the law of historical LULC, we used the Markov chain model to predict the land-use demand of this scenario, while the land-use demand of the other two scenarios would be predicted by the SD model.

3.1.1. Markov Chain Model
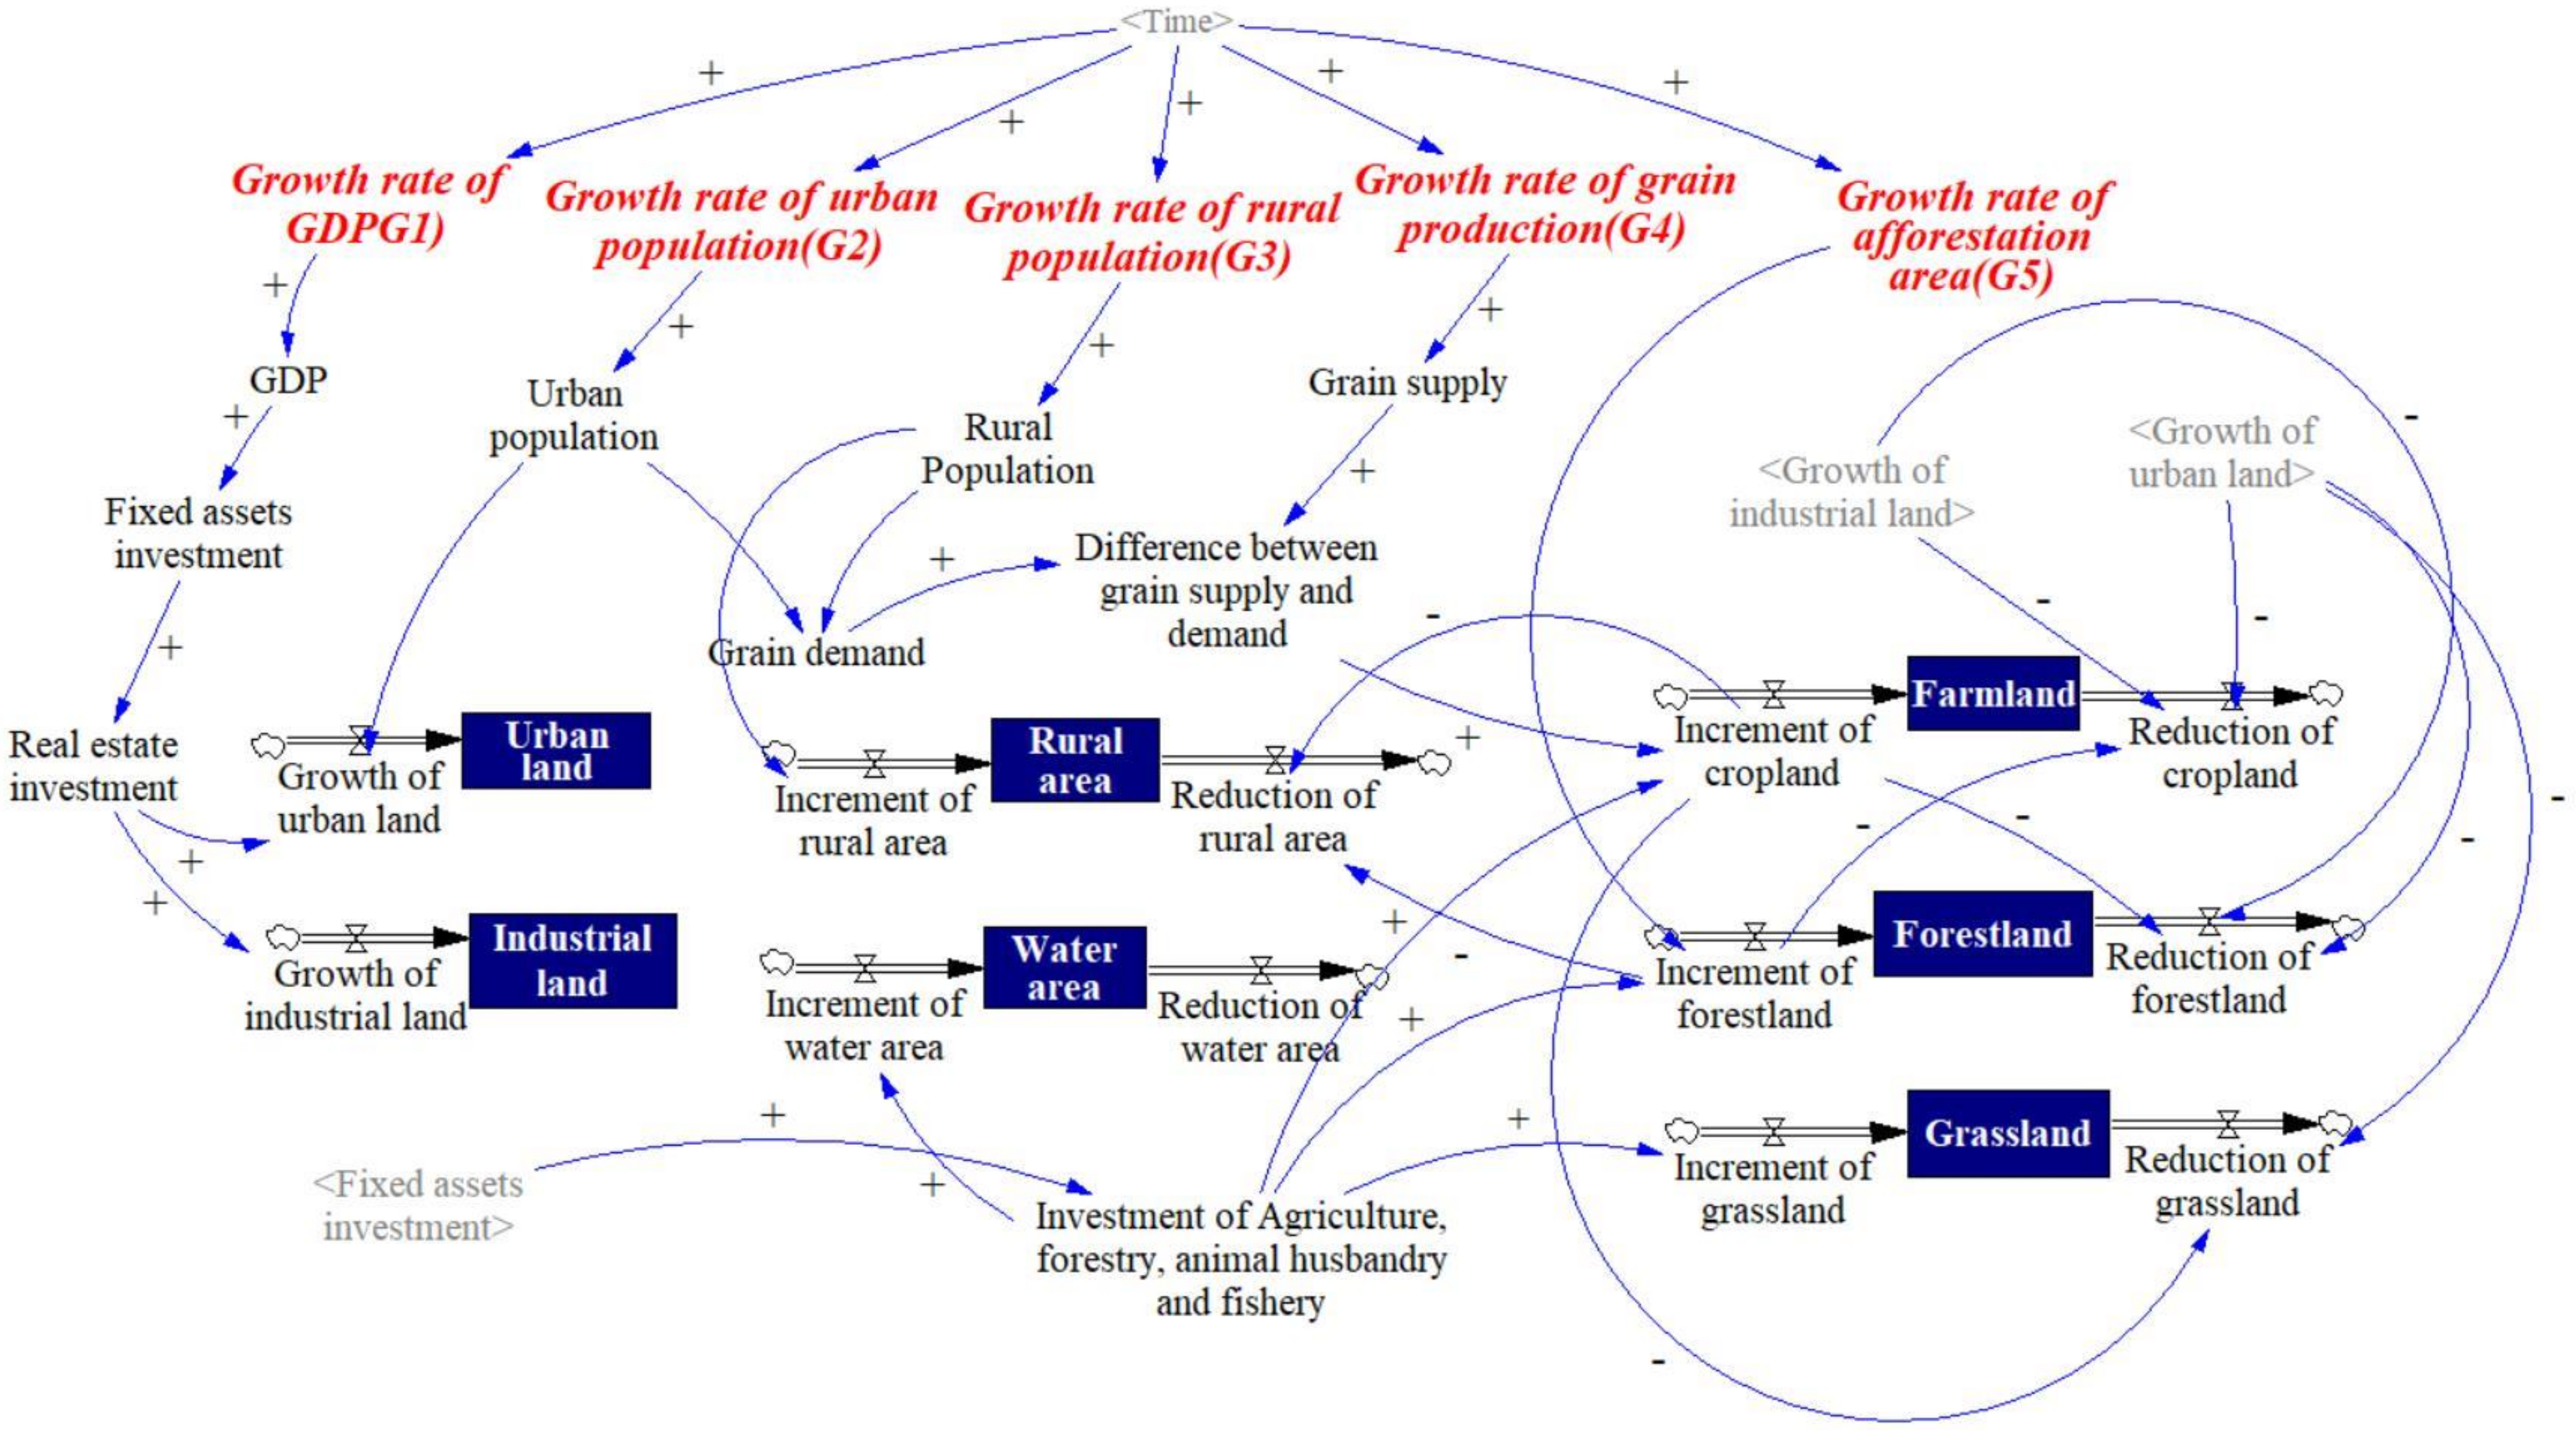
As for the state of the objective in the Markov chain model, its current state is only determined by the previous state [52]. In this study, the demand at t + 1 of the ND scenario relied on the land use at t . During the prediction, the long-time series information was abandoned, and two recent periods (2015 and 2020) of land-use data were used for forecasting. The rule is as follows:
A t + 1 = P i × A t
where A t + 1 and A t are the amounts of land-use type k at time t + 1 and t , and P i refers to the transfer probability matrix of land-use type k at different times.

3.1.2. SD Model

The SD model is capable of predicting both the liner and non-linear relationships between land-use demand and socio-economic factors [36]. We define seven types of land use as the horizontal variables in this model. In addition, several socio-economic factors were selected as auxiliary variables. Finally, depending on the historical law of auxiliary variables change, the future land-use demand of the FP and EP scenarios were projected by adjusting the annual growth rate of the control variables. The SD model of this study was constructed using Vensim PLE software (Figure 4)

3.2. Future LULC Change Simulation

LULC simulation is the basis for the future UGBs delineation. In this study, we employed the PLUS model as the tool to simulate future LULC. The PLUS model includes two important modules: land expansion analysis strategy (LEAS) and a CA model based on multi-type Random Seeds (CARS) [30]. The LEAS module determines the development probability of each land-use type by using the random forest (RF) algorithm to calculate the influence of driving factors on the expansion of each land-use type. The CARS module is a CA model that integrates the impacts of macro “top-down” land- use demand and the micro “bottom-up” simulation on the land system. It incorporates an innovative multi-type random seeds generating mechanism to simulate micro-land-use competition to drive the current land-use amounts to meet the macro-demand under the comprehensive influence of self-adaptive inertia coefficient, neighborhood effect and development probability. For detailed information about the PLUS model, please refer to [30]. The overall probability O P i , k d = 1 , t of the development for land-use type k is shown below.
O P i , k d = 1 , t = P i , k d = 1 × r × u k × D k t ,   I f   Ω i , k t = 0   a n d   r < P i , k d = 1   P i , k d = 1 , t × Ω i , k t × D k t ,                                                                           a l l   o t h e r s
where P i , k d = 1 represents the probability of land-use type k being developed at pixel i , which can be obtained from the LEAS module; D k t represents the self-adaptive inertia coefficient of land-use type k , which depends on the difference between the current amount of, and future demand for, land-use type k . Ω i , k t represents the neighbourhood effect of pixel i , which is determined by the proportion of land-use of type k in the neighborhood of pixel i and the neighborhood weights. When the neighborhood effect of type k land-use is zero, the multi-type random seeds generating mechanism will generate random seeds of each land-use type through the Monte Carlo method.
Additionally, r is a random value ranging from 0 to 1, and u k is the threshold for the generating of new land-use patches of type k . To avoid the uncontrolled growth of land-use patches, CARS integrates a decreasing threshold. If the new land-use type c wins a round of competition, a decreasing threshold τ is used to assess whether the pixel i converts to this candidate land-use type.
I f K = 1 N G c t 1 K = 1 N G c t < S t e p ,   T h e n   j = j + 1
C h a n g e ,                   P i , c d = 1 > τ   a n d   T M k , c = 1 N o t   C h a n g e ,           P i , c d = 1 < τ   a n d   T M k , c = 1
where G c t 1 and G c t , respectively, denote the difference of land-use amount between the t 1 th iteration and future demand and t th iteration and future demand. S t e p is the step size required to approximate future land-use demand; δ is the decay factor of the decreasing threshold τ , with a value range of 0 to 1; r is a normally distributed stochastic value with a mean value of 1, which ranges from 0 to 2; j represents the decay step size. T M k , c is conversion matrix that decides whether land-use type k can convert to land-use type c . In the CA model, the pixels with higher overall potential are more likely to convert, but after integrating the decreasing threshold mechanism in the CA model, it allows the random land-use patches to grow freely and spontaneously under the restriction of growth probabilities, which improves the accuracy of multi-type land-use simulation.

3.3. Delineating UGBs by Morphological Method

Generally, some small and scattered construction land patches with low compactness are not suitable to designating UGBs. Hence, in this study, two morphology operators, including dilation and erosion, were used to eliminate these small patches and produce UGBs by opening and closing operation. In the open operation, the dilation step will be operated first to keep most of the boundary pixels without noise. Then, the erosion step will eliminate the isolated patches [16]. The opening operation can be shown as below:
X   °   B = X B B
In contrast, the close operation is a dilation step followed by an erosion step, which can be expressed as below:
X   ·   B = X B B
The opening and closing operations are usually applied for edge smoothing and internal filling on areas for images based on the morphological way. In this study, both of the two operations were used to process the simulated construction land patches (urban land and industrial land) to generate available UGBs.

4. Results

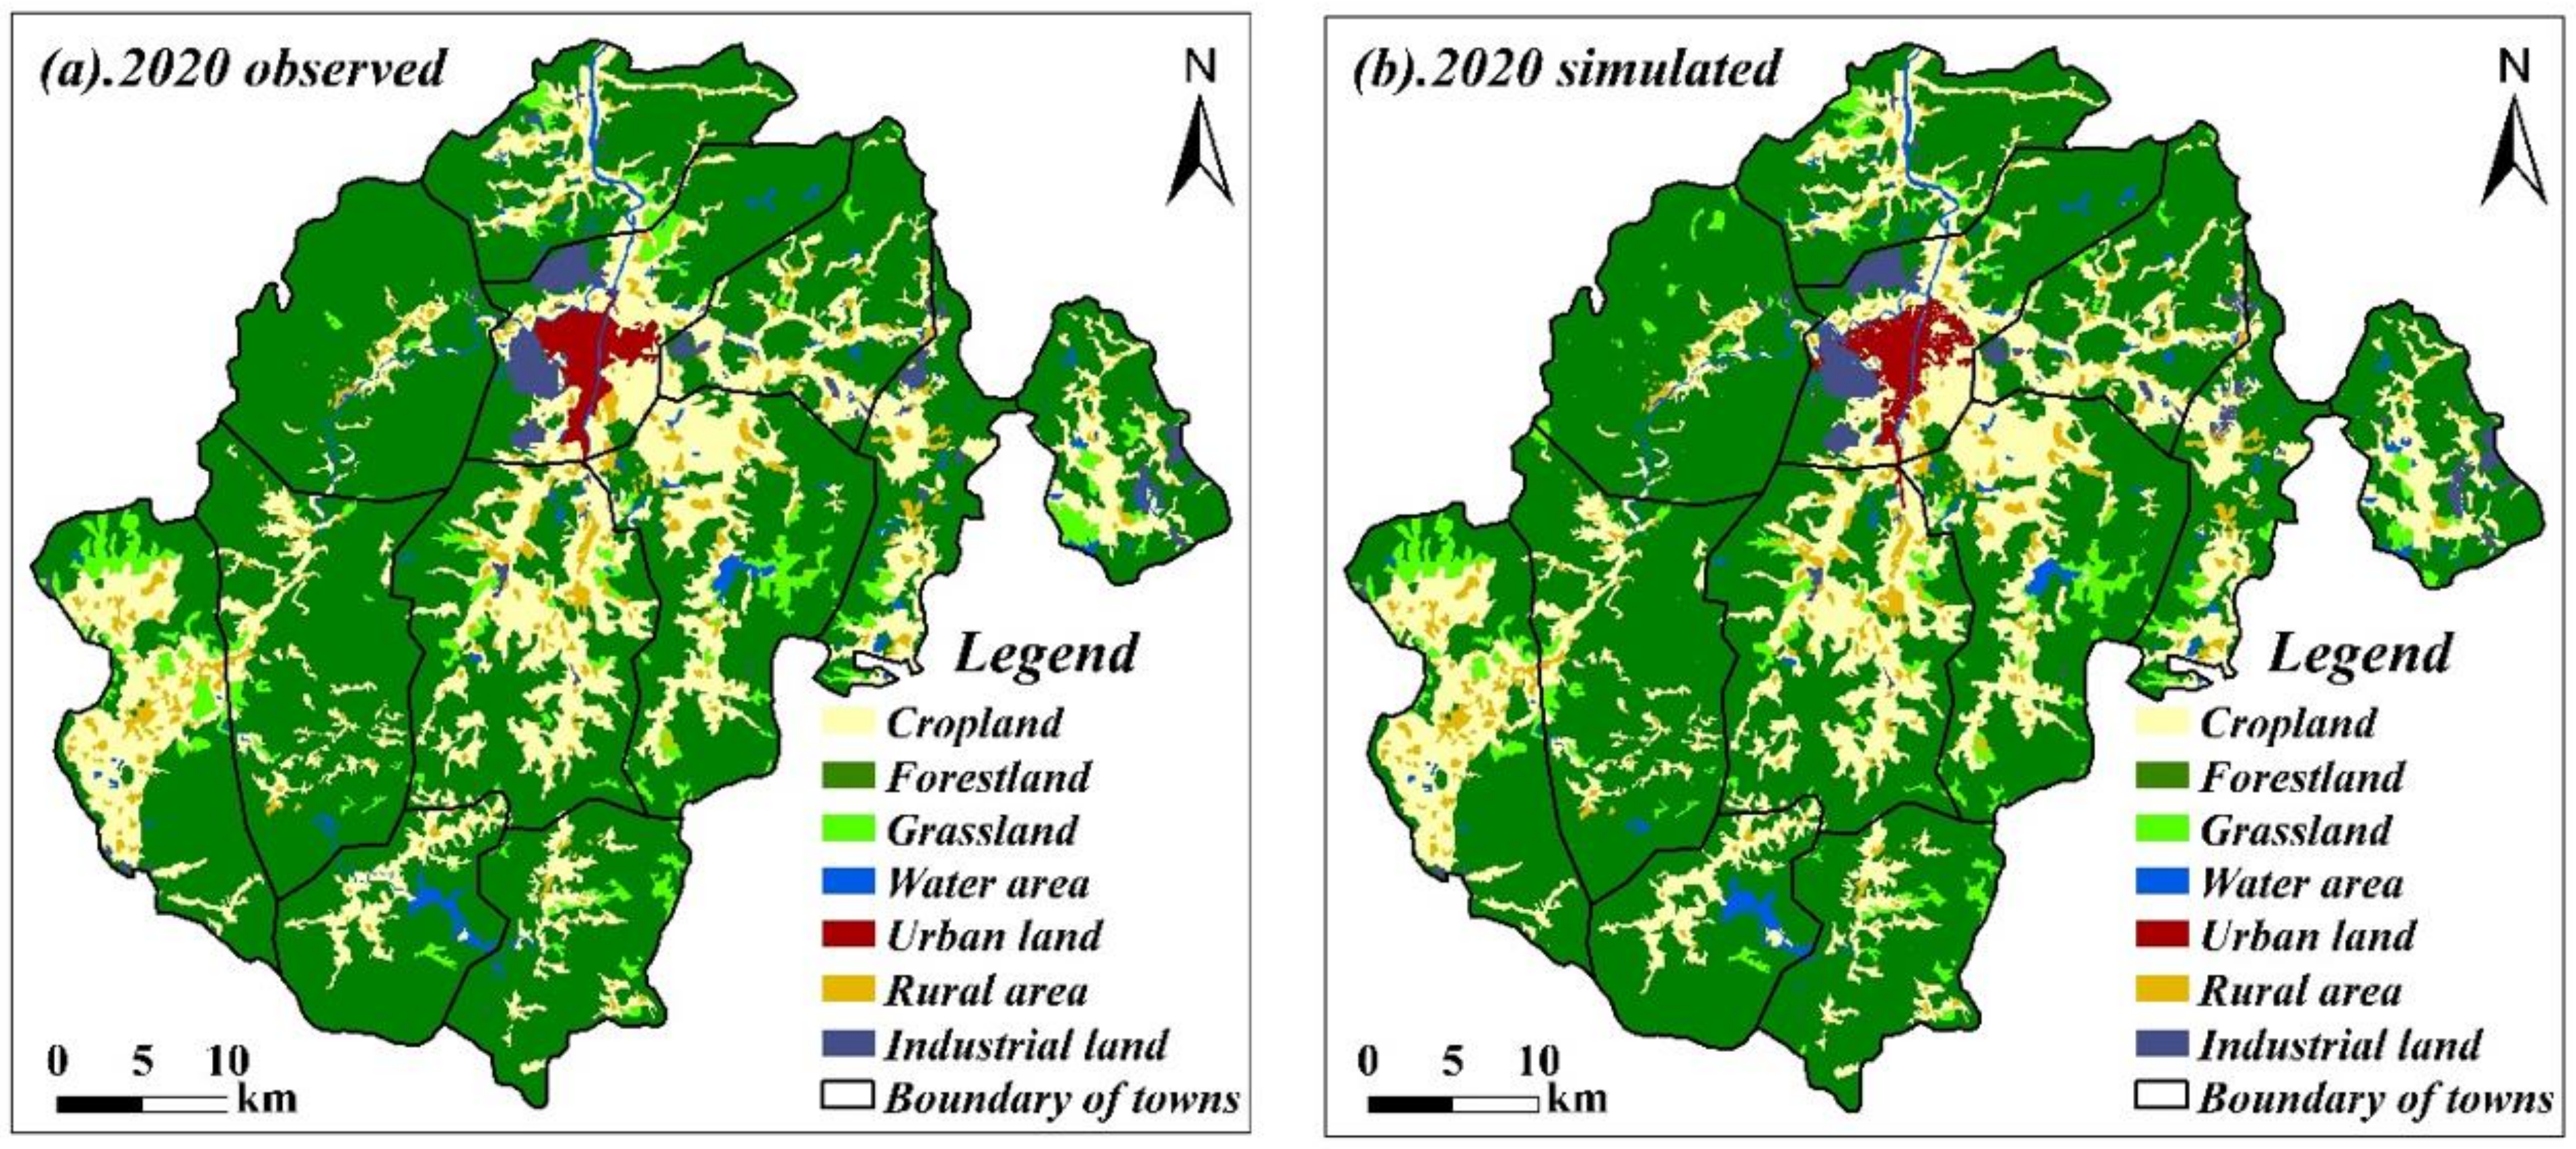
4.1. Model Validation

Only when the models used were validated could their results be considered credible. In this paper, the SD model and PLUS model were employed to the land-use demand prediction and land-use spatial simulation, respectively. The relative error index and kappa coefficient were used to validate the results, respectively. According to Table 3, the differences between the simulated results and the actual land-use demand are relatively small: the average value of relative error is 1.3%, and the highest value is less than 4%. When the value of error is less than 6%, it means a high accuracy of the model [26]. Additionally, the comparison between the actual land-use data and the simulated result generated by the PLUS model are shown in Figure 5. It is easy to find that there is lots of similarity in the spatial pattern between the simulated result and the actual data. The kappa coefficient is 0.92, and the overall accuracy is 96.03%. Generally, when kappa > 0.75%, it indicates good consistency of the simulation. Based on this fact, the closer the kappa value is to 1, the higher the accuracy of the simulation. Hence, both models received relatively high accuracy in the validation, which indicates that they could be applied to future LULC change simulations.

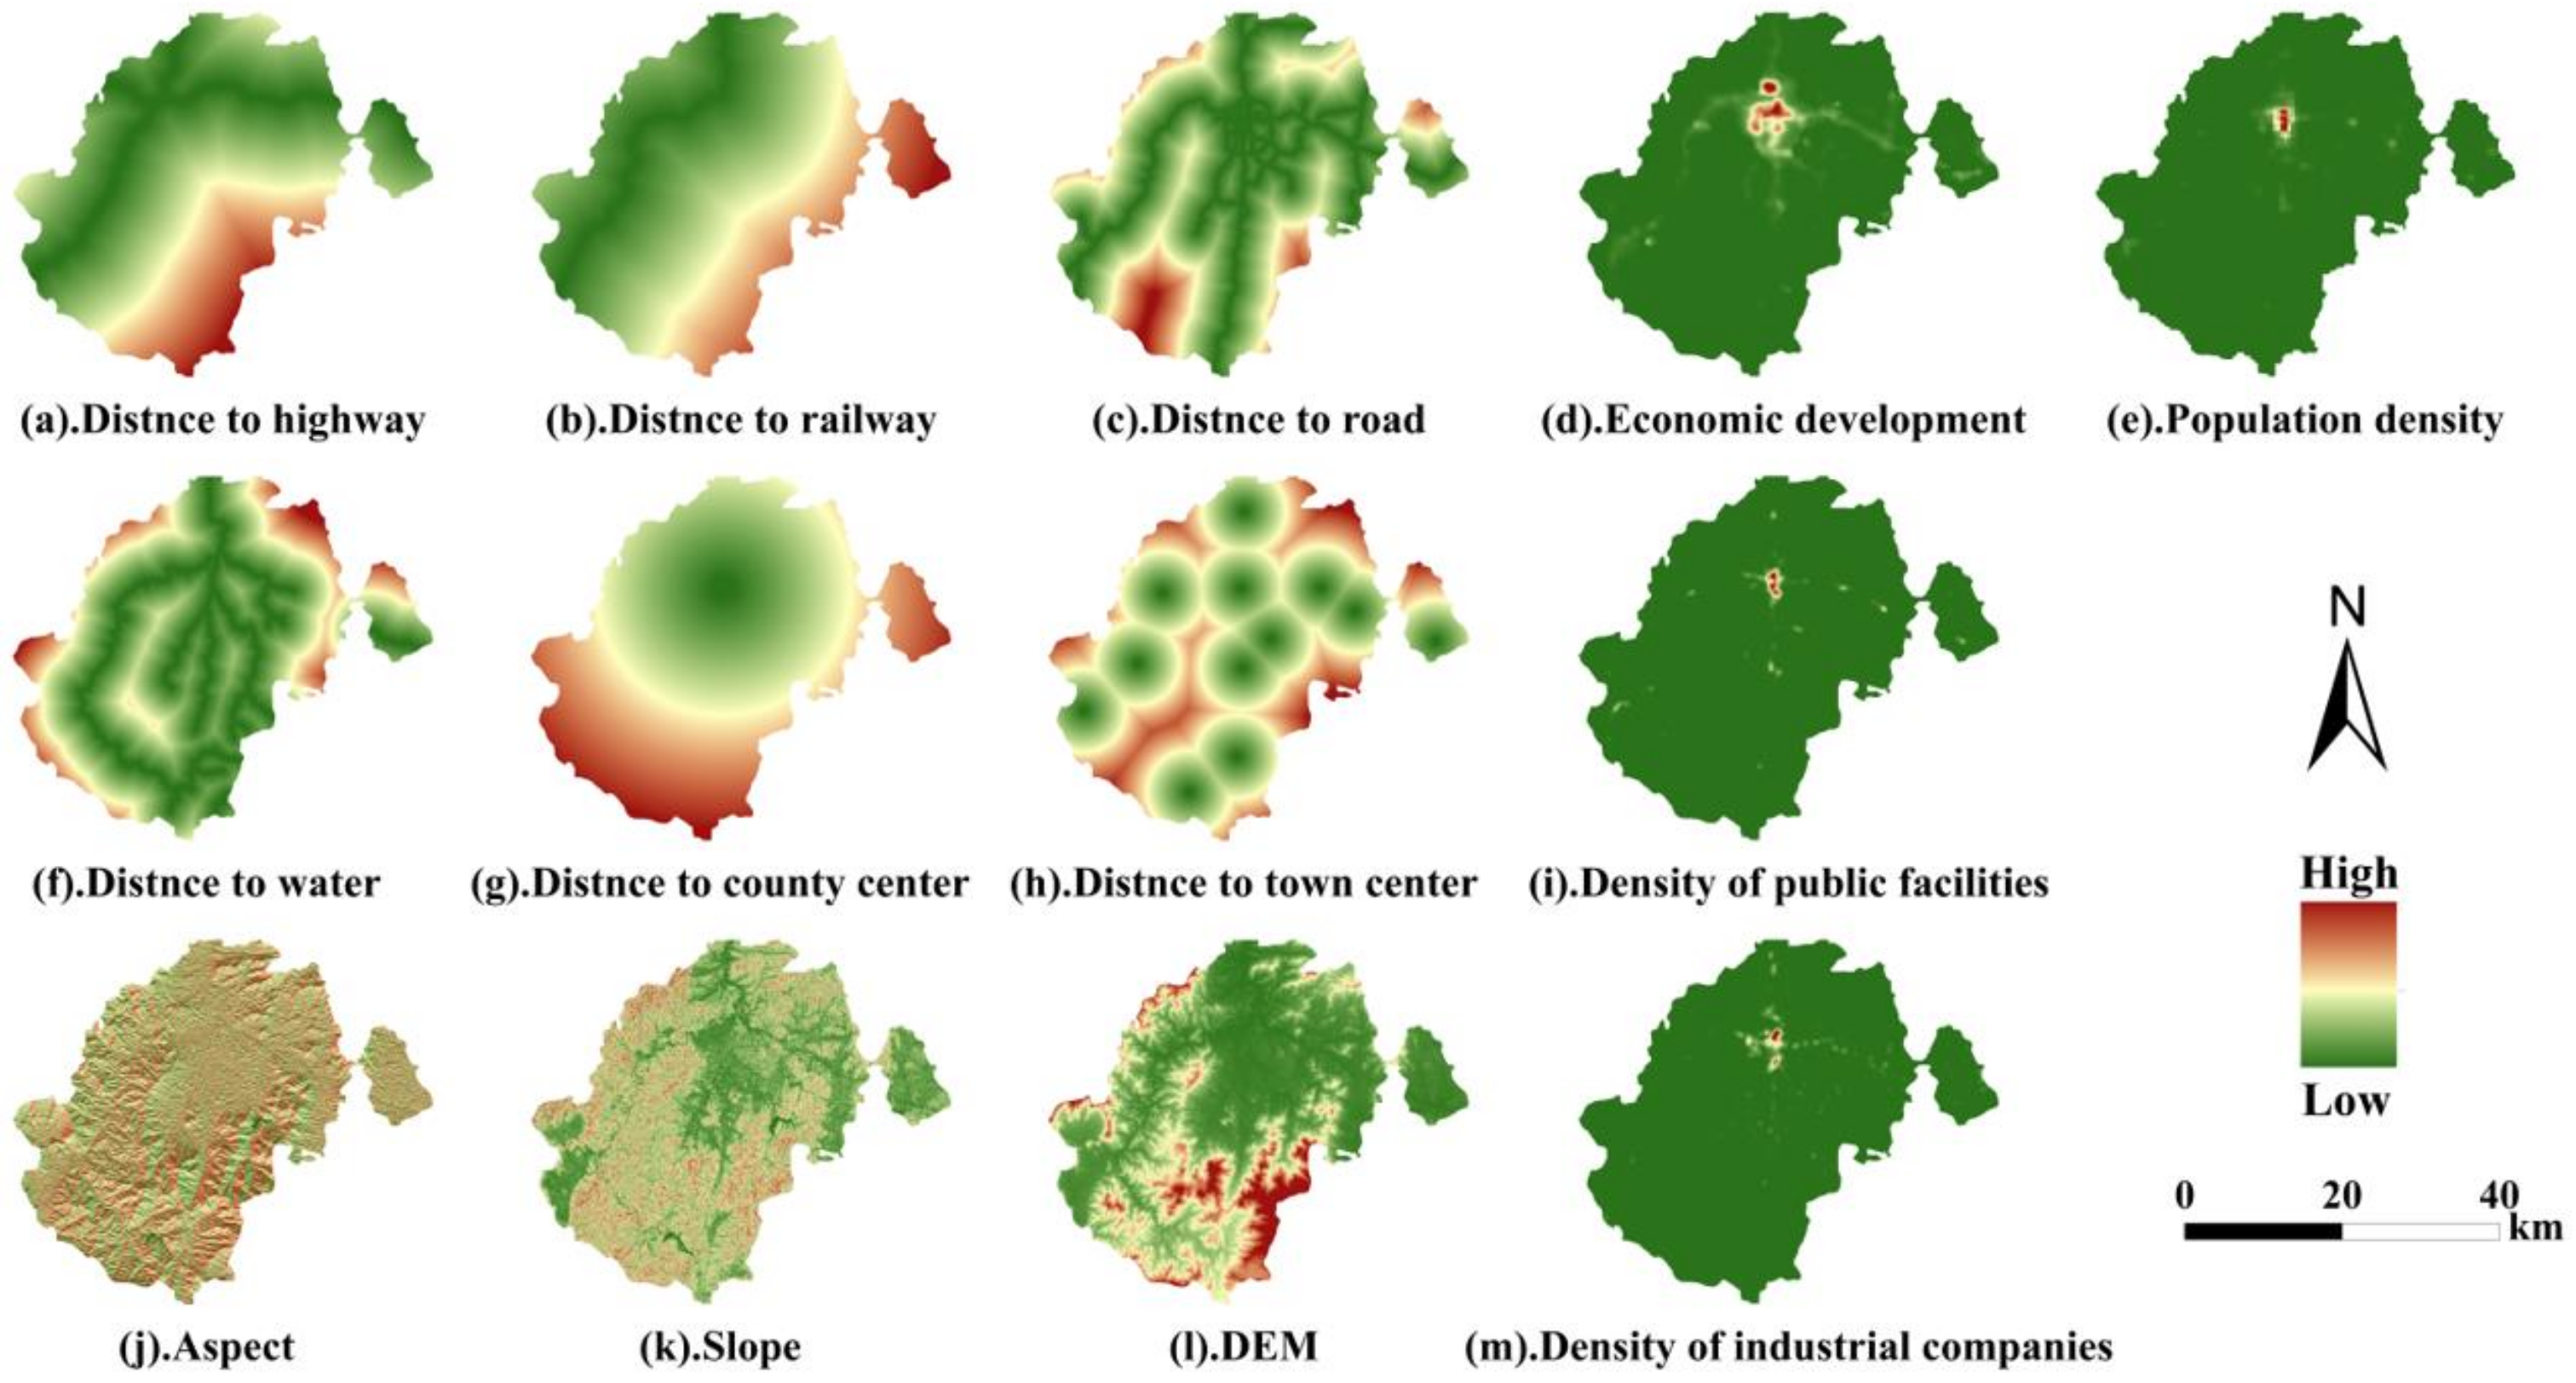
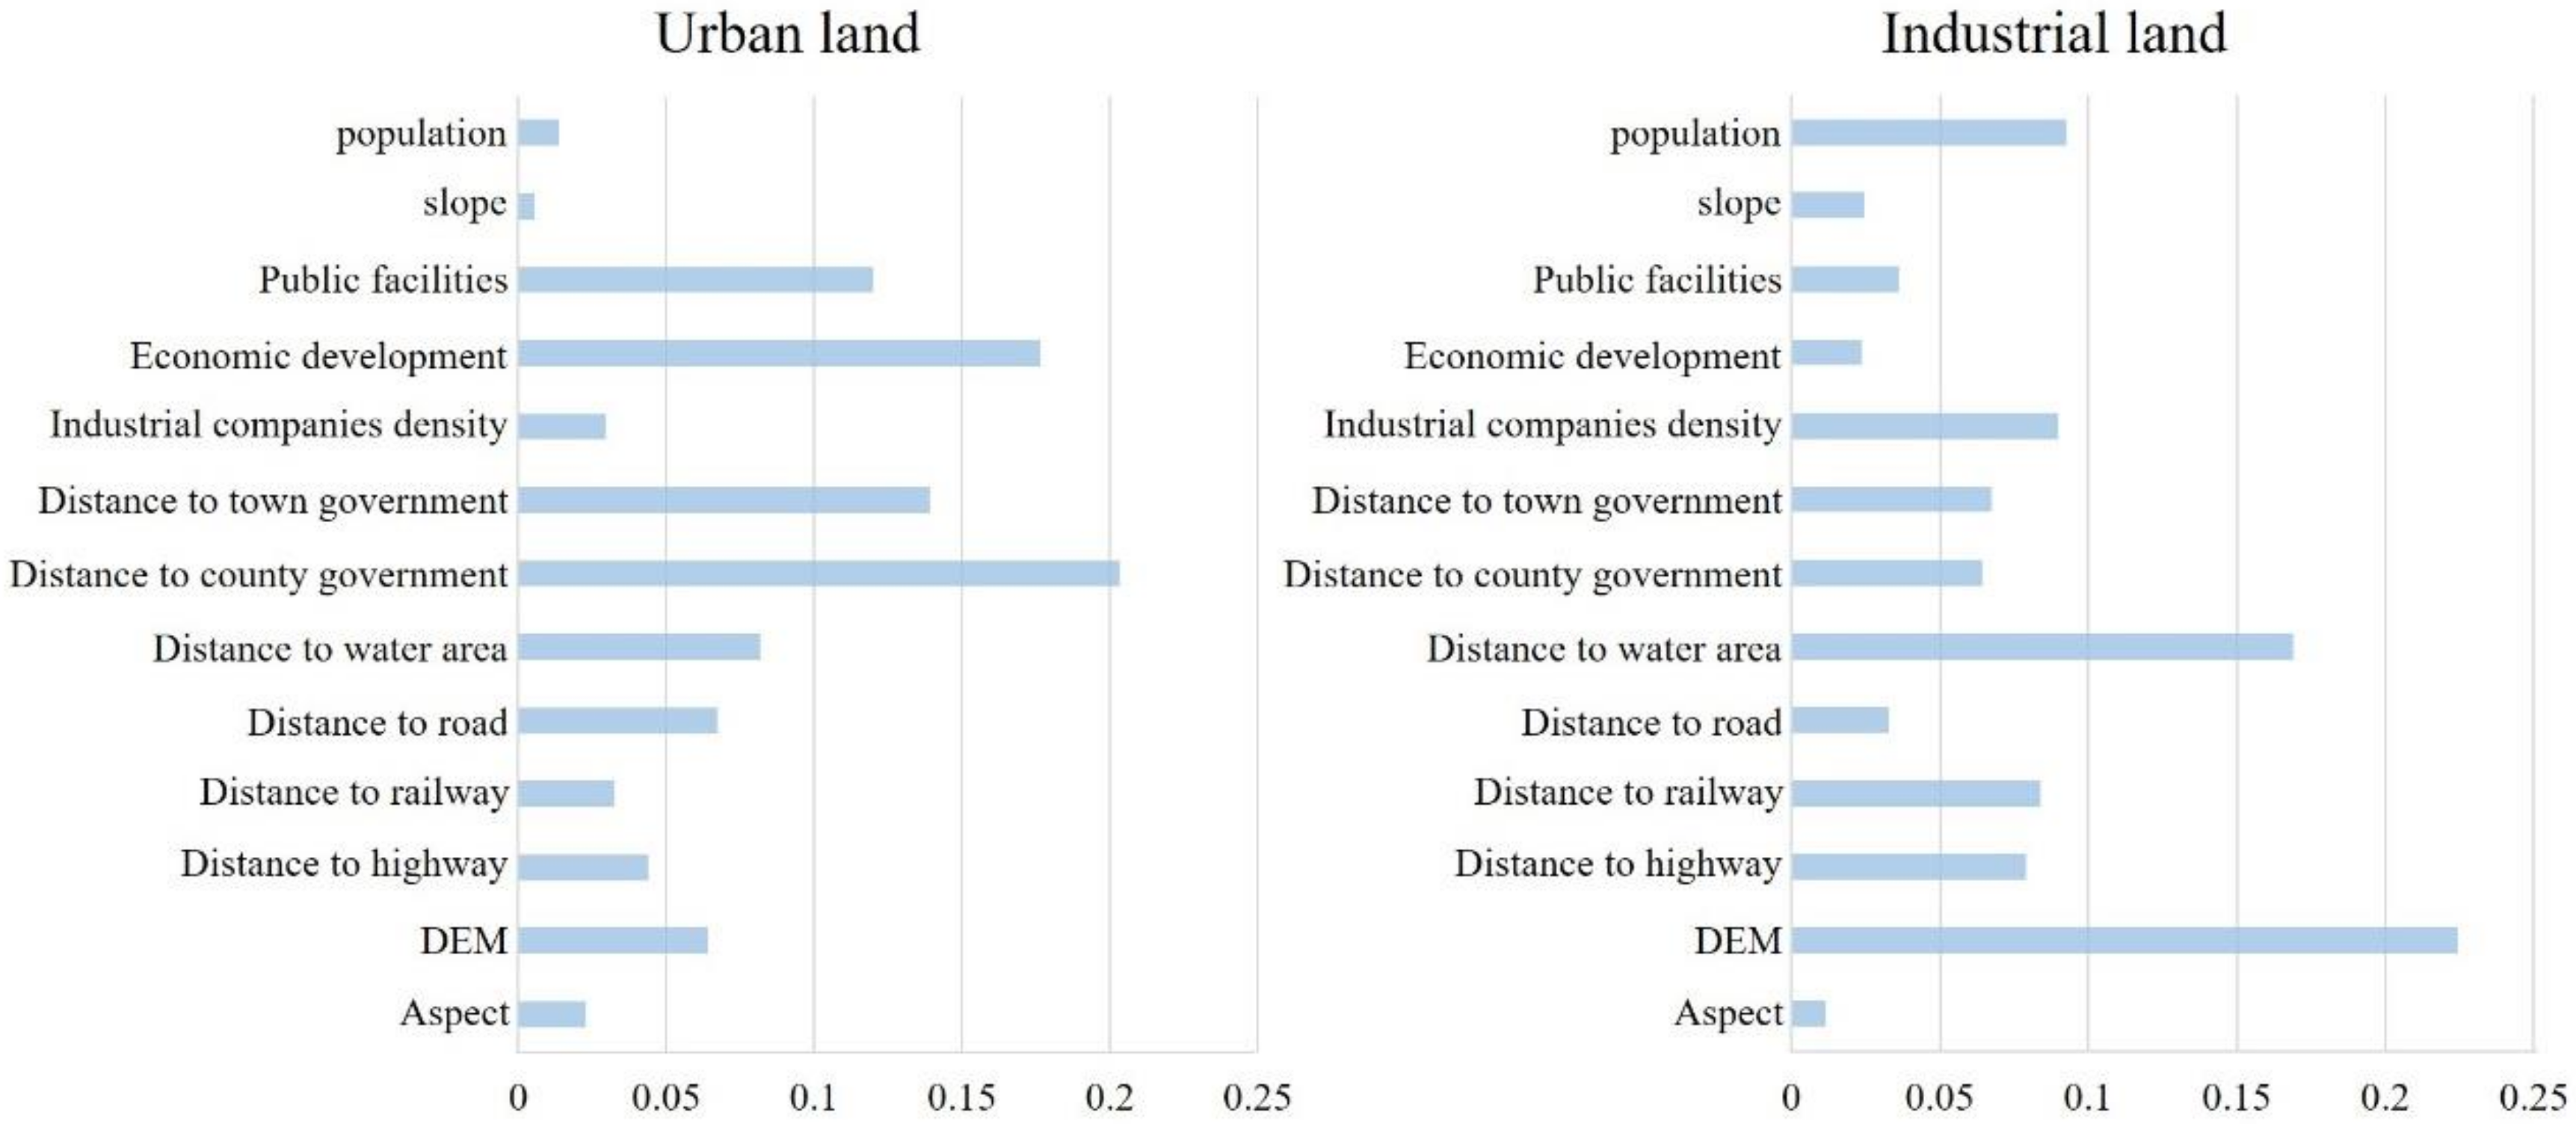
4.2. Analyzing the Underlying Driving Forces of the LULC Change

By adopting the LEAS module of the PLUS model, it is more convenient to analyze the driving factors for LULC change. As mentioned in Section 2.1, the urban land and industrial land of Xinxing County has undergone evident expansion from 2015 to 2020, which has led to a lot of farmland and forestland being encroached upon. Here, we selected natural factors, transportation factors, location factors as well as human socio-economics factors to analyze the underlying driving forces of the expansion of urban land and industrial land in Xinxing County from 2015 to 2020. Figure 6 presents the variable importance that illustrates the contribution of each driving factor to the growth of urban land and industrial land. Figure 7 shows the LULC of 2015 and 2020. Two sub-regions with evident LULC change were selected to reveal the dynamic change of these two land types, in which subregion 1 is the central part of Xincheng Town where the government of Xinxing County is located, and subregion 2 is the main location where most of ceramic industries of Xinxing County are located, including Rencun Town and Shuitai Town. From Figure 6, it is obvious that the distance to the county government has the most significant contribution to the growth of urban land, and economic development also plays an important role in influencing the expansion of urban land. From the perspective of spatial location, we found in subregion 1 of Figure 7 that the new-growth urban land was mainly distributed around the central region of Xinxing County. Thus, it can be inferred that the urban land of Xinxing County is more likely to expand to the regions close to the county government with a well-developed economy. In terms of the expansion of industrial land, its expansion is mostly influenced by natural conditions, such as elevation and the proximity to water. Except for these two significant factors, human socio-economic factors such as the density of population and industrial companies also have evident contribution to the growth of industrial land. It is easy to discover from subregion 1 and subregion 2 that the new-growth industrial land is mainly located in the areas with low elevation and short distance to water, as well as dense population and industrial companies. This suggested that the combination of multi-source big data can effectively reveal the influence of human socio-economics factors on the growth of urban land and industrial land.

4.3. Multi-Scenario LULC Simulation

For future LULC simulation, firstly, we predict the future land-use demand of different scenarios of Xinxing County in 2035 by the Markov chain model and SD model; then, the PLUS model was used to allocate the projected land-use demand to simulate the LULC change at different scenarios to support the territorial–spatial planning in Xinxing County.

4.4. Multi-Scenario LULC Simulation

4.4.1. Future LULC Demand Projection

The projection results of land-use demand under different scenarios are shown in Table 4. We found that both the FP scenario and EP scenario have the same area of water (24.76 km2), urban land (23.72 km2) and industrial land (29.84 km2); the area of farmland (326.16 km2) and forestland (1004.89 km2) would be the maximum, respectively, in these two scenarios. In addition, although the ND scenario has the largest areas of urban land (27.52 km2) and industrial land (46.06 km2), it is worth noting that this scenario will lose the most farmland and forestland, which demonstrates that more attention should be paid to protect the farmland under the current trend of LULC change.

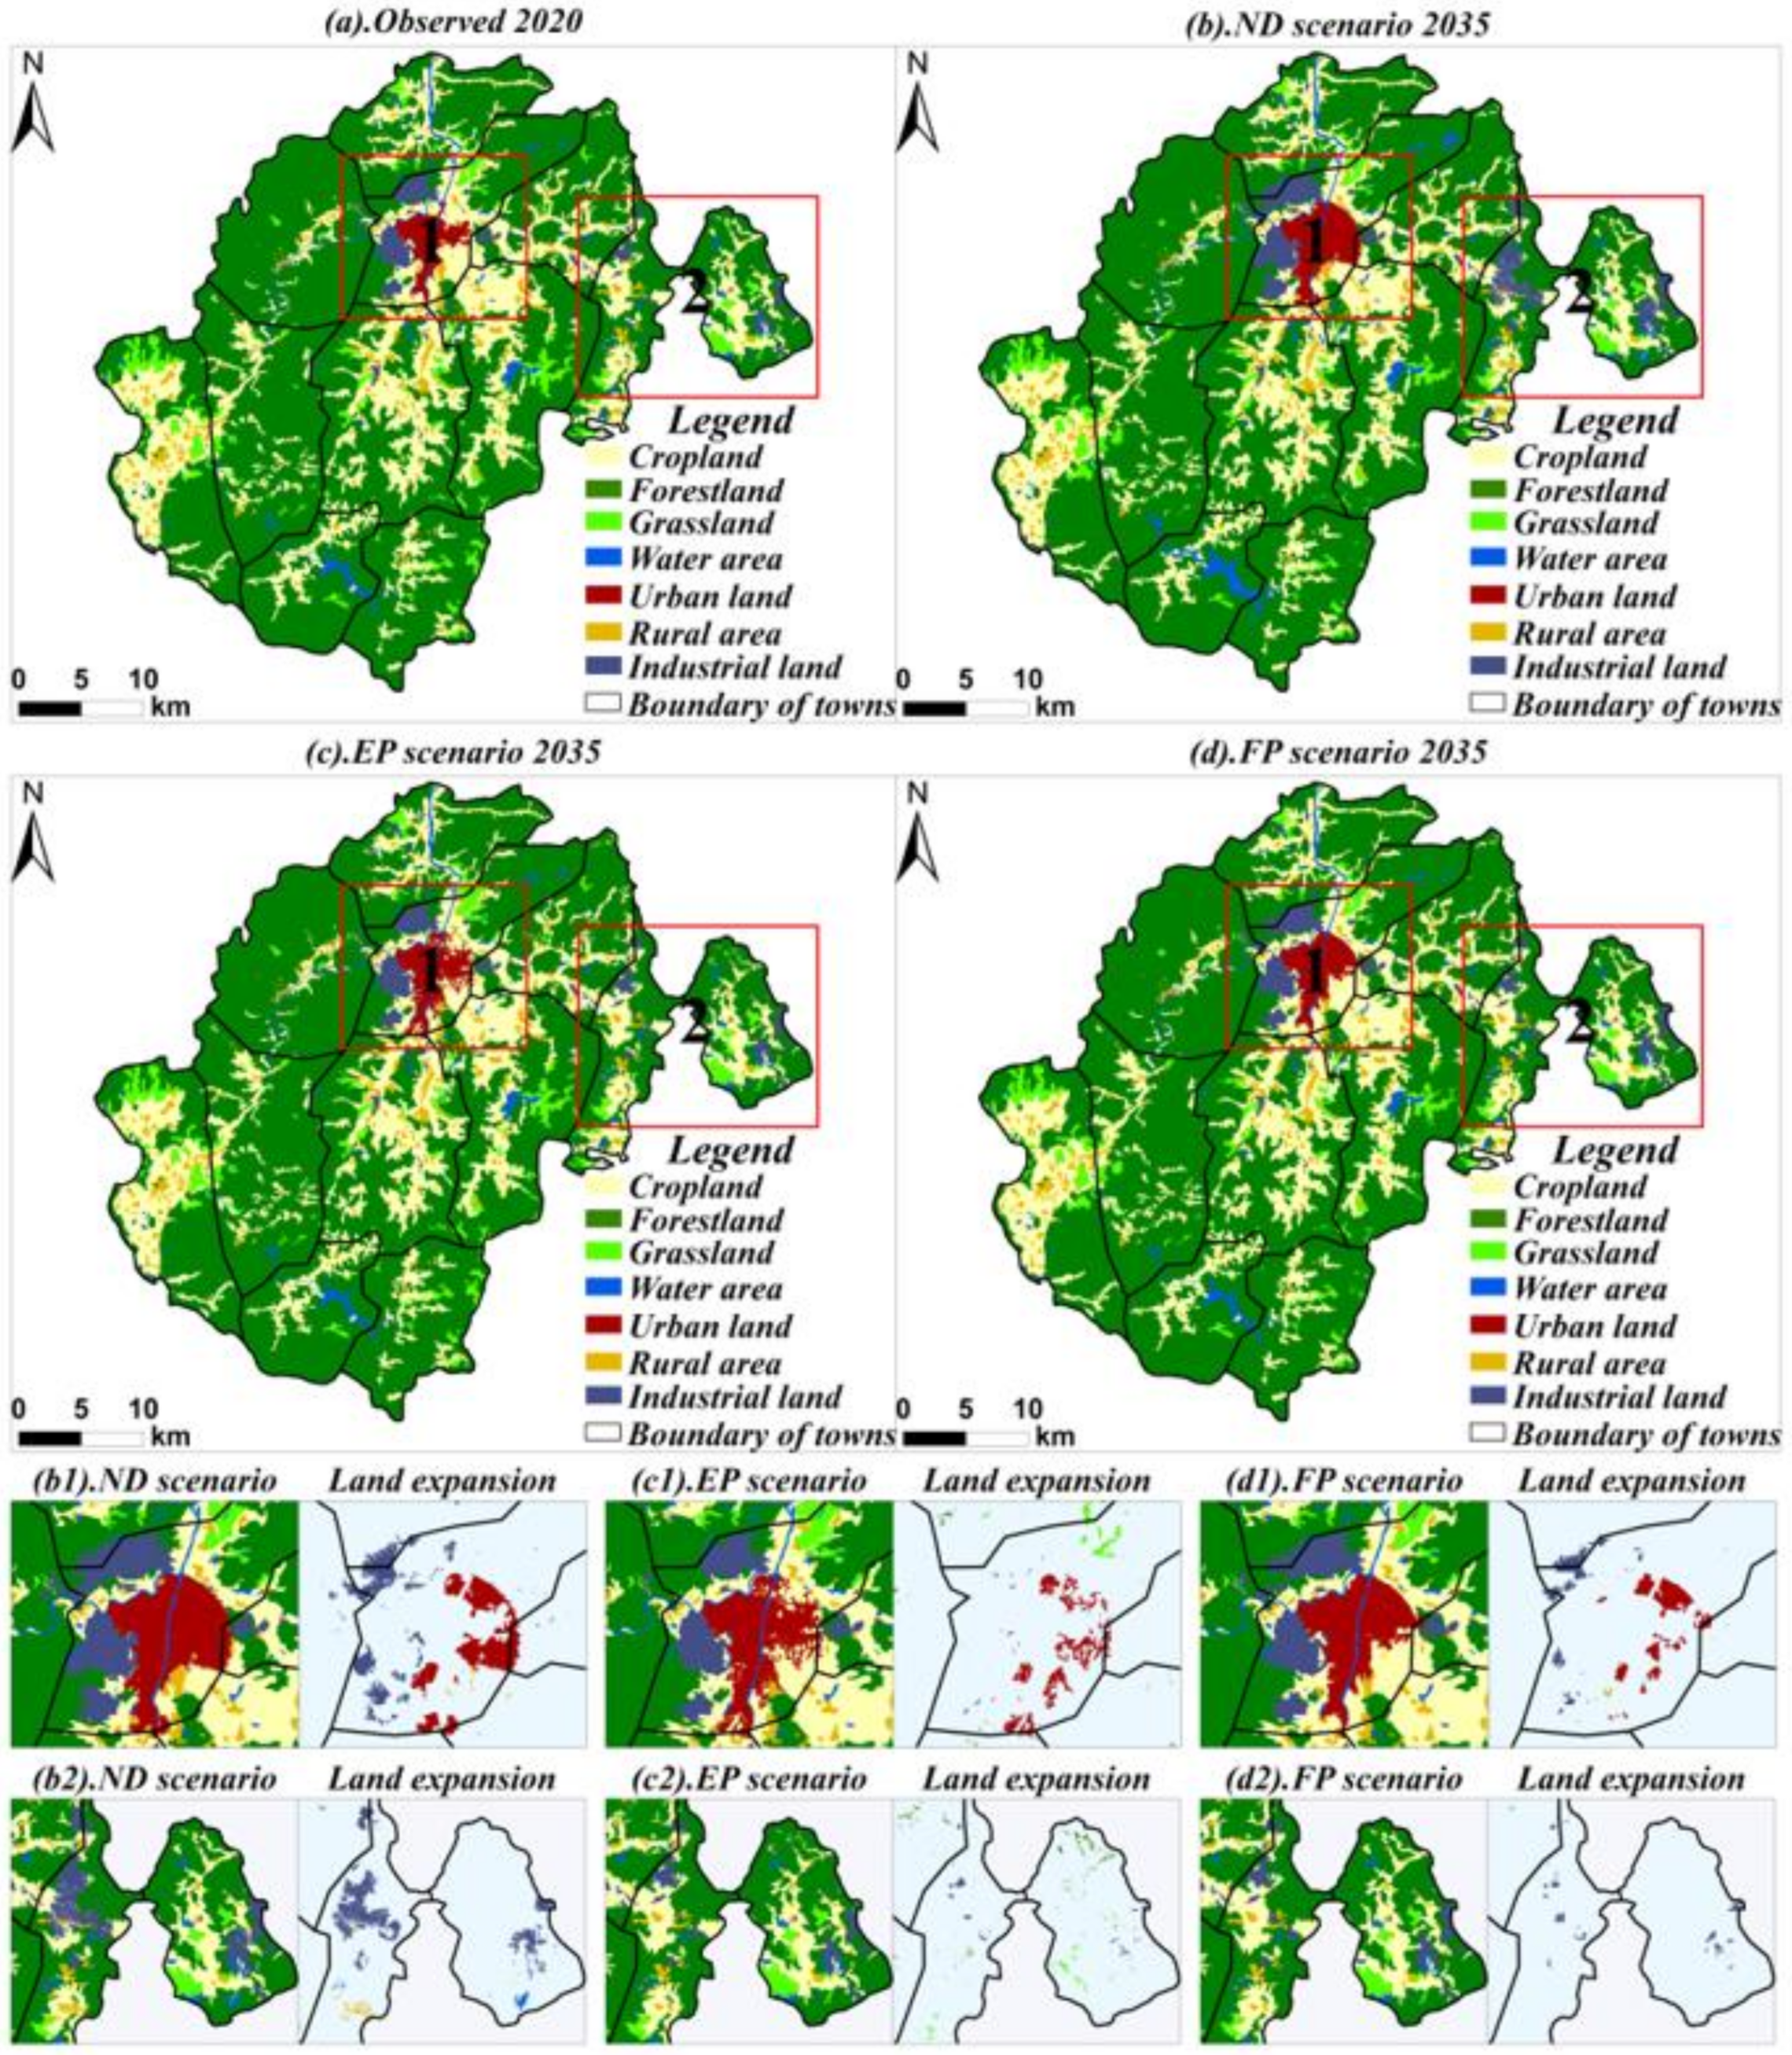
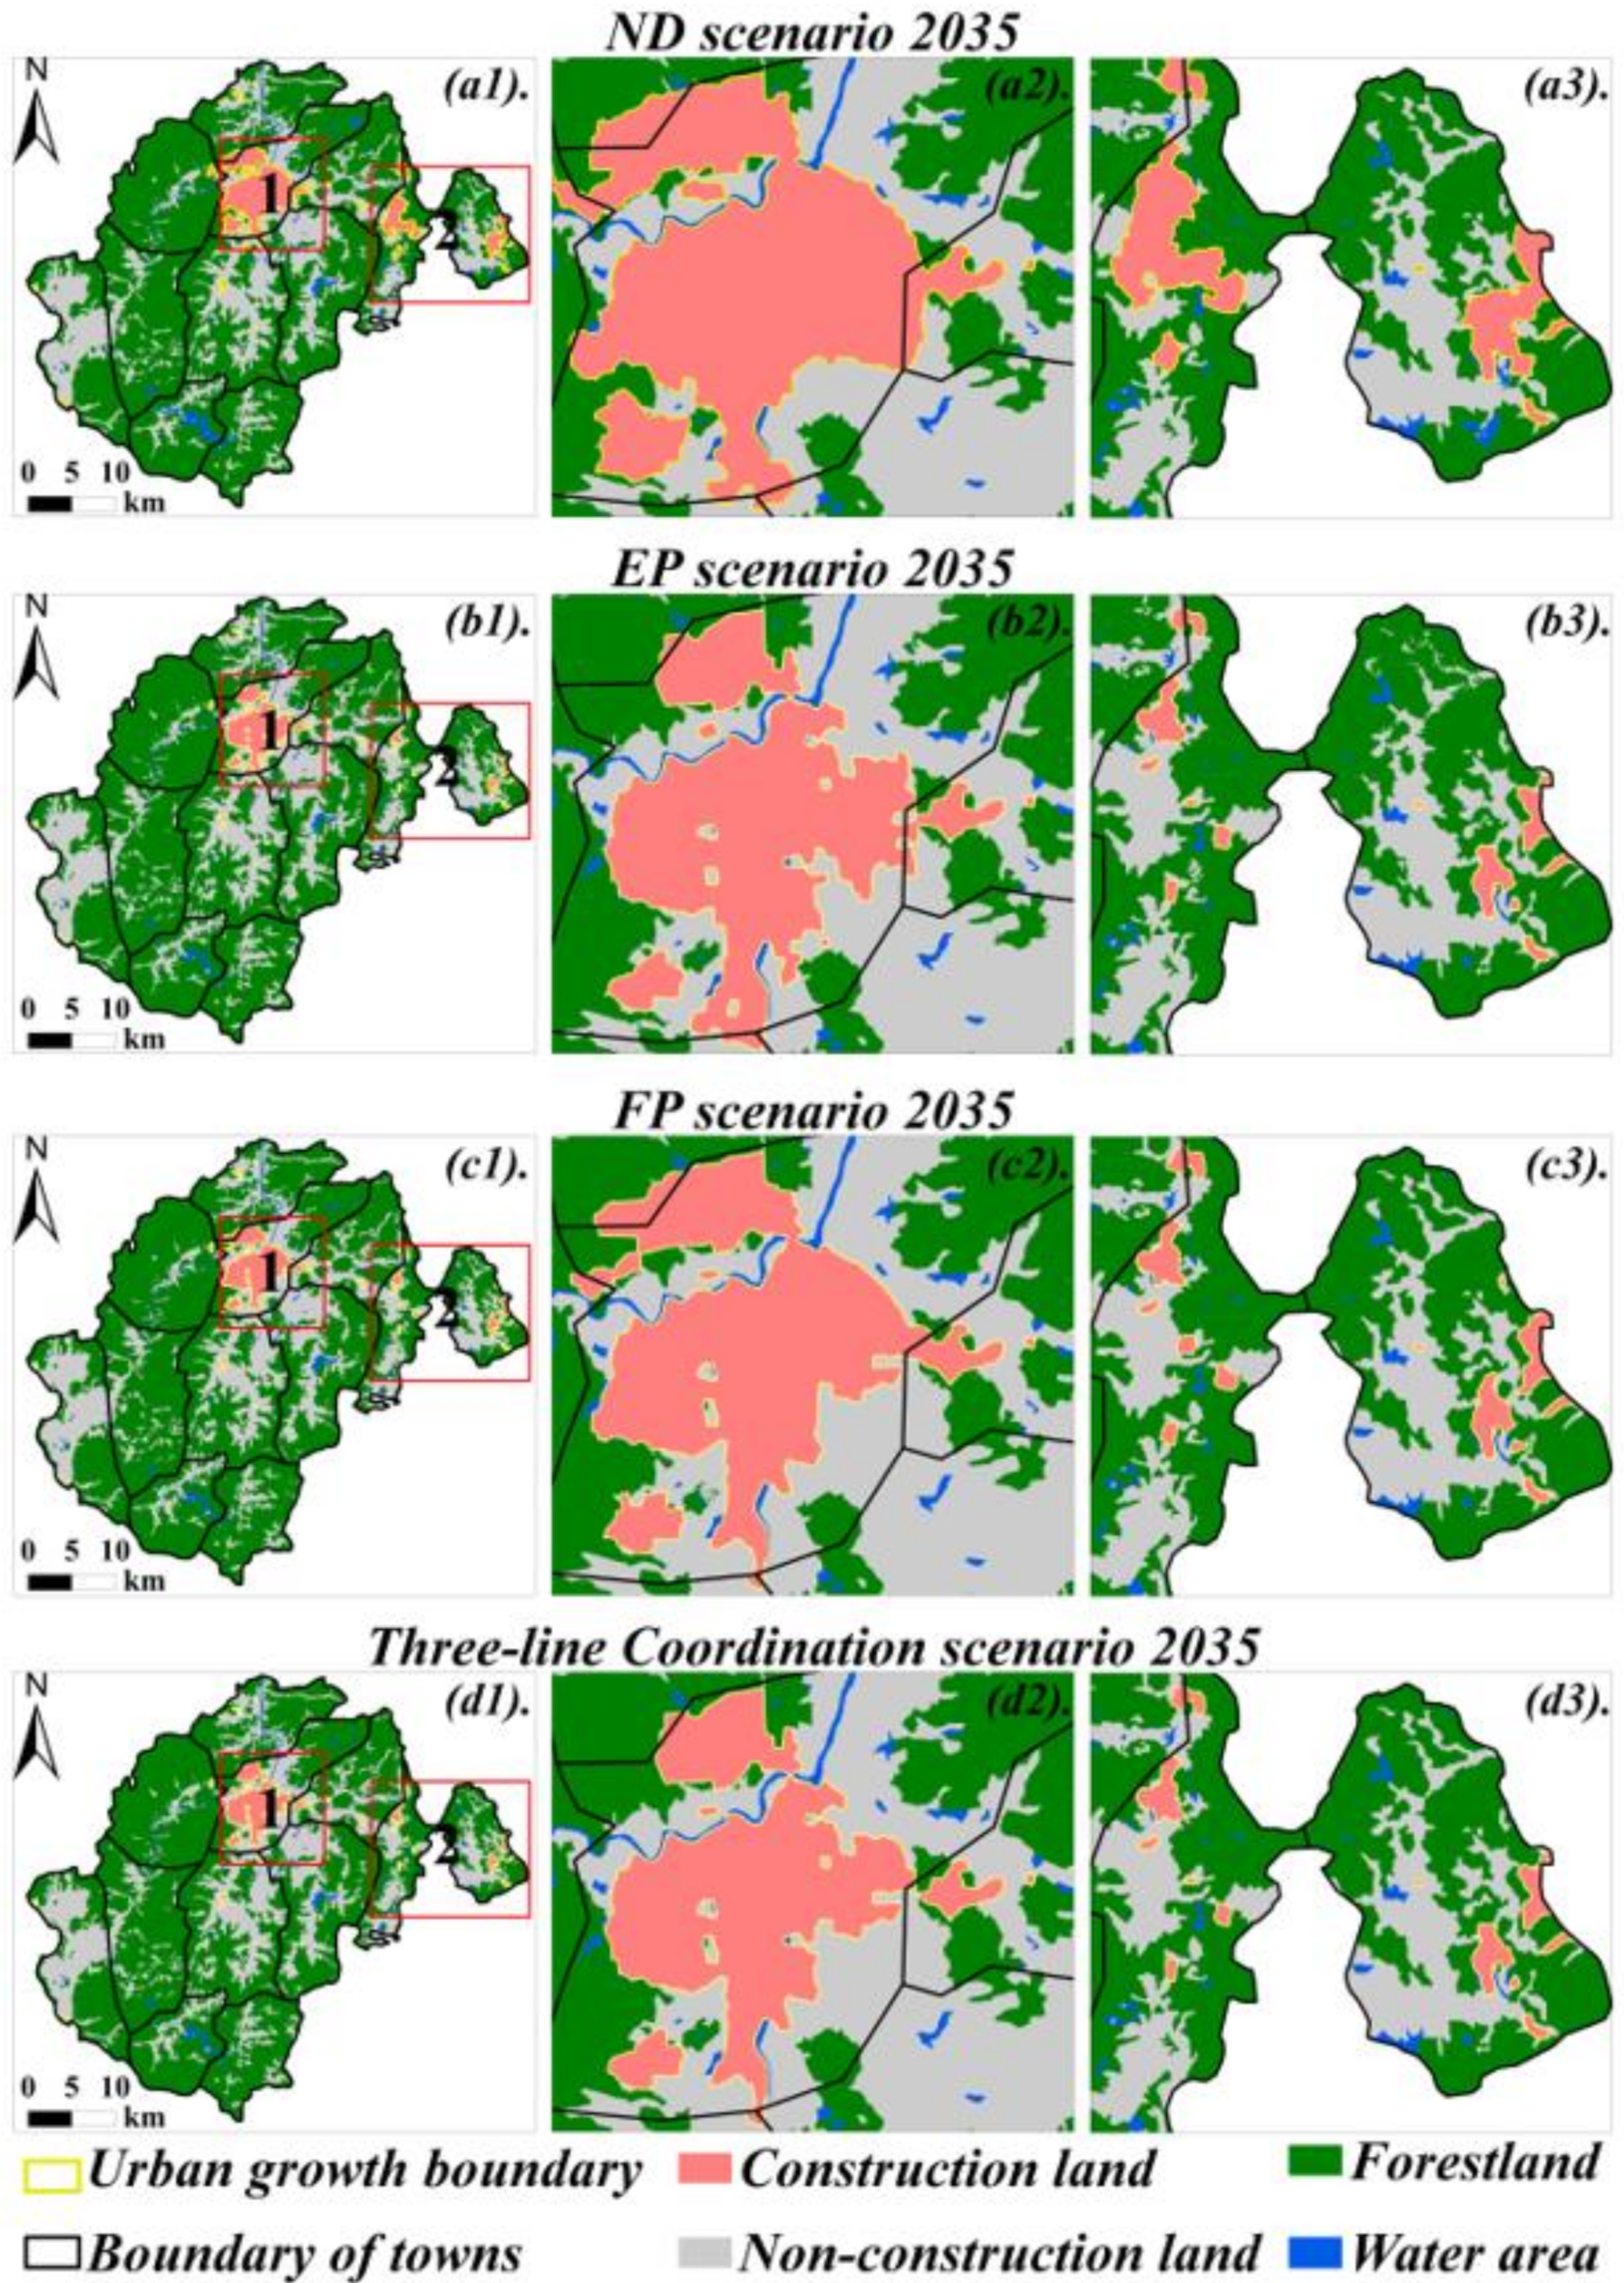
4.4.2. Future LULC Distribution Simulation

The results of the LULC change simulation under different scenarios are shown in Figure 8. Under the ND scenario, the major features of LULC change were the rapid expansion of urban land and industrial land, and reduction of farmland and forestland, in which prime farmland areas and ecologically sensitive areas will be reduced by 1.73% and 2.51%. However, this phenomenon alleviates in the FP and EP scenarios due to the spatial restricted areas. In subregion 1 of the ND scenario (Figure 8b1), it is obvious that the new-growth patches of urban land and industrial land will expand and occupy a large portion of surrounding farmland and forestland. In the EP scenario, due to the restriction of the ecologically sensitive area, the distribution pattern of the industrial land in subregion 1 (Figure 8c1) remained almost the same as in 2020. At the same time, due to the EP scenario, which had the highest demand for forestland, some small patches of forestland appear in the north of subregion 1. In contrast to the EP scenario, some new patches of industrial land were generated in the left of subregion 1 of the FP scenario (Figure 8d1), but the area of these patches is less than that of the ND scenario. In subregion 2, the simulation result of the ND scenario (Figure 8b2) presents the most significant increase of industrial land along with the existing industrial land, as well as a small portion of farmland converted into rural area and water area at the south of this region. Under the EP (Figure 8c2) and FP (Figure 8d2) scenarios, the growth of industrial land was restricted to reduce the decrease of farmland and forestland. Furthermore, under the EP scenario, some patches of grassland and forestland were predicted to appear in subregion 2.

4.4.3. UGBs Delineation

The simulated LULC distribution results obtained from the PLUS model are fragmented and discrete, and the manual identification of the UGBs in this case is prone to misjudgment. Morphological methods, including dilation and erosion algorithms, were used to produce the UGBs based on the simulated LULC results. Then, the raster-formatted UGBs were converted into vector-formatted UGBs by GIS software, and some small patches with an area of less than 3 km2 were removed.
The UGBs delineation results of the ND, EP and FP scenarios are presented in Figure 9a1, Figure 9b1 and Figure 9c1, with an area of 78.7 km2, 51.76 km2 and 54.31 km2, and a growth rate of 87.6%, 23.38% and 29.48%, respectively.
In subregion 1, under the history law, the UGBs delineation result of the ND scenario has the biggest scope, and the edge of the UGBs is the smoothest among the UGBs of other scenarios. In the west of the Xincheng Town, since the restriction of ecologically sensitive area, there is little expansion of construction land in the EP scenario (Figure 9b2); instead, there is evident conversion of forestland to construction land in the ND (Figure 9a2) and FP scenarios (Figure 9c2). At the same time, due to the constraints of the ecological area and prime farmland protection area, the edges of UGBs result in the EP and FP scenarios are more irregular than that of the ND scenario.
In subregion 2, the scope of the UGBs of the ND scenario is 21.25 km2 (Figure 9a3), which is obviously bigger than the UGBs scope of the EP scenario (8.79 km2) (Figure 9b3) and FP scenario (7.53 km2) (Figure 9c3); however, the evident expansion in this scenario would lead to a big portion of forestland and farmland being encroached upon. In addition, the UGBs results in the EP and FP scenarios have a very similar spatial pattern and scope under the constraints of the ecologically sensitive area and prime farmland protection line. From the UGBs delineation results of the multi-scenario above, it is easy to find that these UGBs delineation results retain the same spatial distribution characteristics of the simulated LULC patterns under different scenarios, which indicates that the UGBs delineation method can effectively transform the LULC change simulation results into available UGBs for the county area.

5. Discussion

5.1. Delineating UGBs with and without “Three-Line Coordination”

In the LULC change simulation, the goals of setting the simulation scenarios of EP and FP were to prevent ecologically sensitive areas and prime farmland resources from encroachment during urbanization. These goals can be achieved at the same time by following the rule of “Three-line Coordination” when delineating UGBs. The concept of “Three-line” refers to the prime farmland protection line, ecological red line and UGBs [53]. In the new Chinese territorial–spatial-planning system, the “Three-line Coordination” is an essential standard to measure the relationship between urban development and the protection of agricultural land and ecological resources, which is necessary for promoting sustainable development. In the practical work of UGBs delineation, the realization of the UGBs delineation under the “Three-line Coordination” scenario can be the intersection area of the UGBs delineation results between the EP scenario and FP scenario, which indicates that this intersection area can be developed without encroaching on prime farmland and ecologically sensitive areas. This can help the urban planner to deal with the contradiction between urban development and the protection of primary farmland and ecological land use.
The UGBs delineation result of the “Three-line Coordination” scenario is shown in Figure 9d1: the area of the UGB is 48.93 km2, with an increase of 16.63% compared with 2020. In terms of the LULC conversion, some of the forestland and farmland that is not included in the restriction area would be converted into new construction land. Compared with the UGBs delineation results of other scenarios, although the UGBs delineation result of the ND scenario presents the biggest developing area in the future, without the spatial restriction, however, a large portion of prime farmland and ecologically sensitive area would be encroached upon. In addition, in the EP and FP scenarios, due to the constraints of the ecologically sensitive area and prime farmland protection area, the development of UGBs in these scenarios can effectively prevent their occupation. However, it is still inadequate to solve the conflict between urban development and natural resource protection by employing any single constraint. This indicates that the “Three-line Coordination” scenario can help to realize the development of construction land while protecting the prime farmland area and ecological area, which is meaningful to supplement the UGBs delineation on territorial–spatial planning.

5.2. Urban Planning Suggestion

“Three-line Coordination” explains the relationship between urban development and natural resource protection, which can guide Chinese territorial–spatial planning in a more scientific and valid direction. However, in terms of the urban development of Xinxing County, there still exist some shortcomings that need to be solved. Owing to the long-established urban–rural dualistic structure in China, there is a general emphasis on the urban area rather than the rural area during the urbanization of the county area [45], which leads to the imbalance of development between urban and rural areas. According to the LULC change simulation results, an evident imbalance phenomenon exists in the development of urban land in Xinxing County, where new-growth urban land mainly appears around the central region of Xinxing County, while few appears at other towns. Xinxing County has rich tourism resources in other towns, such as Liuzu Town and Taiping Town, whose major regions are not included in the prime farmland protection area and ecologically sensitive area. However, it would be difficult to exploit such valuable tourism resources in these towns if the current development trend of Xinxing County continues. Based on the analysis result in Section 4.3, factors such as administrative location and economic development are vital in determining the expansion of urban land. In addition, the distribution of public facilities also has an important contribution to the expansion of urban land in Xinxing County. Hence, in the future, the development of public facilities should be strengthened in Xinxing County, especially the development of transportation service facilities, which can fully take advantage of the rich tourism resources, so as to further promote the development of Xinxing County.

5.3. Limitations and Future Research Prospects

Despite the merits of this study, we have to acknowledge some limitations which need to be addressed in future research. First, in terms of a future LULC change simulation, revealing the driving mechanism of each land-use type can help to understand the law of LULC change. However, only the land-use types with expansion were considered in this study, such as urban land and industrial land, while other land-use types with decrease were not considered—for example, farmland, forestland, grassland, water areas and rural areas. Hence, in future studies, it is necessary to explore the driving mechanism of each land-use type more comprehensively in the LULC change simulation, to further explore the law of LULC change. Second, policy direction plays an important role in the LULC change in the county area. However, due to the lack of relevant planning materials, the driving factors selected in this study may be imperfect to reveal the driving mechanism of each land-use type. In addition, the lack of relevant planning materials would also lead to the incomplete verification of the UGBs delineation result in this study, which can only verify the UGBs delineation result from the spatial perspective. Thus, it is expected that the effectiveness of the proposed UGBs delineation method can be further verified from the perspective of amount control by integrating more planning documents. Third, due to the lack of ecological red line protection data, we used the existing spatial datasets, such as DEM and NDVI (normalized difference vegetation index), to evaluate the ecologically sensitive area of the research area [50]. Therefore, relevant spatial data about ecological red line protection should be adopted in future.

6. Conclusions

Currently, the contradiction between people and land urban sprawl has become more and more serious due to the rapid urban sprawl. Delineating UGBs by simulating a future multi-scenario LULC is effective for serving urban planning and to deal with the existing conflict between urban development and natural resource protection. However, few of the previous LULC change simulation studies have tried to integrate multi-source big data to explore the driving factors of LULC dynamics during the simulation. In addition, most of the existing UGBs delineation studies mainly focused on the macro-scale area, and few of them have paid attention to the UGBs delineation in the county area. Hence, this study proposed a framework for the UGBs delineation in the county area. In this framework, the SD model and PLUS model were coupled to simulate a future multi-scenario LULC, and several multi-source big data that can related to human socio-economic characteristics in the micro-scale were introduced to explore the contribution of the driving factors to LULC dynamics. Finally, the morphology methods, including dilation and erosion algorithms, were employed to generate the UGBs of different scenarios based on the simulated LULC results. The proposed framework was applied to the UGBs delineation in Xinxing County, a rapidly urbanizing county area in Guangdong Province. The validation of the LULC change simulation result indicates that the coupled SD and PLUS model can accurately simulate LULC dynamics in the county area. After analyzing the driving factors of LULC dynamics, we can infer that the administrative location and human socio-economic factors, such as economic development and public facilities, are vital for the expansion of urban land. In terms of the expansion of industrial land, in addition to the important influence of environmental factors (DEM and distance to water), the density of population and industrial companies also have an evident contribution. Hence, we can conclude that the introduction of the multi-source big data can effectively reveal the influence of human socio-economic factors to the growth of urban land and industrial land.
In the 2035 LULC change simulation results of different scenarios, the main characteristics of LULC dynamics in the ND scenario was the rapid expansion of urban land and industrial land, which leads to evident encroachment on farmland and forestland. In the EP and FP scenarios, this phenomenon would alleviate due to the spatial restricted areas. At the same time, the UGBs delineation results have similar spatial patterns with the LULC change simulation results, which further proves the efficiency of the proposed UGBs delineation framework in county area.
Comparing the UGBs delineation results of the “Three-line Coordination” scenario with the ND, EP and FP scenarios, the UGBs result in the ND scenario has the biggest scope, but a large portion of prime farmland and ecological resources would be encroached upon during the expansion of construction land. Moreover, in either the EP or FP scenarios, it is still not enough to deal with the conflict between urban development and natural resource protection by employing any single constraint during future UGBs delineation. Instead, the UGBs delineation result under the “Three-line Coordination” can effectively deal with the conflict between construction land expansion and natural resource protection, which is meaningful to supplement the UGBs delineation on territorial–spatial planning.

Author Contributions

Conceptualization, S.L.; methodology, Z.L., J.C. and C.C.; resources, S.L., F.W. and Z.W.; writing—original draft preparation, Z.L.; writing—review and editing, S.L. All authors have read and agreed to the published version of the manuscript.

Funding

This research was funded by the Key-Area Research and Development Program of Guangdong Province (2020B0202010002) and the National Natural Science Foundation of China (41871290, 42271467, 42071262).

Data Availability Statement

Not applicable.

Conflicts of Interest

The authors declare no conflict of interest.

References

  1. Zhang, D.; Liu, X.; Lin, Z.; Zhang, X.; Zhang, H. The delineation of urban growth boundaries in complex ecological environment areas by using cellular automata and a dual-environmental evaluation. J. Clean. Prod. 2020, 256, 120361. [Google Scholar] [CrossRef]
  2. Grimm, N.B.; Faeth, S.H.; Golubiewski, N.E.; Redman, C.L.; Wu, J.; Bai, X.; Briggs, J.M. Global Change and the Ecology of Cities. Am. Assoc. Adv. Sci. 2008, 319, 756–760. [Google Scholar] [CrossRef]
  3. Chigbu, U.E.; Schopf, A.; de Vries, W.T.; Masum, F.; Mabikke, S.; Antonio, D.; Espinoza, J. Combining land-use planning and tenure security: A tenure responsive land-use planning approach for developing countries. J. Environ. Plan. Manag. 2017, 60, 1622–1639. [Google Scholar] [CrossRef]
  4. Wang, L.; Pijanowski, B.; Yang, W.; Zhai, R.; Omrani, H.; Li, K. Predicting multiple land use transitions under rapid urbanization and implications for land management and urban planning: The case of Zhanggong District in central China. Habitat Int. 2018, 82, 48–61. [Google Scholar] [CrossRef]
  5. Cui, X.; Li, S.; Gao, F. Examining spatial carbon metabolism: Features, future simulation, and land-based mitigation. Ecol. Model. 2020, 438, 109325. [Google Scholar] [CrossRef]
  6. Zhou, Y.; Huang, X.; Chen, Y.; Zhong, T.; Xu, G.; He, J.; Xu, Y.; Meng, H. The effect of land use planning (2006–2020) on construction land growth in China. Cities 2017, 68, 37–47. [Google Scholar] [CrossRef]
  7. Wang, L.; Han, H.; Lai, S. Do plans contain urban sprawl? A comparison of Beijing and Taipei. Habitat Int. 2014, 42, 121–130. [Google Scholar] [CrossRef]
  8. Bidandi, F.; Williams, J.J. Understanding urban land, politics, and planning: A critical appraisal of Kampala’s urban sprawl. Cities 2020, 106, 102858. [Google Scholar] [CrossRef]
  9. Lei, Y.; Flacke, J.; Schwarz, N. Does Urban planning affect urban growth pattern? A case study of Shenzhen, China. Land Use Policy 2021, 101, 105100. [Google Scholar] [CrossRef]
  10. Ball, M.; Cigdem, M.; Taylor, E.; Wood, G. Urban Growth Boundaries and their Impact on Land Prices. Environ. Plan. A Econ. Space 2014, 46, 3010–3026. [Google Scholar] [CrossRef] [Green Version]
  11. Tayyebi, A.; Perry, P.C.; Tayyebi, A.H. Predicting the expansion of an urban boundary using spatial logistic regression and hybrid raster-vector routines with remote sensing and GIS. Int. J. Geogr. Inf. Sci. IJGIS 2014, 28, 639–659. [Google Scholar] [CrossRef]
  12. Mathur, S. Impact of an urban growth boundary across the entire house price spectrum: The two-stage quantile spatial regression approach. Land Use Policy 2019, 80, 88–94. [Google Scholar] [CrossRef]
  13. Gallent, N.; Bianconi, M.; Andersson, J. Planning on the Edge: England’s Rural—Urban Fringe and the Spatial-Planning Agenda. Environ. Plan. B Plan. Des. 2006, 33, 457–476. [Google Scholar] [CrossRef]
  14. Jun, M. The Effects of Portland’s Urban Growth Boundary on Urban Development Patterns and Commuting. Urban Stud. 2004, 41, 1333–1348. [Google Scholar] [CrossRef]
  15. Moffett, K.B.; Makido, Y.; Shandas, V. Urban-Rural Surface Temperature Deviation and Intra-Urban Variations Contained by an Urban Growth Boundary. Remote Sens. 2019, 11, 2683. [Google Scholar] [CrossRef]
  16. Liang, X.; Liu, X.; Li, X.; Chen, Y.; Tian, H.; Yao, Y. Delineating multi-scenario urban growth boundaries with a CA-based FLUS model and morphological method. Landsc. Urban Plan. 2018, 177, 47–63. [Google Scholar] [CrossRef]
  17. Wu, X.; Liu, X.; Liang, X.; Chen, G. Multi-scenarios simulation of urban growth boundaries in Pearl River Delta based on FLUS-UGB. J. Geo-Inf. Sci. 2018, 20, 532–542. [Google Scholar]
  18. Ma, S.; Li, X.; Cai, Y. Delimiting the urban growth boundaries with a modified ant colony optimization model. Comput. Environ. Urban Syst. 2017, 62, 146–155. [Google Scholar] [CrossRef]
  19. Cerreta, M.; De Toro, P. Urbanization suitability maps: A dynamic spatial decision support system for sustainable land use. Earth Syst. Dyn. 2012, 3, 157–171. [Google Scholar] [CrossRef]
  20. Bhatta, B. Modelling of urban growth boundary using geoinformatics. Int. J. Digit. Earth 2009, 2, 359–381. [Google Scholar] [CrossRef]
  21. Cao, K.; Huang, B.; Wang, S.; Lin, H. Sustainable land use optimization using Boundary-based Fast Genetic Algorithm. Comput. Environ. Urban Syst. 2012, 36, 257–269. [Google Scholar] [CrossRef]
  22. Li, X.; Chen, G.; Liu, X.; Liang, X.; Wang, S.; Chen, Y.; Pei, F.; Xu, X. A New Global Land-Use and Land-Cover Change Product at a 1-km Resolution for 2010 to 2100 Based on Human-Environment Interactions. Ann. Am. Assoc. Geogr. 2017, 107, 1040–1059. [Google Scholar] [CrossRef]
  23. Zhang, D.; Liu, X.; Wu, X.; Yao, Y.; Wu, X.; Chen, Y. Multiple intra-urban land use simulations and driving factors analysis: A case study in Huicheng, China. GISci. Remote Sens. 2019, 56, 282–308. [Google Scholar] [CrossRef]
  24. Yang, X.; Bai, Y.; Che, L.; Qiao, F.; Xie, L. Incorporating ecological constraints into urban growth boundaries: A case study of ecologically fragile areas in the Upper Yellow River. Ecol. Indic. 2021, 124, 107436. [Google Scholar] [CrossRef]
  25. Yang, X.; Chen, R.; Zheng, X.Q. Simulating land use change by integrating ANN-CA model and landscape pattern indices. Geomat. Nat. Hazards Risk 2016, 7, 918–932. [Google Scholar] [CrossRef]
  26. Verburg, P.H.; Soepboer, W.; Veldkamp, A.; Limpiada, R.; Espaldon, V.; Mastura, S.S.A. Modeling the Spatial Dynamics of Regional Land Use: The CLUE-S Model. Environ. Manag. 2002, 30, 391–405. [Google Scholar] [CrossRef]
  27. Chen, Y.; Li, X.; Liu, X.; Ai, B. Modeling urban land-use dynamics in a fast developing city using the modified logistic cellular automaton with a patch-based simulation strategy. Int. J. Geogr. Inf. Sci. IJGIS 2014, 28, 234–255. [Google Scholar] [CrossRef]
  28. Liu, X.; Liang, X.; Li, X.; Xu, X.; Ou, J.; Chen, Y.; Li, S.; Wang, S.; Pei, F. A future land use simulation model (FLUS) for simulating multiple land use scenarios by coupling human and natural effects. Landsc. Urban Plan. 2017, 168, 94–116. [Google Scholar] [CrossRef]
  29. Liu, X.; Wei, M.; Li, Z.; Zeng, J. Multi-scenario simulation of urban growth boundaries with an ESP-FLUS model: A case study of the Min Delta region, China. Ecol. Indic. 2022, 135, 108538. [Google Scholar] [CrossRef]
  30. Liang, X.; Guan, Q.; Clarke, K.C.; Liu, S.; Wang, B.; Yao, Y. Understanding the drivers of sustainable land expansion using a patch-generating land use simulation (PLUS) model: A case study in Wuhan, China. Comput. Environ. Urban Syst. 2021, 85, 101569. [Google Scholar] [CrossRef]
  31. Li, C.; Wu, Y.; Gao, B.; Zheng, K.; Wu, Y.; Li, C. Multi-scenario simulation of ecosystem service value for optimization of land use in the Sichuan-Yunnan ecological barrier, China. Ecol. Indic. 2021, 132, 108328. [Google Scholar] [CrossRef]
  32. Gao, L.; Tao, F.; Liu, R.; Wang, Z.; Leng, H.; Zhou, T. Multi-scenario simulation and ecological risk analysis of land use based on the PLUS model: A case study of Nanjing. Sustain. Cities Soc. 2022, 85, 104055. [Google Scholar] [CrossRef]
  33. Wang, Z.; Li, X.; Mao, Y.; Li, L.; Wang, X.; Lin, Q. Dynamic simulation of land use change and assessment of carbon storage based on climate change scenarios at the city level: A case study of Bortala, China. Ecol. Indic. 2022, 134, 108499. [Google Scholar] [CrossRef]
  34. Tian, L.; Tao, Y.; Fu, W.; Li, T.; Ren, F.; Li, M. Dynamic Simulation of Land Use/Cover Change and Assessment of Forest Ecosystem Carbon Storage under Climate Change Scenarios in Guangdong Province, China. Remote Sens. 2022, 14, 2330. [Google Scholar] [CrossRef]
  35. Chen, Y.; Wang, J.; Xiong, N.; Sun, L.; Xu, J. Impacts of Land Use Changes on Net Primary Productivity in Urban Agglomerations under Multi-Scenarios Simulation. Remote Sens. 2022, 14, 1755. [Google Scholar] [CrossRef]
  36. Chen, C.; Liu, Y. Spatiotemporal changes of ecosystem services value by incorporating planning policies: A case of the Pearl River Delta, China. Ecol. Model. 2021, 461, 109777. [Google Scholar] [CrossRef]
  37. Wang, X.; Yao, Y.; Ren, S.; Shi, X. A coupled FLUS and Markov approach to simulate the spatial pattern of land use in rapidly developing cities. J. Geo-Inf. Sci. 2022, 24, 100–113. [Google Scholar]
  38. Li, S.; Liu, X.; Li, X.; Chen, Y. Simulation model of land use dynamics and application: Progress and prospects. J. Remote Sens. 2017, 21, 329–340. [Google Scholar]
  39. Huang, Z.; Li, S.; Gao, F.; Wang, F.; Lin, J.; Tan, Z. Evaluating the performance of LBSM data to estimate the gross domestic product of China at multiple scales: A comparison with NPP-VIIRS nighttime light data. J. Clean. Prod. 2021, 328, 129558. [Google Scholar] [CrossRef]
  40. Chen, X.; Nordhaus, W.D. VIIRS Nighttime Lights in the Estimation of Cross-Sectional and Time-Series GDP. Remote Sens. 2019, 11, 1057. [Google Scholar] [CrossRef]
  41. Li, S.; Lyu, D.; Liu, X.; Tan, Z.; Gao, F.; Huang, G.; Wu, Z. The varying patterns of rail transit ridership and their relationships with fine-scale built environment factors: Big data analytics from Guangzhou. Cities 2020, 99, 102580. [Google Scholar] [CrossRef]
  42. Li, S.; Lyu, D.; Huang, G.; Zhang, X.; Gao, F.; Chen, Y.; Liu, X. Spatially varying impacts of built environment factors on rail transit ridership at station level: A case study in Guangzhou, China. J. Transp. Geogr. 2020, 82, 102631. [Google Scholar] [CrossRef]
  43. Yi, D.; Guo, X.; Han, Y.; Guo, J.; Ou, M.; Zhao, X. Coupling Ecological Security Pattern Establishment and Construction Land Expansion Simulation for Urban Growth Boundary Delineation: Framework and Application. Land 2022, 11, 359. [Google Scholar] [CrossRef]
  44. Wang, W.; Jiao, L.; Zhang, W.; Jia, Q.; Su, F.; Xu, G.; Ma, S. Delineating urban growth boundaries under multi-objective and constraints. Sustain. Cities Soc. 2020, 61, 102279. [Google Scholar] [CrossRef]
  45. Liu, Y.; Yan, B.; Wang, Y. Urban-Rural Development Problems and Transformation Countermeasures in the New Period in China. Econ. Geogr. 2016, 36, 1–8. [Google Scholar]
  46. Vimal, R.; Geniaux, G.; Pluvinet, P.; Napoleone, C.; Lepart, J. Detecting threatened biodiversity by urbanization at regional and local scales using an urban sprawl simulation approach: Application on the French Mediterranean region. Landsc. Urban Plan. 2012, 104, 343–355. [Google Scholar] [CrossRef]
  47. Shoemaker, D.A.; BenDor, T.K.; Meentemeyer, R.K. Anticipating trade-offs between urban patterns and ecosystem service production: Scenario analyses of sprawl alternatives for a rapidly urbanizing region. Comput. Environ. Urban Syst. 2019, 74, 114–125. [Google Scholar] [CrossRef]
  48. Dupras, J.; Marull, J.; Parcerisas, L.; Coll, F.; Tello, E. The impacts of urban sprawling on ecological patterns and processes in the Montreal Metropolitan Region (Quebec, Canada) between 1966 and 2010. Environ. Sci. Policy 2016, 58, 61–73. [Google Scholar] [CrossRef]
  49. Chen, Z.; Wang, F.; Li, S.; Feng, Y.; Chen, J. Classification of county leading function types and pattern recognition of Its spatial structure based on multi-source data. J. Geo-Inf. Sci. 2021, 23, 2215–2223. [Google Scholar]
  50. Han, G.; Zhao, K.; Yuan, X.; Sun, R. Evaluation of Ecological Sensitivity in Mountain Area Based on Spatial Analysis: A Case Study of Wanyuan City in Sichuan Province. J. Mt. Sci. 2008, 5, 531–537. [Google Scholar]
  51. Levin, N.; Duke, Y. High spatial resolution night-time light images for demographic and socio-economic studies. Remote Sens. Environ. 2012, 119, 1–10. [Google Scholar] [CrossRef]
  52. Cui, H.; Zhang, J.; Li, H.; Yao, F.; Huang, H.; Weiqing, M. Integration of Multinomial-Logistic and Markov-Chain Models to Derive Land-Use Change Dynamics. Am. Soc. Civ. Eng. 2014, 141, 05014017. [Google Scholar]
  53. Song, M.; Chen, D.; Woodstock, K.; Zhang, Z.; Wu, Y. An RP-MCE-SOP Framework for China’s County-Level “Three-Space” and “Three-Line” Planning—An Integration of Rational Planning, Multi-Criteria Evaluation, and Spatial Optimization. Sustainability 2019, 11, 2997. [Google Scholar] [CrossRef] [Green Version]
Figure 1. Location of the study area.
Land 11 01598 g001
Figure 2. Spatial driving factors of LULC change simulation.
Land 11 01598 g002
Figure 3. The flowchart of the proposed framework.
Land 11 01598 g003
Figure 4. SD model of land-use demand projection. The symbols of + and − indicates the influence of the former to the latter, respectively positive influence and negative influence.
Land 11 01598 g004
Figure 5. The comparison between the simulated LULC and the observed LULC in 2020.
Land 11 01598 g005
Figure 6. The contribution of each driving factor to the growth of urban land and industrial land.
Land 11 01598 g006
Figure 7. The LULC change map of 2015–2020.
Land 11 01598 g007
Figure 8. Simulated LULC patterns in 2035 and land expansion maps from 2020 to 2035 under different scenarios.
Land 11 01598 g008
Figure 9. UGBs delineation results of Xinxing County in 2035 under different scenarios. The a2, b2, c2, d2 show the UGBs delineation of sub-region1, the a3, b3, c3, d3 show the UGBs delineation of sub-region2.
Land 11 01598 g009
Table 1. List of the data used in this study.
CategoryDataYearData Resource
Land useLand use data of Xinxing County2015Geographical information monitoring cloud platform (http://www.dsac.cn/dataproduct/detail/200804) (accessed on 1 June 2022)
Land use data of Xinxing County2020
Statistical YearbookGDP2015–2020Statistics Bureau of Yunfu (https://www.yunfu.gov.cn/yftjj/gkmlpt/mindex#679) (accessed on 1 May 2022)
Fixed asset investment2015–2020
Permanent population2015–2020
Urban population2015–2020
Grain production2015–2020
Restricted areaPrime farmland protection area2020Natural resources bureau of Xinxing County (http://www.xining.gov.cn/yfxxzrzy/gkmlpt/index/) (accessed on 1 May 2022)
Ecological sensitive area2020Derived from spatial analysis of ArcGIS
Driving factorsDistance to railway2020Open Street Map (http://www.openstreetmap.org/) (accessed on 1 March 2022)
Distance to main road2020
Distance to highway2020
Distance to water2020
Distance to county government2018Baidu Map API (http://apistore.baidu.com/)
(accessed on 1 March 2022)
Distance to town government2018
DEM2020Geospatial Data Cloud (http://www.gscloud.cn/) (accessed on 1 May 2022)
Slope2020
Aspect2020
Industrial companies density2017Social Big Data Platform of East China Normal University
(http://sdsp.ecnu.edu.cn/sdp)
(accessed on 1 March 2022)
Public facilities2017
Economic development2019Earth Observation Group of NOAA (https://eogdata.mines.edu/products/vnl/)
(accessed on 1 March 2022)
Population density2019Huang et al. [39]
Table 2. Scenario setting.
ScenariosScenarios DescriptionSimulation Constraints
Natural development (ND)This scenario does not consider any policy constraints on land development. The development of future demand would follow the historical law of LULC change. Therefore, the results of this scenario can be used as a reference for the simulation results of other scenarios.No constraint.
Farmland protection (FP)Protecting the quantity and quality of prime farmland is crucial to maintaining regional food security. Thus, it is necessary to limit land conversion in the prime farmland area to prevent the rapid loss of prime farmland owing to uncontrolled urban expansion.Taking prime farmland protection area as the restriction and prohibiting the farmland in this area from conversion.
Ecological protection (EP)Ecological security is essential for the maintenance of biodiversity and regional environmental quality. Hence, the protection of ecological security pattern should receive attention.Taking the ecologically sensitive areas as restricted area where the LULC within it is unable to be converted.
Table 3. Comparison between projected areas and actual areas of 2020 (km2).
FarmlandForestlandGrass LandWater AreaUrban LandRural AreaIndustrial Land
Actual area329.781003.6455.6224.2916.3347.4925.62
Simulated area330.751004.8955.2123.4815.7746.1525.98
Relative error0.3%0.12%0.74%3.36%3.43%1.38%0.04%
Table 4. Land-use demand projection of 2035 under different scenarios (km2).
Type MarkovSystem Dynamics
ND ScenarioFP ScenarioEP Scenario
2020203520352035
Farmland329.79307.36326.16320.01
Forestland1003.64991.57999.261004.89
Grassland55.6257.0953.5254.41
Water area24.2925.0824.7624.76
Urban land16.3327.5223.7223.72
Rural area47.4948.145.5245.15
Industrial land25.6246.0629.8429.84
Publisher’s Note: MDPI stays neutral with regard to jurisdictional claims in published maps and institutional affiliations.

