Article

Social Justice in Urban–Rural Flood Exposure: A Case Study of Nanjing, China

1
School of Architecture, Nanjing Tech University, Nanjing 211816, China
2
School of Government, Central University of Finance and Economics, Beijing 100081, China
3
Institute of Geographic Sciences and Natural Resources Research, CAS, Beijing 100101, China
*
Author to whom correspondence should be addressed.
Land 2022, 11(9), 1588; https://doi.org/10.3390/land11091588
Submission received: 30 July 2022 / Revised: 25 August 2022 / Accepted: 12 September 2022 / Published: 16 September 2022
(This article belongs to the Special Issue Sustainable Rural Transformation under Rapid Urbanization)

Abstract

:
The environmental justice research on urban–rural exposure to flooding is underdeveloped and few empirical studies have been conducted in China. This study addresses this gap by exploring the probabilities of exposure to floods (10-, 20-, and 50-year) and examining the relationship between vulnerable groups and flooding in Nanjing, an important central city on the Yangtze River. Statistical analysis is based on multivariable generalised estimating equation (GEE) models that describe sociodemographic disparities at the census-tract level. The results revealed that (1) highly educated people in the urban centre are more likely to live in areas with high flood risk because of the abundance of education resources, and employment opportunities are concentrated in the urban centre. (2) Natives in suburban areas are more likely to live in flood-prone areas due to their favourable ecological environments near rivers and lakes. (3) Women in rural areas are more likely to live in high-flood-risk zones because most of the men are migrant workers. These findings highlight the urgent need to develop mitigation strategies to reduce flood exposure, especially in districts with high proportions of socially disadvantaged people. The linkages between rural and urban areas need to be strengthened in order to reduce flood exposure.

1. Introduction

Extreme flood events have become more frequent and intense, thereby leading to gradual changes in societal processes (e.g., economic losses, house collapse and reduced agricultural production), disrupting rural–urban linkages and affecting urban security [1]. Global flood risk is expected to increase due to climate change and the continued urbanisation in the floodplains, especially in Asia and Africa [2]. With the increasing levels of computing power and the amount of data in recent years, flood hazards can now be accurately simulated. However, a crucial element remains missing in the additional flood-risk-modelling approach, namely, the socioeconomic factors of people and assets (e.g., income, age and ethnicity), which are also important in analysing the losses resulting from urban flood disasters [3,4,5]. Therefore, the social impact of flood disasters should be integrated into the flood-risk assessment [1,3,6,7].
In recent decades, environmental justice issues have become increasingly important in evaluating the risk of environmental hazards [8,9]. Using the environmental justice analysis framework, quantitative studies have evaluated the relations between people and the environment. Some basic points in analysing the environmental justice of flooding are to determine who is living in areas with a risk of flooding, who is especially vulnerable to this risk and who is disproportionately exposed to various environmental hazards and risks [8,10,11].
Studies on the environmental justice of floods have produced ambiguous findings regarding the relationships between vulnerable groups and floods. However, these empirical studies have largely focused on the disproportionality in pre-flood hazard exposure and ignored the disproportionality associated with actual flood events [12]. Since the emergence of environmental justice in the 1980s, many quantitative studies have established a relationship between the environmental and social differences [10,11,12,13]. Environmental justice includes distributive justice, cognitive justice and procedural justice [13]. A prominent topic in quantitative environmental justice research is distributive justice, which focuses on the allocation of resources, responsibilities and costs of environmental hazards and on the uneven distribution of environmental risks across social groups and geographical spaces [9,11,14,15]. By using statistical and spatial analysis methods to examine the relationship between population attributes and environmental hazards, previous studies on distributive justice have revealed whether social groups experience disproportionate risks of environmental hazards [11,12]. Due to their limited access to resources, vulnerable groups are more exposed to floods and less able to cope and recover from flood disasters, which has been widely supported by empirical evidence. For example, when exposed to the same level of an urban flood disaster, the vulnerable groups suffer from a greater risk than the rich [16].
This study contributes to the literature in the following ways. First, most previous studies have examined those people living in areas with high risk of flooding and revealed a high proportion of immigrants, ethnic minorities, elderly, children and disabled people living in these areas; these people also reported a lower recovery rate during floods compared with other groups [17,18,19,20,21]. Previous studies from the social vulnerability perspective have confirmed a correlation between flood risk and vulnerable groups such that those communities with a higher proportion of vulnerable groups tend to experience a more serious flood risk [22,23,24]. They rarely examined the difference between urban and rural areas of social spatial inequality in flood disasters, which is crucial for environmental justice analysis for two reasons. On the one hand, many related problems can be ascribed to the parasitic relationship or exploitation status between urban and rural communities [25]. This situation is particularly serious in developing countries that are witnessing a rapid urbanisation and are lacking in facilities and resources in their rural areas. On the other hand, socioeconomic, demographic, environmental and governance changes are due to the interdependencies between rural and urban areas. Flooding leads to changes in the rural–urban linkages and affects rural vulnerability [26]. This article addresses the limitations of these environmental justice studies and extends their coverage to the effects of floods on urban–rural linkages.
Second, urban–rural differences have been studied, but few studies have focused on the impact of flood disasters. The existing studies have focused on evaluating rural–urban linkage changes after an extreme flood event and cultivating disaster resilience in rural communities from the aspects of social capital [26,27,28]. Taking Palestine as an example, Jamshed et al. (2020) found that rural communities located close to large cities face a lower social vulnerability and a higher flood risk [26]. Taking the Dorso region in Niger as an example, Tiepolo and Galligari (2021) found that rural areas face more severe flood risks and higher poverty rates than cities [28]. Straub et al. (2020) took rural areas in Oklahoma as an example and found that the insulation from social networks in urban areas increases the vulnerability in rural communities [27].
Third, existing studies on environmental justice have mostly focused on urban areas in developed countries without paying much attention to developing countries, which is inconsistent with the reality of developing countries facing a higher flood risk and a weaker response capacity compared with developed countries. For instance, Fielding et al. (2012) found that the poorest also had the lowest awareness of flood risk [29]. Collins et al. (2018) used Miami and Houston as examples and revealed the relationship between environmental justice and flood risk [12]. Smiley et al. (2020) found severe spatial inequalities within flood areas [30]. Liao et al. (2019) found that flood control measures did not eliminate flood risk but resulted in an unfair flood redistribution [15]. Carvalho et al. (2022) found that the infrastructures and insurance policies for flood risk mitigation differed in terms of space, such that the whole society shared the cost of the investment or tax and that only few groups benefited from these policies [31]. These studies have also examined the relationship between the social characteristics of the regional population and the risk distribution of flood disasters from the environmental justice perspective.
Previous studies on the environmental justice of flood disasters have focused on the spatial inequality in cities, whilst urban–rural linkages have been rarely explored from the environmental justice perspective. Flooding leads to changes in rural–urban linkages and affects rural vulnerability [26]. This article addresses the limitations of these environmental justice studies and extends their coverage to the effects of floods on urban–rural linkages. This research supplements the previous empirical investigations of the environmental justice of flood disasters in developing countries by exploring the causes and mechanism of the spatial distribution between flood disasters and population characteristics in China, evaluating the social problems caused by the spatial differentiation of flood risks and providing support for the development of environmental justice theory and the formulation of relevant policies.

2. Materials and Method
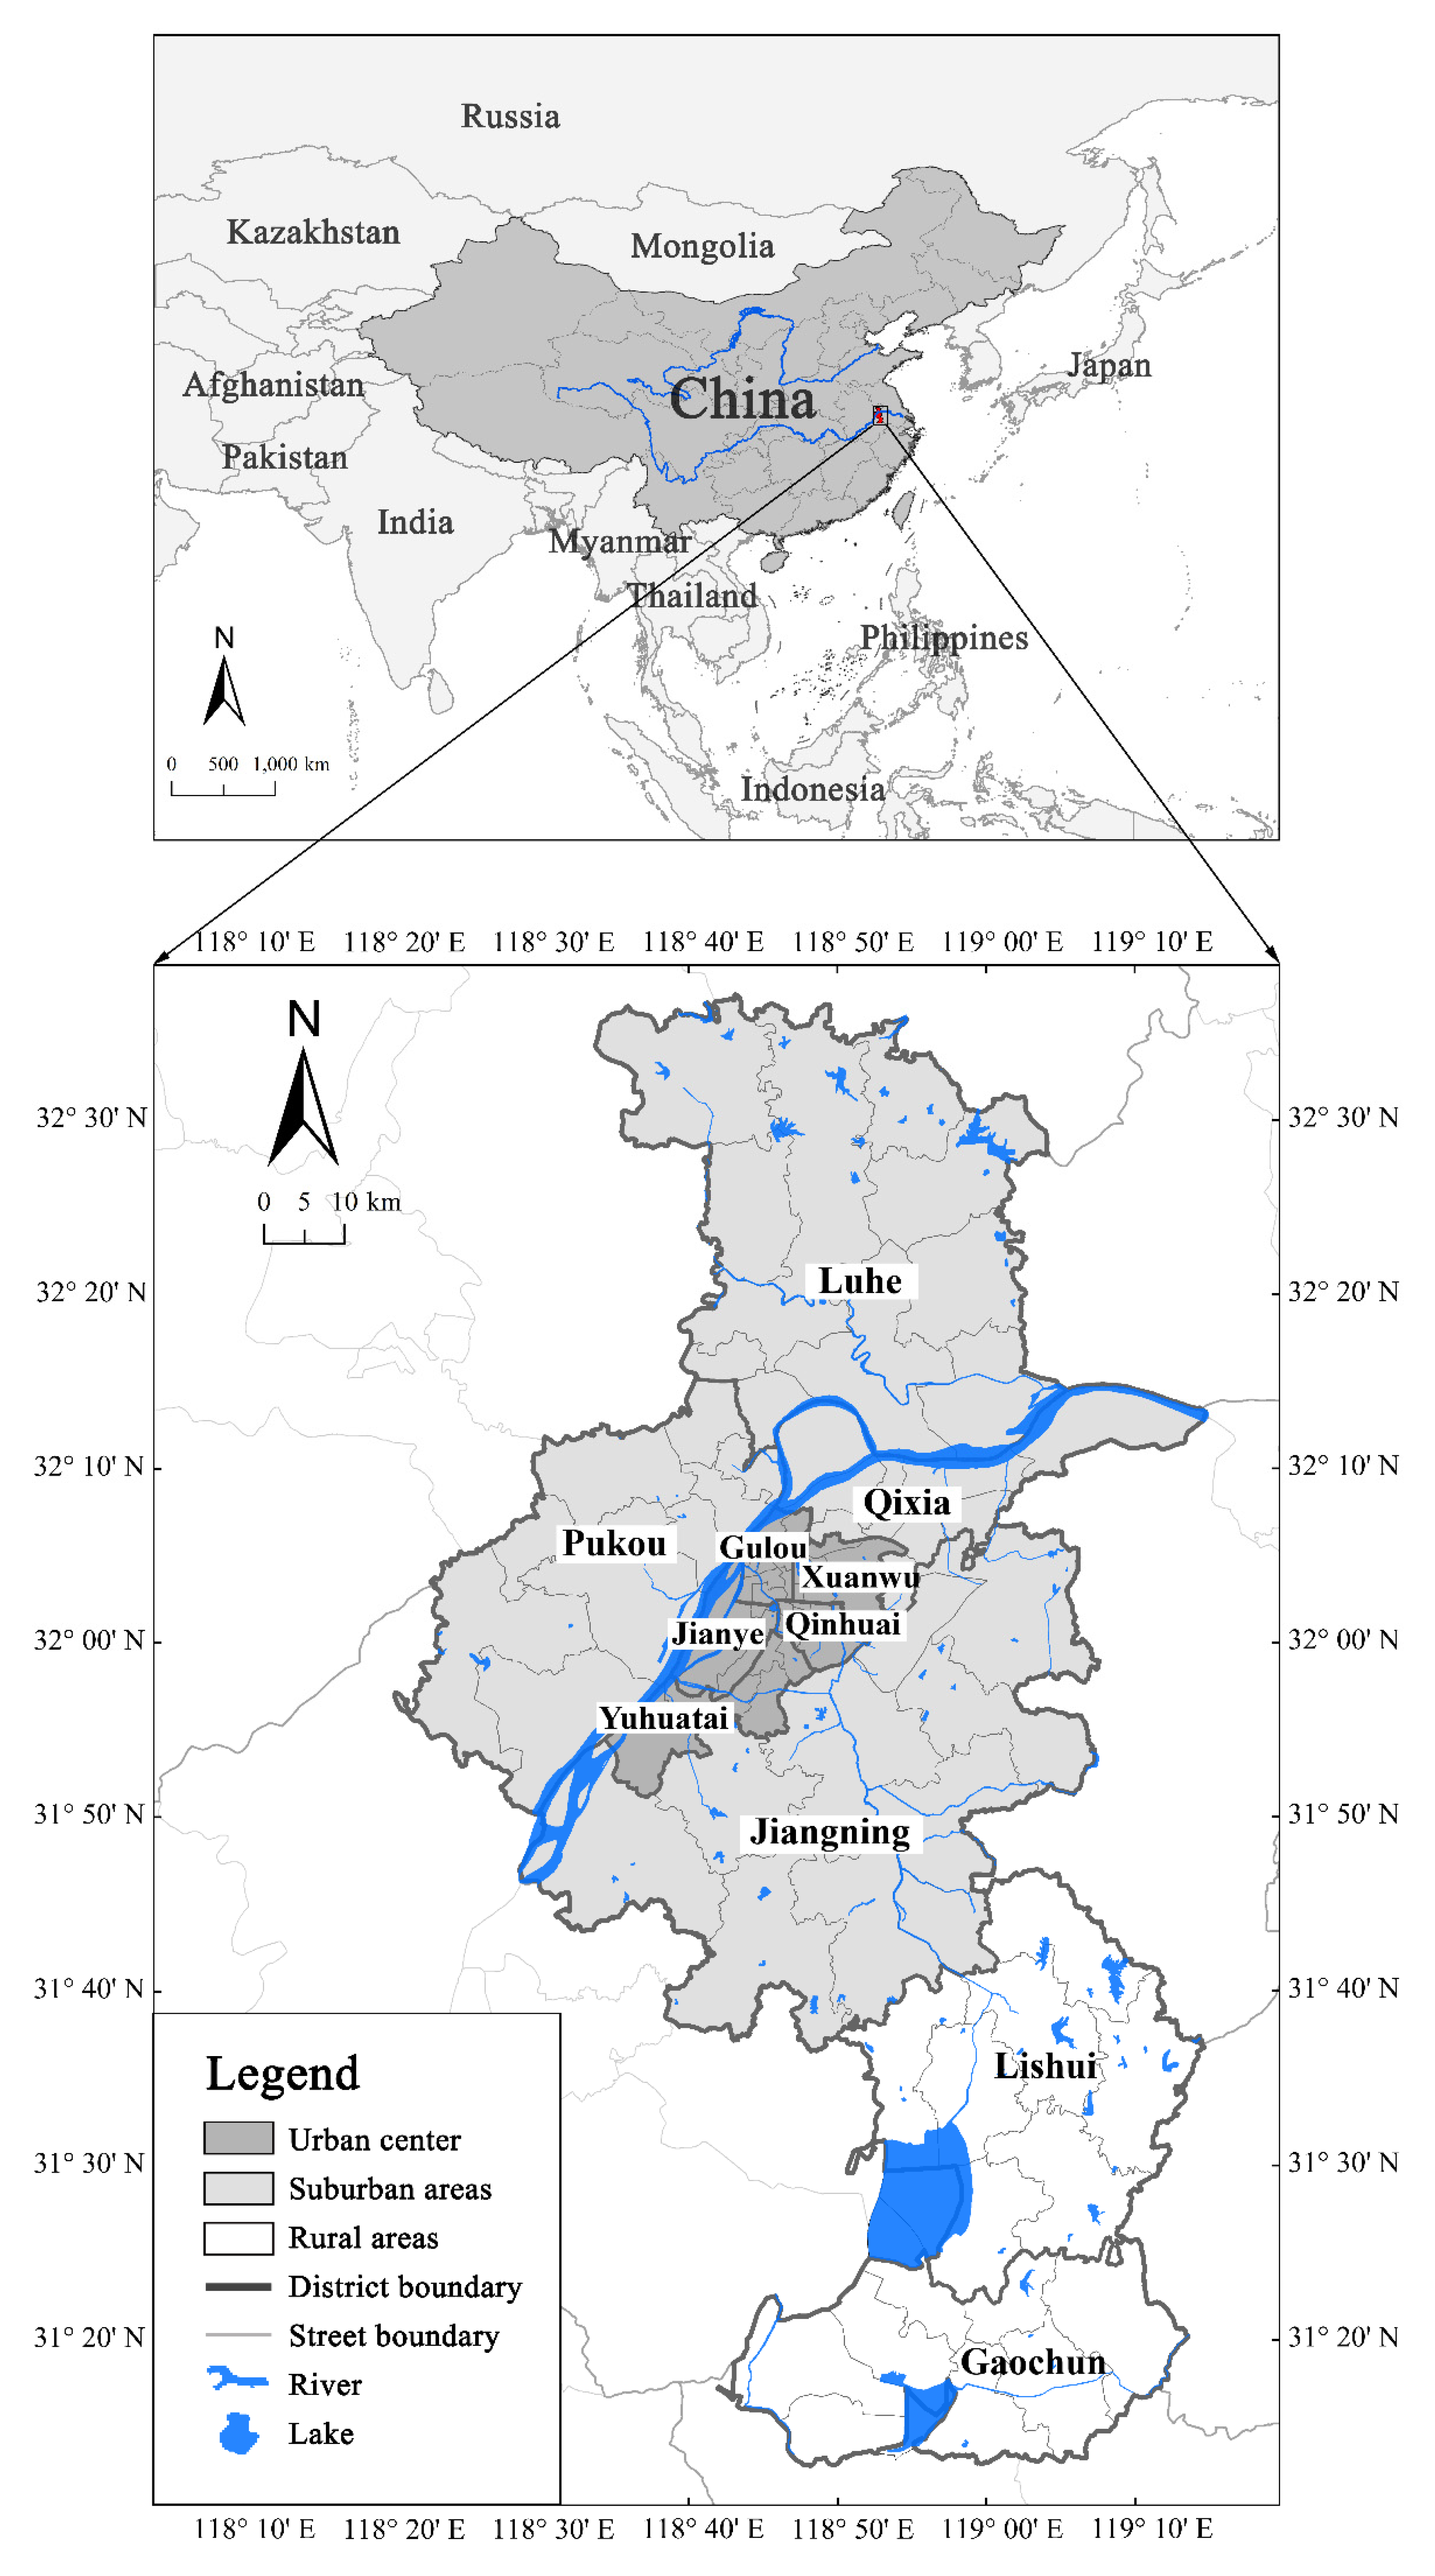
2.1. Study Area

Nanjing is the capital of Jiangsu Province and an important central city in the Yangtze River Economic Belt. In 2020, Nanjing had a land area of 6587 km2 (with rivers and lakes accounting for 11%), a population of 9.31 million and an urbanisation rate of 86.80%. The city has an average annual precipitation of more than 1100 mm, and its flooding season usually ranges from May to September. Nanjing is treated as the sample city in the Flood Control Emergency Plan of China.
Nanjing comprises 11 municipal districts with 99 census tracts, its urban centre comprises 5 municipal districts (Xuanwu, Qinhuai, Jianye, Yuhuatai and Gulou) with 44 census tracts, its suburban areas consist of 4 municipal districts (Pukou, Qixia, Jiangning, Yuhuatai and Luhe) with 40 census tracts and its rural areas comprise 2 municipal districts (Lishui and Gaochun) with 15 census tracts (Figure 1).

2.2. Data

(1) Flood data. ① Remote-sensing images were obtained from Landsat 8 (NASA, Washington, DC, USA) satellite images with medium resolution on September 2018. Soil-type data were obtained from the publication ‘1:1 million soil type data of Jiangsu Province’. Land-use data were acquired from the remote-sensing images of Nanjing captured in 2010 by GlobeLand30. The Mercator Projection correction was adopted. ② Rainfall data were obtained from the Nanjing Meteorological Station and by using the rainstorm intensity formula. The daily rainfall data from June to September 2015 were used to simulate the historical daily runoff depth. The maximum daily rainfall data from three probabilities (P = 10-, 20- and 50-year) were used to simulate the daily runoff depth under extreme flood disaster scenarios. ③ To calculate the proportion of flood inundation, the flood runoff depth map was intersected with the built-up area map, and then the proportion of the high-flood-risk area in the built-up area was computed. A proportion closer to 1 corresponds to a greater proportion of the waterlogging-prone area in the street. (2) Demographic data were derived from the Sixth Census of the Nanjing Municipal Bureau of Statistics (2010). Six variables were used to measure the proportion of vulnerable groups, including the elderly, children, immigrants, agricultural households, females and the low-education population. The value range was [0, 1], and a value closer to 1 corresponds to a greater proportion of vulnerable groups in the census tract.

2.3. Methods

To explore the basic relationships between environmental justice and floods, the bivariate correlations between each explanatory variable and the dependent variable were evaluated. Spearman’s correlation coefficients were used as a non-parametric measure to reduce the effect of outliers. In the second phase, GEEs were used to test the statistical association between the proportion of flood inundation and the demographic variables and to test the difference between urban and rural areas. Statistical analysis methods for testing social correlates of flood exposure include spatial regression methods and multilevel modelling approaches [32,33,34,35]. Compared to other models, the GEE is suited for analysing social inequalities in the distribution of environmental hazards [9,34,35,36]. The GEE model extends the generalised linear model to accommodate clustered data and to relax several assumptions of traditional regression models [37]. In the field of environmental research, the GEE has been widely used to test the relationship between the natural and social environment and individual health, and recent studies have applied this model to issues of environmental justice in places such as North America and Asia [12,33,38,39,40,41]. Recent studies show that GEEs are more advantageous for analysing social inequalities in the distribution of environmental hazards compared with other models, such as spatial autoregressive models and multilevel modelling approaches [35,36,42]. In this study, four GEE models were constructed according to the characteristics of the whole region, city centre, suburban areas and rural areas to understand the differences between urban and rural areas in terms of their social equity of flood disaster risks. The quasi-likelihood under the independence model criterion (QIC) was then used along with its simplified value (QICC) as references to select the model type. The QIC is considered the most appropriate statistic for evaluating several aspects of the GEE model fit, including the distribution and link function [43]. The model that yields the lowest QIC and QICC values obtains the best fit.

2.4. Variables

The choice of variables was initially guided by previous environmental justice studies conducted at the metropolitan level and those that focused on social inequities in flood hazards [20,32,35,44]. All the explanatory variables are provided in Table 1. The dependent variables for this study include the proportion of the built-up area to flooding runoff depth exceeding 0.4 m within each census tract, and the value range is from 0 to 1.
The independent variables include the six population variables (i.e., proportion of the elderly, children, immigrants, females, agricultural households and low-education population), which reflect the demographic characteristics of each census tract. The elderly may have mobility constraints or concerns, hence increasing their burden of care and decreasing their resilience. Children are the most affected by floods and lack of security. Immigrants have a lack of access to resources and face social and economic marginalisation, which is often associated with social disparities. Females are generally more vulnerable to floods than males. Agricultural households and low-education populations generally have low educational attainment and poor disaster prevention awareness. These groups are particularly vulnerable in the face of natural disasters and usually take a long time to recover [45].

3. Results and Discussion

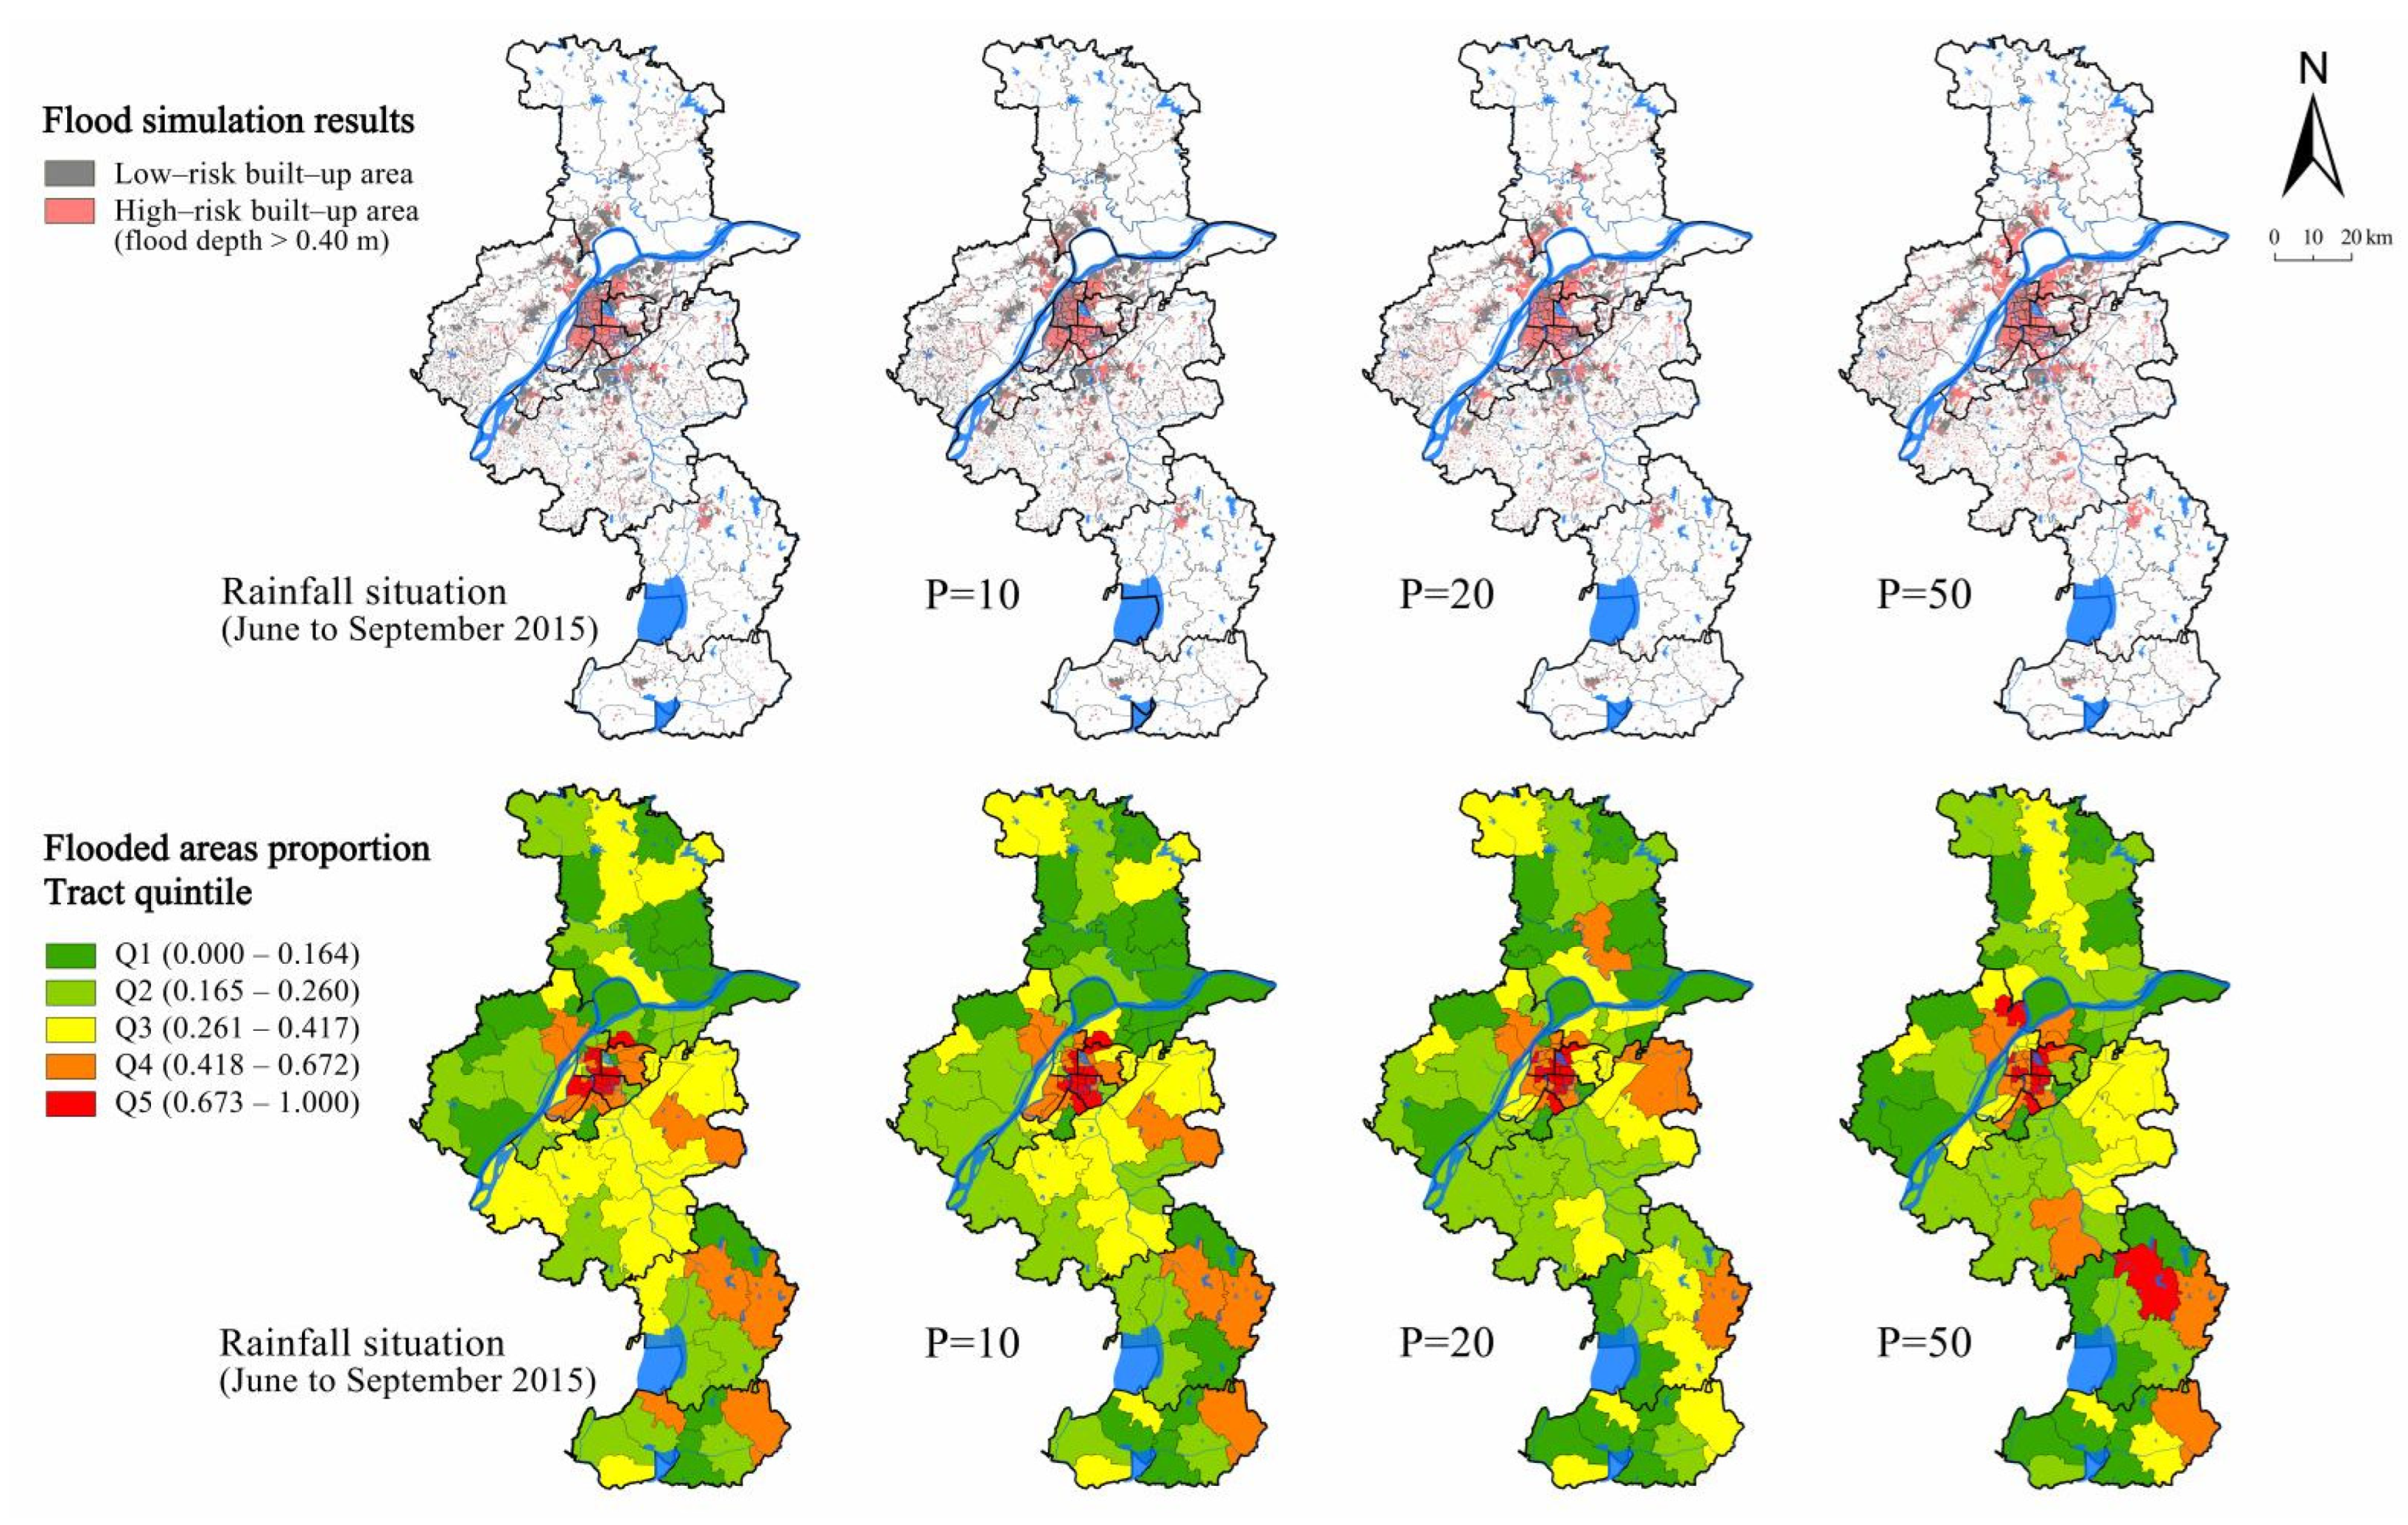
3.1. Measuring Exposure to Flood Risk

The spatial distribution of flooding in Nanjing is presented as a classified map in Figure 2. On this map, those places with depths exceeding 0.4 m may pose serious urban flooding risks. The entirety of Nanjing is assumed to experience 10-, 20- and 50-year (P = 10, 20, 50) rainstorms for 180 min, and the rainstorm intensity formula (2014) from the website of the Meteorological Bureau of Nanjing Municipality was used. The census tracts were grouped into five quartiles based on the proportion of the flooded tract area. The census tracts in the highest quartile (top 20%) of the flooded proportion were primarily located in the urban centre, whereas the census tracts in the lowest quartile were primarily located in suburban areas, especially in the north of the Yangtze River. Meanwhile, those census tracts between the highest and lowest quartiles for the flooded proportion were primarily located in rural areas.
The descriptive statistics for all the variables are presented in Table 2. Taking June to September 2015 as an example, for the vulnerable group, the flood extent was significantly and positively correlated with the proportion of the elderly, females and immigrants but was negatively correlated with the proportion of the agricultural population. The census tracts in the highest quartile (top 20%, Q5) for the proportion of the resident population was 23.99%, and the census tracts in the lowest quartile (bottom 20%, Q1) for the proportion of the resident population was 15.74%, thereby suggesting that many residents are living in high-flood-risk areas. Those people who are exposed to urban flooding include the elderly, immigrants and females, of which the difference between the highest and lowest quartiles for the flooded proportion was 8.67%, 9.30% and 8.48%, respectively. The exposure of children and the low-education population showed no significant differences between the highest and lowest quartiles for the flooded proportion (3.96% and 2.81%, respectively). Meanwhile, agricultural households showed some differences between the highest and lowest quartiles for the flooded proportion (–10.85%), thereby indicating that agriculture households are located in low-flood-risk areas and highlighting the significant differences in the flood risk being faced by the urban and rural residents of Nanjing.
Given the differences in the flooded proportion of the six vulnerable groups in Nanjing (Figure 3), the high exposure of the elderly, females and immigrants to flood risk greatly depends on their location. For instance, the elders were found to live in the old community in the urban centre due to the availability of good public infrastructure and hospitals. Meanwhile, children and agricultural households reported non-linear characteristics and were found to be mostly located in middle- and low-flood-risk areas. Around 27.54% of the low-education population were found to be living in those areas with the highest flood risk.

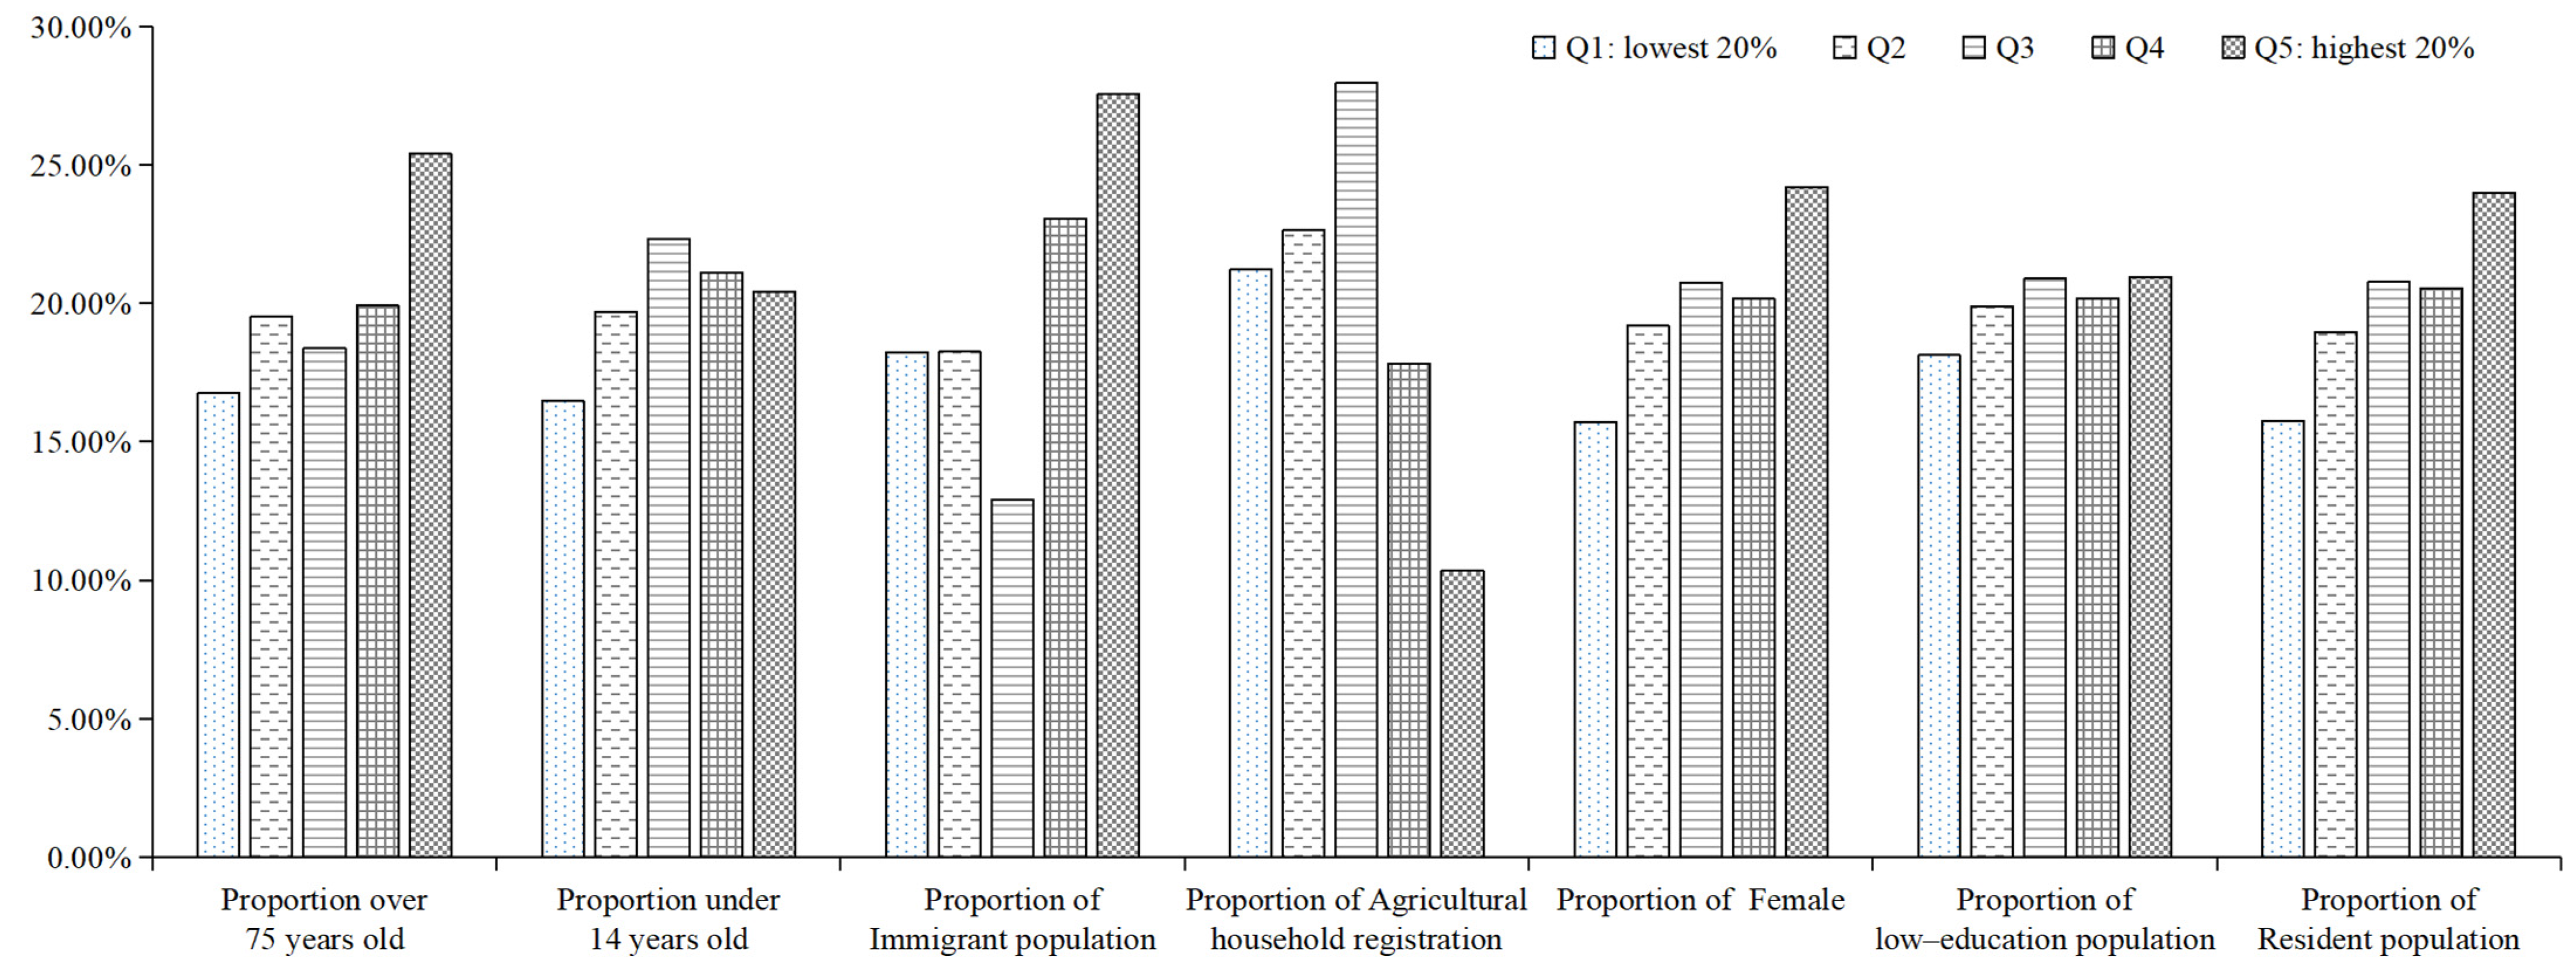
3.2. Comparison of Group in Flood Exposure

Whilst the descriptive analysis provides a preliminary understanding of the association between each tract-level characteristic in the distribution of flood risks, the significance of these statistical relationships is unknown. The correlation coefficients associated with each explanatory variable are presented in Table 3. All the variables indicate a significant association with flood risk, which is consistent with the descriptive statistics results based on Pearson’s correlation coefficients. In the whole city, children, agricultural households and the low-education population reported the strongest correlation with flood risks at the 1% level of significance. In the urban centre, the elderly and females showed the strongest positive correlation with flood risk, whilst children and agricultural households showed the strongest negative correlation with flood risk, and the significance passed 5%. Meanwhile, in suburban areas, immigrants and the low-education population showed the strongest correlation with flood risk at the 1% level of significance. In rural areas, no significant correlation was reported between the vulnerable groups and flood risk.
The results from the GEEs summarising the associations between the census-tract flood risk and the proportion of vulnerable groups are presented in Table 4. Four GEE models for the whole region, urban centre, suburban areas and rural areas were built (Table 4). The best statistical fit was determined using the QIC and QICC model criteria. The variance inflation factor (VIF) ranged from 1.409 to 4.019, whereas the tolerance criteria scores ranged from 0.249 to 0.710, thereby suggesting that the models were not affected by multicollinearity.
The numbers in the Exp (Beta) column can be interpreted as the percentage change in the proportion of the flooded census-tract area for each standard-deviation increase in the independent variables. Under the return periods of 10 and 20 years, suburban areas (p = 0.010, p = 0.001) and rural areas (p = 0.035, p = 0.035) revealed a statistically significant and negative relationship with the proportion of flood risk, thereby indicating that the flood exposure in suburban and rural areas was lower than that in the urban centre. The urban centre of Nanjing is located around the Xuanwu Lake and near the Yangtze River. Such low-lying terrain characteristics intensify the influence of rainstorms, hence increasing flood risk [46,47]. By contrast, under the return period of 50 years, the flood exposure of suburban and rural areas did not show significant differences from that of the urban centre (Table 4, Table 5 and Table 6).
The low-education population in the urban centre is at a significantly lower flood risk (p = 0.002, p = 0.000) compared with the high-education population under the 10- and 20-year flood-risk scenarios. However, the low-education population in suburban aeras (−0.060) and rural areas (0.020) faces a high flood risk (Table 4). The high-education population tends to purchase water-oriented housing, which has a significant positive association with socioeconomic status and flood risk. The housing in suburban and rural areas is cheaper than that in the urban centre, and given that both the high- and low-education populations have more residence location options, no significant differences were reported between suburban and rural areas (Table 5). Both agricultural households (p = 0.000) and the low-education population (p = 0.000) reported the strongest correlation under the 50-year flood-risk scenario, thereby pointing towards the high flood exposure of non-agricultural households and the high-educated population in the urban centre (Table 6).
Immigrants (p = 0.010) and females (p = 0.001) showed a significantly negative correlation with 10-year flood risk in suburban areas (Table 4), whereas immigrants (p = 0.000, p = 0.006) and agricultural households (p = 0.000, p = 0.001) reported a significantly negative correlation with the 20- and 50-year flood risks in suburban areas (Table 5 and Table 6). Those immigrants living in suburban areas also face a lower flood risk compared with the natives. The housing commercialisation reform in China since 1998 has triggered a housing construction boom in suburban areas. Most buildings in the urban centre are old and compact yet lack modern facilities. Accordingly, despite the high flood risk, many natives in Nanjing who have better socioeconomic conditions tend to choose water-oriented housing in suburban areas due to their better ecological environment and facilities [12,46].
Children (p = 0.000) had a significantly negative correlation with 10-year flood risk in rural areas, whereas females (p = 0.015) reported a significantly positive correlation. In addition, children (p = 0.009) and agricultural households (p = 0.000) had negative and significant correlations with 20-year flood risk in rural areas, whereas females (p = 0.000) reported a positive and significant correlation. Children (p = 0.001) and agricultural households (p = 0.018) had negative and significant correlations with 50-year flood risk in rural areas. Urban and tourism agriculture tends to attract non-agricultural households and females to rural areas. For example, due to their proximity to Shijiu Lake and Gucheng Lake, women in the rural areas of Nanjing are vulnerable to flood hazards, which aggravate the disaster-related losses in such low-lying areas [47,48]. Urban areas have historical records of floods and a relatively high proportion of male migrant workers. Women also have lower coping abilities than men in flood events. Along with flood hazards, the labour outflow in the rural areas of China further aggravates the negative social impacts of flood disasters.
By comparing the 10-, 20- and 50-year flood-risk scenarios, this study investigated the spatial and social distributions of flood risk, and the results suggested that the levels of exposure to flood risk are considerably high in the urban centre of Nanjing. A higher flood risk also corresponded to greater differences amongst the vulnerable groups. However, no significant differences were reported between urban and rural areas under the 50-year flood-risk scenario, hence suggesting that the high-educated population, natives and the non-agricultural population are significantly more likely to reside within flood-risk zones. These results also indicated that the census tracts in the urban centre have significantly high flood risk and a low poverty rate. Both the highly educated and natives showed a significantly positive correlation with 10- and 20-year flood risk in the urban centre, thereby highlighting the relative absence of socioeconomic status and flood risk in China.

4. Discussion

This study uses the case of Nanjing to understand the relationship between environment and social differences and floods from the environmental justice perspective. The social and spatial inequities in the exposure to flood risk differ across the urban centre, suburban areas and rural areas of the city. The implications for environmental research on flood hazards in rapidly urbanising cities in developing countries are also provided.
This research highlights the importance of combining flood risk and sociodemographic data from the environmental justice perspective. Studies on environmental justice have mostly focused on the ethnic minorities and immigrants in western countries and have ignored the special sociodemographic characteristics of China, including its agricultural population, hukou and migrant workers. Social and spatial inequalities also vary from the urban centre to rural areas, which has not been examined from an environmental justice perspective. The spatial distribution of flood disaster risk in Nanjing shows a central–peripheral pattern (i.e., the risk is high in the urban centre and rural areas but low in suburban areas). Some significant differences in flood risk can also be observed amongst the residents in the urban centre, suburban areas and rural areas. The high-educated population in the urban centre, the natives in suburban areas and the females and non-agriculture households in rural areas all face a high flood risk, whereas the agricultural population faces a low exposure to flood risk.
In addition to identifying specific sociodemographic variables that relate to flood-risk exposure, this case study extends the current research by demonstrating that the risks of flooding are heterogeneous not only among groups, but also in spaces. The findings clearly indicated that socioeconomic status of residents differs based on the probability of flooding. Females in rural areas are significantly more likely to reside in high-flood-risk zones and highly educated people in the urban centre are more likely to reside in high-flood-risk zones. Previous studies indicated that social groups are disproportionately affected by flooding in developed countries, and residents with both high and low socioeconomic status are more likely to reside in high-flood-risks zones [16,17,20,21,22,30,31].
This article contributes to the environmental justice literature by clarifying the socio-spatial inequities in flood-risk exposure in Nanjing, which is a typical city in China with a high flood risk. Environmental justice scholars have only examined the ethnic and socioeconomic inequities in exposure in the context of western countries. Unlike previous environmental justice studies that did not consider the urban–rural differences of vulnerable groups [44,49], this study systematically distinguishes the socioeconomic inequities in the flood risk of urban centres from that of exurban centres, which is critical due to the differences between the vulnerable groups in these locations, which in turn may influence the social patterns of risk exposure. Moreover, unlike previous studies on the social disparities in exposure to flood risks that have mainly relied on only one flood-risk scenario [44](, this study systematically distinguishes the 10-, 20- and 50-year probabilities of flood risk. The results predicted the different flood-risk probabilities and social inequities in the spatial distribution of flood hazard exposure.
There are still some limitations that may open related avenues for future research. Firstly, this study uses census-based data on risk perception, residential decision making and hazard mitigation instead of survey and semi-structured interview data. Secondly, given that China has no official flood-risk map, this study relies on simulation results obtained using the rainstorm intensity formula by ArcSWAT. Future studies should consider flood zone categories that are consistent with national documents to accurately predict the social inequalities in the spatial distribution of flood hazard exposure. Thirdly, China’s transformation from a planned economy to a market economy has increased the diversity in its residential choice and migration, thereby introducing spatial inequalities in flood-risk distribution. Future studies should analyse the mechanism of environmental justice to provide a better understanding of environmental inequities.
Despite these limitations, this study provides strong evidence of the socioeconomic inequities in the potential exposure to flood hazards in Nanjing. Although further research is necessary to characterise the impacts of flooding, the analysis of socio-spatial inequities should be downscaled to the household level. This article represents an important step in examining the differences between the vulnerable groups residing in urban and rural flood-prone areas and their environmental injustice implications.

5. Conclusions

The spatial differentiation of Nanjing City to urban flooding shows some spatial inequality. The social and spatial inequalities in floods can be attributed to the urban overutilisation and rural underutilisation of public resources in China [50]. The commercialisation of the real estate market has also intensified the migration of natives from the urban centre to the suburban areas located near rivers or lakes with a better ecological environment, thereby increasing their flood exposure. Meanwhile, the centralised distribution of educational resources in the urban centre attracts the high-educated population, which has a high flood risk. Immigrants and females in rural areas show significant correlations with flood risk. The comparison of 10-, 20- and 50-year flood risk reveals that along with the intensification of rainstorm events, the difference in flood risk amongst the vulnerable groups will increase, whereas the difference in flood risk between urban and rural areas will decrease.
This study offers policy implications for those natives living in suburban areas (especially on the riverside) with high flood risk. The master plan of Nanjing (2018–2035) includes the strategy of ‘Embracing the River for Development’. Natives with better socio–economic status tend to purchase housing in the suburbs, especially in areas with good ecological environments near rivers or lakes. This trend is consistent with the fact that the elite groups in the west are prone to floods [12,46]. However, unlike in developing countries, the flood disasters in developed countries are covered by insurance, hence eliminating the risk for these elite groups. By contrast, China has no relevant policies that cover those people living in flood-prone riverside districts. In implementing the Flood Act, policymakers should also subsidise flood insurance for low-income households residing in high-risk zones. This subsidisation can facilitate housing development and residential risk taking in flood-prone riverside locations.

Author Contributions

Y.C.: Conceptualisation, Methodology, Writing—Original Draft, Writing—Review & Editing, Project administration, Funding acquisition. H.L.: Conceptualisation, Resources, Writing—Review & Editing, Supervision, Funding acquisition. Z.Y.: Formal analysis, Data Curation, Writing—Original Draft. H.Z.: Conceptualisation, B.J.: Model calculation. Y.Z.: Original Draft, Writing, Data Curation. All authors have read and agreed to the published version of the manuscript.

Funding

This research is supported by the National Natural Science Foundation of China (41701186, 41801146, 41771119). Humanity and Social Science Youth Foundation of Ministry of Education (17YJCZH029,18YJC840022). Ministry of Science and Technology of the People’s Republic of China (2017YFC1503001).

Data Availability Statement

Not applicable.

Conflicts of Interest

The authors declare no conflict of interest.

References

  1. Wing, O.E.J.; Lehman, W.; Bates, P.D.; Sampson, C.C.; Quinn, N.; Smith, A.M.; Neal, J.C.; Porter, J.R.; Kousky, C. Inequitable patterns of US flood risk in the Anthropocene. Nat. Clim. Chang. 2022, 12, 156–162. [Google Scholar] [CrossRef]
  2. Aerts, J.C.J.H. Integrating agent-based approaches with flood risk models: A review and perspective. Water Secur. 2020, 11, 100076. [Google Scholar] [CrossRef]
  3. Aerts, J.C.J.H.; Botzen, W.J.; Clarke, K.; Cutter, S.L.; Hall, J.W.; Merz, B.; Michel-Kerjan, E.; Mysiak, J.; Surminski, S.; Kunreuther, H. Integrating human behaviour dynamics into flood disaster risk assessment. Nat. Clim. Chang. 2018, 8, 193–199. [Google Scholar] [CrossRef]
  4. Li, M.; Kwan, M.-P.; Yin, J.; Yu, D.; Wang, J. The potential effect of a 100-year pluvial flood event on metro accessibility and ridership: A case study of central Shanghai, China. Appl. Geogr. 2018, 100, 21–29. [Google Scholar] [CrossRef]
  5. Fang, J.Y.; Lincke, D.; Brown, S.; Nicholls, R.J.; Wolff, C.; Merkens, J.L.; Hinkel, J.; Vafeidis, A.T.; Shi, P.J.; Liu, M. Coastal flood risks in China through the 21st century—An application of DIVA. Sci. Total Environ. 2020, 704, 135311. [Google Scholar] [CrossRef] [PubMed]
  6. Jongman, B.; Hochrainer-Stigler, S.; Feyen, L.; Aerts, J.C.J.H.; Mechler, R.; Botzen, W.J.W.; Bouwer, L.M.; Pflug, G.; Rojas, R.; Ward, P.J. Increasing stress on disaster-risk finance due to large floods. Nat. Clim. Chang. 2014, 4, 264–268. [Google Scholar] [CrossRef]
  7. Knighton, J.; Hondula, K.; Sharkus, C.; Guzman, C.; Elliott, R. Flood risk behaviors of United States riverine metropolitan areas are driven by local hydrology and shaped by race. Proc. Natl. Acad. Sci. USA 2021, 118, e2016839118. [Google Scholar] [CrossRef]
  8. Walker, G.; Burningham, K. Flood risk, vulnerability and environmental justice: Evidence and evaluation of inequality in a UK context. Crit. Soc. Policy 2011, 31, 216–240. [Google Scholar] [CrossRef]
  9. Collins, T.W.; Grineski, S.E.; Chakraborty, J. Environmental injustice and flood risk: A conceptual model and case comparison of metropolitan Miami and Houston, USA. Reg. Environ. Chang. 2017, 18, 311–323. [Google Scholar] [CrossRef]
  10. Brown, J.D.; Damery, S.L. Managing flood risk in the UK: Towards an integration of social and technical perspectives. Trans. Inst. Br. Geogr. 2003, 27, 412–426. [Google Scholar] [CrossRef]
  11. Mohai, P.; Pellow, D.; Roberts, J.T. Environmental Justice. Annu. Rev. Environ. Resour. 2009, 34, 405–430. [Google Scholar] [CrossRef]
  12. Collins, T.W.; Grineski, S.E.; Nadybal, S. Social disparities in exposure to noise at public schools in the contiguous United States. Environ. Res. 2019, 175, 257–265. [Google Scholar] [CrossRef] [PubMed]
  13. Schlosberg, D.; Collins, L.B. From environmental to climate justice: Climate change and the discourse of environmental justice. WIREs Clim. Change 2014, 5, 359–374. [Google Scholar] [CrossRef]
  14. Kaufmann, M.; Priest, S.J.; Leroy, P. The undebated issue of justice: Silent discourses in Dutch flood risk management. Reg. Environ. Chang. 2016, 18, 325–337. [Google Scholar] [CrossRef] [PubMed]
  15. Liao, K.-H.; Chan, J.K.H.; Huang, Y.-L. Environmental justice and flood prevention: The moral cost of floodwater redistribution. Landsc. Urban Plan. 2019, 189, 36–45. [Google Scholar] [CrossRef]
  16. Turner, B.L., 2nd; Kasperson, R.E.; Matson, P.A.; McCarthy, J.J.; Corell, R.W.; Christensen, L.; Eckley, N.; Kasperson, J.X.; Luers, A.; Martello, M.L.; et al. A framework for vulnerability analysis in sustainability science. Proc. Natl. Acad. Sci. USA 2003, 100, 8074–8079. [Google Scholar] [CrossRef] [PubMed]
  17. Zahran, S.; Brody, S.D.; Peacock, W.G.; Vedlitz, A.; Grover, H. Social vulnerability and the natural and built environment: A model of flood casualties in Texas. Disasters 2008, 32, 537–560. [Google Scholar] [CrossRef]
  18. Burningham, K.; Fielding, J.; Thrush, D. ‘It’ll never happen to me’: Understanding public awareness of local flood risk. Disasters 2008, 32, 216–238. [Google Scholar] [CrossRef]
  19. Zhang, Y.; Peacock, W.G. Planning for Housing Recovery? Lessons learned from Hurricane Andrew. J. Am. Plan. Assoc. 2009, 76, 5–24. [Google Scholar] [CrossRef]
  20. Chakraborty, J.; Collins, T.W.; Montgomery, M.C.; Grineski, S.E. Social and Spatial Inequities in Exposure to Flood Risk in Miami, Florida. Nat. Hazards Rev. 2014, 15, 04014006. [Google Scholar] [CrossRef]
  21. Chen, Y.; Liu, T.; Ge, Y.; Xia, S.; Yuan, Y.; Li, W.R.; Xu, H.Y. Examining social vulnerability to flood of affordable housing communities in Nanjing, China: Building long-term disaster resilience of low-income communities. Sustain. Cities Soc. 2021, 71, 102939. [Google Scholar] [CrossRef]
  22. Koks, E.E.; Jongman, B.; Husby, T.G.; Botzen, W.J.W. Combining hazard, exposure and social vulnerability to provide lessons for flood risk management. Environ. Sci. Policy 2015, 47, 42–52. [Google Scholar] [CrossRef]
  23. Chakraborty, J.; Grineski, S.E.; Collins, T.W. Hurricane Harvey and people with disabilities: Disproportionate exposure to flooding in Houston, Texas. Soc. Sci. Med. 2019, 226, 176–181. [Google Scholar] [CrossRef] [PubMed]
  24. Poussard, C.; Dewals, B.; Archambeau, P.; Teller, J. Environmental Inequalities in Flood Exposure: A Matter of Scale. Front. Water 2021, 3, 633046. [Google Scholar] [CrossRef]
  25. Kelly-Reif, K.; Wing, S. Urban-rural exploitation: An underappreciated dimension of environmental injustice. J. Rural Stud. 2016, 47, 350–358. [Google Scholar] [CrossRef]
  26. Jamshed, A.; Birkmann, J.; McMillan, J.M.; Rana, I.A.; Feldmeyer, D.; Sauter, H. How do rural-urban linkages change after an extreme flood event? Empirical evidence from rural communities in Pakistan. Sci. Total Environ. 2020, 750, 141462. [Google Scholar] [CrossRef]
  27. Straub, A.M.; Gray, B.J.; Ritchie, L.A.; Gill, D.A. Cultivating disaster resilience in rural Oklahoma: Community disenfranchisement and relational aspects of social capital. J. Rural Stud. 2019, 73, 105–113. [Google Scholar] [CrossRef]
  28. Tiepolo, M.; Galligari, A. Urban expansion-flood damage nexus: Evidence from the Dosso Region, Niger. Land Use Policy 2021, 108, 105547. [Google Scholar] [CrossRef]
  29. Fielding, J.L. Inequalities in exposure and awareness of flood risk in England and Wales. Disasters 2011, 36, 477–494. [Google Scholar] [CrossRef]
  30. Smiley, K.T. Social inequalities in flooding inside and outside of floodplains during Hurricane Harvey. Environ. Res. Lett. 2020, 15, 0940b3. [Google Scholar] [CrossRef]
  31. Carvalho, L.; Mackay, E.B.; Cardoso, A.C.; Baattrup-Pedersen, A.; Birk, S.; Blackstockf, K.L.; Borics, G.; Borja, A.; Feld, C.K.; Ferreira, M.T.; et al. Protecting and restoring Europe’s waters: An analysis of the future development needs of the Water Framework Directive. Sci. Total Environ. 2019, 658, 1228–1238. [Google Scholar] [CrossRef]
  32. Grineski, S.E.; Collins, T.W.; Ford, P.; Fitzgerald, R.; Aldouri, R.; Velázquez-Angulo, G.; Romo Aguilar, M.D.L.; Lu, D. Climate change and environmental injustice in a bi-national context. Appl. Geogr. 2012, 33, 25–35. [Google Scholar] [CrossRef]
  33. Grineski, S.E.; Collins, T.W. Geographic and social disparities in exposure to air neurotoxicants at US public schools. Environ. Res. 2018, 161, 580–587. [Google Scholar] [CrossRef] [PubMed]
  34. Messager, M.L.; Ettinger, A.K.; Murphy-Williams, M.; Levin, P.S. Fine-scale assessment of inequities in inland flood vulnerability. Appl. Geogr. 2021, 133, 102492. [Google Scholar] [CrossRef]
  35. Chakraborty, J.; McAfee, A.A.; Collins, T.W.; Grineski, S.E. Exposure to Hurricane Harvey flooding for subsidized housing residents of Harris County, Texas. Nat. Hazards 2021, 106, 2185–2205. [Google Scholar] [CrossRef]
  36. Chakraborty, L.; Rus, H.; Henstra, D.; Thistlethwaite, J.; Minano, A.; Scott, D. Exploring spatial heterogeneity and environmental injustices in exposure to flood hazards using geographically weighted regression. Environ. Res. 2022, 210, 112982. [Google Scholar] [CrossRef]
  37. Liang, K.Y.; Zeger, S.L. Longitudinal data analysis using generalized linear models. Biometrika 1986, 73, 13–22. [Google Scholar] [CrossRef]
  38. Nadybal, S.M.; Collins, T.W.; Grineski, S.E. Light pollution inequities in the continental United States: A distributive environmental justice analysis. Environ. Res. 2020, 189, 109959. [Google Scholar] [CrossRef]
  39. Wu, C.-D.; Chern, Y.-R.; Pan, W.-C.; Lung, S.-C.C.; Yao, T.-C.; Tsai, H.-J.; Spengler, J.D. Effects of surrounding environment on incidence of end stage renal disease. Sci. Total Environ. 2020, 723, 137915. [Google Scholar] [CrossRef]
  40. Hasunuma, H.; Takeuchi, A.; Ono, R.; Amimoto, Y.; Hwang, Y.H.; Uno, I.; Shimizu, A.; Nishiwaki, Y.; Hashizume, M.; Askew, D.J.; et al. Effect of Asian dust on respiratory symptoms among children with and without asthma, and their sensitivity. Sci. Total. Environ. 2021, 753, 141585. [Google Scholar] [CrossRef]
  41. Callender, R.; Canales, J.M.; Avendano, C.; Craft, E.; Ensor, K.B.; Miranda, M.L. Economic and mental health impacts of multiple adverse events: Hurricane Harvey, other flooding events, and the COVID-19 pandemic. Environ. Res. 2022, 214, 114020. [Google Scholar] [CrossRef] [PubMed]
  42. Collins, T.W.; Jimenez, A.M.; Grineski, S.E. Hispanic health disparities after a flood disaster: Results of a population-based survey of individuals experiencing home site damage in El Paso (Texas, USA). J. Immigr. Minority Health 2013, 15, 415–426. [Google Scholar] [CrossRef]
  43. Pan, W. Akaike’s information criterion in generalized estimating equations. Biometrics 2001, 57, 120–125. [Google Scholar] [CrossRef]
  44. Maantay, J.; Maroko, A. Mapping urban risk: Flood hazards, race, environmental justice in New York. Appl. Geogr. 2009, 29, 111–124. [Google Scholar] [CrossRef] [PubMed]
  45. Cutter, S.L.; Boruff, B.J.; Lynn Shirley, W. Social Vulnerability to Environmental Hazards. Soc. Sci. Q. 2003, 84, 242–261. [Google Scholar] [CrossRef]
  46. Wisner, B.; Blaikie, P.; Cannon, T.; Davis, I. At Risk, Natural Hazards, People’s Vulnerability and Disasters; Routledge: London, UK, 2004. [Google Scholar]
  47. Chen, J.; Gao, J.; Chen, W. Urban land expansion and the transitional mechanisms in Nanjing, China. Habitat Int. 2016, 53, 274–283. [Google Scholar] [CrossRef]
  48. Wang, B.; Loo, B.P.Y.; Zhen, F.; Xi, G. Urban resilience from the lens of social media data: Responses to urban flooding in Nanjing, China. Cities 2020, 106, 102884. [Google Scholar] [CrossRef]
  49. Fielding, J. Environmental injustice or just the lie of the land: An investigation of the socio-economic class of those at risk from flooding in England and Wales. Sociol. Res. Online 2007, 12, 12–34. [Google Scholar] [CrossRef]
  50. Song, J.; Chang, Z.; Li, W.; Feng, Z.; Wu, J.; Cao, Q.; Liu, J. Resilience-vulnerability balance to urban flooding: A case study in a densely populated coastal city in China. Cities 2019, 95, 102381. [Google Scholar] [CrossRef]
Figure 1. Location of Nanjing, China.
Land 11 01588 g001
Figure 2. Proportion of flooded census-tract area of Nanjing, China.
Land 11 01588 g002
Figure 3. The proportion of six categories of vulnerable groups for the flooded proportion in Nanjing.
Land 11 01588 g003
Table 1. Variable definitions and summary statistics for variables used in Nanjing, China.
VariableDescriptionMinMaxMeanSD
Dependent Variable
proportion of built-up area inundated by floodPercentage of built-up area with surface runoff depth more than 0.4 m in urban areas (%)0.0141.0000.3970.260
Independent Variable
Proportion of elderly peoplePercent of population over 75 years (%)0.0090.1620.0980.030
Proportion of childrenPercent of population under 14 years (%)0.0230.1430.0970.019
Proportion of immigrantsPercent of immigrant population (%)0.0150.7280.3250.138
Proportion of agricultural household
registration
Percent of agricultural household registration (%)0.0380.9850.4780.335
Proportion of femalesPercent of females (%)0.3910.5220.4810.021
Percent of low-education populationPercent of low-education population (≤9 years of education)0.1230.9750.7690.184
Table 2. Distribution differences of six categories of vulnerable groups for the flooded proportion in Nanjing.
Total (People)Q1: Lowest 20%Q2Q3Q4Q5: Highest 20%Q5–Q1: Difference
Proportion over 75 years old699,21416.74%19.52%18.39%19.94%25.41%8.67%
Proportion under 14 years old727,83316.46%19.68%22.33%21.11%20.42%3.96%
Proportion of immigrant population2,243,00818.23%18.25%12.92%23.06%27.54%9.30%
Proportion of females3,709,43015.72%19.19%20.74%20.15%24.20%8.48%
Proportion of low-education population5,499,17118.12%19.88%20.89%20.17%20.93%2.81%
Proportion of resident population7,695,18715.74%18.95%20.76%20.55%23.99%8.25%
Table 3. Bivariate correlation analysis of flood risk and explanatory variables.
The Whole CityUrban CentreSuburban AreasRural Areas
psSig.psSig.psSig.psSig.
Proportion over 75 years old (%)−0.1240.2220.3750.012 *−0.2220.168−0.1140.685
Proportion under 14 years old (%)−0.3160.001 **−0.3340.027 *−0.2180.177−0.2070.459
Proportion of immigrant population (%)−0.0590.5640.1310.398−0.5250.001 **−0.0390.889
Proportion of agricultural household registration (%)−0.4670.000 **−0.3310.028 *−0.1400.3880.0290.919
Proportion of females (%)−0.0340.7370.3110.040 *−0.2300.1530.2110.451
Proportion of low-education population (%)−0.4520.000 **−0.1880.222−0.3390.033 *−0.3110.260
Sample size99444015
Note: * p < 0.05, ** p < 0.01. All the variables were standardised. ps stands for Spearman’s, Sig. stand for significance.
Table 4. GEEs for predicting the area of the flooded proportion over 10 years with respect to the vulnerable groups. P = 10.
P = 10The Whole CityUrban CentreSuburban AreasRural Areas
BetaSig.BetaSig.BetaSig.BetaSig.
Intercept0.7430.000 **0.8980.000 **0.4250.000 **0.8070.003 **
Urban centre
Suburban areas−0.2570.010 *
Rural areas−0.1590.035 *
Proportion over 75 years old (%)0.2590.0770.2590.3180.0980.310−0.6780.005 **
Proportion under 14 years old (%)−0.2100.176−0.3280.0500.1190.479−0.6820.000 **
Proportion of immigrant population (%)−0.0640.6670.0770.686−0.2800.010 *0.0610.770
Proportion of agricultural household registration (%)−0.1770.031 *0.0470.870−0.1090.1520.0610.819
Proportion of females (%)−0.0210.865−0.0410.827−0.1410.001 **0.6740.015 *
Proportion of low-education population (%)−0.2450.057−1.2730.002 **−0.0600.4630.0200.875
QIC27.93616.2329.6859.365
QICC21.62216.06414.81414.207
∣QIC–QICC∣6.3140.1685.1294.842
Sample size99444015
*p < 0.05, ** p < 0.01. All the variables were standardised.
Table 5. GEEs for predicting the area of the flooded proportion over 20 years with respect to the vulnerable groups. P = 20.
The Whole CityUrban CentreSuburban AreasRural Areas
BetaSig.BetaSig.BetaSig.BetaSig.
Intercept0.8330.000 **0.8090.000 **0.6380.000 **0.9270.000 **
Urban centre
Suburban areas−0.2140.001 **
Rural areas−0.1320.035 *
Proportion over 75 years old (%)0.2890.031 *0.3650.1220.0510.8050.1030.780
Proportion under 14 years old (%)−0.1270.385−0.1550.4010.2620.089−0.8160.009 **
Proportion of immigrant population (%)−0.1410.245−0.0400.827−0.3390.000 **0.2620.326
Proportion of agricultural household registration (%)−0.2480.002 **0.2240.349−0.2710.000 **−0.5390.000 **
Proportion of females (%)−0.0130.9010.0350.790−0.2200.2630.6500.000 **
Proportion of low-education population (%)−0.2380.074−1.2250.000 **0.0320.7370.2050.342
QIC21.93612.3559.3909.622
QICC21.17115.23915.03414.195
∣QIC–QICC∣0.7652.8845.6444.573
Sample size99444015
*p < 0.05, ** p < 0.01. All the variables were standardised.
Table 6. GEEs for predicting the area of the flooded proportion over 50 years with respect to the vulnerable groups. P = 50.
P = 50The Whole CityUrban CentreSuburban AreasRural Areas
BetaSig.BetaSig.BetaSig.BetaSig.
Intercept0.8600.000 **0.7880.000 **0.7550.000 **1.8140.000 **
Urban centre
Suburban areas−0.1480.083
Rural areas−0.0710.270
Proportion over 75 years old (%)0.2140.1340.3340.087−0.0320.914−0.2120.530
Proportion under 14 years old (%)−0.0010.997−0.0190.9150.3810.098−1.2280.001 **
Proportion of immigrant population (%)−0.1170.4500.0780.591−0.3200.006 **0.2800.369
Proportion of agricultural household registration (%)−0.2290.015 *−0.2330.001 **−0.1930.001 **−0.7190.018 *
Proportion of females (%)−0.0560.617−0.0930.491−0.3000.1690.5130.113
Proportion of low-education population (%)−0.2290.005 **−0.5010.000 **−0.0120.901−0.0630.694
QIC21.63110.32112.64610.220
QICC21.33014.93715.40714.360
∣QIC–QICC∣0.3014.6162.7614.140
Sample size99444015
*p < 0.05, ** p < 0.01. All the variables were standardised.
Publisher’s Note: MDPI stays neutral with regard to jurisdictional claims in published maps and institutional affiliations.

