Abstract
It is foreseeable that the next few decades will be the golden age of high-speed rail (HSR) development, with many new construction plans emerging. The construction of the HSR will inevitably cause an impact on the economic spatial structure of urban agglomeration, but it is still unclear whether the impacts differ between economically developed and developing areas. How and to what extent do such differences exist? Based on the modified gravity model, this paper employs a social network analysis method and selects the Yangtze River Delta and Sichuan-Chongqing (Chuanyu) urban agglomeration as the research area to analyze the differences. The main conclusions are as follows. With the construction of HSR: (1) The network density and the average economic connection of urban agglomerations have shown a trend of gradual increase. (2) The number of core areas in developed regions has gradually increased, but there were no changes in the center of developing regions. (3) In developed regions, the new metropolitan areas are the cities that have benefited the most from the HSR construction. In developing regions, the central city with difficult topography benefits the most. (4) The network structure of developed regions tends to be more balanced. The edge cities in developing regions are getting farther from the center.
1. Introduction
High-speed rail (HSR) is a type of passenger rail transport that operates significantly faster than the normal speed of rail traffic, with a speed of more than 250 km/h. The Japanese Shinkansen, which connected Tokyo and Osaka in 1964, was the first commercial HSR in the world. As a punctual and comfortable vehicle, HSR is an important carrier of personnel circulation nowadays. From the perspective of advantage, HSR mainly solves the production factors matching issue by reducing the transportation time of travelers [1]. Passengers are also an important carrier of information flow, which can promote factor exchange and cooperation between cities, and expand to a larger urban agglomeration [2,3].
Urban agglomeration refers to an urban group with compact spatial organization and economic ties within a certain range, relying on developed infrastructure such as transportation and communication [4]. With the construction of HSR, the urban agglomeration has become the basic unit of cooperation and competition [5]. As a unit, the urban agglomeration is the result of economic-spatial integration based on economic connection and transportation networks [6]. For a long time, urban agglomeration and eco-spatial structure have always been important research contents. The economy-space problem has always been the core issue of urban and regional research [7].
The construction of the HSR will inevitably cause an impact on the economic spatial structure of urban agglomeration [8]. The space compression effect produced by HSR construction promotes the rapid exchange of information and capital in a wider space [9]. Thus, resources converge to the central hub, and cities are connected by HSR. The traditional “core-periphery” urban agglomeration structure has been broken, and the regional economic spatial structure has been reconfigured [10]. Whether from a short-term or long-term perspective, the investment and construction of HSR is an important reason to attract capital into the surrounding areas, thereby changing the economic structure [11]. A study analyzed China’s traffic data from 2005 to 2015 and found that the contribution rate of traffic infrastructure to investment inflow reached the level of 38.4%. However, the benefits are more pronounced in areas with larger populations [12,13]. It seems that the impact of HSR construction is different in different regions. So, does HSR construction have different impacts on economic spatial structure in the regions with different levels of development?
How does HSR construction affect the economic spatial structure of urban agglomerations at different levels? Is there any difference between the impacts on economically developed and developing areas? How and to what extent do these differences exist? The investment amount in HSR is huge, and there is a the long period of construction. If the impacts of HSR construction in the areas are different, what types of regions should be given priority? What factors should guide decisions on HSR investment and construction in the future? It is foreseeable that the next few decades will be the golden age of HSR development [14]. Many new construction plans have emerged in recent years, but there are no significant differences in construction planning between developed and developing areas [15]. There are very few studies for reference. At present, most regions have not achieved a well-developed HSR. According to the data of the International Union of Railway, by the end of 2021, the total mileage of the top 10 countries who have HSR is 62,589 km, while that of China is 38,207 km—more than the combined mileage of the other nine countries. China has built highly developed HSR systems in both developed and developing areas, so its experience is valuable [16]. Based on the social network analysis method, this study compares the influence of HSR construction on the economic spatial structure of urban agglomerations with different levels of development and explores the causes. The research results will be conducive to clarifying the economic significance of HSR for different urban agglomerations and cities, in order to enhance the positive economic efficiency of HSR and promote high-quality coordinated development.
The main innovations of this paper are the following three aspects: (1) Conducting a longitudinal and cross-sectional comparison. The Yangtze River Delta urban and Sichuan-Chongqing (Chuanyu) urban agglomeration are selected as the study areas, and both of them have well-developed HSR but are vastly different on the economic level [17,18]. Based on the data, we conducted a longitudinal comparison year by year and then conducted a cross-sectional comparison between the regions. (2) Introducing the influencing factors of HSR, and using the time cost distance to replace the space distance. The previous studies have seldom considered the impact of HSR while investigating the economic spatial structure of urban agglomeration. In this study, by introducing traffic data, the time cost distance is used to replace space distance. The revised gravitational model is used to calculate the gravity between cities, and to simulate the changes in the economic spatial structure. (3) Introducing 11 factors to the index system of urban comprehensive economy. The model value derived from the population and GDP will no longer accurately describe the comprehensive quality of cities, with the continuous expansion of the scale of modern urban agglomeration. Therefore, referring to recent research [19], this study selects three typical indicators, namely, urban economic potential, population, and industrial structure as the first-level indicators. We select 11 secondary indicators such as government public budget, per capita income of urban residents, the number of employed persons, etc. The entropy method is used to calculate the weight of indicators.
2. Methodology
2.1. Research Areas
With the implementation of the “Medium-Long Term HSR Network Planning in China” approved by the China State Council, the mileage of HSR has increased rapidly. By the end of 2021, China’s commercial HSR lines had reached 38,200 km, connecting all provincial capitals and cities with a population of more than 5 million [20]. We selected the Yangtze River Delta urban agglomeration and Chuanyu urban agglomeration in China as the study areas for the following reasons: (1) Both of them have well-developed HSR, and the completion time of HSR is also near the same. (2) The two agglomerations are vastly different on the economic level. (3) The two agglomerations are located in one country, so minimizing the influence of other irrelevant factors in the comparison process. (4) Data are available for both of them. The research area is shown in Figure 1.
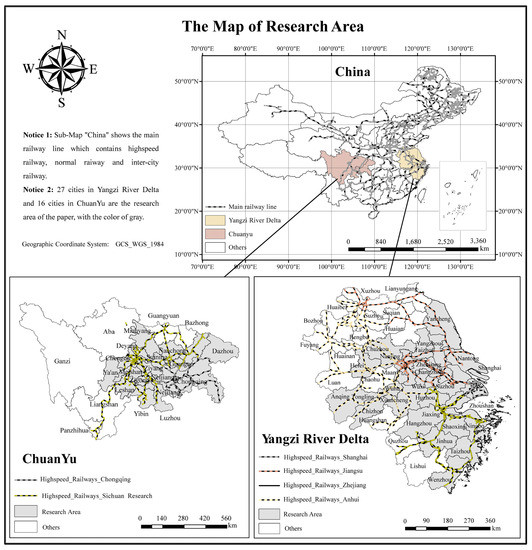
Figure 1.
The map of the research area.
(1) The Yangtze River Delta urban agglomeration is an important area of the “Belt and Road” and the Eastern Economic Belt. It covers 225,000 square kilometers with 27 central cities as its central area. The Yangtze River Delta urban agglomeration is the most economically developed region in China, creating a quarter of China’s GDP and more than a quarter of the industrial value, with only 2.1 percent of China’s geographical area. The region has achieved a well-developed HSR, with 6329 km of rail lines by the end of 2021, covering more than 90 percent of cities in the region.
(2) Chuanyu is an emerging urban agglomeration listed in China’s new development planning in recent years, with 16 central cities such as Chengdu and Chongqing [21]. It covers an area of 185,000 square kilometers, with 7.39 trillion Yuan GDP and 1008 km of rail lines by the end of 2021.
Referring to the relevant research and combining the regional characteristics of the Yangtze River Delta and Chuanyu urban agglomeration [22], this study selects the research area based on the following principles: (1) the geographical scale of the Yangtze River Delta and Chuanyu Mountains; (2) taking the city as the smallest space unit. In order to highlight the economic connection and comparison between cities based on administrative regions, if a city covers a sub-city or a district, we combine them into one city unit for statistics; (3) comprehensively considering the economic connections between cities, defining the boundaries and avoiding overlapping. Based on the above principles, this paper takes 27 central cities in the Yangtze River Delta urban agglomeration and 16 central cities in the Chuanyu urban agglomeration as the research objects. We investigate the impact of HSR construction on the economic spatial structure of urban agglomeration at different levels of development.
2.2. Data Source
Based on the HSR construction and economic development trend [23], this study selected the time period according to three criteria: (1) data availability; (2) the principle of timelines where we study the contemporary period of time to ensure the timeliness value of the research output; (3) the principle of continuity, which comprehensively considers the goal of data continuity and annual differences. As such, we set the time interval of 5 years to select data. Based on the above principles, we selected 2011, 2016, and 2021 as the period of study.
Data sources are as follows: (1) the panel data of the Yangtze River Delta and Chengyu urban agglomeration are obtained from the yearbooks of the statistical departments; (2) the rail station, location, and transportation information of HSR lines are obtained from China Railway Yearbook; (3) HSR timetable data are collected from the China Rail’s official website: https://www.12306.cn/index (26 May 2022), which displays the departure time, station and timetable information of all railways in China; (4) some HSR lines in the Chuanyu urban agglomeration are still under construction. For those areas, we use the road commuting time to replace the HSR time, with the optimal strategic route according to the destination and origin. Usually, the time a passenger will need to travel by road is much longer than that by HSR. The substitution can objectively reflect the reality of the weaker gravity of those cities.
2.3. Research Methodology
2.3.1. Index Construction of the Urban Comprehensive Economy
According to the principle of systematicness, comparability, representativeness, and availability, this study selects economic potential, population, and industrial structure to construct the target layer index, in order to reflect the urban comprehensive economy.
The specific criteria layer indexes are as follows:
(1) Economic potential. This refers to the capabilities, position, and influence in the economic structure, which is determined by the output and income of the regional economy. Referring to the previous research, considering the two elements of economic output value and government revenue, we selected two indicators: GDP and government public budget [24]. In addition to the development potential of the economic scale, the assessment of urban economic potential also takes the sustainable ability to stimulate the economy into account. From the perspective of investment and residents’ living standards, we selected fixed asset investment, sales of consumer goods, and per capita income of urban residents as additional indicators.
(2) Population. Most of the studies evaluate population from the perspective of population scale and employment, but in addition, the population is closely related to the output value of workers [25]. Based on it, this study focuses on three aspects: population scale, employment, and output value of workers. We selected four indicators: resident population, registered population, the number of employed persons, and per capita GDP.
(3) Industrial structure. It represents the constituents and connection of each industry type. We selected two indicators: the proportion of the value of the secondary industry and the proportion of the value of the tertiary industry.
The index system of the urban comprehensive economy is shown in Table 1.

Table 1.
Index system of the urban comprehensive economy.
The entropy method is used to standardize the original data and assign the weight of each index. The calculation steps are as follows:
Data standardization: refers to the value after standardization, refers to the minimum value, and is the maximum. Data standardization aims to find the gap of the value with minimum value if the indicator is positive, but the gap with maximum value if it is negative.
Calculate the proportion of the index of the evaluation object. refers to the proportion, refers to the sum of the sample value.
Calculate the entropy value of the indicator. is the entropy value, is the logarithmic function of the sample size.
Calculate the discrepancy coefficient of the indicator. refers to the discrepancy coefficient of the indicator.
Calculate the weight. refers to the weight of the indicator in the index system.
2.3.2. Urban Spatial Gravity Model
The economic gravity between cities reflects the scope and extent of the economic influence, and also reflects the capacity of the region to accept the influence [26]. There are two methods to measure economic gravity: absolute economic connection and relative economic connection. Compared with relative economic connection, the absolute economic connection has the characteristics of being objective and capable of evaluating multiple objects. Among the evaluation methods of the absolute economic relation, the gravity model is commonly used [27].
The traditional gravity model uses space linear distances to measure the distance between cities. This ignores the influencing factors of topography and the construction of transportation infrastructure. Referring to the existing research, this paper separates the influencing factors of HSR in the evaluation of the urban economic gravity, and uses the time distance to construct the time cost matrix of HSR [28]. The gravity is based on the time distance of the HSR. This paper analyzes the changing trend of the economic structure of urban agglomerations at different scales, with the influence of HSR construction. The gravity model is:
In the formulas, and refer to the comprehensive economy of the cities and , is the economic gravity between cities, refers to the contribution ratio of city to the gravity of , used to indicate the gravity direction of two cities; is the relationship quality of ; is the HSR time distance from . is the gravitational constant, and usually the value is 1; is the distance decay index, and usually the value is 2. refers to the total economic relationship value of , and is the proportion.
2.3.3. Social Network Analysis Method
The methods to investigate the economic spatial structure of urban agglomeration mainly include the spatial analysis method, comprehensive evaluation method, social network analysis method, etc. The social network analysis method has systematic evaluation indicators, it analyzes the connections among members more clearly [29]. Therefore, this study uses the social network analysis method to investigate the evolution trend of the economic spatial structure of urban agglomerations at different economic levels in the HSR era.
The social network analysis method results from the combination of sociology, mathematics, and statistics, which take structure and relationships as key features. It analyzes the connections between elements and the potential implications [30]. Specifically, it includes the following methods:
(1) Network density. This refers to the ratio of the actual connections to the possible connections in the network graph. We use Δ to represent the network density, and the formula is:
In the formula, L is the number of connection lines in the network, and g is the number of nodes. The network density ranges from 0 to 1. L = 0 when there is no connection in the network, and L = g(g − 1)/2 when the maximum number of possible connections is reached.
(2) Agglomeration group. This is a group in which members have stable, direct, and positive relationships with each other, and it is one of the main contents of the social network analysis method. Interaction-based agglomeration groups require members to be “selected”; accessibility-based agglomeration groups require members to be within reach, but adjacent is not necessary; agglomeration groups based on a large number of contacts require the contact frequency of cities; agglomeration groups based on relative density require members to be more cohesive.
Agglomeration group analysis is a typical method for analyzing the structure of social networks. The advantage is that it can simplify the complex structure, and find substructures as well as their relationships. In this study, UCINET 6.1 network analysis software is used for analyzing agglomeration groups. UCINET is a comprehensive analysis application with the ability to process matrix data of social networks, including a variety of data management and computing tools [31].
(3) Centrality, including degree centrality, intermediate centrality, and eigenvector centrality.
Degree centrality. This centrality focuses on the most influential members of the network, and the relationship or adjacency between the high-value members and other members is the channel to measure whether they are located in the center. It also represents how strongly the member influences the network. We define D as the index of degree centrality and set:
In the formula, is the degree centrality of city i, and is the economic connection value between the city i and city j. Degree centrality is more dependent on the size of the group, and the maximum value is g − 1.
Betweenness centrality. This refers to the mutual attraction relationship between non-adjacent cities, and represents the ability of cities to control the network. Assuming that in the gravity relationship between cities j and k, city i is located in the middle position, then i has a certain “responsibility” for j and k. By calculating all the paths through the intermediate city i, we obtain the “pressure” that city i gets in the network. The formula is as follows:
In the formula, represents the number of cities included on the shortest path connecting cities j and k. represents the probability that city participates in the connection between city j and city k. If is not located on any shortest path, the value is 0 as the minimum. The maximum value is (g − 1)(g − 2)/2, which is the number of all other urban agglomerations except .
Eigenvector centrality. This defines the importance of each connection according to the centrality of network nodes, and performs the iterative calculation. The formula is as follows:
In the formula, is the centrality contribution of the city n to I; is the rank of the city I in the urban agglomeration. Nodes that are directly connected to the central nodes also tend to be located in the center. Cities that are connected to the cities with higher eigenvector centrality are also connected to more cities.
3. Results and Discussion
3.1. Network Structure of Economic Connection
The results show that the average value of economic connections in the Yangtze River Delta urban agglomeration in 2011, 2016 and 2021 are 57.94, 122.18 and 158.37, respectively, while those in the Chuanyu urban agglomeration 28.89, 31.27 and 56.37, respectively. Referring to relevant literature and combining the economic development level of the two urban agglomerations, we divide the economic connections into five levels: weakest economic link (R < 50), weaker economic link (50 < R < 100), medium economic link (100 < R < 400), stronger economic link (400 < R < 1000), strongest economic link (R > 1000). ArcGIS 10.2 software was used for category identification and visualization. According to the economic connection between cities, the economic spatial pattern is drawn, as shown in Figure 2 and Figure 3. We found that there are differences in the variation trend of the two urban agglomerations. In 2011, there were 71 above-average links in the Yangtze River Delta urban agglomeration, including 8 stronger economic links and 2 strongest economic links. In 2016, the results were 116, 13, and 6. The values were 162, 26, and 17 in 2021, respectively. The changes are substantial. In 2011, there were 28 economic links above the average in the Chuanyu urban agglomeration, including 4 stronger economic links and 1 strongest economic link. In 2016, the results were 43, 6, and 4. The values were 82, 7, and 4 in 2021. Huge changes have taken place, but smaller than in the case of the Yangtze River Delta.
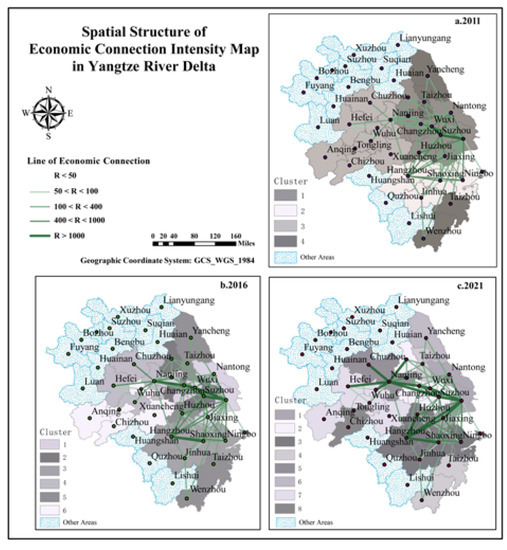
Figure 2.
Spatial structure of economic connection intensity map in Yangtze river delta.
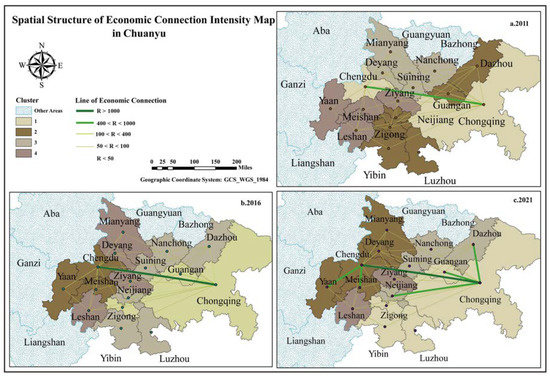
Figure 3.
Spatial structure of economic connection intensity map in Sichuan-Chongqing (Chuanyu).
The economic network density among the 27 central cities in the Yangtze River Delta urban agglomeration shows a gradually increasing trend. The overall density was 0.3149 in 2011, 0.4311 in 2016, and 0.5274 in 2021. The high value of density reflects the high frequency of production factors exchange and the close industrial connection [32]. In recent years, the economic network density of the Yangtze River Delta urban agglomeration has increased significantly, reflecting the increasing influence of the core cities on others. The regional networking process is also related to the improvement of the transportation network system. The density and traffic efficiency of the Yangtze River Delta urban agglomeration show a structure of high East and low West. The HSR has improved the accessibility of the urban agglomeration, and the average travel time between cities within 4 h. The developed transportation infrastructure has helped the Western cities to undertake the industry. The network structure of the Yangtze River Delta urban agglomeration shows a trend of transformation to more centers with more balanced space. The regional center has been upgraded from Shanghai, Suzhou and Hangzhou to eight cities including Shanghai, Suzhou, Wuxi, Hangzhou, Nanjing, Changzhou, Ningbo and Nantong. The evolution trend to multi-core structure is obvious. From the perspective of economic spatial structure, the “core-edge” structure features of the Yangtze River Delta urban agglomeration are remarkable. It has formed the core area with Shanghai, Suzhou, Wuxi, Hangzhou and Nanjing as the center, and the edge area dominated by the Western cities. There is a significant difference in the density between the core area and the edge areas. The diffusion effect of the core is obvious, and it has a strong driving ability to the economic development of the edge region. At the same time, Nanjing and Hangzhou, as the secondary centers, play the role of bridges in the new structure.
The economic network density of the 16 central cities in the Chuanyu urban agglomeration is also increasing year by year. The overall density was 0.1764 in 2011, 0.1828 in 2016 and 0.2196 in 2021. In the context of the HSR network covering almost all cities, the value of network density has increased. However, compared with the Yangtze River Delta urban agglomeration, the growth rate is lower. The single central structure of Chuanyu has hardly changed in recent years; Chengdu and Chongqing are the regional centers of Chuanyu in the three time periods. Several sub-centers emerged later, but none of them reached the scale of Chengdu and Chongqing.
3.2. Agglomeration Group of Economic Relation Network
The UNICET 6.1 software was used for agglomerative group analysis. The changes of the agglomeration group members are shown in Figure 2 and Figure 3, and the member list and influence matrix are shown in Table 2 and Table 3. Under the situation when the connections between cities are constantly changing, the connection values between the members of the group are also changed, for different groups. The density of groups in the two urban agglomerations has shown an increasing trend, which reflects the increasing connection between cities.
Table 2.
Agglomeration groups of the economic relations network of Yangtze River Delta city group.
Table 3.
Agglomeration groups of the economic relations network of Chuanyu city group.
The agglomeration groups of the Yangtze River Delta urban agglomeration have shown a changing trend from less to more, from 4 in 2011 to 8 in 2021. One of the most obvious results is that Suzhou separated from the Shanghai group, and gradually formed an economic spatial structure dominated by Shanghai, Suzhou, Hangzhou, and Nanjing. In this process, the memberships in the Shanghai group have been decreasing, but the influence of this group has not decreased. This is reflected in the value in the density matrix, that is, the influence value of this group on other groups. Some marginal cities have formed their own groups in the 2021 period. Although their influence in the matrix is not high, their existence shows that the rapid flow caused by the construction of HSR has created the possibility of industrial independence for the marginal cities [33]. The economic spatial structure of the Yangtze River Delta tends to be more balanced.
The number of agglomerative groups in Chuanyu has not changed in recent years. Chongqing and Chengdu were in the same group in 2011 but separated into two groups later, which were also the most influential groups. In the influence matrix, the value range of the influence in the matrix is from single to thousands. There are huge differences, reflecting the imbalance of economic development. The influence coefficient of marginal groups shows a downward trend, which verifies the existence of a siphon phenomenon in this region [34]. In other words, the influential groups will attract human resources, materials and capital from other cities and as such, take away the advantageous resources.
3.3. Centrality of Economic Networks
3.3.1. Point-Out and Point-In Centrality
The point-out centrality indicates the “spillover” strength of the influence, that is, the strength that dominates adjacent cities. The point-out centrality indicates the “entry” strength of the influence, that is, the degree of intervention by external factors. The centralities of the Yangtze River Delta and Chuanyu urban agglomeration are shown in Table 4 and Table 5. We focused on the changing trend of the centrality of cities in the two urban agglomerations. It should be noted that it does not make sense to compare data across tables since the result was normalized.
Table 4.
Centrality of economic networks in Yangtze river delta.
Table 5.
Centrality of economic networks in Chuanyu.
Among the 27 central cities in the Yangtze River Delta urban agglomeration, the point-out centralities of Shanghai are 14.353, 16.708, and 19.039 in recent years, which are the highest, reflecting the core position of Shanghai. In recent years, Shanghai has gradually transferred high-tech industries to the neighboring cities, which has also created huge market demand [35]. As regards Suzhou, Wuxi, Hangzhou, and Nanjing, which have lower point-out centrality than Shanghai, their centralities have increased by 112.8%, 117.9%, 119.6 %, and 129.5%, respectively, in the past 10 years. They are the cities that have benefited most from the construction process of HSR. They are located between the center and the new sub-centers, as the new centers with economic “spillover” capacity. Suzhou and Wuxi play a pivotal role by relying on the investment and commodity exchange relationship with Shanghai. Hangzhou connects Jiaxing, Huzhou, Shaoxing, Quzhou, and Huangshan, forming the Southern city group. Nanjing affects Jiangsu and Anhui provinces, and it is the city that drives the development of the Central and Western parts of the Yangtze River Delta [36]. The changes in point-in centrality show that Suzhou, Hangzhou, Wuxi, Nanjing, Jiaxing, Ningbo, and Nantong gain the largest increases, which are 142.4%, 130.6%, 267.2%, 175%, 81.8%, 652.1%, and 556.7%, respectively. It is confirmed that these cities have effectively integrated and utilized the resources in the urban agglomeration after the construction of HSR, and built close connections with other cities in the region. After the construction of HSR, the point-in centrality of Wuxi, Changzhou, and Jiaxing is significantly higher than the point-out centrality, which indicates that they are affected by the other cities in recent years.
Among the 16 central cities in the Chuanyu urban agglomeration, Chongqing and Chengdu have the highest point-out centrality, and they are in the core position. The overall level of the two cities is consistent, but the trend in Chongqing is upward [37]. Topographically, Chengdu is dominated by plains, while Chongqing is dominated by mountains. The difference in commuting time between HSR and normal roads in mountains is more than that in plain areas. It is foreseeable that the construction of HSR provides more opportunities for Chongqing, which is surrounded by mountains. Mianyang, Deyang, and Leshan are the second-tier cities in the Chuanyu urban agglomeration. However, a significant difference has been observed: their point-out centralities are much smaller than those of Chengdu and Chongqing. More importantly, their growth efficiencies are not as high as those of Chengdu and Chongqing, which is different from the situation in the Yangtze River Delta. Most other cities show a downward trend in point-in centrality. The reason might be that the construction of HSR makes the production factors too concentrated to share in the central area, and the development of the surrounding areas is restricted by the lack of resources, so the siphoning phenomenon exists. Moreover, there is a phenomenon that needs to be noticed: while most cities in the non-central area have seen declines in point-out centrality and point-in centrality, in almost all of them, the point-in centrality is higher than point-out centrality, that is, the impact a city receives is stronger than the one it generates.
3.3.2. Betweenness Centrality
A high betweenness centrality means that a city can play an intermediary role in the connection of other cities and a higher degree of activity. The results of the betweenness centrality of the Yangtze River Delta urban agglomeration show that Shanghai was the highest at the beginning, but then showed a downward trend, while other central cities such as Nanjing, Suzhou, Hangzhou, Changzhou, Wuxi, and Hefei gradually increased, and finally reached a level equal to Shanghai or slightly exceeding it [38]. Thus, the new metropolitans gradually replace Shanghai and establish connections with more cities. Their position in the economic spatial structure transfers to the center. The betweenness centrality in the region shows an increasing trend generally.
On the results of the betweenness centrality of Chuanyu urban agglomeration, Chongqing and Chengdu show results far above the average again. The growth rates of betweenness centrality for the second-tier cities are quite high, but eventually stopped at a level much lower than that of Chongqing and Chengdu. The betweenness centrality of other cities in the region also shows an increasing trend, which may be caused by the low traffic accessibility before the construction of HSR.
3.3.3. Eigenvector Centrality
The eigenvector centrality means its location in the economic structure, and cities connected with high-centrality cities are able to connect with more cities. The results of the eigenvector centrality of the Yangtze River Delta urban agglomeration show that Shanghai had the highest eigenvector centrality at the beginning, and its value has hardly changed in the past ten years. The eigenvector centrality of Suzhou, Hangzhou, Wuxi, and Nanjing gradually increased and finally reached a level close to that of Shanghai. This means that the new metropolitans are gradually approaching the center of the economic spatial structure, and the Yangtze River Delta urban agglomeration has changed from a single core to a multi-core structure.
The results of Chuanyu urban agglomeration show that the eigenvector centralities of Chongqing and Chengdu are the highest; ther are growing in Chongqing and slightly declining in Chengdu. The eigenvector centrality of the second-tier cities has hardly changed, which means that they are still far away from the center of the economic spatial structure. It is certain that the two-core structure of Chuanyu has not evolved any other cores in the past ten years.
3.4. Economic Network Visualization
According to the economic connection strength of the cities of the two urban agglomerations, the adjacency matrix is constructed, and the visualization diagram of the economic network structure is obtained by using Netdraw software, as shown in Figure 4.
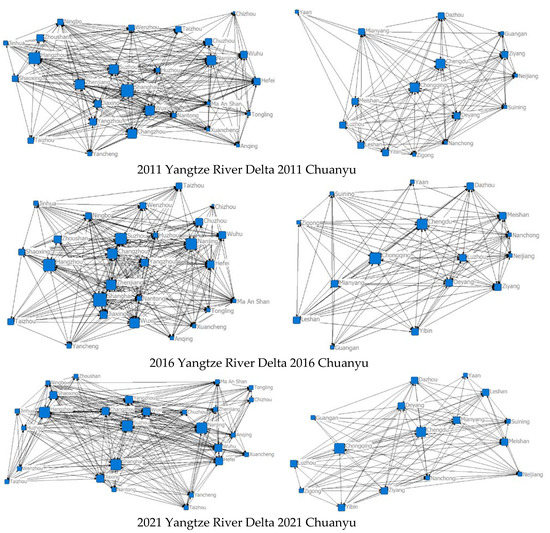
Figure 4.
Visualization diagram of economic network structure.
The network density of the Yangtze River Delta urban agglomeration has always been at a high level. In recent years, the structure of economic networks has gradually presented the characteristics of multiply-core and complexity; especially, the network in the core area has become more complex [39]. The economic network structure of the Yangtze River Delta urban agglomeration has gradually evolved closer to the center, and the economic connection has changed to diversification. The structure has evolved from a single center to a multiply-core network structure centered in Shanghai, Suzhou, Hangzhou and Nanjing. The network structure tends to be more balanced in the spatial distribution and the number of the main agglomeration group members.
In the network structure of Chuanyu urban agglomeration, Chengdu and Chongqing, as the central cities, are more closely connected with other cities, but the overall network density has not changed. It has evolved from one center composed of Chengdu and Chongqing at the earliest into two centers, but the central cities have not changed. The edge cities are getting farther from the center, but the semi-edge cities are getting closer to the center [40].
4. Conclusions
Based on the modified gravity model, this paper explores the social network analysis method to analyze the economic spatial structure changes of urban agglomerations in different development levels under the influence of HSR construction. We found that with the construction of HSR in the past 10 years: (1) The network density and the average economic connection of the two types of urban agglomerations have shown a trend of gradual increase. Numerically, the value of developed regions is much higher than that of developing regions, and the growth rate of developed regions is also faster. (2) The number of agglomerated groups in developed regions shows a change from less to more. The members from the second-tier centers have gradually increased, forming a multi-core and more balanced economic network structure. There was no change in the number of agglomerated groups in the developing regions. The members of the central agglomerated group are increasing, and the influence of the marginal regions is decreasing, which verifies the economic siphon phenomenon and the imbalance of regional structure. (3) The influence of metropolitan areas in developed regions has not been weakened. The new metropolitans, which are located between the metropolis and the new second-tier centers, are the cities that have benefited the most from the HSR construction. The gap between the center and the edge of the developing regions still exists, and even tends to widen. In the process, the central city with difficult topography benefits the most. (4) The network structure of developed regions shows the characteristics of multiple-core and complexity. The cities gradually move closer to the center, and the network structure tends to be more balanced in the spatial distribution and the number of the main agglomeration group members. The center cities of the developing regions have become more connected with other cities, but the edge cities are getting farther from the center.
Based on the conclusions above, the policy suggestions are proposed as follows: (1) HSR can significantly improve connectivity between cities in both developed and developing regions, and the concerned government departments should encourage HSR construction if the financial situation permits. (2) Developed regions should hold the opportunity to build new hub cities, and balance the urban agglomeration economic spatial structure; the peripheral cities in developed regions should also be encouraged to be connected by HSR to avoid further marginalization so that the cities in the edge regions also obtain the chance of resource increases. (3) In developing regions, the central cities should strengthen urban construction and connect the nearby cities by HSR, to maximize economic efficiency; HSR construction can be suspended in peripheral cities if the economic conditions do not permit it, especially in mountainous areas with higher construction costs.
The study offers a platform for further assessments of HSR’s impacts on the economic spatial structure evolution of urban agglomeration for monitoring the long-term progress of HSR development. It still has limitations, however, since it cannot reflect the different types of geographic location that affect the city network. Moreover, future research should examine the similarity and differences of the characteristics of the economic spatial structure under the impact of different transport modes.
Author Contributions
Formal analysis, Y.H.; Funding acquisition, G.S.; Investigation, Y.H.; Methodology, Y.H.; Resources, G.S.; Software, A.d.S. and H.X.; Supervision, Y.H. and A.d.S.; Writing—review and editing, Y.H. All authors have read and agreed to the published version of the manuscript.
Funding
This research was funded by the Natural Science Foundation of Shanghai (No. 518 19ZR1415200), Spatial and Temporal Projection of Population Migration and Agglomeration in China under SSPs/RCPs Pathways and its implications.
Data Availability Statement
(1) The panel data of the Yangtze River Delta and Chengyu urban agglomeration are obtained from the yearbooks of the statistical departments. (2) The rail station, location, and transportation information for HSR lines are obtained from China Railway Yearbook. (3) HSR timetable data are collected from the China Rail’s official website: https://www.12306.cn/index (26 May 2022) which displays the departure time, station and timetable information of all railways in China.
Conflicts of Interest
The authors declare no conflict of interest.
References
- Sun, B.W.; Yu, H.T.; Peng, Z.R.; Gao, Y. High-Speed Rail and Manufacturing Agglomeration Evidence from Beijing-Guangzhou High-Speed Rail in China. Transp. Res. Rec. 2017, 2606, 86–95. [Google Scholar] [CrossRef]
- Garmendia, M.; Ribalaygua, C.; Urena, J.M. High speed rail: Implication for cities. Cities 2012, 29, S26–S31. [Google Scholar] [CrossRef]
- Jiao, J.J.; Wang, J.O.; Jin, F.J. Impacts of high-speed rail lines on the city network in China. J. Transp. Geogr. 2017, 60, 257–266. [Google Scholar] [CrossRef]
- Wheeler, C.H. Search, sorting, and urban agglomeration. J. Labor Econ. 2001, 19, 879–899. [Google Scholar] [CrossRef]
- Shao, S.; Tian, Z.H.; Yang, L.L. High speed rail and urban service industry agglomeration: Evidence from China’s Yangtze River Delta region. J. Transp. Geogr. 2017, 64, 174–183. [Google Scholar] [CrossRef]
- Wang, F.; Wei, X.J.; Liu, J.; He, L.Y.; Gao, M.N. Impact of high-speed rail on population mobility and urbanisation: A case study on Yangtze River Delta urban agglomeration, China. Transp. Res. Part A-Policy Pract. 2019, 127, 99–114. [Google Scholar] [CrossRef]
- Li, M.W.; Chen, J. The spatial effect of high-speed rail on regional tourism economy in a Chinese urban agglomeration. Int. J. Transp. Econ. 2020, 47, 419–438. [Google Scholar]
- Li, L.S.Z.; Yang, F.X.; Cui, C.T. High-speed rail and tourism in China: An urban agglomeration perspective. Int. J. Tour. Res. 2019, 21, 45–60. [Google Scholar] [CrossRef]
- Yao, S.J.; Fang, J.; He, H.B. Can Time-Space Compression Promote Urban Economic Growth? Evidence from China’s High-speed Rail Projects. China World Econ. 2020, 28, 90–117. [Google Scholar] [CrossRef]
- Yang, H.R.; Wang, C.; You, Y.Y. The Spatial Structure Evolution of China’s High-Speed Rail Network and Its Impacts on Real Estate Investment. Appl. Spat. Anal. Policy 2022, 15, 49–69. [Google Scholar]
- Lee, C.; Ma, J.Q.; Oh, K.K. Economic Impact Analysis on Regional Industries by High-Speed Rail Investments: Application of an Input-Output Model. Transp. Res. Rec. 2018, 2672, 247–259. [Google Scholar] [CrossRef]
- Kaewunruen, S.; Rungskunroch, P.; Yang, Y.W. Urbanisation Through the Benefits of High-Speed Rail System. In Proceedings of the 3rd World Multidisciplinary Civil Engineering, Architecture, Urban Planning Symposium (WMCAUS), Prague, Czech Republic, 18–22 June 2018. [Google Scholar]
- Jin, H.B.; Feng, H.; Cui, F.G. Synthetical Benefit Evaluation of High-Speed Rail, Take Beijing-Shanghai High-Speed Rail for Example. In Proceedings of the International Conference on Low-Carbon Transportation and Logistics, and Green Buildings (LTLGB), Beijing Jiaotong Univ, Beijing, China, 12–13 October 2012; pp. 395–402. [Google Scholar]
- Guo, Y.; Li, B.; Han, Y.L. Dynamic network coupling between high-speed rail development and urban growth in emerging economies: Evidence from China. Cities 2020, 105, 102845. [Google Scholar] [CrossRef]
- Banko, F.P.; Xue, J.H. Emerging Challenges and Opportunities for US High-Speed Rail Development. Intell. Transp. Plan. Breakthr. Res. Pract. 2018, 996–1030. [Google Scholar] [CrossRef]
- Cao, J.; Liu, X.C.; Wang, Y.H.; Li, Q.Q. Accessibility impacts of China’s high-speed rail network. J. Transp. Geogr. 2013, 28, 12–21. [Google Scholar] [CrossRef]
- Chen, Y.Z.; Lu, H.W.; Yan, P.D.; Qiao, Y.F.; Xia, J. Spatial-temporal collaborative relation among ecological footprint depth/size and economic development in Chengyu urban agglomeration. Sci. Total Environ. 2022, 812, 151510. [Google Scholar] [CrossRef]
- Chen, W.; Yenneti, K.; Wei, Y.D.; Yuan, F.; Wu, J.W.; Gao, J.L. Polycentricity in the Yangtze River Delta Urban Agglomeration (YRDUA): More Cohesion or More Disparities? Sustainability 2019, 11, 3106. [Google Scholar] [CrossRef]
- Zhou, L.; Shi, C.D.; Luo, L.M. Application of AHP Method and TOPSIS Method in Comprehensive Economic Strength Evaluation of Major Cities in Guizhou Province. In Proceedings of the International Conference on Computer Science and Application Engineering (Csae), Shanghai, China, 21–23 October 2017; pp. 687–694. [Google Scholar]
- Wu, Y.Z.; Lee, C.C.; Lee, C.C.; Peng, D.Y. Geographic proximity and corporate investment efficiency: Evidence from high-speed rail construction in China. J. Bank. Financ. 2022, 140, 106510. [Google Scholar] [CrossRef]
- Wan, J.J.; Li, Y.X.; Ma, C.C.; Jiang, T.; Su, Y.; Zhang, L.Q.; Song, X.Q.; Sun, H.Y.; Wang, Z.M.; Zhao, Y.T.; et al. Measurement of Coupling Coordination Degree and Spatio-Temporal Characteristics of the Social Economy and Ecological Environment in the Chengdu-Chongqing Urban Agglomeration under High-Quality Development. Int. J. Environ. Res. Public Health 2021, 18, 11629. [Google Scholar] [CrossRef]
- Xu, D.; Yu, B.; Liang, L.N. High-Tech Industrial Agglomeration and Urban Innovation in China’s Yangtze River Delta Urban Agglomeration: From the Perspective of Industrial Structure Optimization and Industrial Attributes. Complexity 2022, 2022, 2555182. [Google Scholar] [CrossRef]
- Yao, Z.F.; Ye, K.H.; Xiao, L.; Wang, X.W. Radiation Effect of Urban Agglomeration’s Transportation Network: Evidence from Chengdu-Chongqing Urban Agglomeration, China. Land 2021, 10, 520. [Google Scholar] [CrossRef]
- Mensah, I.A.; Sun, M.; Omari-Sasu, A.Y.; Gao, C.X.; Obobisa, E.S.; Osinubi, T.T. Potential economic indicators and environmental quality in African economies: New insight from cross-sectional autoregressive distributed lag approach. Environ. Sci. Pollut. Res. 2021, 28, 56865–56891. [Google Scholar] [CrossRef] [PubMed]
- Sanchez-Gonzalez, C.; Garcia-Fernandez, R.M. A Multivariate Indicator to Compute Middle Class Population. Soc. Indic. Res. 2020, 147, 1–14. [Google Scholar] [CrossRef]
- Qin, X.Y.; Qian, Y.S.; Zeng, J.W.; Wei, X.T. Accessibility and Economic Connections between Cities of the New Western Land-Sea Corridor in China-Enlightenments to the Passageway Strategy of Gansu Province. Sustainability 2022, 14, 4445. [Google Scholar] [CrossRef]
- Shahriar, S.; Kea, S.; Qian, L. Determinants of China’s outward foreign direct investment in the Belt & Road economies A gravity model approach. Int. J. Emerg. Mark. 2020, 15, 427–445. [Google Scholar]
- Zhang, P.F.; Zhao, Y.Y.; Zhu, X.H.; Cai, Z.W.; Xu, J.X.; Shi, S. Spatial structure of urban agglomeration under the impact of high-speed railway construction: Based on the social network analysis. Sustain. Cities Soc. 2020, 62, 102404. [Google Scholar] [CrossRef]
- Chai, D.; Zhang, D.; Sun, Y.H.; Yang, S. Research on the City Network Structure in the Yellow River Basin in China Based on Two-Way Time Distance Gravity Model and Social Network Analysis Method. Complexity 2020, 2020, 6680954. [Google Scholar] [CrossRef]
- Gan, C.; Voda, M.; Wang, K.; Chen, L.J.; Ye, J. Spatial network structure of the tourism economy in urban agglomeration: A social network analysis. J. Hosp. Tour. Manag. 2021, 47, 124–133. [Google Scholar] [CrossRef]
- Trujillo, H.M.; Manas, F.M.; Gonzalez-Cabrera, J. Assessment the explanatory power of clandestine social networks graphs with UciNet and NetDraw. Univ. Psychol. 2010, 9, 67–78. [Google Scholar] [CrossRef]
- Lin, Q.W.; Xiang, M.Y.; Zhang, L.; Yao, J.J.; Wei, C.; Ye, S.; Shao, H.M. Research on Urban Spatial Connection and Network Structure of Urban Agglomeration in Yangtze River Delta-Based on the Perspective of Information Flow. Int. J. Environ. Res. Public Health 2021, 18, 10288. [Google Scholar] [CrossRef]
- Zhu, S.J.; Wang, C.; He, C.F. High-speed Rail Network and Changing Industrial Dynamics in Chinese Regions. Int. Reg. Sci. Rev. 2019, 42, 495–518. [Google Scholar] [CrossRef]
- Xu, Z.C.; Sun, T.S. The Siphon effects of transportation infrastructure on internal migration: Evidence from China’s HSR network. Appl. Econ. Letters 2021, 28, 1066–1070. [Google Scholar] [CrossRef]
- Li, W.M.; Wang, X.Y. Towards a mega-regional economy: A financial geography perspective to understanding Shanghai’s role in the Yangtze River Delta integration. Geoforum 2019, 101, 1–9. [Google Scholar] [CrossRef]
- Zhou, L.J. Research on Coordinated Development of Nanjing Port Logistics and Hinterland Economy Based on Gray Correlation Analysis. J. Coast. Res. 2020, 105, 215–218. [Google Scholar] [CrossRef]
- Wang, W.; Wang, S.Q.; Li, Y.S.; Feng, C. Assessing the sustainability and competitiveness of tourism economies in China’s Chengdu-Chongqing metropolitan area. Environ. Sci. Pollut. Res. 2022, 1–19. [Google Scholar] [CrossRef]
- Wang, S.J.; Wang, J.Y.; Liu, X.P. How do urban spatial structures evolution in the high-speed rail era? Case study of Yangtze River Delta, China. Habitat Int. 2019, 93, 102051. [Google Scholar] [CrossRef]
- Xu, H.Z.; Jiao, M. City size, industrial structure and urbanization quality-A case study of the Yangtze River Delta urban agglomeration in China. Land Use Pol. 2021, 111, 105735. [Google Scholar] [CrossRef]
- Li, J.; Qian, Y.S.; Zeng, J.W.; Yin, F.; Zhu, L.P.; Guang, X.P. Research on the Influence of a High-Speed Railway on the Spatial Structure of the Western Urban Agglomeration Based on Fractal Theory-Taking the Chengdu-Chongqing Urban Agglomeration as an Example. Sustainability 2020, 12, 7550. [Google Scholar] [CrossRef]
Publisher’s Note: MDPI stays neutral with regard to jurisdictional claims in published maps and institutional affiliations. |
© 2022 by the authors. Licensee MDPI, Basel, Switzerland. This article is an open access article distributed under the terms and conditions of the Creative Commons Attribution (CC BY) license (https://creativecommons.org/licenses/by/4.0/).