Article

Measuring the Spatial Conflict of Resource-Based Cities and Its Coupling Coordination Relationship with Land Use

School of Geoscience and Surveying Engineering, China University of Mining and Technology (Beijing), Beijing 100083, China
*
Author to whom correspondence should be addressed.
Land 2022, 11(9), 1460; https://doi.org/10.3390/land11091460
Submission received: 10 August 2022 / Revised: 26 August 2022 / Accepted: 30 August 2022 / Published: 2 September 2022

Abstract

:
Scientifically diagnosing the spatial conflict of resource-based cities and clarifying the coupling coordination relationship between the intensity of spatial conflict and the dynamic degree of land use is of great significance for the transformation of urban areas and the rational use of regional resources. Based on the characteristics of a resource-based city in Xintai, the study constructed a spatial conflict measurement model from the dimensions of spatial pressure, spatial exposure, and spatial risk from the perspective of ecosystem service value. We then used the coupling coordination model to explore the relationship between change in the spatial conflict level and the dynamic degree of land use. The results showed that from 2009 to 2020, the spatial conflict index in Xintai remained stable, with a change of only 0.0018, and the changing trend of different conflict levels was different; the spatial pattern of conflicts was distributed in circles, and the conflict levels gradually weakened from the center to the surrounding areas. From 2009 to 2020, the average dynamic degree of land use in Xintai was 23.14%, with significant differences in spatial layout. The land use characteristics were mainly arable land to woodland, land reclamation, land restoration, expansion of construction land, and afforestation. According to the analysis of the degree of coupling coordination, the coupling coordination relationships between different spatial conflict changes and the dynamic degree of land use are significantly different. The weakened area is dominated by coordination relationships, with 774 units, accounting for 43.75%. According to the analysis of land use type changes and behavior-dominant factors, land use adjustment in Xintai mostly served the goals of ecological protection and economic development, and had a positive impact on the governance of spatial conflicts, but land use patterns in some areas still need to be optimally adjusted. The research is expected to provide a scientific basis for the rational use of regional land, the governance of spatial conflicts, and optimization of the spatial structure.

1. Introduction

Resource-based cities are cities whose main function is to produce and export resource products and have made great contributions to China’s development process [1,2]. However, human activities such as mining have seriously interfered with the structure and function of the regional ecological environment, leading to outstanding conflicts between the economic and ecological benefits of spatial utilization [3]. Spatial conflict is an objective geographic phenomenon of opposition in the process of interactions between humans and the land. It is a process of competition and a game of spatial resources based on the scarcity of spatial resources and the spillover of functions. In essence, it is the evolution of various contradictory interests and overlapping goals, mainly regarding land use [4,5,6]. The change in spatial conflict is inevitably related to the change in land use. On the one hand, spatial conflicts can be effectively solved by adjusting the structure of land use and optimizing the spatial layout. On the other hand, managing spatial conflicts is one of the main goals of land use transformation. In the face of the needs of resource-based cities such as ecological environmental protection and industrial development and transformation, the scramble for space resources by different stakeholders is more intense, space conflicts are prominent, and the stability of land use is also poor. Therefore, exploring the spatial conflict pattern and evolution characteristics of resource-based cities and their coupling coordination relationships with land use changes is the basis for supporting urban transformation and development, and rational utilization of spatial resources.
In recent years, most scholars have explored the spatial conflict spillover effects and the social, economic, and ecological conflicts caused by different elements from a multi-factor perspective [7,8,9,10,11]. In China, some scholars have revealed the meaning, causes, characteristics, and impact mechanisms of spatial conflicts based on geography [12]. Other scholars have discussed the level of spatial conflict, the relationship between spatial development and utilization, and regional ecological protection from the perspective of ecology, using the theory of landscape ecology and ecosystem service value [13,14,15,16,17]. Most of the research has focused on macroscopic scales such as urban clusters [18,19,20]. There are relatively few studies on the small and medium scales. In the process of industrialization and urbanization, production and living space are expanding, squeezing the ecological space, and the production–living–ecology spatial conflict is increasing, which has attracted the attention of many scholars [6,21]. The results of existing studies show that spatial conflict has an important impact on regional development and spatial resource utilization. However, most existing studies have used landscape pattern indices to construct spatial conflict models, taking less account of the impact of external environmental factors on spatial development and use, as manifested in the competition among production space, living space, and ecological space, and changes in the degree of concentration of various spatial resources.
Driven by economic interests, land use patterns, such as the expansion of construction land, have led to increased spatial pressure on spatial use and weakened ecosystem service value, resulting in spatial utilization conflicts [22]. Previous studies have considered land use as an important manifestation of spatial conflicts, and scholars have actively explored spatial conflicts from the perspective of land use [8,23,24,25]. However, spatial conflict and land have a two-way interaction, and they affect each other. In general, spatial conflicts can be managed by changing the land use and changing the land use mode [26,27,28,29]. However, in actual situations, the change in spatial conflict and change in the land use activity are not simple linear relations. Whether the regional spatial conflict and the activity of land use change are coordinated is the key to determining whether the intensity of spatial conflict can decrease. Clarifying the complex relationship between regional land use change and spatial conflict, and scientifically identifying the level of coordination between the land use mode and spatial conflict are the basis for effectively managing spatial conflicts and optimizing land resource allocations.
Xintai is a typical resource-based city, and mineral resource exploitation has been its economic pillar since the 1980s. Long-term resource exploitation has led to a series of land waste and ecological problems such as surface collapse and vegetation destruction in Xintai, and spatial conflicts have become prominent. In the face of demand of urban transformation and development, scientific identification of the spatial conflict patterns is of great significance for the rational use of spatial resources and optimization of the spatial structure.
Given these considerations, this study took Xintai as an example. It was based on population, land use, and socio-economic data; references the ecological risk evaluation model of “risk source–risk receptor–risk benefit”; and selected indicators from the dimensions of spatial external pressure, spatial exposure, and spatial risk response to construct a spatial conflict measurement model. We then used the coupling coordination model to explore the coupling coordination relationship between land use and spatial conflicts.
Our research objectives were as follows. First, the intensity level of spatial conflict and the characteristics of spatial differentiation needed to be identified, and the temporal and spatial evolution trends were clarified. Secondly, the scale and spatial pattern of regional overall land use change and the mutual conversion between different land use types were explored. Finally, the complex relationship between land use change and spatial conflict was analyzed, and the influence of the coupling coordination relationship between land use and spatial conflict on the mitigation of spatial conflict was clarified. The research provides a scientific basis for regional land resource allocation, spatial structure optimization, and land remediation and restoration in mining areas.

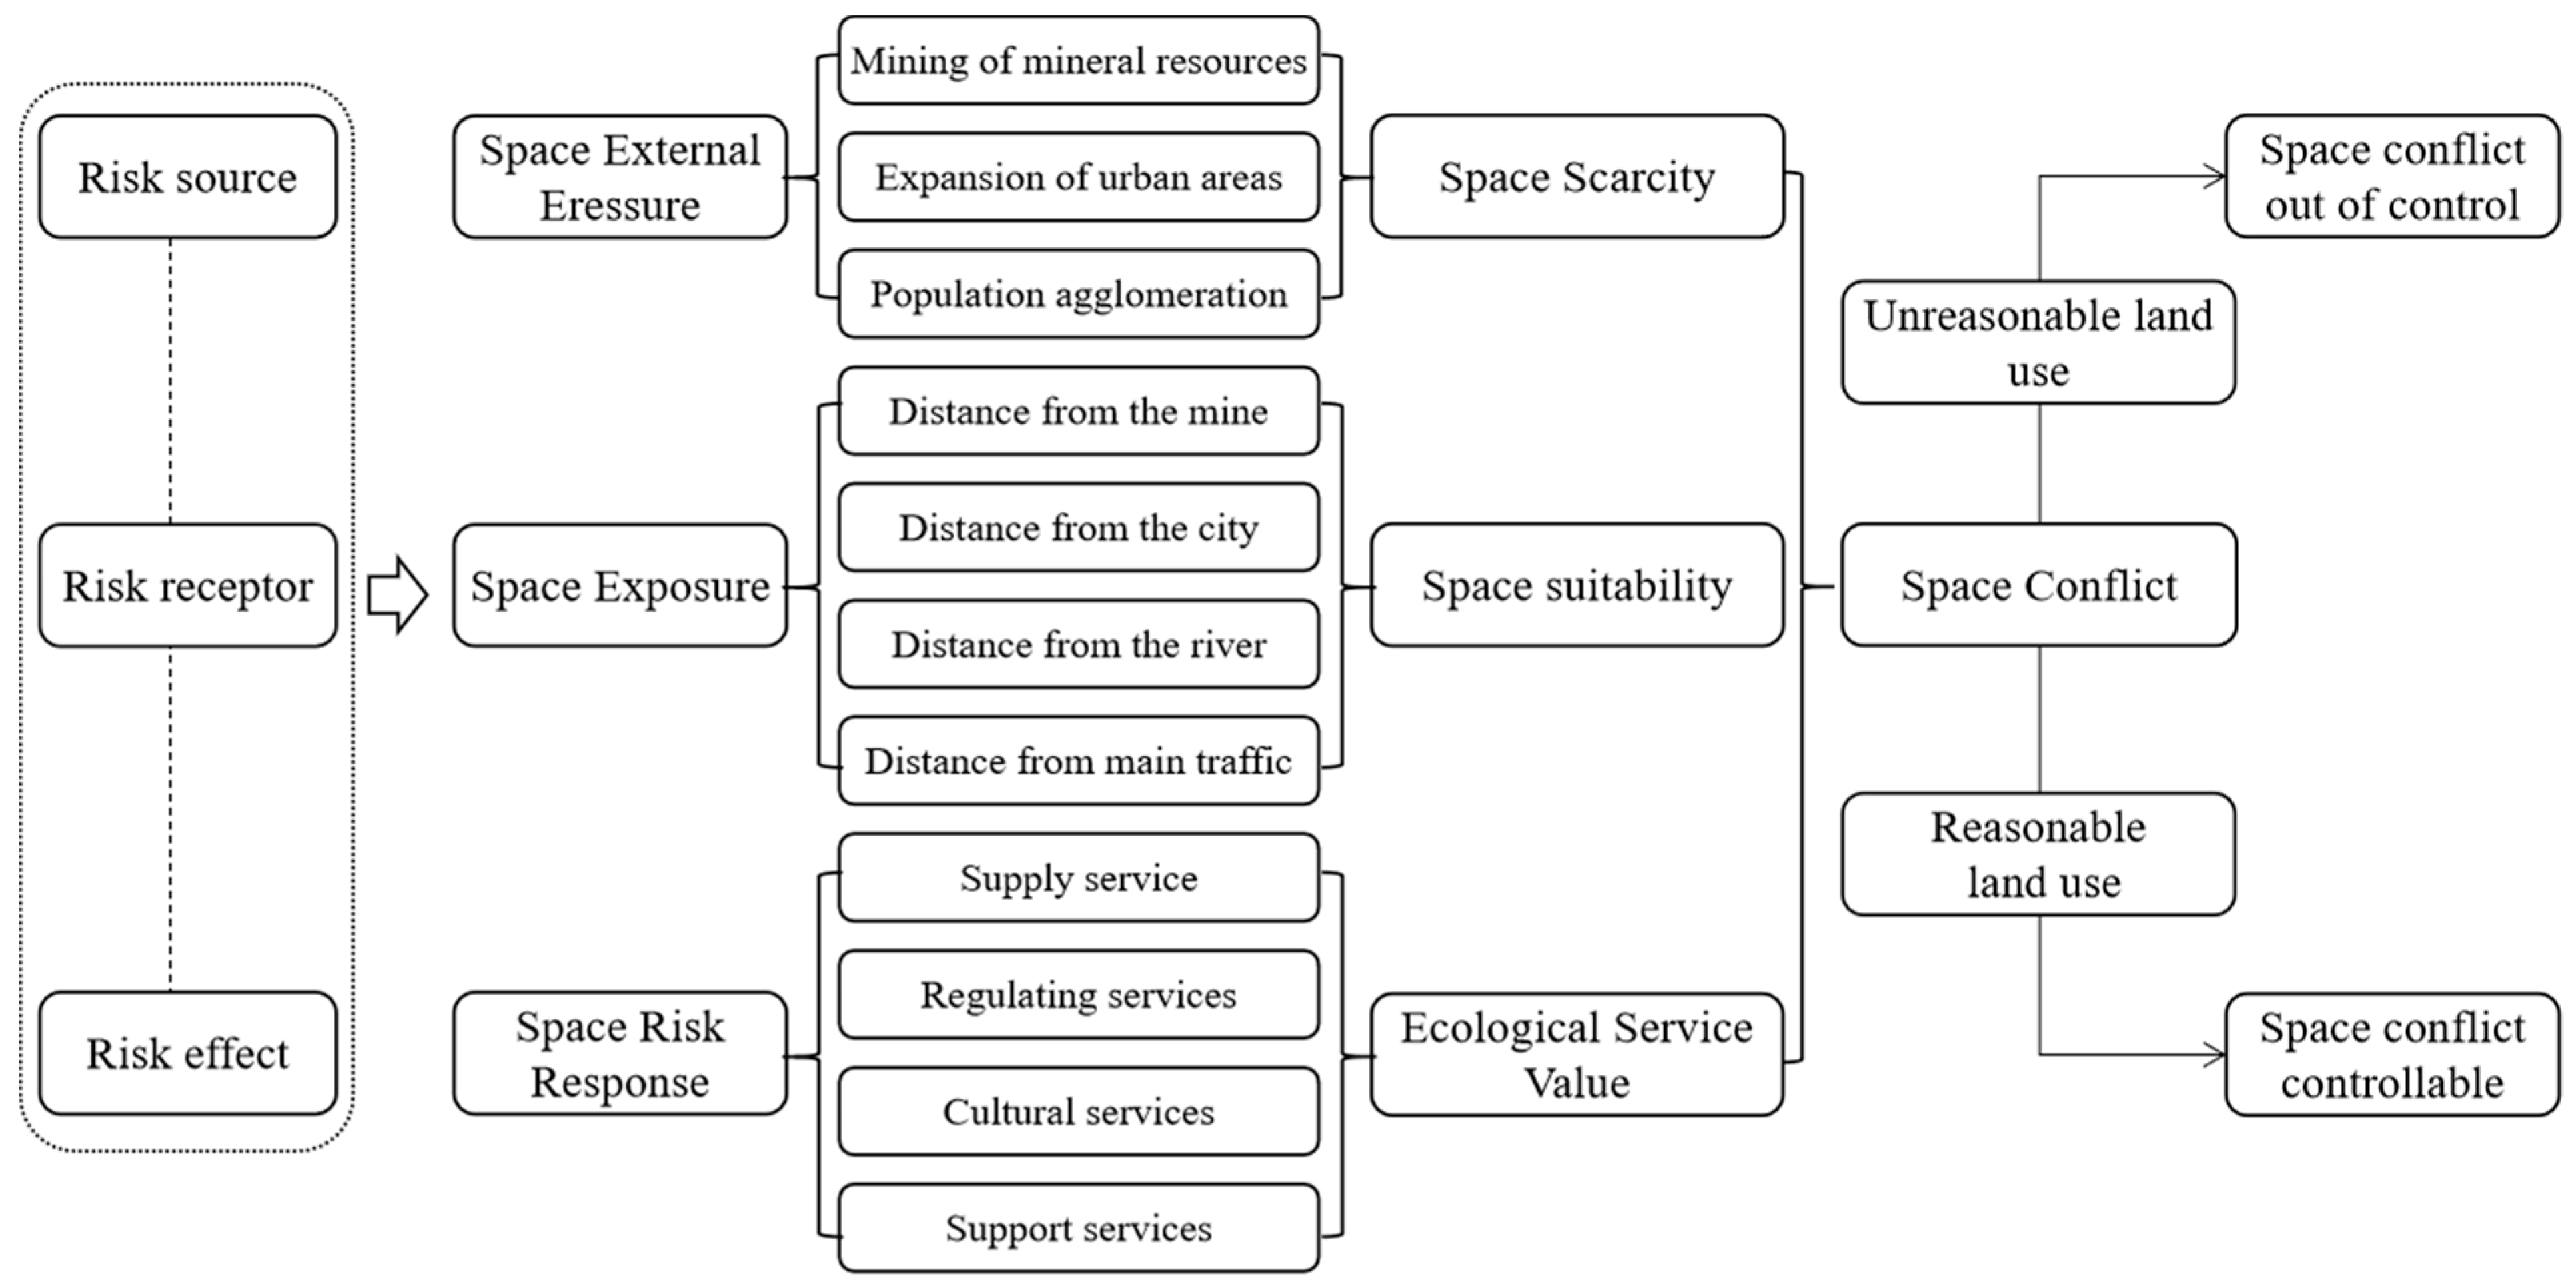
2. Construction of the Spatial Conflict Measurement Model

The development of resource-based cities depends on the production of mineral resources, but the scarcity of spatial resources and competition regarding spatial utilization have led to increasingly fierce competition between production and ecological space, and the contradictions of spatial utilization have become prominent. Under the development mode of pursuing economic benefits, resource-based cities focus too much on the development and utilization of mineral resources and underestimate the importance of the urban ecological service value, which makes the urban ecological environment suffer serious damage. For this reason, it was necessary to analyze the conflicting relationships between urban ecological functions and production–living functions in spatial utilization from the perspective of ecological service value. Therefore, based on the risk source–risk receptor–risk effect model of relative ecological risk evaluation, the study constructed a spatial conflict index from the dimensions of spatial external pressure, spatial exposure, and spatial risk response. Spatial external pressure is the basic condition for the formation of spatial conflict, spatial exposure is the root cause of the evolution of spatial conflict, and the spatial risk response is a visual expression of the spatial conflict (Figure 1).
From the perspective of ecological service value, spatial conflict is the concentrated expression of various conflicts arising from competition among different interests for spatial resources, specifically competition between urban construction and ecological environmental protection for the use of spatial resources. The development mode of mineral mining as the leading industry has made the construction of various production and living facilities around the mining area relatively complete, which is attractive to the population, resulting in the obvious trend of urban expansion and an increase in population density. In the relatively limited space, with the continuous exertion of external pressures such as industrial construction, human survival, and environmental protection, the seizure of spatial resources by various interests has become stronger and stronger, resulting in serious damage to the ecological environment and directly affecting the ecosystem service value [30]. The multi-suitability of spatial utilization determines the intensity of competition for spatial resources among spatial utilization subjects. It is also the fundamental reason for the formation of spatial conflicts. With the relatively superior location conditions, the competition for spatial resources among different interests will be more intense. Urban construction is mostly developed along traffic arteries, resource origins, rivers, and the edge of the main urban areas, etc. The area is highly suitable for construction, and is easily disturbed by human activities, with frequent land use development and construction activities, which disturb the ecological environment and cause strong spatial conflict. Under the dual influence of external pressure and strong spatial exposure, the change in the regional ecosystem service value is an important manifestation of the spatial risk response, and the stronger the spatial conflict, the greater the negative impact on the ecosystem.

3. Materials and Methods

3.1. Study Area

Xintai is located in the middle of Shandong Province (35°37′–36°07′ N, 117°16′–118° E), with a total area of 1946 km2, Figure 2. The topography is mainly hilly, and the territory is rich in mineral resources, with 32 types of proven minerals. Because of long-term mineral exploitation, surface collapse, farmland destruction, and house cracking have occurred in and around Xintai’s mining areas. The ecological environment was destroyed, and industrial and mining wasteland is widely distributed. Since 2011, when Xintai was listed in the third batch of resource-depleted cities in China, the need for transformation became urgent, while the historical legacy of land used is serious and contradicts the current sustainable development goals, making the spatial conflict significant.
In recent years, Xintai has been actively carrying out a series of projects, such as remediation of abandoned industrial and mining land, treatment of mining collapse areas and ecological restoration, etc. The ecological environment of the area has improved, and it has been named as a national model green city and national garden city.

3.2. Data Sources

The study selected 2009 and 2020 as the study periods based on data variability, and the comparability and accessibility of data. The research data mainly involve the population density, grain yield, and land use data of Xintai. Among them, the population density data were obtained from the Resource and Environment Science and Data Center of the Chinese Academy of Sciences (https://www.resdc.cn, accessed on 29 March 2022), and the spatial resolution is 1 km × 1 km. The land use data of major roads, rivers, mining areas, urban construction land, and townships were obtained from the land use survey data of Xintai in 2009 and 2020. Socio-economic data such as food production were obtained from the statistical yearbook of Xintai and statistics from the Bureau of Agriculture and Rural Affairs.

3.3. Method

3.3.1. Spatial Conflict Index

For analyzing the mechanism of spatial conflict, the spatial conflict index was constructed based on the characteristics of spatial resource scarcity, the appropriateness of spatial development; spatial utilization dynamics, and multi-appropriateness from the three dimensions of spatial external pressure, spatial exposure, and spatial response, combined with using the characteristics of resource-based cities to select indicators. The calculation formula is as follows:
E S C = ( P i j + E i n E S V i m )
E S V i m = ( V i m × V C i m )
where ESC is the spatial conflict index; Pij is the pressure indicator j of unit i, including population density, the proportion of construction land, and the proportion of mining land; Ein is the exposure n of unit i, including the distance from major roads, the distance from rivers, the distance from mines, and the distance from townships; ESVim is the ecosystem service value m of unit i; Vim is the area of ecosystem m of unit i; and VCim is the ecosystem service value coefficient of ecosystem m in unit i, including farmland, garden land, woodland, grassland, water, construction land, and unused land.
The spatial external pressure (P) was measured in terms of the dimension of demand for space development and use by different socio-economic factors, and three indicators were selected: population density, the proportion of construction land, and the proportion of mining land. The higher the population density, the higher the proportion of construction land, and the larger the mining area, the more intense the competition for spatial resources and the higher the intensity of spatial conflict, which are positively correlated. Among these, the proportion of urban construction land and the proportion of mining land were calculated per unit of area of construction land and mining land using a 1 km × 1 km grid as the unit. Spatial exposure (E) was reflected by the suitability of spatial development and utilization, specifically expressed by the position relative to the main traffic roads, mining areas, and rivers. The closer the area to the roads, rivers, and mining areas, the higher the possibility of spatial conflicts occurring under external pressure. The distance analysis used Euclidean distance analysis in ArcGIS 10.4, with a 1 km × 1 km grid selected. The spatial risk response study referred to Wu et al. [31]. The higher the intensity of spatial conflict, the greater the impact on ecological space and the weaker the ecosystem service value (ESV), as the two are negatively correlated. Considering the data accessibility, visualization effects, and accuracy of the calculation results in the study area, a 1 km × 1 km grid was selected as the evaluation unit to measure the spatial conflict index, and the relevant indicators are shown in Figure 3 (taking 2020 as an example). Due to the different levels of the indicator data, the study usef the Fuzzy membership tool in ArcGIS10.4 to normalize the indicators.
According to the research methods of Costanza et al. [32] and Xie et al. [33], ecosystem service values were assessed. The assessment model of ecosystem service value and China’s Terrestrial Ecosystem Service Value equivalence table were used to calculate ESV, and the equivalence factor was based on the market value of the average annual production of major food crops in Xintai from 2009 to 2020. According to the actual situation of Xintai, the study divided the ecosystems into 7 categories and revised the ecosystem service value equivalents per unit of area for each ecosystem by considering the relevant research results, among which, cropland, woodland, and grassland correspond to farmland, forest, and grassland ecosystems respectively. Garden land was the average value of forest and grassland ecosystems. The water area was the average value of wetland and water ecosystems. Unused land corresponds to the desert ecosystem. Normally, it is considered that construction land does not belong to the natural ecosystem, but the study area is a typical resource-based city and the construction land has a large negative impact on the ecosystem service value. Hence, construction land was included in the study, and its calculation method refers to the research results of related work [34]. The results of the assessment are shown in Table 1. The spatial distribution of ecosystem service value is shown in Figure 3 and was calculated by Equation (2).

3.3.2. Dynamic Degree of Land Use

The dynamic degree of land use reflects the change in the amount of regional land use over a certain time and is divided into the dynamic degree of a single land use and the dynamic degree of comprehensive land use [35,36,37]. The study analyzed the active degree of the change in each land use type in Xintai as the dynamic degree of a single land use, for which the formula is as follows:
K = U a U b U a × 100 %
where K is the dynamic degree of a land use type during the study period, Ua is the area of a land use type at the beginning of the study period, and Ub is the area of a land use type at the end of the study period.
The study analyzed the overall situation of land use conversion in Xintai from 2009 to 2020 as the dynamic degree of comprehensive land use to reflect the intensity of regional land use conversion, calculated as follows:
S = ( i = 1 n Δ S i - j 2 i = 1 n S i ) × 100 %
where S is the rate of land use change during the study period, Si is the total area of land use type i at the beginning of the study period, and Si−j is the absolute value of the converted area of land use type i during the study period.

3.3.3. The Coupling Coordination Model

To explore the interaction between spatial conflict and land use, the coupling coordination model was used. Coupling refers to the phenomenon when two or more systems or forms of motion influence each other through various interactions. Coordination refers to coordination and cooperation between or among systems or various elements, which is a virtuous cycle [38,39,40,41]. The formula is as follows:
C i = 2 { S × E S C ( S + E S C ) 2 } 1 2
where Ci is the degree of coupling coordination. When Ci = 1, this means that land use and space conflict are in the best coupling coordination state. When Ci = 0, this means that there is nothing between them, and the system develops in a disorderly fashion.

4. Results

4.1. Spatial and Temporal Evolution Characteristics of Spatial Conflicts

On the basis of the inverted U-shaped curve model for grading spatial conflicts, the study classified spatial conflicts into four levels [42]: stable and controllable [0, 0.5], somewhat controllable (0.5, 0.7], somewhat out of control (0.7, 0.8] and severely out of control (0.8, 1]. The results are shown in Table 2 (Equation (1)).
The average value of the spatial conflict index (ESC) in Xintai from 2009 to 2020 decreased from 0.4544 to 0.4526, a decrease of 0.0018, indicating that the change in the spatial conflict index in Xintai was less significant and it remained stable as a whole. The change trends of different conflict levels are different. Among these, the number of stable and controllable units increased by 20 units, accounting for a rise of 1.13%; the number of somewhat controllable units decreased by 84 units, accounting for a decline of 4.75%; the number of somewhat out of control units increased by 90 units, accounting for an increase of 5.09%; and the number of severely out of control units decreased by 26 units, accounting for a decline of 1.47%. Overall, although the intensity of spatial conflicts in the study area has tended to weaken, the index is still high. The expansion of the somewhat out of control areas and the shrinkage of the somewhat controllable areas indicates that the spatial conflict is still significant, and this area urgently needs to strengthen coordination, optimization, and control to avoid further intensification of spatial conflicts.
Spatially (Figure 4), the spatial conflict layout from 2009 to 2020 is mainly distributed in the central part of the study area, and the spatial conflict around the mine area is significant. Among these areas, the spatial conflict index is higher in the southeast. Stable and controllable areas (yellow areas) are distributed around the study area: where the density of mining areas is low, ecological protection is good, human interference is relatively low, and spatial utilization is stable. Somewhat controllable areas (green areas) are shrinking, with a significant reduction to the west and a small expansion to the northeast. Somewhat out of control areas (pale blue areas) are expanding, spreading in all directions with the urban area as the center, and the spatial layout is mostly contiguous with that of severely out of control areas, with a slight concentration in the central city. Severely out of control areas (dark blue areas) are shrinking significantly and are still concentrated around the central city.
The mining areas in Xintai are mainly distributed in the central city in the west (Figure 4), and their spatial location is consistent with that of the somewhat out of control and severely out of control areas, indicating that mineral exploitation in resource-based cities is one of the important factors leading to spatial conflict. In addition, the spatial agglomeration of somewhat out of control and severely out of control areas decreased from 2009 to 2020, indicating the effectiveness of various ecological restoration projects in Xintai has gradually appears, which have contributed to the change in spatial conflict patterns and the weakening of their intensity.

4.2. Dynamic Degree of Land Use

According to the calculation (Equation (4)), the dynamic degree of land use of Xintai from 2009 to 2020 was measured and corrected to a 1 km × 1 km grid (Table 3, Figure 5). In the past 10 years, the maximum value of the dynamic degree of comprehensive land use in Xintai was 73.54% and the minimum value was 0. The average dynamic degree of land use was 23.14%, and the spatial layout was significantly different. The land around the central city has changed greatly. With the closure of small mines in Xintai, the risk of surface subsidence and fracturing has been significantly reduced, and the land use types in the former mining areas have gradually diversified, which makes the dynamic degree of land use in the study area more active. In the area, there are 215 grid cells with a dynamic degree of land use of 0–15% (dark blue areas), accounting for 12.15%, with poor spatial clustering and scattered throughout the area, with slight concentrations in the north, west, and south. There are 1283 grid cells between 15–30% (pale blue areas), accounting for 72.53%, with a large scale and distributed across a wide range, with a continuous and concentrated layout, there are 250 grid cells between 30% and 45% (green areas), accounting for a slightly higher proportion of 14.13%, mainly distributed along the central axis of the study area, such as the central city. There are 20 grid cells between 45% and 60% (orange areas), accounting for 1.13%, with a scattered spatial layout and slightly concentrated in the middle of the study area. Only one grid cell was between 60% and 73.54% (red areas), accounting for only 0.06%; it is on the north side of Xintai. In general, the land use changes around the urban area of Xintai have been more active.
There significant differences in the space-time changes of different land types. Among these, changes from cultivated land to woodland, the expansion of construction land, land reclamation, land restoration, and afforestation are relatively obvious, as shown in Figure 6 (Equation (3)). From 2009 to 2020, the phenomenon of cultivated land changing to woodland was marked. The total change was 175.14 km2. The spatial distribution was mainly concentrated in the west, and the patch fragmentation was high. The land reclamation mainly involved conversion from woodland and garden land, with a total area of 74.15 km2. The patch area of newly added cultivated land is small, irregular in shape, and scattered in its spatial distribution. The expansion of construction land is obvious, with a total increase of 41.12 km2, mainly from woodland and farmland, and the expansion around the urban area was the most important. With the implementation of various ecological restoration projects, the afforestation area of Xintai has increased significantly, with a total area of 16.67 km2, which is concentrated in Wennan Town in the southeast and Quangou Town in the north.

4.3. Degree of Coupling Coordination

According to the changes in the spatial index from 2009 to 2020, the study area is divided into the area with enhanced spatial conflict (enhanced area) and the area with weakened spatial conflict (weakened area). The results show that the degree of coupling coordination in the enhanced area is significantly lower than that in the weakened area, as shown in Table 4 (Equation (5)). From 2009 to 2020, there were 899 units with a reduced spatial conflict index in Xintai, of which 774 units showed a coordinated relationship between land use change and spatial conflict, accounting for 43.75% of Xintai, and 125 were out of balance, accounting for 7.07% of Xintai. This indicates that regional land use was more reasonable in this period, was in harmony with the demand for space use, and had a positive effect on reducing the level of spatial conflict. There are 870 units in the enhanced area, 291 units of which showed coordination between land use and spatial conflicts, and 579 units are in a state of imbalance, of which 74 show severe incoordination, accounting for 4.18%, 27 units more than the weakened area. There are 505 slight incoordination areas, accounting for 28.55%, which is about 6.5 times that of the less disordered units in the weakened area. The conflict index is on the rise.
As shown in Figure 7, the spatial distribution of the degree coupling coordination is significantly different. The west has a pattern of agglomerated coordination and disperse incoordination, and the east has coordination and incoordination across the layout. Among them, the severe incoordination areas (gray areas) are scattered throughout the whole area and are slightly concentrated in in the northeast and southwest. The slight incoordination areas (yellow areas) are relatively large in scale and distributed in a concentrated manner, mainly in the northeast, south, and west. The basic coordination areas (blue areas) are scattered throughout the whole region, and most of them belong to the transition between the high coordination areas and the slight incoordination areas. The high coordination areas (pink areas) are spatially concentrated in the west-central, east, and south. In general, the incoordination areas (gray and yellow areas) and the enhanced areas have a strong spatial consistency. Moreover, there is a high degree of overlap between the enhancement areas and the urban area of Xintai, indicating that, currently, land use patterns in areas with a high impact of anthropogenic disturbance have a limited role in reducing the intensity of spatial conflict. Coordination between land use objectives should be strengthened in the future to manage spatial conflicts.

5. Discussion

5.1. Measurement of Spatial Conflict Based on Ecological Service Value

Rapid urbanization leads to more complex and intense spatial utilization patterns. Production, living and ecological spaces cross each other and change frequently, and the intensification of spatial conflicts directly affects the stability of regional land use and the ecosystems. As a complex system composed of multiple elements, spatial conflict contains multiple dimensions, in which the ecological environmental conditions and land use changes are involved. Spatial conflicts arise from the competition for spatial resources between different utilization subjects due to the differences in their goals. From the perspective of land use, spatial conflicts are a discordance between the manner and quantity of land use by interested subjects based on different needs and the contradiction between various land use methods and environmental protection. From the perspective of ecosystem service value, spatial conflict is the inconsistency in spatial utilization patterns and configuration caused by the trade-off of ecosystem services in the process of spatial development and utilization. Resource-based cities are rich in mineral resources, which bring economic benefits while causing serious damage to the ecological environment. Resource-based cities generally have the problem of low ecological environmental quality, and the contradiction between ecological environmental protection and socio-economic development needs is further highlighted, which makes the already scarce spatial resources more and more restricted, and the pressure of external development forces spatial conflicts to intensify, affecting the value of regional ecosystem services. Therefore, it is feasible to construct a spatial conflict measurement model from the perspective of ecosystem service value, taking the factors that impede the transformation of such cities into account, and combining the characteristics of spatial resource scarcity, appropriate development, and utilization dynamics.

5.2. The Changes in Land Use

The land use characteristics of Xintai from 2009 to 2020 are mainly changes from cultivated land to woodland, land reclamation, the expansion of construction land, and an increase in ecological land. According to the analysis of the spatial location characteristics, the areas where arable land has been converted to woodland are mostly adjacent to urban and rural construction land, and the stability of cultivated land utilization is relatively poor. The shape of the patches is irregular, mostly at the edge of farmland, and their fragmentation is high and their continuity is poor. From the perspective of the main body of use, the conversion of arable land to woodland is mostly a spontaneous act of farmers, who use arable land to plant seedlings in order to improve their economic efficiency. According to the statistics, in 30.98 km2 of the cropland, forestation has not destroyed the cropland area and the area can be restored to cropland; whereas on 139.08 km2, the cropland area has been destroyed but it can be restored by engineering and continue to be used as cropland. Only on 5.08 km2 has the cropland layer been destroyed so that it cannot be restored, and it will be used as stable woodland. Xintai is a major advanced county for food production in China, and it is necessary to guarantee a certain level of farmland. In recent decades, land reclamation in Xintai mainly involved the conversion of forest and garden land, concentrated in the western plain area. The increasing depletion of coal resources has caused unbalanced economic development and low land use efficiency in Xintai. In order to promote the sustainable development of the city, Xintai’s government actively promotes land restoration projects to revitalize the land resources and has explored the use of social capital to implement land restoration, opening up a new avenue of city–industry integration. The scale of new arable land and the replanting index of farmland has increased significantly. The development goal of Xintai is to build a modern industrial city, and the urban space pattern of “two cores leading, five axes driving, two areas integrating, and six groups linking” will be formed in the future. In line with this goal, the expansion of construction land becomes an inevitable trend. In addition, a series of historical problems such as the deterioration of the ecological environment and the severe serious destruction of land resources caused by mineral production seriously threaten the ecological security of Xintai. The relevant government departments actively carry out ecological restoration projects and large-scale afforestation activities, which are of great significance for the improvement of the regional ecological environment.
According to the land use transfer matrix, the land use changes in the enhanced areas is mainly land reclamation and the expansion of construction land, as shown in Table 5. Land reclamation is an important way to supplement cultivated land, but unreasonable reclamation activities hurt the ecological environment. In the land reclamation are of Xintai, the proportion of change from woodland to cultivated land is large, and the reduction of woodland has a great impact on the ecology. It directly affects the change in the regional ecological service value and affects the degree of spatial conflict. The expansion of construction land is closely related to regional development. The mode of expansion in coordination with ecological protection, agricultural production, urban construction, and other objectives is reasonable and feasible, and can promote social and economic development. The expansion mode only serves development, makes the competition for space resources fierce, and has a great impact on the ecological environment. Compared with the weakened area, the scale of woodland conversion to cultivated land and the expansion of construction land in the enhanced area is slightly higher, and has a large negative impact on the spatial conflict, indicating that the coordination of various land use objectives in the area is poor. One of the effective ways to mitigate the spatial conflict is to reasonably adjust the land use mode and coordinate multiple objectives.

5.3. The Changes in Land Use and Spatial Conflict

Land is the carrier of space, and its utilization structure and method are representations of spatial utilization status. It is common to explore spatial conflicts in terms of land use conflicts. However, land and space are in an interactive relationship. Significant conflicts in land use correspond to strong spatial conflicts, and the governance of spatial conflicts can affect the mutual conversion between land uses through the optimal allocation of land resources. The coupling coordination relationship between the change in the spatial conflict index and the dynamic degree of land use can be divided into four scenarios. In Scenario 1, the level of spatial conflict decreases and land use conversion is frequent; in Scenario 2, the level of spatial conflict decreases and land use is relatively stable; in Scenario 3, spatial conflict intensity increases but land use is stable; and in Scenario 4, spatial conflict level increases and land use conversion is frequent. The ideal scenarios are Scenario 1 and Scenario 2, for which the reduction in the level of spatial conflict is driven by rational adjustment of land use. Scenario 3 and Scenario 4 occur when the demand for space use is not coordinated with the adjustment mode of land use, and the system is unbalanced. For example, in the two subcentral urban areas, the demand for urban construction is relatively strong, and the construction land has expanded significantly, squeezing agricultural and ecological space, and spatial conflicts have gradually increased. Although land use conversion is frequent in this area, the ecological service value has been significantly reduced, which has intensified the degree of spatial conflict. In recent years, Shilai Town has focused on rural revitalization, making full use of the natural features and creating a platform for demonstration areas. As the competition for spatial resources for rural construction needs has gradually intensified, the relatively stable land use pattern has not been coordinated with it, leading to an increase in spatial conflict. In general, the adjustment of land use in Xintai has had a positive impact on the management of spatial conflicts, with urban development and ecological and environmental protection as the main objectives, but the land use patterns in some areas still need further optimization and adjustment. In the future, the objectives of spatial governance, economic development, and ecological protection should be coordinated; land resources should be reasonably allocated; and the spatial layout should be optimized to lay the foundation for the management of spatial conflicts.

5.4. Limitations

There are still some limitations in this study. Firstly, although the study incorporated socio-economic factors into the calculation of the spatial conflict index, there are still deficiencies due to data limitations. In the future, the selection of evaluation indicators should be enriched from the aspects of the social economy, policy culture, etc., and the method of measuring the spatial index should be improved. Secondly, the study only analyzed the coupling coordination relationship between comprehensive land use dynamics and spatial conflict, and further research is needed on the impact of conversion between different land uses on spatial conflict.

6. Conclusions

Based on the characteristics of resource-based cities, this study selected indicators from the dimensions of spatial pressure, spatial exposure, and spatial risk response to construct a spatial conflict measurement model, and explored the spatial and temporal evolution of the characteristics of spatial conflicts in Xintai from 2009 to 2020. We used the coupling coordination model to analyze the coordination relationship between land use and spatial conflict, clarify the coupling coordination relationship between the regional changes in spatial conflict intensity and land use dynamics, which can provide a scientific basis for rational regional land use and the optimization of spatial development.
(1)
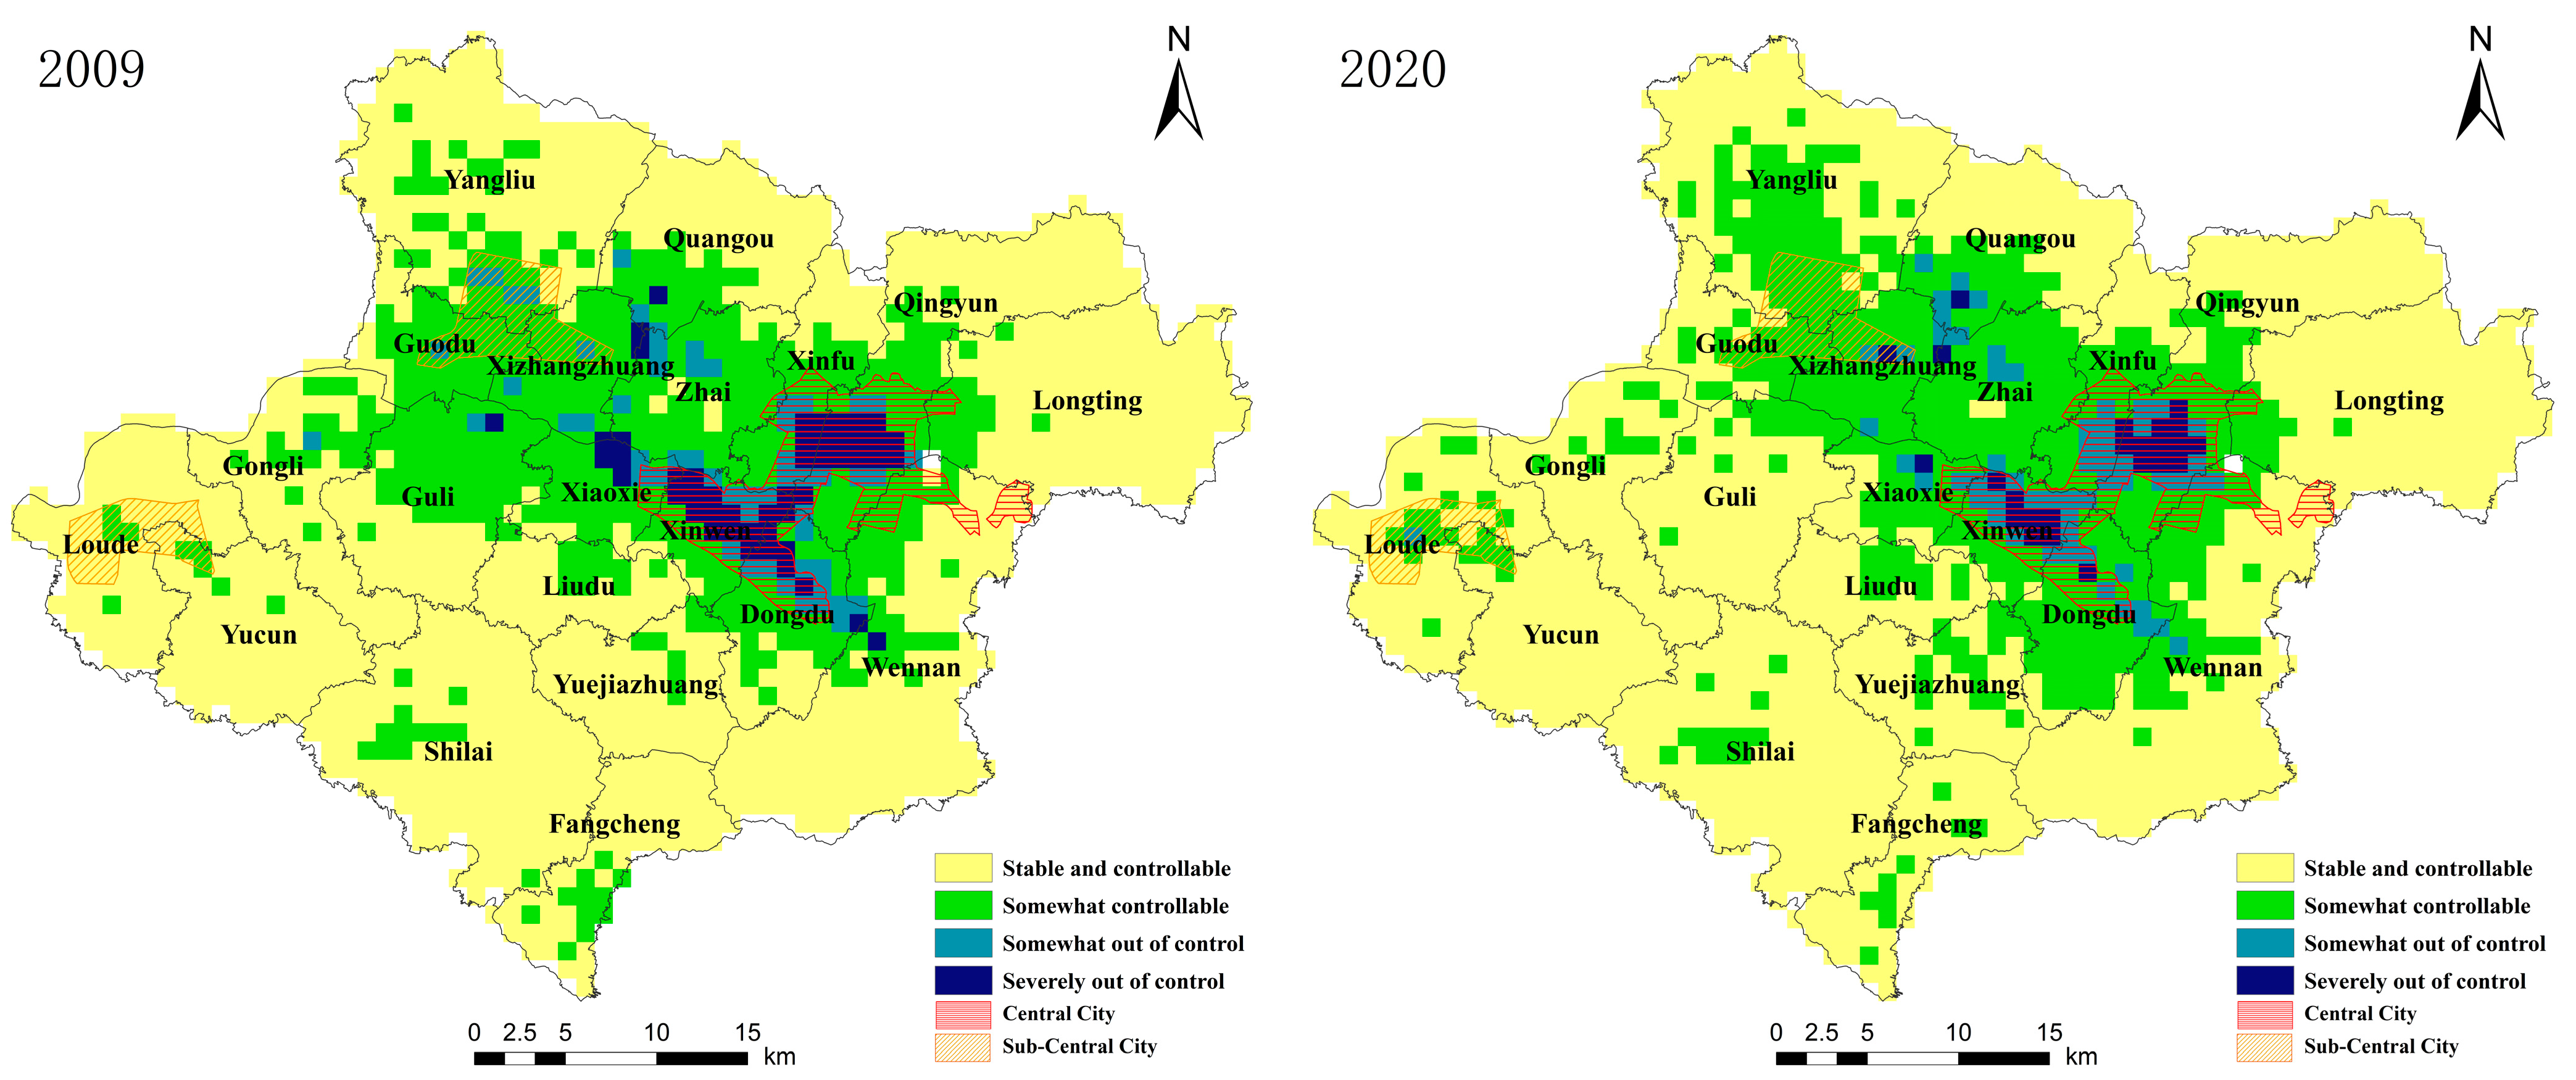
From 2009 to 2020, the change in the spatial conflict index in Xintai was relatively stable, with a change of 0.0018 (Table 2). The changing trend of different conflict levels is different. The number of stable and controllable and somewhat out of control grid cells increased by 20 and 90, respectively, and the number of somewhat controllable and severely out of control grid cells decreased by 84 and 26, respectively. In terms of space, the spatial conflict pattern of Xintai is distributed in circles, with high intensity in the middle and relatively low intensity in the surrounding areas. Moreover, the areas with strong spatial conflicts have good spatial consistency with the urban areas and mining areas.
(2)
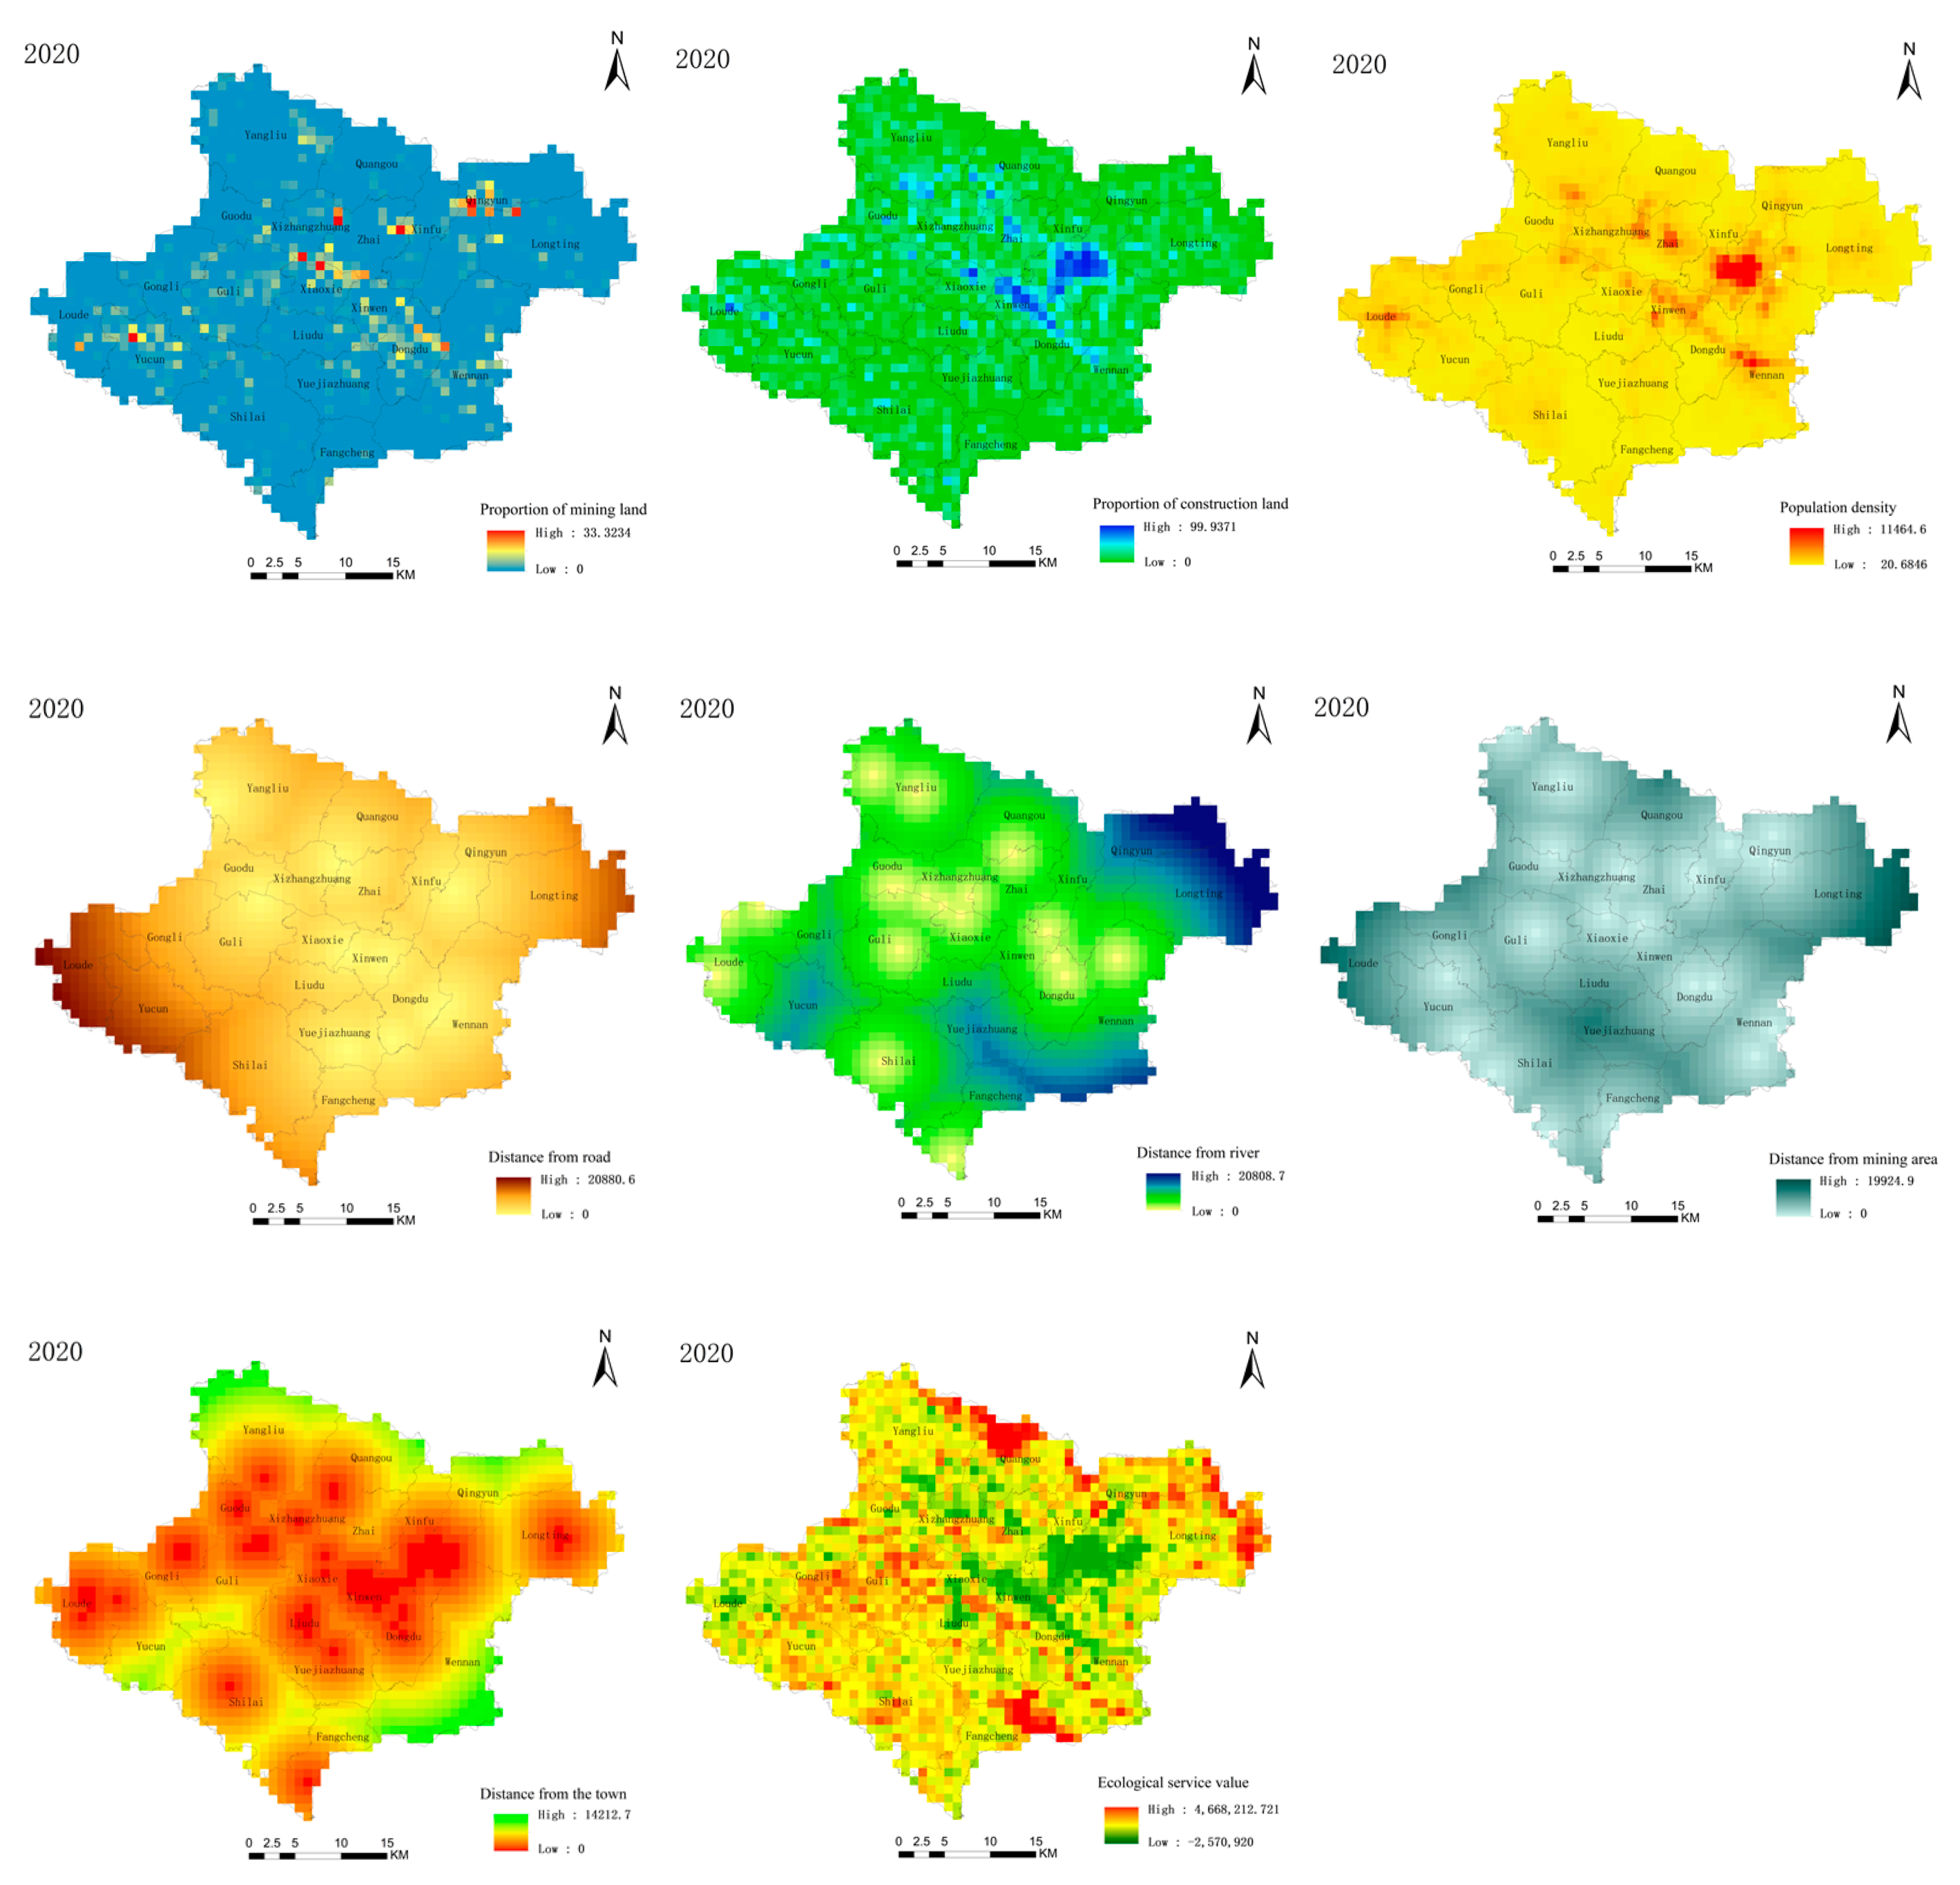
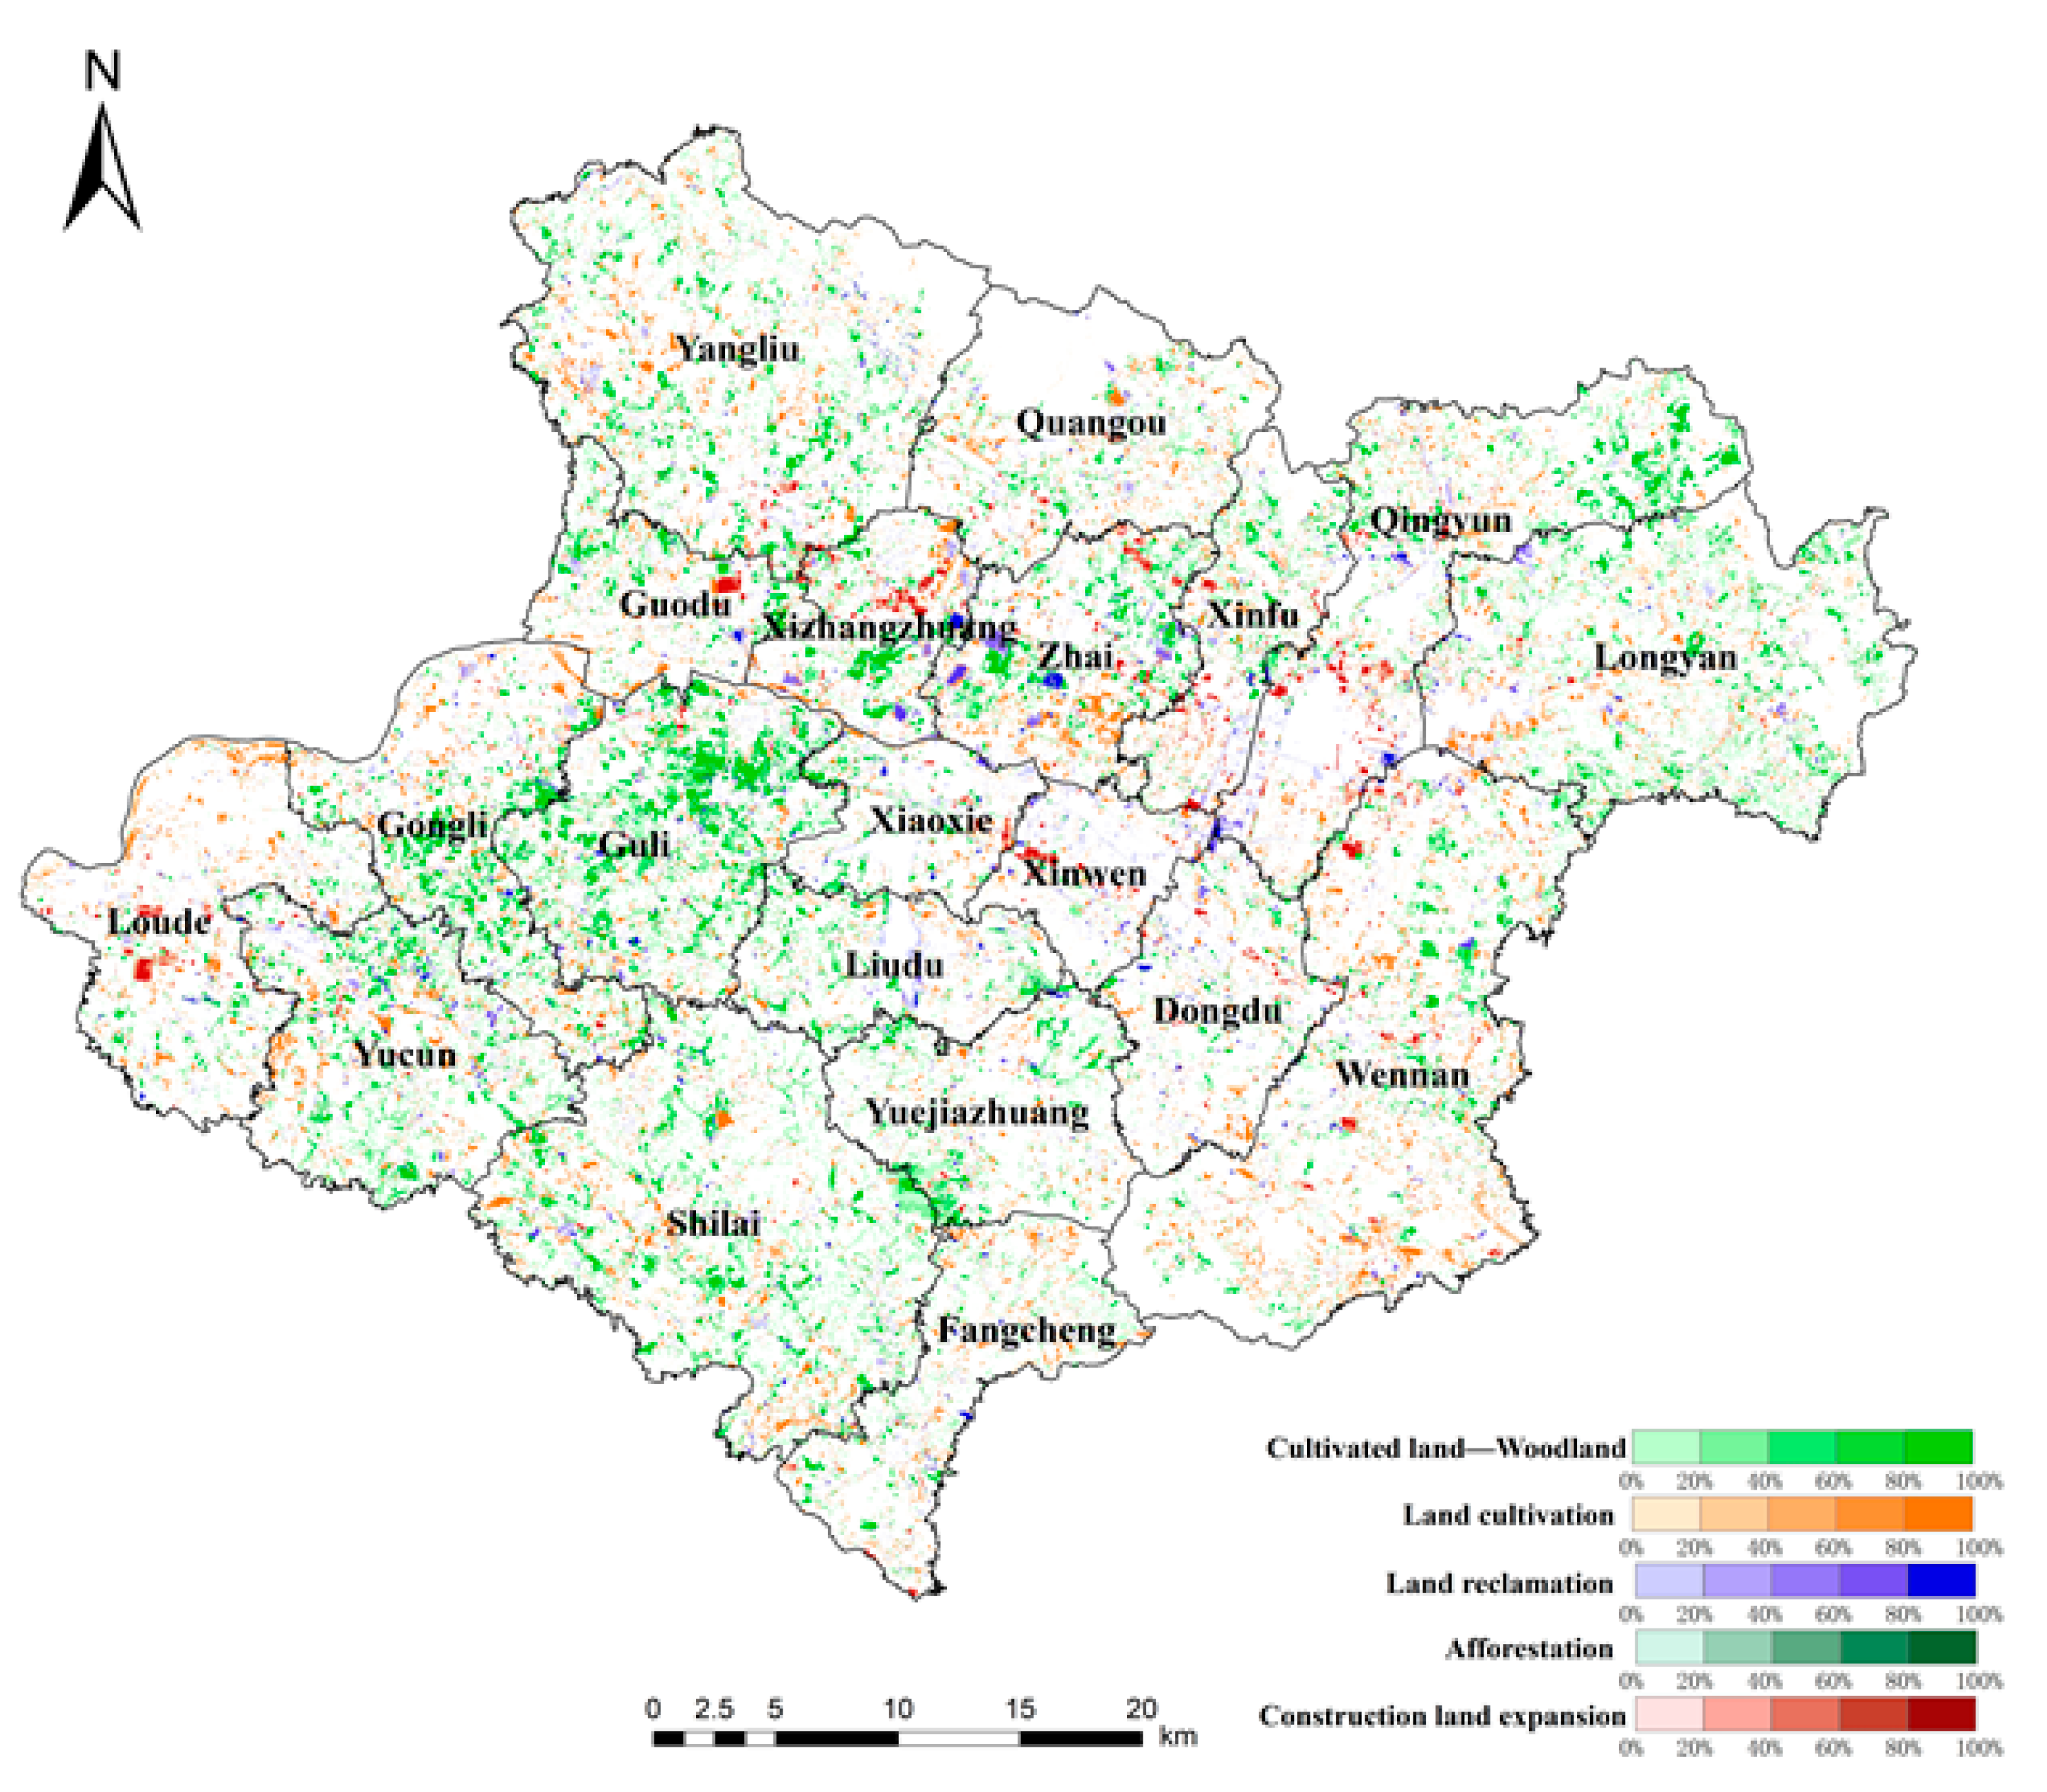
From 2009 to 2020, affected by the demand for urban transformation, the changes in land use in Xintai had significant spatial differences, with the dynamic degree of land use being [0–0.73], and the average dynamic degree of land use was 23.14% (Table 3). There are obvious differences in the mutual transformation among different land types, mainly including the shift from cultivated land to woodland, land reclamation, land restoration, afforestation, and the expansion of construction land.
(3)
From 2009 to 2020, the land use patterns and spatial conflict in Xintai were mainly coordinated, with 1065 units, accounting for 60.20%, and 704 units, accounting for 39.80% (Table 4). The weakened areas of spatial conflict were dominated by coordination, with 774 units, accounting for 43.75%, while the areas of enhanced spatial conflict were dominated by incoordination, with 579 units, accounting for 32.73%. Further analysis showed that the land use of Xintai mainly serves the regional development position and the land management of the mining area, and coordination between the land use and the management of spatial conflict needs to be improved.

Author Contributions

Conceptualization and methodology, Y.Z.; data analysis, Y.Z. and Y.W.; funding acquisition, L.C.; investigation, L.C. and Y.W.; writing—original draft, Y.Z.; writing—review and editing, L.C. and Y.Z. All authors have read and agreed to the published version of the manuscript.

Funding

This research was funded by the National Key Research and Development Program of China (2018YFD1100803).

Institutional Review Board Statement

Not applicable.

Informed Consent Statement

Not applicable.

Data Availability Statement

Data are available on request to the authors.

Conflicts of Interest

The authors declare no conflict of interest.

References

  1. Zhang, W.; Wang, D.; Yu, J. Study on the Development Path and Pattern of Substituted Industry in Resource-Based Cities. Bull. Chin. Acad. Sci. 2011, 26, 134–141. [Google Scholar]
  2. Tan, J.; Zhang, P.; Lo, K.; Li, J.; Liu, S. The Urban Transition Performance of Resource-Based Cities in Northeast China. Sustainability 2016, 8, 1022. [Google Scholar] [CrossRef]
  3. Long, R.; Li, H.; Wu, M.; Li, W. Dynamic Evaluation of the Green Development Level of China’s Coal-Resource-Based Cities Using the TOPSIS Method. Resour. Policy 2021, 74, 102415. [Google Scholar] [CrossRef]
  4. Zhou, G.; Peng, J. The Evolution Characteristics and Influence Effect of Spatial Conflict: A Case Study of Changsha-Zhuzhou-Xiangtan Urban Agglomeration. Prog. Geogr. 2012, 31, 717–723. [Google Scholar]
  5. Zhou, D.; Xu, J.; Wang, L. Land Use Spatial Conflicts and Complexity: A Case Study of the Urban Agglomeration around Hangzhou Bay, China. Geogr. Res. 2015, 34, 1630–1642. [Google Scholar]
  6. Lin, G.; Jiang, D.; Fu, J.; Cao, C.; Zhang, D. Spatial Conflict of Production-Living-Ecological Space and Sustainable-Development Scenario Simulation in Yangtze River Delta Agglomerations. Sustainability 2020, 12, 2175. [Google Scholar] [CrossRef]
  7. Almeida, J.; Costa, C.; Nunes da Silva, F. A Framework for Conflict Analysis in Spatial Planning for Tourism. Tour. Manag. Perspect. 2017, 24, 94–106. [Google Scholar] [CrossRef]
  8. Brown, G.; Raymond, C.M. Methods for Identifying Land Use Conflict Potential Using Participatory Mapping. Landsc. Urban Plan. 2014, 122, 196–208. [Google Scholar] [CrossRef]
  9. Evans, J.D.; Kirkpatrick, J.B.; Bridle, K.L. A Reciprocal Triangulation Process For Identifying And Mapping Potential Land Use Conflict. Environ. Manag. 2018, 62, 777–791. [Google Scholar] [CrossRef]
  10. Zhou, D.; Lin, Z.; Lim, S.H. Spatial Characteristics and Risk Factor Identification for Land Use Spatial Conflicts in a Rapid Urbanization Region in China. Environ. Monit. Assess. 2019, 191, 677. [Google Scholar] [CrossRef]
  11. Dong, G.; Ge, Y.; Jia, H.; Sun, C.; Pan, S. Land Use Multi-Suitability, Land Resource Scarcity and Diversity of Human Needs: A New Framework for Land Use Conflict Identification. Land 2021, 10, 1003. [Google Scholar] [CrossRef]
  12. He, Y.; Tang, C.; Zhou, G.; He, S.; Qiu, Y.; Shi, L.; Zhang, H. The Analysis of Spatial Conflict Measurement in FastUrbanization Region from the Perspective of Geography—A Case Study of Changsha-Zhuzhou-Xiangtan UrbanAgglomeration. J. Nat. Resour. 2014, 29, 1660–1674. [Google Scholar]
  13. Wang, J.; Zou, L.; Li, M. Identification and Governance of Potential Land Use Conflicts in Tourism Resort Based on Ecological-Production-Living Suitability. Nongye Gongcheng Xuebao/Trans. Chin. Soc. Agric. Eng. 2019, 35, 279–288. [Google Scholar]
  14. Lin, G.; Fu, J.; Jiang, D. Production-Living-Ecological Conflict Identification Using a Multiscale Integration Model Based on Spatial Suitability Analysis and Sustainable Development Evaluation: A Case Study of Ningbo, China. Land 2021, 10, 383. [Google Scholar] [CrossRef]
  15. Liu, X.; Zhang, Z.; Li, M.; Fu, Y.; Hui, Y. Spatial Conflict Simulation of Land-Use Based on Human-Land-Landscape Elements Intercoordination: A Case Study in Tianjin, China. Environ. Monit. Assess. 2022, 194, 317. [Google Scholar] [CrossRef]
  16. Cieślak, I. Identification of Areas Exposed to Land Use Conflict with the Use of Multiple-Criteria Decision-Making Methods. Land Use Policy 2019, 89, 104225. [Google Scholar] [CrossRef]
  17. Yun, L.; Yanfang, Z.; Mao, T.; Lichang, Y.; Ru, W. Identification of Key Ecological Protection Areas Based on the “Importance-Sensitivity-Conflict” Framework in Northern Shaanxi Province. Resour. Environ. Yangtze River Basin 2020, 29, 643–653. [Google Scholar]
  18. Zou, L.; Liu, Y.; Wang, J.; Yang, Y. An Analysis of Land Use Conflict Potentials Based on Ecological-Production-Living Function in the Southeast Coastal Area of China. Ecol. Indic. 2021, 122, 107297. [Google Scholar] [CrossRef]
  19. Cui, J.; Kong, X.; Chen, J.; Sun, J.; Zhu, Y. Spatially Explicit Evaluation and Driving Factor Identification of Land Use Conflict in Yangtze River Economic Belt. Land 2021, 10, 43. [Google Scholar] [CrossRef]
  20. Adam, Y.O.; Pretzsch, J.; Darr, D. Land Use Conflicts in Central Sudan: Perception and Local Coping Mechanisms. Land Use Policy 2015, 42, 1–6. [Google Scholar] [CrossRef]
  21. Zhao, X.; Tang, F.; Zhang, P.; Hu, B.; Xu, L. Dynamic Simulation and Characteristic Analysis of County Production-Living-Ecological Spatial Conflicts Based on CLUE-S Model. Shengtai Xuebao 2019, 39, 5897–5908. [Google Scholar]
  22. Zou, L.; Liu, Y.; Wang, J.; Yang, Y.; Wang, Y. Land Use Conflict Identification and Sustainable Development Scenario Simulation on China’s Southeast Coast. J. Clean. Prod. 2019, 238, 117899. [Google Scholar] [CrossRef]
  23. Reuveny, R.; Maxwell, J.W.; Davis, J. On Conflict over Natural Resources. Ecol. Econ. 2011, 70, 698–712. [Google Scholar] [CrossRef]
  24. Yu, F.; Ru-tian, B.; Jin, W.; Chunjuan, L.; Qianjuan, Z. Spatial Conflict of Land Use Caused by Mining Exploitation and Optimal Allocation Scheme of Land Resources in River Basin. China Land Sci. 2016, 30, 32–40. [Google Scholar]
  25. Jiang, S.; Meng, J.; Zhu, L. Spatial and Temporal Analyses of Potential Land Use Conflict under the Constraints of Water Resources in the Middle Reaches of the Heihe River. Land Use Policy 2020, 97, 104773. [Google Scholar] [CrossRef]
  26. Zong, S.; Hu, Y.; Zhang, Y.; Wang, W. Identification of Land Use Conflicts in China’s Coastal Zones: From the Perspective of Ecological Security. Ocean Coast. Manag. 2021, 213, 105841. [Google Scholar] [CrossRef]
  27. Zou, L.; Liu, Y.; Wang, Y. Research Progress and Prospect of Land-Use Conflicts in China. Prog. Geogr. 2020, 39, 298–309. [Google Scholar] [CrossRef]
  28. Li, S.; Zhu, C.; Lin, Y.; Dong, B.; Chen, B.; Si, B.; Li, Y.; Deng, X.; Gan, M.; Zhang, J.; et al. Conflicts between Agricultural and Ecological Functions and Their Driving Mechanisms in Agroforestry Ecotone Areas from the Perspective of Land Use Functions. J. Clean. Prod. 2021, 317, 128453. [Google Scholar] [CrossRef]
  29. Jiang, S.; Meng, J.; Zhu, L.; Cheng, H. Spatial-Temporal Pattern of Land Use Conflict in China and Its Multilevel Driving Mechanisms. Sci. Total Environ. 2021, 801, 149697. [Google Scholar] [CrossRef]
  30. Tudor, C.A.; Iojǎ, I.C.; Pǎtru-Stupariu, I.; Nitǎ, M.R.; Hersperger, A.M. How Successful Is the Resolution of Land-Use Conflicts? A Comparison of Cases from Switzerland and Romania. Appl. Geogr. 2014, 47, 125–136. [Google Scholar] [CrossRef]
  31. Meng, W.; Fengqi, Z.; Jin, C. Spatial Conflict Measurement in Rapid Urbanization Areas from the Perspective of Ecosystem Services. China Popul. Resour. Environ. 2021, 31, 12–20. [Google Scholar]
  32. Costanza, R.; Arge, R.; De Groot, R.; Farber, S.; Hannon, B.; Limburg, K.; Naeem, S.; Neill, R.V.O. The Value of the World’s Ecosystem Services and Natural Capital. Nature 1997, 387, 253–260. [Google Scholar] [CrossRef]
  33. Gaodi, X.; Caixia, Z.; Leiming, Z.; Wenhui, C.; Shimei, L. Improvement of the Evaluation Method for Ecosystem Service Value Based on Per Unit Area. J. Nat. Resour. 2015, 30, 1243–1254. [Google Scholar]
  34. Ran, H.; Xiangyang, X.; Junlian, G.; Tingting, Z.; Bo, L. Spatial Patterns of Ecosystem Services and Their Relationships with Residents’Well-Being of Coal Resource-Based Cities. Chin. J. Soil Sci. 2020, 51, 31–39. [Google Scholar]
  35. Li, F.; Zhang, S.; Bu, K.; Yang, J.; Wang, Q.; Chang, L. The Relationships between Land Use Change and Demographic Dynamics in Western Jilin Province. J. Geogr. Sci. 2015, 25, 617–636. [Google Scholar] [CrossRef]
  36. Huang, B.; Huang, J.; Gilmore Pontius, R.; Tu, Z. Comparison of Intensity Analysis and the Land Use Dynamic Degrees to Measure Land Changes Outside versus inside the Coastal Zone of Longhai, China. Ecol. Indic. 2018, 89, 336–347. [Google Scholar] [CrossRef]
  37. Pontius, R.G.; Huang, J.; Jiang, W.; Khallaghi, S.; Lin, Y.; Liu, J.; Quan, B.; Ye, S. Rules to Write Mathematics to Clarify Metrics Such as the Land Use Dynamic Degrees. Landsc. Ecol. 2017, 32, 2249–2260. [Google Scholar] [CrossRef]
  38. Yuan, J.; Bian, Z.; Yan, Q.; Pan, Y. Spatio-Temporal Distributions of the Land Use Effciency Coupling Coordination Degree in Mining Cities of Western China. Sustainability 2019, 11, 5288. [Google Scholar] [CrossRef]
  39. Ji, X.; Wang, K.; Ji, T.; Zhang, Y.; Wang, K. Coupling Analysis of Urban Land Use Benefits: A Case Study of Xiamen City. Land 2020, 9, 155. [Google Scholar] [CrossRef]
  40. Wang, P.; Qi, M.; Liang, Y.; Ling, X.; Song, Y. Examining the Relationship between Environmentally Friendly Land Use and Rural Revitalization Using a Coupling Analysis: A Case Study of Hainan Province, China. Sustainability 2019, 11, 6266. [Google Scholar] [CrossRef]
  41. Yang, C.; Zeng, W.; Yang, X. Coupling Coordination Evaluation and Sustainable Development Pattern of Geo-Ecological Environment and Urbanization in Chongqing Municipality, China. Sustain. Cities Soc. 2020, 61, 102271. [Google Scholar] [CrossRef]
  42. Jiajie, P.; Guohua, Z.; Chengli, T. The Analysis of Spatial Conflict Measurement in Fast Urbanization Region Based on Ecological Security—A Case Study of Changsha-Zhuzhou-Xiangtan Urban Agglomeration. J. Nat. Resour. 2012, 27, 1507–1519. [Google Scholar]
Figure 1. The framework of spatial conflict analysis.
Land 11 01460 g001
Figure 2. Geographical location of Xintai City, China.
Land 11 01460 g002
Figure 3. Spatial patterns of the spatial conflict measurement indicators in Xintai (2020).
Land 11 01460 g003
Figure 4. Spatial conflict patterns of Xintai, 2009–2020.
Land 11 01460 g004
Figure 5. Spatial distribution of the dynamic degree of land use in Xintai from 2009 to 2020.
Land 11 01460 g005
Figure 6. Spatial distribution of the dynamic degree of major land use types in Xintai, 2009–2020.
Land 11 01460 g006
Figure 7. Spatial layout of the degree of coupling coordination.
Land 11 01460 g007
Table 1. Table of ecosystem service value coefficients (VC) in Xintai (CNY/hm2⋅a).
TypeArable LandGardenWoodlandGrasslandConstruction LandWaterUtilized Land
Reconciliation servicesGas regulation1070.334602.407492.281712.52−5180.38−1626.890.00
Climate regulation1905.183853.175779.761926.590.009397.460.00
Water harvesting1284.394281.306850.081712.52−16,076.2911,163.4964.22
Waste disposal3510.672804.252804.252804.25−5266.0016,825.5221.41
Support servicesSoil formation and conservation3125.356261.408348.544174.2742.81920.4842.81
Biodiversity conservation1519.864655.926978.522333.31727.822670.46727.82
Supply servicesFood production2140.65428.13214.07642.2021.41214.0721.41
Raw materials214.072836.365565.69107.030.0042.812140.65
Cultural servicesEntertainment and culture21.411412.832740.0385.6321.415292.7621.41
Total14,791.9031,135.7746,773.2215,498.31−25,709.2244,900.153039.72
Table 2. Spatial conflict index (ESC) of Xintai from 2009 to 2020.
Conflict LevelThreshold20092020Amount of Change
Grid Cells/pcPercentage/%Grid Cells/pcPercentage/%Grid Cells/pcPercentage/%
Stable and controllable [0, 0.5]118767.1120768.23−20−1.13
Somewhat controllable(0.5, 0.7]47726.9639322.22844.74
Somewhat out of control(0.7, 0.8]563.171468.25−90−5.08
Severely out of control(0.8, 1.0]492.77231.3261.47
Index mean 0.45440.45260.0018
Table 3. Dynamic degree of land use in Xintai from 2009 to 2020.
Dynamic Degree of Land UseGridsPercentage/%
0–15%21512.15
15–30%128372.53
30–45%25014.13
45–60%201.13
60–73.54%10.06
Total1769100.00
Table 4. The results of the degree of coupling coordination.
TypeCoupling CoordinationWeakened
Area/pc
Percentage/%Enhanced Area/pcPercentage/%
IncoordinationSevere incoordination0.0—0.39472.66744.18
Slight incoordination0.40—0.59784.4150528.55
Subtotal1257.0757932.73
CoordinationSlight coordination0.60—0.7930317.131247.01
High coordination0.80—1.047126.631679.44
Subtotal77443.7529116.45
Total89950.8287049.18
Table 5. Land use type transition matrix of regions with changes in spatial conflict.
TypeEnhanced Area/km2Weakened Area/km2Difference
Land reclamation55.0049.975.03
Land restoration13.2528.58−15.34
Expansion of construction land30.3923.147.26
Cultivated land to woodland87.66139.51−51.85
Afforestation23.4229.18−5.76
Publisher’s Note: MDPI stays neutral with regard to jurisdictional claims in published maps and institutional affiliations.

