Article

Assessing Effects of Urban Greenery on the Regulation Mechanism of Microclimate and Outdoor Thermal Comfort during Winter in China’s Cold Region

1
College of Landscape Architecture and Art, Henan Agricultural University, Zhengzhou 450002, China
2
Institute of Landscape Architecture, Urban Planning and Garden Art, Hungarian University of Agriculture and Life Sciences, 1108 Budapest, Hungary
3
School of Architecture, Zhengzhou University, Zhengzhou 450001, China
4
Department of Earth System Science, Tsinghua University, Beijing 100084, China
5
School of Architecture, South China University of Technology, Guangzhou 510641, China
6
Faculty of Architecture, The University of Hong Kong, Pokfulam, Hong Kong 999077, China
*
Author to whom correspondence should be addressed.
These authors contributed to this work equally and should be regarded as co-first authors.
Land 2022, 11(9), 1442; https://doi.org/10.3390/land11091442
Submission received: 1 August 2022 / Revised: 27 August 2022 / Accepted: 28 August 2022 / Published: 31 August 2022
(This article belongs to the Topic Bioclimatic Designs to Enhance Urban/Rural Resilience)

Abstract

:
A comfortable thermal environment in outdoor spaces is beneficial to people’s physical and mental health in cold conditions during winter. Greenery can improve outdoor thermal comfort (OTC) via microclimates in winter. Multiple methods have been employed to investigate how greenery influences OTC and microclimate. However, the underlying mechanism of how microclimate participates in the regulation of the effect of greenery on OTC is unclear. To examine the mediating effect of microclimate on the relation between greenery and OTC in cold weather during winter, we conducted meteorological measurement and thermal comfort surveys in Zhengzhou, a city in China’s cold region, from 29 to 30 December 2019. Two objective greening indices from different dimensions were extracted at twelve sampling points: (1) the green view index (GVI) from horizontal normal images from people’s perspective, and (2) the tree view factor (TVF) from vertical-upward fisheye images. With microclimatic parameters as the mediators, a comprehensive multi-step mediation analysis was conducted. The regression results revealed that the GVI and TVF were negatively associated with the thermal comfort vote (TCV) (i.e., the more greenery, the less TCV, which means the more comfortable the thermal environment). Our findings show that both GVI and TVF contribute to OTC through different mechanisms in cold climatic conditions during winter. Vegetation in sight revealed by the GVI can directly regulate OTC by affecting people’s mental feelings or other factors. Air temperature (Ta), relative humidity (RH), and wind speed (Va) served as significant partial mediators for the GVI. Moreover, there was a complete mediation for TVF–OTC correlation with Ta, RH, and Va as significant mediators. The mediating effects of microclimate accounted for 81.00% for GVI and 89.02% for TVF, respectively. The GVI is propitious to the study of people’s mental health and landscape preferences, whereas TVF is suitable for studies on microclimate adaptation.

1. Introduction

Outdoor recreation activities, such as exercising and chatting, are beneficial to people’s physical and mental health and essential for a healthy lifestyle [1,2,3]. A comfortable thermal environment plays a positive role in the activities in outdoor public spaces, especially during the extreme winter season [4,5]. To some extent, the cold climatic condition of winter reduces people’s thermal comfort level, which refers to the subjective satisfaction with the thermal environment, and in turn, affects the utilization of outdoor space efficiently [5]. More importantly, compared with summer weather, winter weather is more associated with an increase in cardiovascular diseases which seriously endanger human life [6,7]. It has been identified that morbidity rates of asystole and acute coronary syndrome, two types of cardiovascular disease, rise by 16.2% and 3.9%, respectively, during the cold period [8]. Moreover, the winter in China’s cold region, which covers about a third of China’s area and has a large population, features a dry and cold climate and lasts three months or even longer [9]. The long, cold winter makes a significant and broad impact on human thermal perception. However, previous studies mainly focus on outdoor thermal comfort (OTC) in regions with subtropical and temperate climates [4,10,11,12]. There have been only a few studies regarding OTC during winter in China’s cold region [9,13]. Therefore, OTC in cold climates during winter in China’s cold region, which is considered the main issue in this study, is worth further studying. Additionally, there has been a universal interest in researching how landscape parameters, especially greenery, regulate OTC in different climates, including cold conditions [14,15,16]. It has been observed that vegetation such as trees and bushes can alter microclimate through transpiration, blocking radiation and adjusting wind, and in turn, influence human thermal comfort effectively [17,18]. Furthermore, Klemm et al. (2015) indicated that plants were capable of directly impacting human thermal perception by their own visual features, not via microclimatic factors [19]. Therefore, it is necessary to clarify how plants affect OTC under cold climatic conditions, so as to improve the thermal environment of outdoor spaces during winter in China’s cold region by intervening in the built environment.
A number of findings suggest that greenery plays a crucial role in microclimate [20,21]. The transpiration and evaporation of vegetation, the process in which water is discharged from the leaves, increases relative humidity (RH) and decreases the air temperature (Ta) of the surrounding space [22]. By interrupting the direct solar radiation through reflection and absorption, the tree crowns can reduce Ta and the mean radiant temperature (Tmrt), thereby creating a cool shading area [23]. The size and density of the tree canopy are effective factors in alleviating cold wind during winter as well, although the potential effects of different species vary widely [15]. Apart from that, there is a consensus among scholars worldwide that the outdoor thermal perception of individuals is closely intertwined with outdoor meteorological parameters [24]. Ta, RH, global radiation (G), and wind speed (Va) are considered to be the four main meteorological parameters related to human thermal perception [24]. Among them, Ta has been identified as the most vital variable in OTC, the relative contribution of which can reach as high as 65% of the impact of the four meteorological parameters on OTC [25]. Several studies found that radiation exhibited a higher level of association with human thermal sensation than wind, while the result was the opposite in some colder scenes, for the reason that convection took away more heat under lower air temperature [13,26]. RH has been usually viewed as the climatic variable with the weakest effect on OTC in most studies [27,28]. To meet the requirement of OTC during winter, residents desire higher Ta, more solar radiation, and lower wind speed [28]. Given this demand, different species of trees can be planted to improve OTC via microclimate in different aspects. For example, evergreen species can control the cold wind, while deciduous species allow sunshine to pass through the branches during winter [15]. Therefore, the impact of greenery on OTC is, in theory, regulated by the microclimate [29].
There is also an increasing body of literature revealing that greenery can make a significant impact on human thermal comfort not through micrometeorological effects, but via other aspects, especially psychological factors [24,29]. Some researchers observed that the space with abundant greenery made individuals feel cooler psychologically that was not related to, or even contrary to measurable meteorological status [19,30]. As a kind of ornamental landscape parameter, vegetation with colorful flowers and leaves in terms of naturalness and aesthetics are beneficial to individual emotion, and thus improve human thermal comfort positively [19,31]. Moreover, as a kind of visual stimulation, the darkness of the space, which is sometimes caused by tree shading, can lead to a cooler thermal sensation, as argued by several scholars [31,32,33]. However, due to the qualitative analysis in most studies so far, there is still a need to further clarify the effect of plants on human thermal comfort not via microclimate utilizing mathematical analysis [34,35].
A number of indices representing the characteristics of greenery in and around the space are closely related to the variation in the outdoor thermal environment and the mental feelings of individuals [36,37]. The tree view factor (TVF) is always used to evaluate the vertical covering and shading ability of trees above the space, the values of which usually have a contrary relationship with solar radiation [38,39]. The green view index (GVI) can reflect the layout of greenery in the surrounding area broadly. Zhou et al. (2022) indicated that the GVI values have been indicated to be negatively correlated with Ta and positively with RH, due to the thermal radiation filtering in the horizontal direction and the transpiration of plants [40]. Furthermore, Zhang et al. (2021) found that the GVI values were negatively related to emotional stress in winter, which can affect OTC psychologically [41]. Overall, as representative indicators quantifying greenery in the space from vertical and horizontal directions, both the TVF and GVI are closely associated with OTC, although the regulation pathways may be different.
For the variation of OTC resulting from the diversity of greenery, previous studies were used to inspect the relationship between OTC and microclimate while the characteristics of greenery, such as tree shading and visual perception, changed, from which we can understand that greenery has a significant impact on OTC [31,37]. However, studies in this field have been mostly restricted to qualitative analysis of the impact of greenery on OTC. Whether greenery regulates OTC via microclimate or makes an impact on it directly needs to be further validated via quantitative methods (Figure 1). The lack of understanding about the influencing mechanism underlying the relationship between greenery and OTC may be due to the applied statistical analysis method. Additionally, the differences in the impact of the greenery located around and above the space, respectively, on OTC need to be ascertained. A reasonable landscape design can create a comfortable thermal environment in outdoor spaces which enhances the utilization of outdoor space, promotes people’s physical and mental health, and reduces the incidence of cardiovascular diseases during winter. Thus, it is important to supply related advice for designers and managers from different aspects. Taking Zhengzhou as the study area, this research mainly aims to explore how microclimate participates in the regulation of the effect of greenery on OTC during winter. To be specific, we aim to (1) in response to the relevant research above, examine whether there is a mediating effect of microclimate on the relationship between greenery and OTC in cold weather during winter, by trying to apply statistical analysis models; (2) if so, find out to what extent the correlations are mediated by cold microclimate, e.g., air temperature, relative humidity, solar radiation, and ventilation; (3) reveal the differences of plants represented by the TVF and GVI, respectively, in adjusting OTC, which if verified, would indicate diverse underlying mechanisms about the impact of greenery on OTC in cold climatic conditions.

2. Materials and Methods

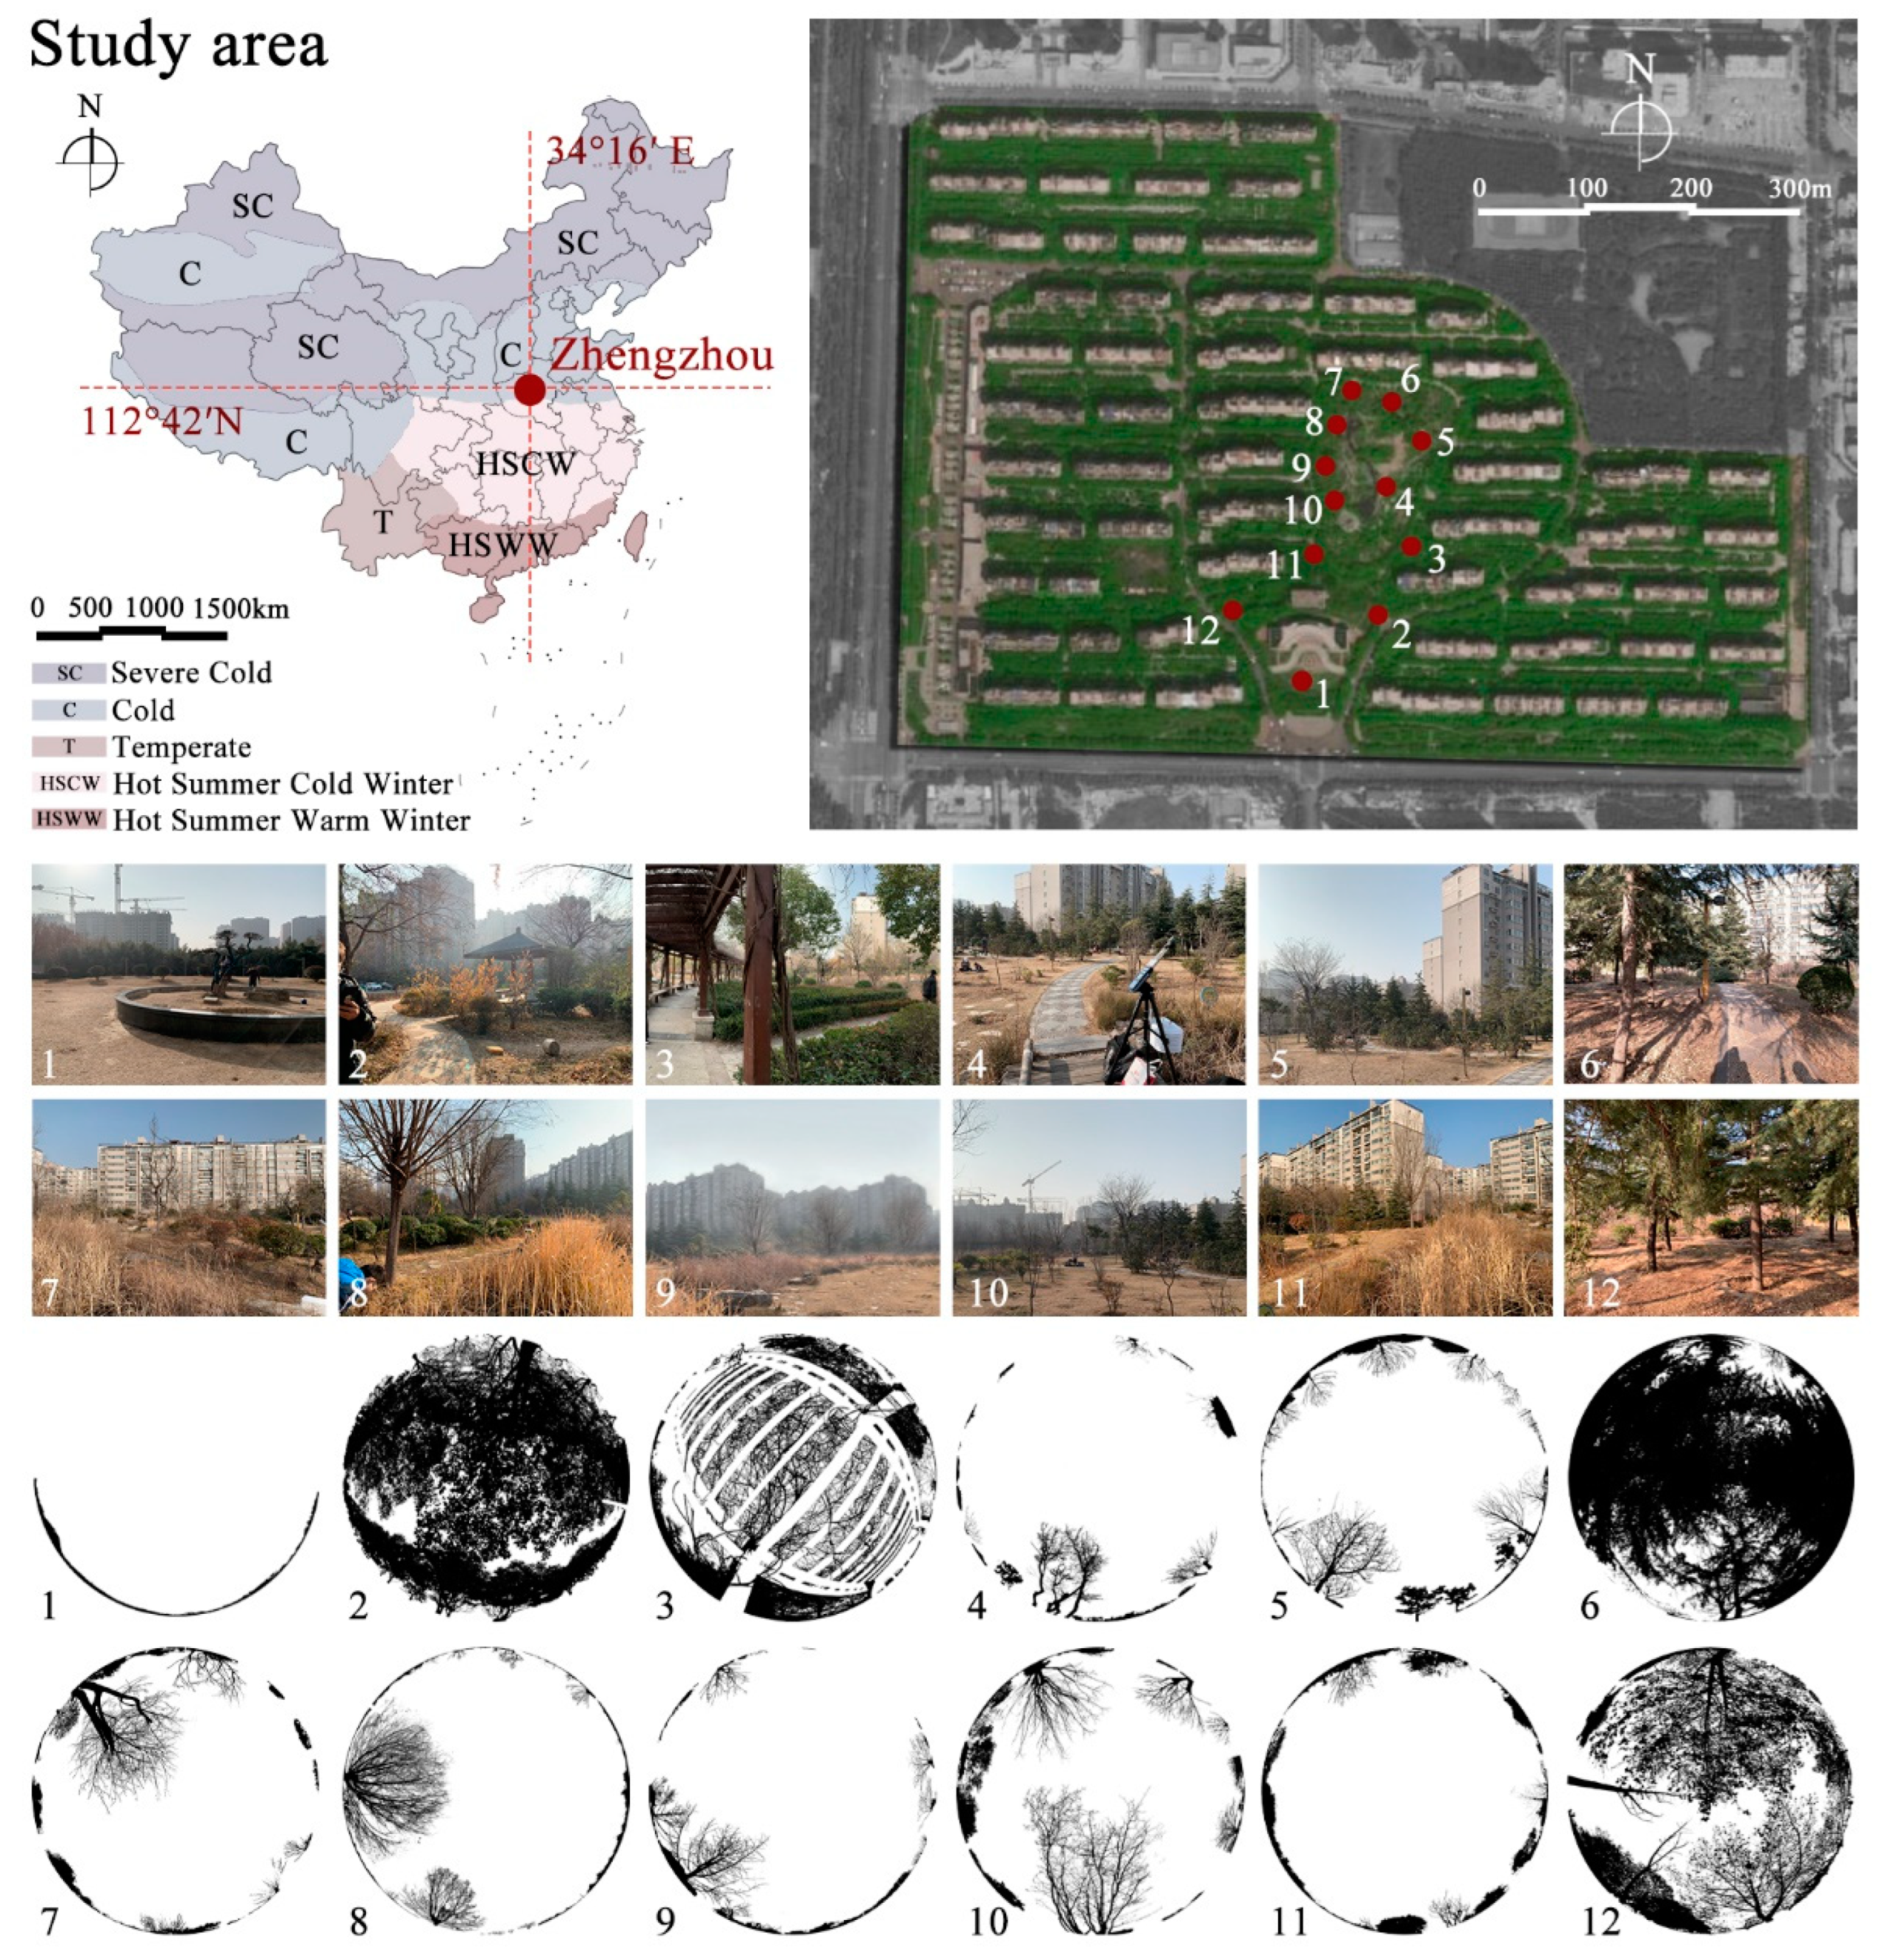
2.1. Study Area and Field Measuring Sites

This study was conducted in Zhengzhou (34°16′–34°58′ N, 112°42′–114°14′ E), a typical city of Henan Province in China’s cold region. Due to the influence of the continental monsoon from Siberia and its location in central China, Zhengzhou’s winter is characterized by chill and aridity [42]. The winter, a long and typical season in the cold region, could be defined from December to February with low air temperature and relative humidity. The ranges of daily mean air temperature, solar radiation, and relative humidity in winter are −4–9 °C, 1–16 MJ/m2, and 19–75%, respectively [43]. Evergreens and deciduous plants coexist during winter. Diverse morphological characteristics of plants result in significant differences in the TVF and GVI in different spaces, which is beneficial to discovering the diversity of microclimates and OTC under different greening conditions.
Because of the adaptability to the climate in the cold region, the regular building layout is the most common form in residential communities. This study chose a regular layout residential community with multi-story buildings located in the west of Zhengzhou as the object. The residential community covers approximately 35.7 ha with a 43.3% greening coverage rate and a 15.5% building density. There is a centralized green space with abundant well-grown plants and some activity spots in the middle of the residential area. In this study, we were concerned with the greenery in outdoor activity spaces. Given that, we confirmed 11 activity spots in the central green space and 1 open space in front of a three-story building as field measuring sites in the residential area (Figure 2). Additionally, these sites have different features in upper tree covering and surrounding plants, as shown in Figure 2.

2.2. Datasets

2.2.1. Greenery Data

The GVI and TVF were used to measure the greenery of these sites. First, in order to assess the amount of greenery around the sites, we used a series of high-definition images from people’s perspectives taken by the digital camera at each site, which have been utilized to widely reflect streetscape greenery [44,45]. For each sampling location, we photographed outdoor space images with a dimension of 1000 × 750 pixels from the four cardinal directions, south, east, north, and west, at a height of 1.5 m above the ground [45]. To extract outdoor greenery objects (e.g., trees, bushes, and grass) from these pictures, the fully convolutional neural network (FCN-8s), a supervised machine learning approach, was implemented to perform semantic image segmentation [46,47]. The greenery can be classified by different colors (e.g., green trees and bushes, brown trunks and branches, and yellow grass) by FCN-8s. Compared with the original image, the processed image was checked and adjusted by applying Photoshop to extract the area of all vegetation more accurately (Figure 3a). Then the GVI was calculated as the ratio of the number of greenery pixels to the total number of pixels per image [48]. To make the GVI more accurate, we averaged the proportions from four directions at each sampling point. The values of the GVI at each sampling point are shown in Table 1.
Second, the TVF expressing the coverage of vegetation canopy in three-dimensional space was calculated as the ratio of heat radiation from plant surface to radiation from the whole hemisphere [49]. A four-step workflow was needed for the estimation of the TVF. Firstly, upward fisheye images at sampling points which were derived as full-view panoramic images in a spherical projection were collected at a height of 1.5 m through a high-definition digital camera with a 180-degree fisheye lens. Secondly, the images were fed to a full-canopy radiation analysis system, WinSCANOPY, which is specifically developed to achieve pixel-wise semantic analysis of the shielding condition of vegetation to solar radiation. The system can segment the fisheye images into three parts, i.e., sky, tree, and building (Figure 3b). Then the information of relevant radiation datum was shown in it. Finally, the system can calculate the ratio of thermal radiation emitted by vegetation to thermal radiation in the whole hemisphere. The values of the TVF at each sampling point are also shown in Table 1.

2.2.2. Microclimatic Measurements

According to the Ta queried from the Meteorological Data for Built Environment Analysis in China [43], winter in China’s most cold regions, including Zhengzhou, could be defined as from December to February in meteorology. Since the period from the end of December to the end of Jan. is the coldest in Zhengzhou, 29 and 30 December 2019, two sunny days, were chosen to conduct trials. Several primary microclimatic parameters (i.e., air temperature (Ta), relative humidity (RH), global temperature (Tg), and wind speed (Va)) at 12 sampling points were continuously monitored from 8:00 to 18:00. During the measurement, meteorological data including Ta, Tg, RH, and Va were automatically recorded every minute by HOBO U23-001 and HD32.3. The metrological properties of measuring instruments conformed to the ISO standard 7726 (ISO 7726, 1998) (Table 2). For the sake of the focus on human thermal comfort, the instruments were deployed at a height of 1.5 m above the ground, the recommended height of probes used in several relevant studies [4,50,51]. The sensors monitoring Ta and RH were placed under the pavilion for the purpose of shielding them from solar radiation.

2.2.3. Questionnaire Surveys

To quantify residents’ OTC, questionnaire surveys in the field were conducted during microclimatic measurements, which had previously been implemented in OTC studies [9,52]. Each questionnaire mainly consisted of two parts. The first section of the questionnaire recorded demographic information (i.e., age and gender), clothing worn and activity style of each respondent, and the location and time of the investigation. The values of clothing insulation and metabolic rates can be calculated in accordance with ASHRAE 55 and ISO 7730 [53,54]. The second section included the question related to thermal comfort. The present study applied the ASHRAE 5-point scales to the thermal comfort vote (TCV) (0: comfortable; +1: slightly uncomfortable; +2: uncomfortable; +3: very uncomfortable; +4: extremely uncomfortable) [55], which has been applied in previous studies [56,57]. The respondents can mark their TCV at any point on the scale, which was recorded to one decimal place.
In order to ensure the objectivity of the trial, the respondents were selected randomly to experience the thermal environment and fill out the questionnaire under the guidance of the testers at each of the sampling points in order. There was only one respondent surveyed at any sampling point at the same time to avoid mutual influence. Furthermore, most of the respondents have not only lived in the residential community for more than one year but also adapted to the thermal environment of each sampling point for at least 20 min.

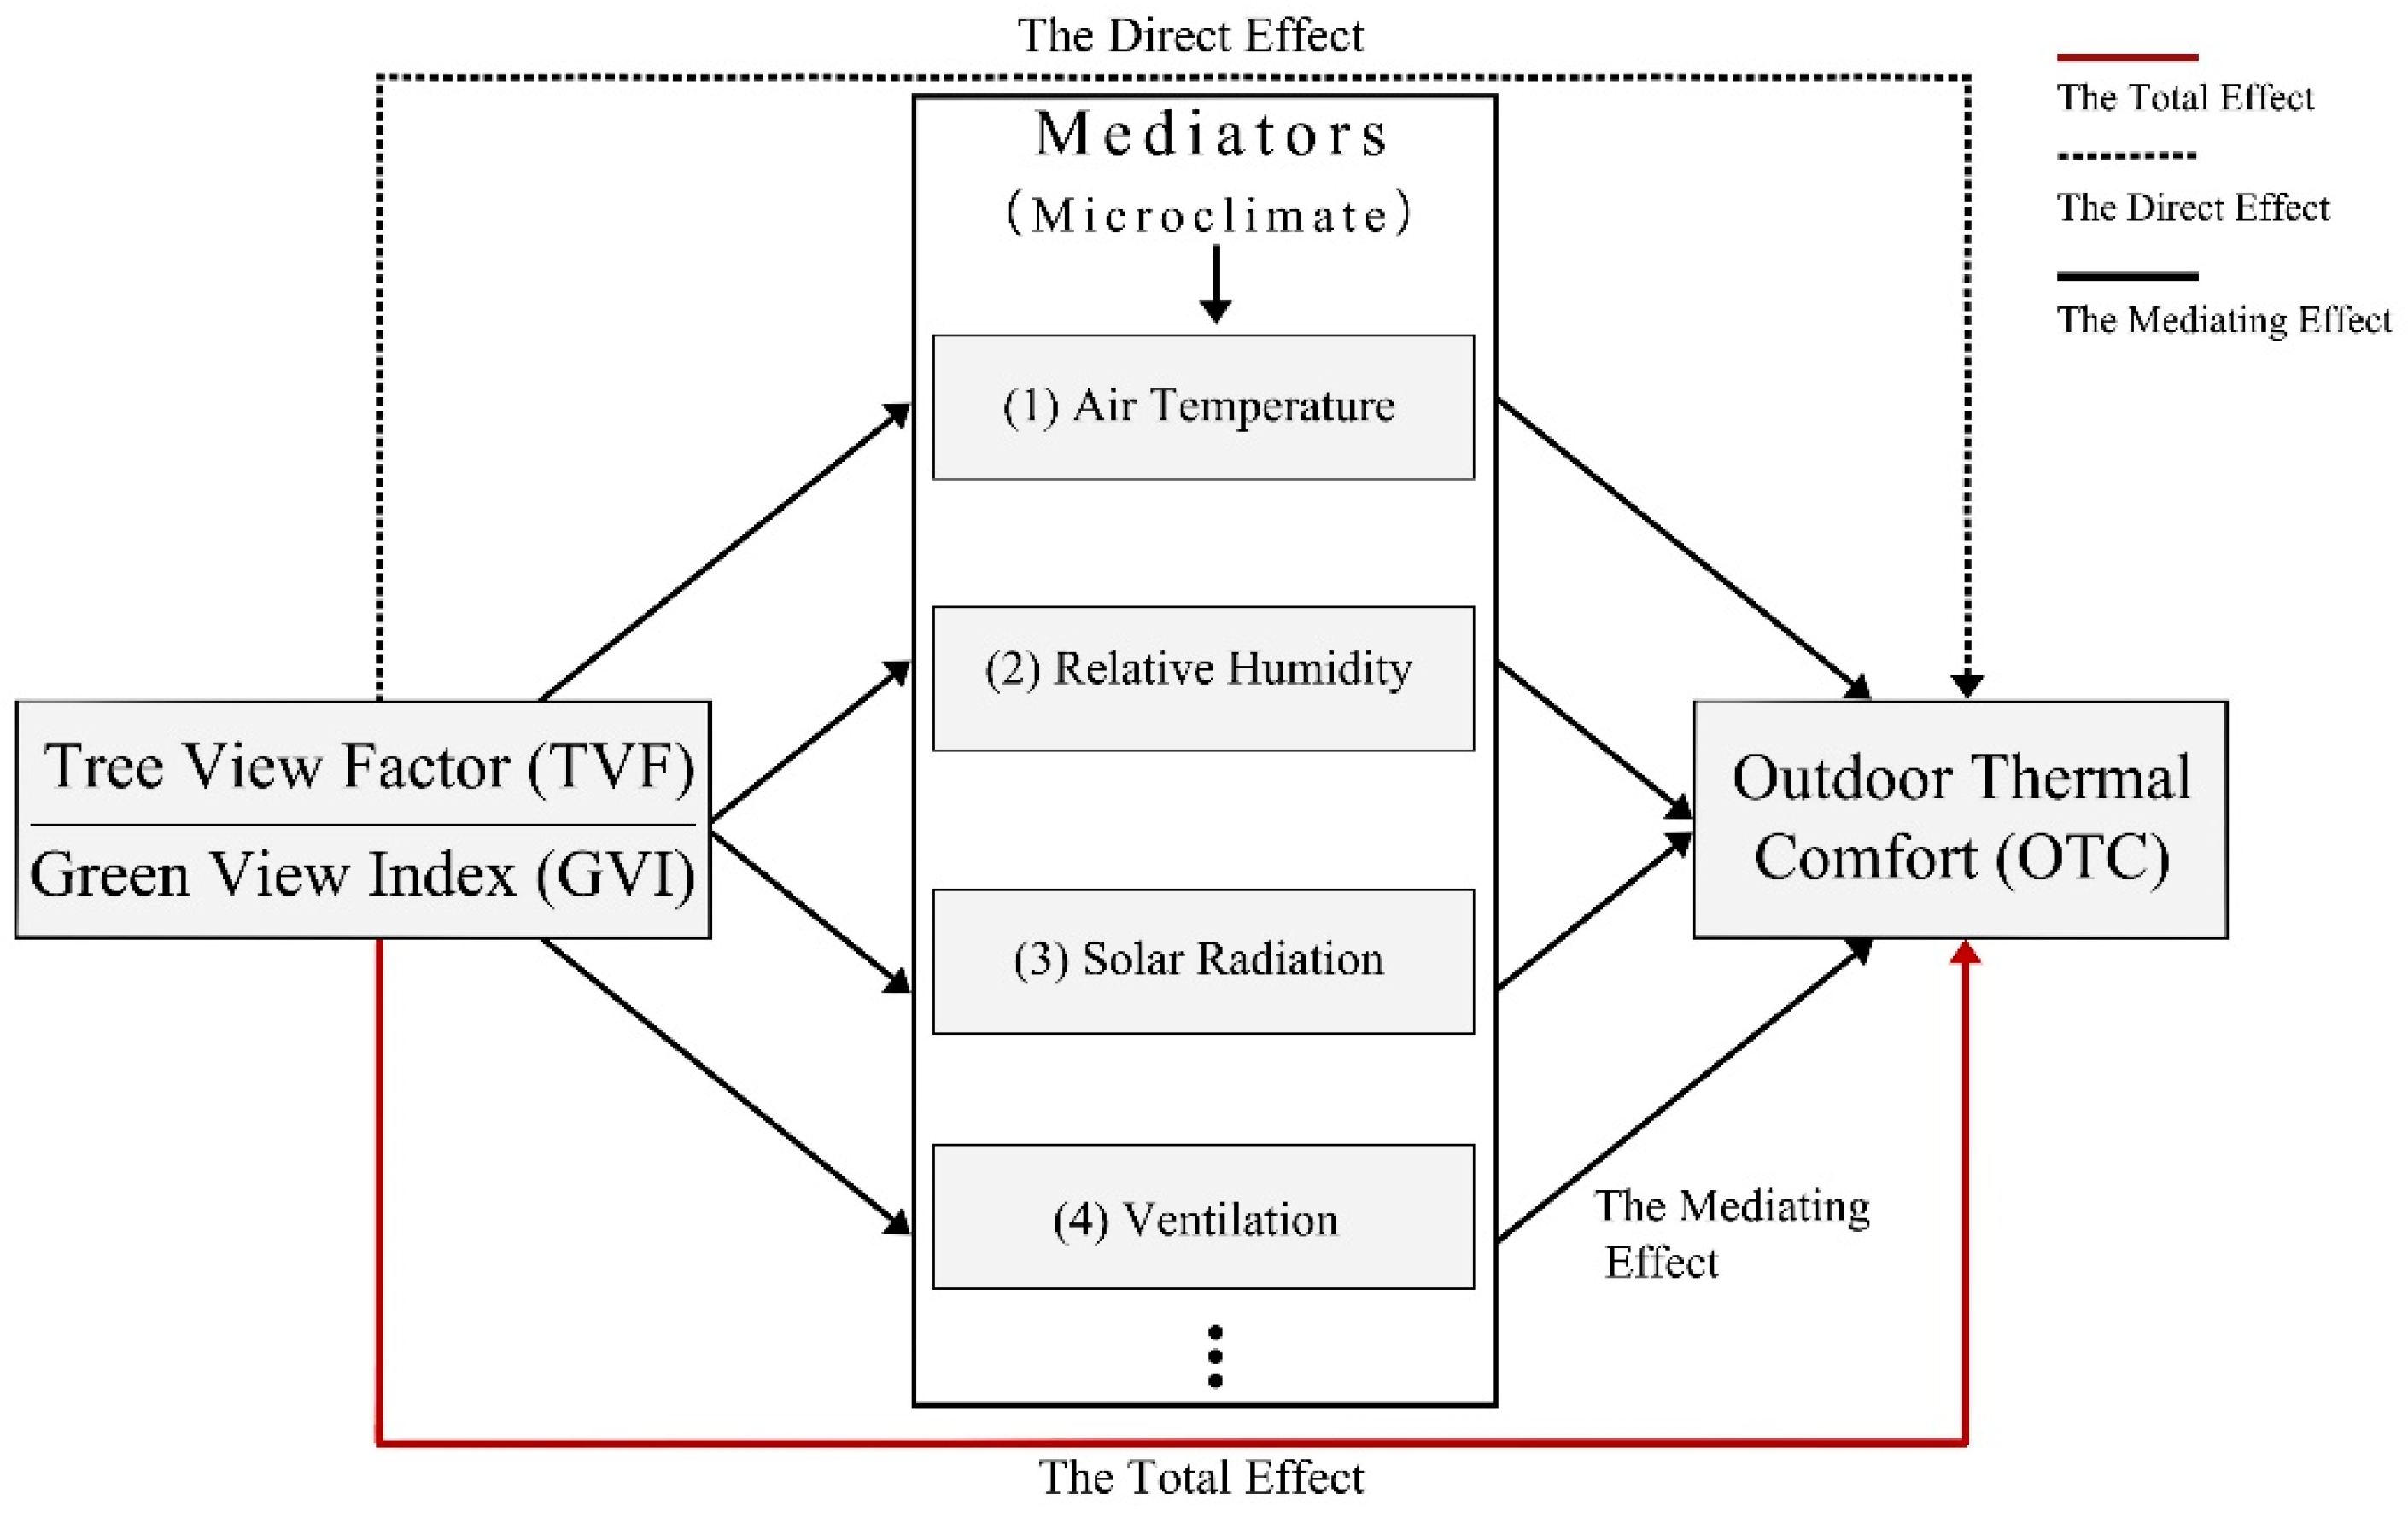
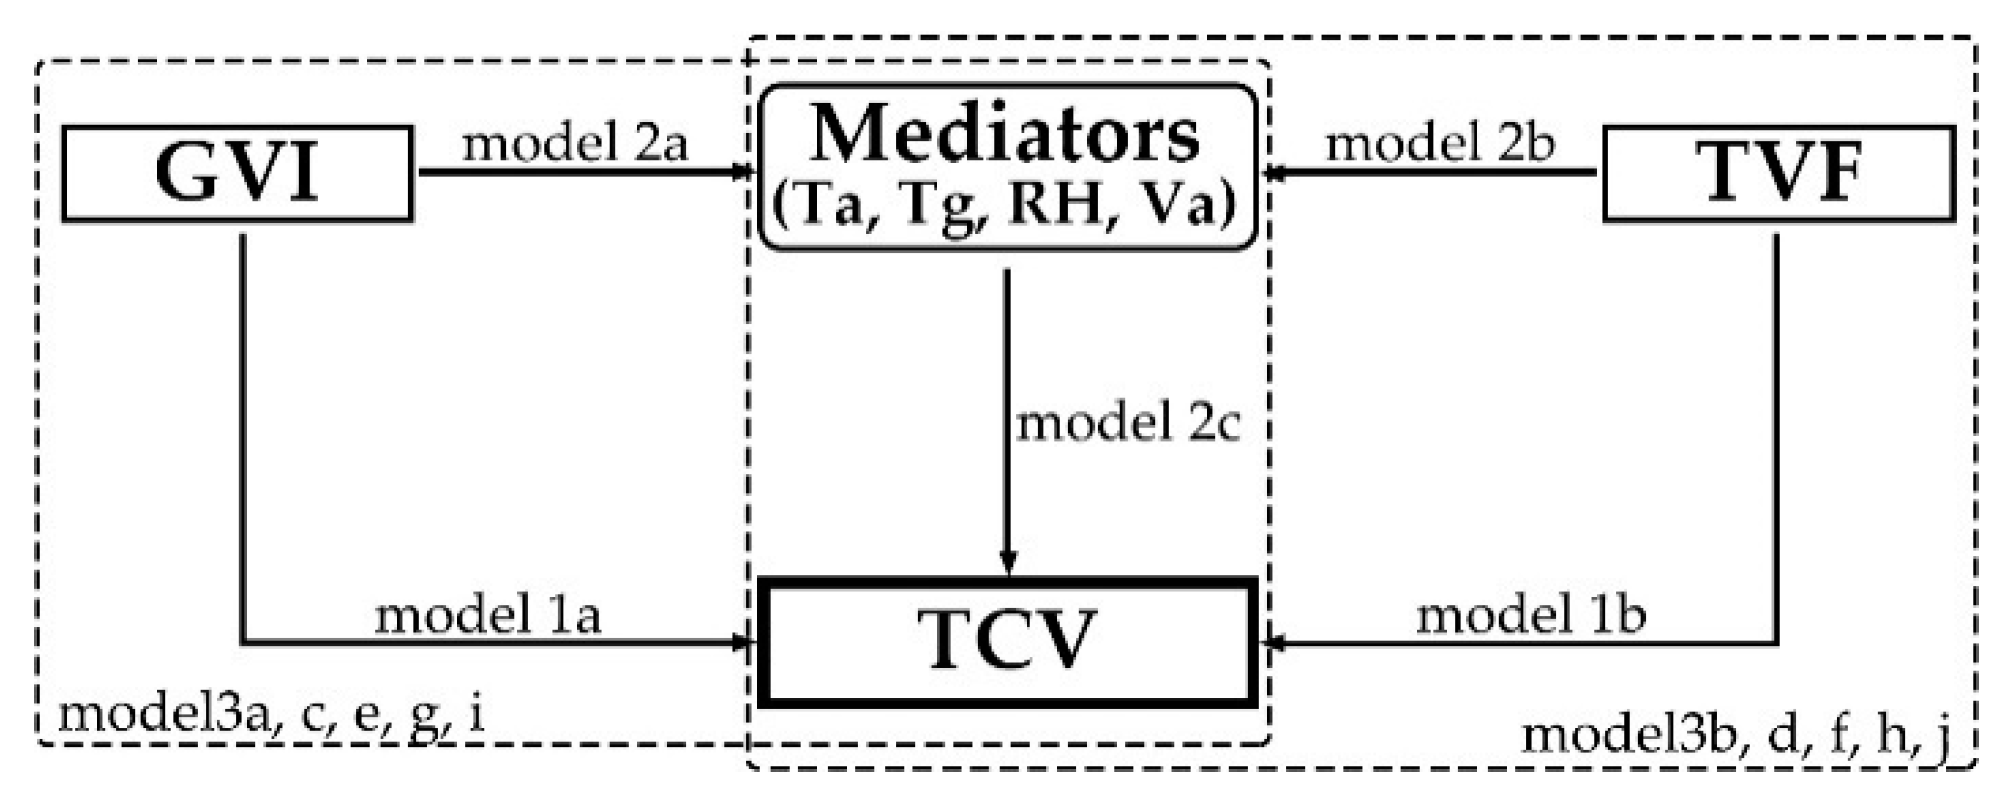
2.3. Mediation Analysis

To explore the mediating effect of the microclimate on the relationship between greenery and OTC, a comprehensive multi-step mediation analysis was introduced into this study, which can explore whether the impact of greenery on OTC could be partially or fully explained by the potential mediators-microclimatic parameters (i.e., Ta, Tg, RH, and Va) [58]. During the mediation analysis, not only should the significance of the association between the predictor variable (GVI and TVF) and the outcome variable (TCV) be further validated, but the significance of the influences of the predictor on the mediator (microclimate) and the mediator on the outcome should be confirmed [58]. Only when the relationships above are all significant is the mediation analysis meaningful. The total effect of greenery on OTC would be decomposed into a direct and an indirect (mediation) component through mediation analysis. The classical mediating effect model is shown in Figure 4.
The mediation analysis is useful in helping us gain insight into the regulation pathways from exposure to the outcome [59]. Therefore, it is an important statistical tool universally applied in various research fields to reveal the mediating effect in the regulation, including the field of the built environment [60]. Wang et al. applied mediation analysis to explore the impact of greenery on people’s mental well-being, which was mediated by physical activity, stress, air quality, noise, and social cohesion [61]. He et al. investigated the mechanism of how greenery mitigated the negative impact of a high-density environment on elders’ satisfaction, viewing loneliness, sense of community, physical activity, and walk score as the mediators [62]. In these studies, multi-step mediation analysis was performed to assess the regulation pathways between greenery and people’s feeling. The regression model was adopted to examine the linkage between variables.
A five-step workflow was carried out to test for the mediating effect in this study. The models in mediation analysis are shown in Figure 5 and the workflow in Figure 6. Firstly, the direct association between greening indices and TCV was validated by conducting the regression models. With the TCV as the continuous variable, Model 1a included the GVI and TCV, while Model 1b included the TVF and TCV. Secondly, we regressed each mediator on the GVI in Model 2a, on the TVF in Model 2b, and on the TCV in Model 2c separately so as to examine the correlation between mediators and other variables. Thirdly, the coefficients of regression models were calculated to quantify the relationships between potential mediators (i.e., microclimatic parameters) and independent variables (i.e., GVI and TVF), and that between mediators and dependent variables (i.e., TCV). In order to select potential mediators, the value of the significance of these models needs to be checked. Subsequently, the multivariate mediation analysis, as shown in Model 3, was performed. As they contain a single significant mediator once and all mediators simultaneously, the relationships between the GVI and TCV were assessed in Models 3a, c, e, g, and i. Models 3b, d, f, h, and j determined associations between TVF and TCV with the mediators separately and together. The significance of the mediating effect was assessed by the Sobel test; a greater absolute value of z, an indicator of the Sobel test, than 1.96 refers to a significant mediating effect [59,63]. Finally, through calculating the proportion of the direct, mediating, and total effects, the impact pathways of the GVI and TVF on OTC appeared.

3. Results

3.1. Descriptive Analysis

3.1.1. Study Population

A total of 1454 volunteers took part in this study and submitted 1443 valid questionnaires. The features of the study population are summarized in Table 3. From the perspective of sample attributes, there were more male than female subjects. During the trials, the most dominant activity type of respondents in the past 20 min prior to the survey was walking, followed by standing, sitting, and exercising, in turn. Based on the clothing filled out in the questionnaire, the average clothing insulation was calculated. The mean value of the clothing insulation is 1.40 Clo, which was quite high. The difference in participants’ clothing insulation (standard deviation (SD) ± 0.19) was relatively small.

3.1.2. Meteorological Parameters

Ta, RH, Tg, and Va on the measuring sites, the changes of which are shown in Figure 7, were worked out. The overall status of meteorological parameters is listed in Table 3. The ranges of Ta and RH were 1.6–19.4 °C and 21.3–100.6% during the trials, respectively. On average, Ta was 7.88 °C, with an SD of ± 4.81, while RH was 43.44%, with an SD of ±17.59%. Ta rose from 8:00 to 14:00 and then dropped continuously until 18:00, the end of the trial. Due to the period of the trial from 8:00 to 18:00 during the daytime, Ta was above 0 °C, while Ta was below freezing during the night. The change of RH was definitely inverse to Ta each day. RH first decreased and then increased over time, with the daily minimum at around 14:00. The values of Ta and RH on 30 December 2019 were obviously lower than those on another day.
The variation of Tg showed a consistent trend with Ta, with the range of 0.4–24.2 °C. The average value of Tg was 9.02 °C (SD ± 5.79) and the maximum occurred at 12:00. The mean wind speed seemed to remain at a high level of 1.23 m/s, with an SD of ±1.24m/s, during trials. However, the wind was mild on 29 December, with a mean speed of 0.50 m/s, while the wind was strong constantly on 30 December, with a higher mean speed of 1.90 m/s. The higher wind speed resulted in the lower air temperature and relative humidity on 30 December.

3.1.3. Thermal Comfort Vote

Figure 8 depicts the frequency distributions of respondents’ TCVs, which is rounded up to the nearest whole number, for each day and all days. The TCV with the highest frequency was slightly uncomfortable (+1)”, with 64.28% on 29 December, 38.47% on 30 December, and 51.30% in total. The TCV with the second-largest number on 29 December was comfortable (26.76%), with relatively few votes for other options. The higher Va and lower Ta caused less comfortable votes on 30 December than those on 29 December. The frequencies of uncomfortable, very uncomfortable, and extremely uncomfortable votes on 30 December were 20.60%, 23.06%, and 15.42%, respectively, which indicated the majority of respondents (59.08%) found the outdoor thermal environment uncomfortable.

3.1.4. Greening Indices

As is shown in Table 3, these sample points had a mean GVI of 38.55% (SD ± 15.24) and a mean TVF of 25.50% (SD ± 26.84). The ranges of the GVI and TVF were 22.5–76.1% and 2.1–81.9%, respectively. The ranges and the SDs of the GVI and TVF both depicted the wide variance of greenery at different sample points. The maximum GVI occurred at the sixth sample point, while the minimum existed at the second sample point. When the plot was covered by trees, the value of TVF was larger and commonly more than 40%. The GVI was higher at the plot where the surrounding plants were abundant.

3.2. Correlations between Greenery and TCV

In order to discuss the total impacts of greenery on TCV, the unary regression models were created (Models 1a and 1b). The results are shown in Figure 9. With a Sig. value of 0.000 in Models 1a and 1b, both greenery measures (i.e., the GVI and TVF) had significant associations with TCV. The standardization coefficients of Models 1a and 1b are −0.286 and −0.331 respectively. Independent of the ways in which greenery is exposed, we consistently observe that greenery is negatively associated with TCV (i.e., the more greenery, the less TCV, which means a more comfortable thermal environment).

3.3. Correlations between Microclimate and Greenery/TCV

In the second step, regression analyses were performed to test the significance of the influence of greenery on microclimate, and microclimate on TCV. The results are revealed in Figure 9. In addition to being significantly negatively correlated with Va (p < 0.001), greenery had a significant positive correlation with the other three microclimatic parameters (i.e., Ta, Tg, and RH) (p < 0.001). As shown by coefficients in Models 2a and 2b, compared with TVF, the improvement of the GVI can result in a greater increase of Ta (Coef. = 9.464) and Tg (Coef. = 11.037). The covering of plants represented by TVF was able to enhance relative humidity in outdoor spaces more effectively (Coef. = 31.563). Moreover, it was observed that the negative correlations between both of these two greening indices and Va were similar.
From Model 2c, we can conclude that Ta, Tg, RH, and Va made a significant influence on TCV (p < 0.001) which means that the four microclimatic parameters can involve in the impact of greenery on OTC as mediators together. To be specific, according to the impact on TCV reflected by the coefficients in Model 2c, the microclimatic parameters were in order as follows: Va, Ta, Tg, and RH. Thereinto, the increase of Ta, Tg, and RH led to the reduction of TCV, which means a more comfortable thermal environment. On the contrary, the stronger wind took away more heat, thereby bringing about a more uncomfortable thermal perception.

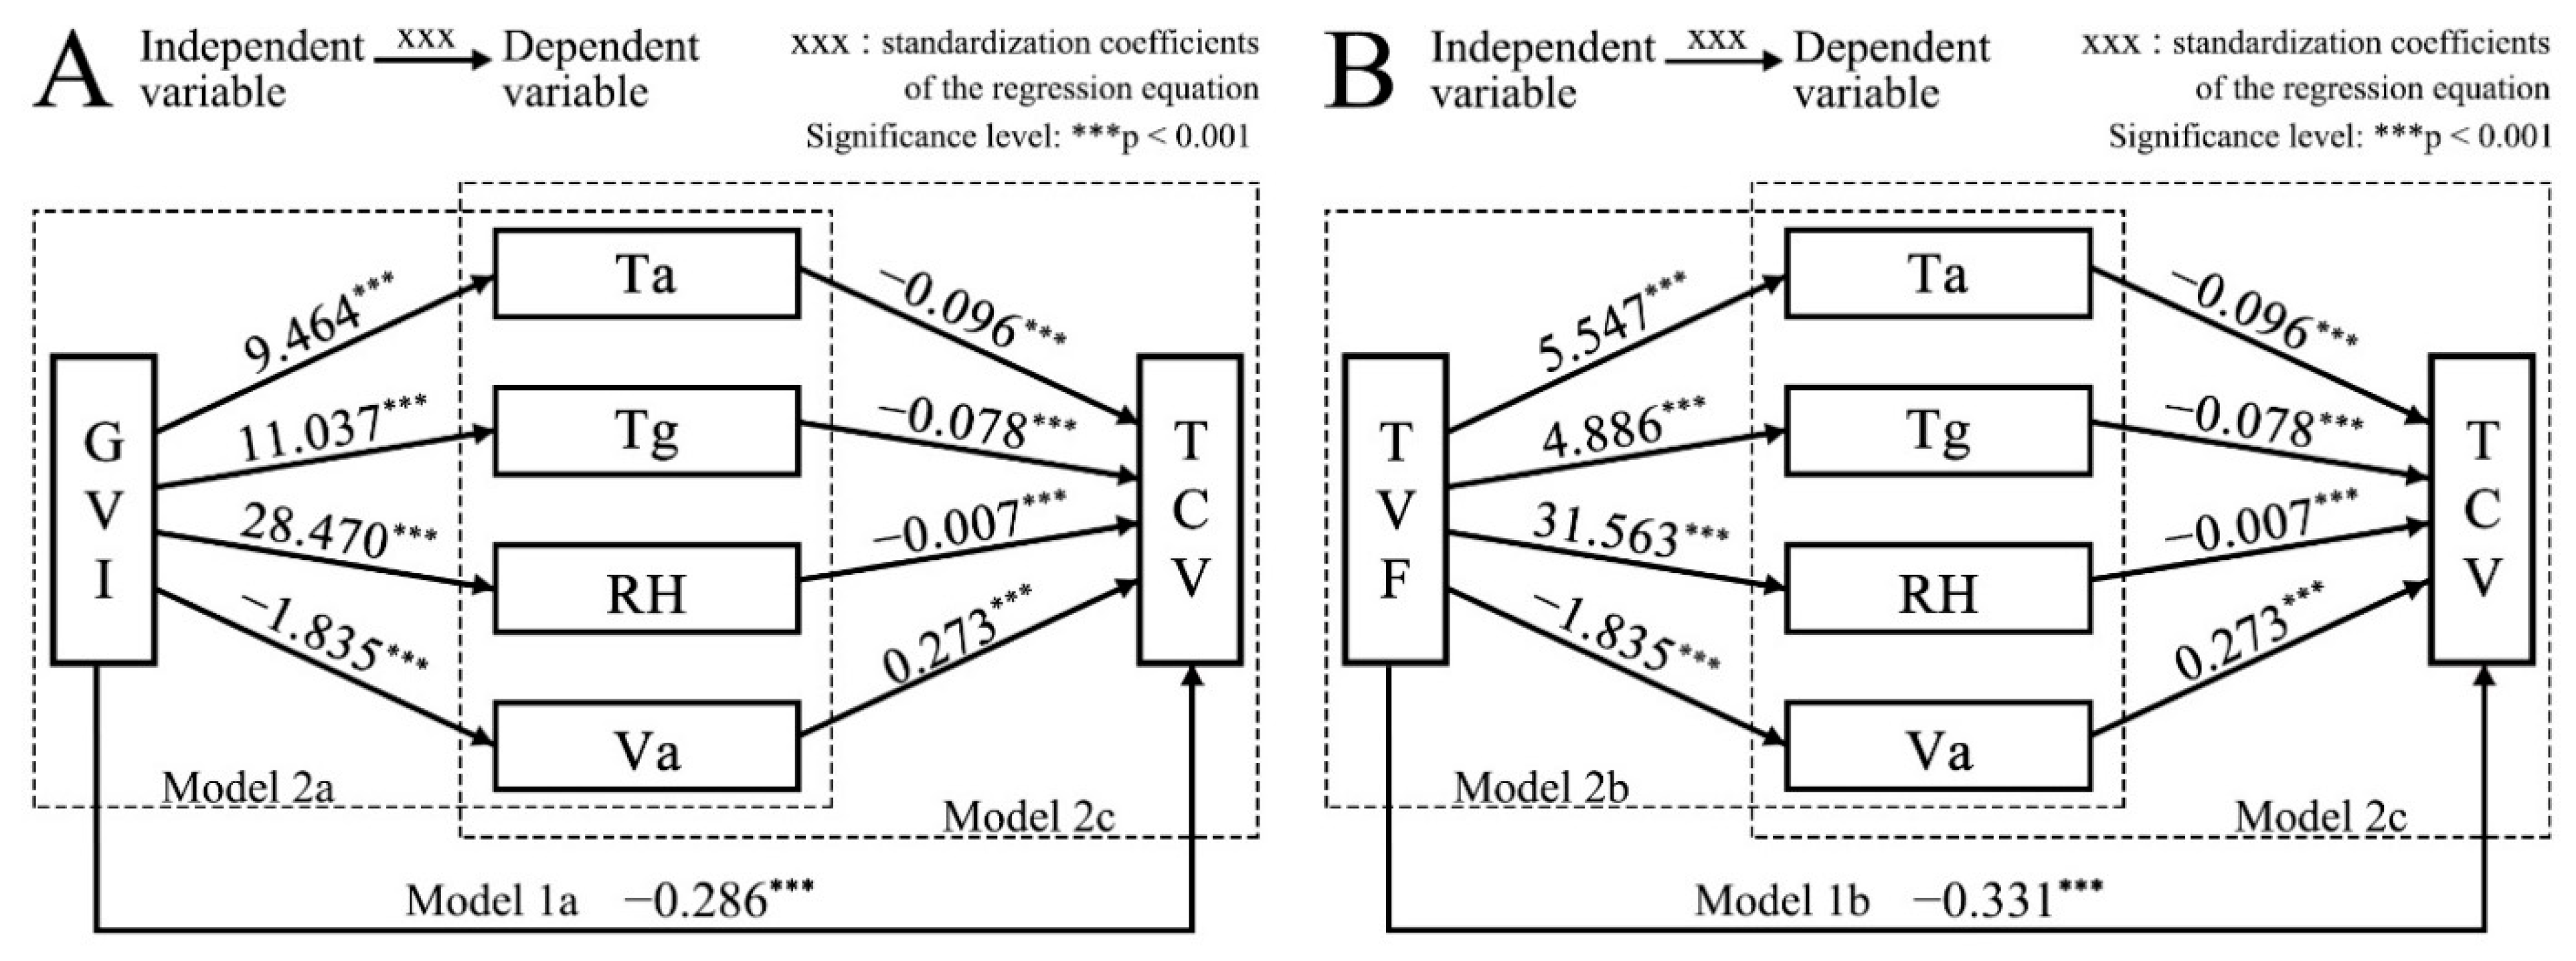
3.4. Correlations between Greenery, Microclimate, and TCV

Table 4 summarizes the results concerning whether the greenery–TCV associations were mediated by the microclimate. Even though these significant mediators in Figure 9 were simultaneously taken into consideration, the GVI and TVF remained significantly and negatively related to TCV. As shown in Models 3a and 3b, there seems to be significant partial mediation of Ta on GVI and TVF-TCV correlations as indicated by the Sobel test (ZGVI = −10.865, p < 0.001; ZTVF = −11.084, p < 0.001). Moreover, the Sobel test for the mediation of Tg on the same relationship was also significant (ZGVI = −10.487, p < 0.001; ZTVF = −8.318, p < 0.001) (Models 3c and 3d). Similar to that of Ta and Tg, the mediation of RH was also significant, though with a relatively smaller coefficient (ZGVI = −3.689, p < 0.001; ZTVF = −2.390, p < 0.01) (Models 3e and 3f). Respondents’ TCVs rose with increasing Va, which was a partial mediator for both the GVI and TVF (ZGVI = −7.756, p < 0.001; ZTVF = −10.819, p < 0.001) (Models 3g and 3h).
Considering that the significant mediators in combination may alter our findings, two multiple mediation models (Models 3i and 3j) were created. To avoid interactions between the mediators, a multicollinearity analysis was carried out, the result of which depicted that there was a covariance between Ta and Tg (VIF > 10). Due to the larger coefficient (−0.091 in Model 3a and −0.089 in Model 3b) than Tg (−0.073 in Model 3c and −0.072 in Model 3d) in the single mediation models, Ta was selected as a mediator in the multiple mediation models along with RH and Va. The GVI remained significantly and negatively related to TCV. There were significant partial mediations of Ta, RH, and Va on GVI–TCV correlations (ZGVI = −4.978, −4.787, and −10.502, p < 0.001). The consequence that the relation between TVF and TCV was no longer significant illustrates that a complete mediating effect occurred in the TVF–TCV correlation. Ta and RH were negatively correlated with people’s TCV and significant mediators (ZTVF = −5.564 and −4.875, p < 0.001). Va was a significant positive mediator for TVF-TCV correlation (ZTVF = −10.730, p < 0.001).
The direct, indirect, and total effects of mediators are summarized in Table 5. For the GVI, the proportion of the mediation of Ta was the largest (59.79%), close to Tg (56.12%), and that of RH was the smallest (9.00%). Between them, the proportion of Va was 31.3%. For the TVF, Ta accounted for the largest proportion (51.58%), and RH for the smallest (8.51%). The proportions of the mediation of Tg (36.84%) and Va (43.94%) were well balanced. In the process of impact of greenery on TCV (Figure 10), the proportion of the mediating effect of the mediators combined was 81.00% for the GVI. Pronounced increment in that for the TVF (89.02%) was observable. Across both greenery measures, Ta both played a dominant role in mediating effects. The mediating effects of RH and Va were similar.

4. Discussion

4.1. Main Findings

Our finding that more greenery correlates negatively with TCV means that exposure to more greenery seems to be beneficial for people’s OTC experience. This finding is consistent with previous findings reported elsewhere [4,50,51,64]. However, greenery represented by the GVI and TVF in different dimensions may have an influence on OTC in different ways [19,30,35,49]. A comparison between the GVI and TVF in multiple mediation models above was conducted. The result shows that when many kinds of mediators, microclimatic parameters, are intervened in the evaluation system, there are striking differences in relations between of two greening indices and TCV. To shed light on the reason, descriptive analysis is performed in the following two aspects.
Respondents’ OTC is related to the microclimate [65] of the space where they are and the psychological status [34] which can be affected by green biomass in sight. Although the phenomenon that the influence of greenery on OTC can be decomposed into physiology and psychology has been observed before [19], the quantitative analysis of influence pathways is weak. In addition, we are aware that only a few studies examine the impact of the GVI on mental health [44,47,66], and few are about the association between the GVI and OTC. Our finding that both the GVI and TVF support OTC is novel. There are some differences in greenery characterized by the GVI and TVF. The GVI is good for quantifying the low shrub and foliage of the surrounding plants in sight with a lack of describing plant canopy above the space. In contrast, the TVF can help us accurately capture the feature of the upper plant coverage. In terms of microclimate, we consistently observe that the GVI is more closely related to Ta and Tg in Model 2a, b. This is mainly because low shrubs and leaves of trees can shield from relatively low-level solar radiation, which lasts longer during winter. Moreover, the huge tree canopy which blocks airflow and possesses stronger transpiration can create an environment with low wind speed and high humidity. In this case, the associations of the TVF with Va and RH are found to be strong, as previously reported [49]. The result shows that the upper canopy represented by the TVF regulates OTC mainly through ventilation and humidity, while the lower-level greenery is mainly through solar radiation during winter.
The assessment of the environment by individuals can be defined as their preference for the environment, which is based on the reaction to environmental stimulation [67]. Due to frequent interaction between individuals and the environment, their heart rate and sympathetic nerve activity are both at a high level during the whole evaluation process [68]. When filling out questionnaires about the thermal comfort of sampling points, respondents were most likely affected by psychological comfort, besides the surrounding thermal environment, caused by greenery in sight. From a psychophysical point of view, the GVI can be applied not only to reflect the quality of urban greenery but also to measure the psychological perception of occupants of greenery quality. A previous study observed that the increase of the GVI and the percentage of greenery in the visual area brings out better psychological status [69]. The results of the multiple mediation models show that the mediating effect accounts for 81.00% and 89.02%, respectively, in the regulation system of the GVI/TVF to OTC. When the greenery measured by TVF exerts an influence on OTC, the mediating effect of microclimate is more significant. This phenomenon suggests that the impact of the upper canopy on OTC is mainly realized through microclimate as a mediator. Compared with the TVF, the result is that the proportion of direct effect is higher in the mediation model of the GVI and TCV, which indicates that the impact of low shrubs and leaves of plants in sight, described by the GVI, on OTC relies on their own characteristics to a much greater extent. The possible reason is that the direct relationship between the GVI and OTC is established through visual and psychological perception. To be more precise, when seeing low shrubs and leaves of plants, which can be captured by sight generally, the respondents psychologically felt that the microclimate was more comfortable and then gave lower TCV which means better thermal comfort.

4.2. Optimization Strategies

In light of the analyses above, greenery construction should be integrated with physical and mental health to measure the impact of greenery on OTC and capture the spatial characteristics of greenery accurately. The managers and designers should consider the composition, configuration, and species of vegetation comprehensively based on the location and the surrounding environment.
Due to the rapid urbanization in China and global warming, people feel more uncomfortable in hot climatic conditions during summer. Greenery seems to play a more significant role in the improvement of OTC in summer. Therefore, the meteorological characteristics both in summer and winter need to be taken into account when it comes to landscape design and construction. The change in the GVI and TVF can influence OTC through different pathways in summer and winter.
As far as the GVI is concerned, the appropriate increase in plant density of low trees, bushes, and grass in the right place can enlarge the area of greenery in sight. The abundant plant communities in the lower green spaces can result in a more psychologically comfortable thermal experience both in summer and winter. When it is difficult to plant trees and bushes in confined spaces, such as the spaces beside a building or on a narrow road, vertical greenery and ecological green ponds can also be appropriately arranged on the surface of the building to improve the GVI. Furthermore, the vegetation around outdoor activity spots, represented by the GVI, can make an impact on the ventilation of spaces. In order to enhance the ventilation of these spots in summer, the plant density and the height of vegetation facing to summer prevailing wind should be reduced. In addition, tree arrangements along the summer prevailing wind promote the formation of wind corridors, thus increasing Va and improving OTC in summer. However, it is necessary to plant more low trees and bushes in the place facing to winter prevailing wind, so as to protect the people outside from strong and cold wind in winter.
In view of the characteristic that the TVF can best show the covering capacity of the plant canopy, trees with large canopies should be adopted to block intense solar radiation and then make spaces cooler in hot summer. Meanwhile, tall trunks and foliage with appropriate density promote ventilation under the canopy so that the heat will be carried away faster. By these means, trees with tall trunks, large canopies, and appropriate LAI can take advantage of the mediating effect of solar radiation and wind to optimize the microclimate and promote OTC effectively in summer.
As a whole, in terms of species configuration in green space, trees with tall trunks, large canopies, and appropriate LAI should be deployed in the upper layer, while low trees and bushes in the lower layer should avoid being arranged in the direction of the summer prevailing wind. This configuration which results in the rational rise of the GVI, and the TVF will not merely provide occupants with excellent landscape visual effects, but also promote their thermal comfort during outdoor activities in hot summer. Moreover, relevant departments should formulate and conduct some specific policies and measures to encourage and support abundant and various greenery constructions in the urban area.

4.3. Strengths and Limitations

Our study has multiple strengths and limitations. Compared with existing studies that focus on the pairwise correlations among greenery, microclimate, and OTC [9,64,70], it is the OTC-based study that conducted a mediation analysis to merely find out the potential effect of microclimate on the association between greenery and OTC in winter quantitatively. Neither the TVF nor GVI is affected by occupants’ subjective perception [71], though it comes up with some questions about urban greenery use [70,72]. The previous relevant studies tend to utilize the TVF to quantify the association between greenery and microclimate/OTC [49,64,70]. To probe the impact of greenery on OTC in winter from different dimensions, this study applied both the TVF and GVI to characterize the greening features in vertical and horizontal directions.
A limitation of this study is that the results of our questionnaire are not comprehensive. Firstly, this study concentrates on OTC in cold climatic conditions during winter. With global warming, high temperatures make people more uncomfortable, sick, or even dead in outdoor spaces in summer. Additionally, deciduous trees, on which there are few leaves, seem to play a minor role in the impact of perceptions of greenery on OTC in winter. Vegetation can improve OTC more effectively through visual stimulation in the summer and shoulder seasons. It would be more valuable to further investigate the process of the influence of greenery on OTC by assessing the mediating effect of microclimate on the relationship between greenery and OTC in the other two typical seasons (i.e., summer and shoulder season). Secondly, the age distribution of the persons under investigation is not even enough, though it is likely that nearly all of the residents of all ages are included. Among all the respondents, younger occupants (under 45) account for almost half. Expanding the scope of the respondents and extending the duration of the survey could help to promote the objectivity and accuracy of research conclusions. Thirdly, this study merely selects residents in a rapidly urbanizing metropolis in China’s cold region as the objects. Further verification in other areas is still required before transferring and generalizing the results. Thus, future studies are also needed to consummate our findings.

5. Conclusions

This study examined whether microclimate (i.e., air temperature, relative humidity, solar radiation, and ventilation), as the mediators, conduct and affect the regulation process of greenery to OTC in China’s cold region during winter. This study is unique in that it quantified the underlying impact mechanisms of greenery, which were estimated from two dimensions, the horizontal sight (GVI) and vertical upper covering (TVF), on OTC. Conclusions are finally drawn as below:
(1) The OTC is affected by greenery from different dimensions (i.e., vegetation in the horizontal view and trees in the vertical upper layer). The regression results coherently indicate that exposure to abundant greenery, independent of the dimension, is related to gains in the comfortable outdoor thermal experience.
(2) According to the mediation analyses, there were striking differences in the regulation pathways underlying the impact of greenery exposure on OTC between these two dimensions of greenery. The influence of the cover of plants represented by TVF on OTC was mainly conducted through the outdoor microclimate. Ta, RH, and Va completely mediated the relation between TVF and OTC. Nevertheless, vegetation in sight revealed by the GVI can regulate OTC directly by affecting people’s mental feelings or other factors. Ta, RH, and Va served as partial mediators of the OTC regulation of GVI. The proportion of the mediation was substantial, namely 81.00% for the GVI and 89.02% for the TVF.
(3) Although the greenery represented by both the GVI and TVF can exert an influence on OTC, the emphases of the effects are not absolutely the same. The section manifested by GVI contributes to the occupant’s mental comfort, while the TVF is closely related to objective meteorological conditions. On these bases, the GVI is propitious to the study of residents’ mental health and landscape preference, whereas the TVF is suitable for studies on microclimate adaptation.
Taken together, the findings in the study provide evidence that the GVI and TVF, which signify different aspects of greenery, have different operating mechanisms on OTC. The microclimate completely mediated the TVF–OTC correlation but partially mediated that between the GVI and OTC. Landscape designers and planners are advised to conduct outdoor greenery interventions and to enrich vegetation at different layers, as they may create a comfortable thermal environment by manipulating the mediators. Further related studies are urged to replicate this method to identify the diverse features of the impact of greenery on OTC in different types of spaces, seasons, and the population.

Author Contributions

Conceptualization, K.W., X.F. and S.X.; methodology, X.F. and Y.M.; software, Y.M.; validation, S.Y. and X.F.; formal analysis, K.W. and Y.M.; investigation, S.X. and S.Y.; resources, S.X.; data curation, K.W. and X.F.; writing—original draft preparation, K.W. and X.F.; writing—review and editing, K.W., X.F. and S.X.; visualization, K.W. and Y.M.; supervision, S.X.; project administration, S.X.; funding acquisition, K.W., S.Y. and S.X. All authors have read and agreed to the published version of the manuscript.

Funding

This research was funded by the National Natural Science Foundation of China (No. 51808503), the General Research Project of Humanities and Social Science of the Ministry of Education (No. 20YJCZH154), the Key R&D and Promotion Projects in Henan (No. 222102320187), Guangdong Basic and Applied Basic Research Foundation (No. 2019A1515110577), and Fellowship of China Postdoctoral Science Foundation (No. 2020M672633). This research was also funded by the China Scholarship Council for supporting the visiting scholar of Kun Wang (File No. 202008410331).

Data Availability Statement

The data presented in this study are available on request from the first author.

Acknowledgments

We thank the anonymous reviewers for their valuable comments on an earlier draft of this paper.

Conflicts of Interest

The authors declare no conflict of interest.

Nomenclature

OTC: Outdoor thermal comfortTmrt: Mean radiant temperature
TCV: Thermal comfort voteG: Global radiation
GVI: Green view indexFCN: Fully convolutional neural network
TVF: Tree view factor
LAI: Leaf area indexSD: Standard deviation
Ta: Air temperatureSE: Standard error
Tg: Global temperatureCoef.: Coefficient
RH: Relative humiditySig.: Significance
Va: Wind speedVIF: Variance inflation factor

References

  1. Bélanger, M.; Gallant, F.; Doré, I.; O’Loughlin, J.L.; Sylvestre, M.-P.; Abi Nader, P.; Larouche, R.; Gunnell, K.; Sabiston, C.M. Physical Activity Mediates the Relationship between Outdoor Time and Mental Health. Prev. Med. Rep. 2019, 16, 101006. [Google Scholar] [CrossRef] [PubMed]
  2. Byrka, K.; Ryczko, N. Positive Effects of Dancing in Natural versus Indoor Settings: The Mediating Role of Engagement in Physical Activity. J. Environ. Psychol. 2018, 57, 25–33. [Google Scholar] [CrossRef]
  3. Jackson, S.B.; Stevenson, K.T.; Larson, L.R.; Peterson, M.N.; Seekamp, E. Outdoor Activity Participation Improves Adolescents’ Mental Health and Well-Being during the COVID-19 Pandemic. Int. J. Environ. Res. Public Health 2021, 18, 2506. [Google Scholar] [CrossRef] [PubMed]
  4. Li, K.; Zhang, Y.; Zhao, L. Outdoor Thermal Comfort and Activities in the Urban Residential Community in a Humid Subtropical Area of China. Energy Build. 2016, 133, 498–511. [Google Scholar] [CrossRef]
  5. Chen, L.; Wen, Y.; Zhang, L.; Xiang, W.-N. Studies of Thermal Comfort and Space Use in an Urban Park Square in Cool and Cold Seasons in Shanghai. Build. Environ. 2015, 94, 644–653. [Google Scholar] [CrossRef]
  6. Cheng, X.; Su, H. Effects of Climatic Temperature Stress on Cardiovascular Diseases. Eur. J. Intern. Med. 2010, 21, 164–167. [Google Scholar] [CrossRef]
  7. Ikäheimo, T.M. Cardiovascular Diseases, Cold Exposure and Exercise. Temperature 2018, 5, 123–146. [Google Scholar] [CrossRef] [PubMed]
  8. Medina-Ramón, M.; Schwartz, J. Temperature, Temperature Extremes, and Mortality: A Study of Acclimatisation and Effect Modification in 50 US Cities. Occup. Environ. Med. 2007, 64, 827–833. [Google Scholar] [CrossRef]
  9. An, L.; Hong, B.; Cui, X.; Geng, Y.; Ma, X. Outdoor Thermal Comfort during Winter in China’s Cold Regions: A Comparative Study. Sci. Total Environ. 2021, 768, 144464. [Google Scholar] [CrossRef]
  10. Huang, J.; Zhou, C.; Zhuo, Y.; Xu, L.; Jiang, Y. Outdoor Thermal Environments and Activities in Open Space: An Experiment Study in Humid Subtropical Climates. Build. Environ. 2016, 103, 238–249. [Google Scholar] [CrossRef] [Green Version]
  11. Huang, Z.; Cheng, B.; Gou, Z.; Zhang, F. Outdoor Thermal Comfort and Adaptive Behaviors in a University Campus in China’s Hot Summer-Cold Winter Climate Region. Build. Environ. 2019, 165, 106414. [Google Scholar] [CrossRef]
  12. Lam, C.K.C.; Gao, Y.; Yang, H.; Chen, T.; Zhang, Y.; Ou, C.; Hang, J. Interactive Effect between Long-Term and Short-Term Thermal History on Outdoor Thermal Comfort: Comparison between Guangzhou, Zhuhai and Melbourne. Sci. Total Environ. 2021, 760, 144141. [Google Scholar] [CrossRef] [PubMed]
  13. Xu, M.; Hong, B.; Mi, J.; Yan, S. Outdoor Thermal Comfort in an Urban Park during Winter in Cold Regions of China. Sustain. Cities Soc. 2018, 43, 208–220. [Google Scholar] [CrossRef]
  14. Zhang, L.; Zhan, Q.; Lan, Y. Effects of the Tree Distribution and Species on Outdoor Environment Conditions in a Hot Summer and Cold Winter Zone: A Case Study in Wuhan Residential Quarters. Build. Environ. 2018, 130, 27–39. [Google Scholar] [CrossRef]
  15. Perini, K.; Chokhachian, A.; Auer, T. Chapter 3.3—Green Streets to Enhance Outdoor Comfort. In Nature Based Strategies for Urban and Building Sustainability; Pérez, G., Perini, K., Eds.; Butterworth-Heinemann: Oxford, UK, 2018; pp. 119–129. [Google Scholar]
  16. Sun, C.; Lian, W.; Liu, L.; Dong, Q.; Han, Y. The Impact of Street Geometry on Outdoor Thermal Comfort within Three Different Urban Forms in Severe Cold Region of China. Build. Environ. 2022, 222, 109342. [Google Scholar] [CrossRef]
  17. Yang, Y.; Zhou, D.; Wang, Y.; Ma, D.; Chen, W.; Xu, D.; Zhu, Z. Economical and outdoor thermal comfort analysis of greening in multistory residential areas in Xi’an. Sustain. Cities Soc. 2019, 51, 101730. [Google Scholar] [CrossRef]
  18. Zhao, Q.; Sailor, D.J.; Wentz, E.A. Impact of Tree Locations and Arrangements on Outdoor Microclimates and Human Thermal Comfort in an Urban Residential Environment. Urban For. Urban Green. 2018, 32, 81–91. [Google Scholar] [CrossRef]
  19. Klemm, W.; Heusinkveld, B.G.; Lenzholzer, S.; Jacobs, M.H.; Van Hove, B. Psychological and physical impact of urban green spaces on outdoor thermal comfort during summertime in The Netherlands. Build. Environ. 2015, 83, 120–128. [Google Scholar] [CrossRef]
  20. Yang, S.; Zhou, D.; Wang, Y.; Li, P. Comparing impact of multi-factor planning layouts in residential areas on summer thermal comfort based on orthogonal design of experiments (ODOE). Build. Environ. 2020, 182, 107145. [Google Scholar] [CrossRef]
  21. Wu, Z.; Dou, P.; Chen, L. Comparative and combinative cooling effects of different spatial arrangements of buildings and trees on microclimate. Sustain. Cities Soc. 2019, 51, 101711. [Google Scholar] [CrossRef]
  22. Morakinyo, T.E.; Kong, L.; Lau, K.K.-L.; Yuan, C.; Ng, E. A study on the impact of shadow-cast and tree species on in-canyon and neighborhood’s thermal comfort. Build. Environ. 2017, 115, 1–17. [Google Scholar] [CrossRef]
  23. Morakinyo, T.E.; Lau, K.K.-L.; Ren, C.; Ng, E. Performance of Hong Kong’s common trees species for outdoor temperature regulation, thermal comfort and energy saving. Build. Environ. 2018, 137, 157–170. [Google Scholar] [CrossRef]
  24. Lai, D.; Lian, Z.; Liu, W.; Guo, C.; Liu, W.; Liu, K.; Chen, Q. A comprehensive review of thermal comfort studies in urban open spaces. Sci. Total Environ. 2020, 742, 140092. [Google Scholar] [CrossRef]
  25. Liu, W.; Zhang, Y.; Deng, Q. The Effects of Urban Microclimate on Outdoor Thermal Sensation and Neutral Temperature in Hot-Summer and Cold-Winter Climate. Energy Build. 2016, 128, 190–197. [Google Scholar] [CrossRef]
  26. Wang, Y.; Ni, Z.; Peng, Y.; Xia, B. Local variation of outdoor thermal comfort in different urban green spaces in Guangzhou, a subtropical city in South China. Urban For. Urban Green. 2018, 32, 99–112. [Google Scholar] [CrossRef]
  27. Chen, X.; Xue, P.; Liu, L.; Gao, L.; Liu, J. Outdoor thermal comfort and adaptation in severe cold area: A longitudinal survey in Harbin, China. Build. Environ. 2018, 143, 548–560. [Google Scholar] [CrossRef]
  28. Lai, D.; Guo, D.; Hou, Y.; Lin, C.; Chen, Q. Studies of outdoor thermal comfort in northern China. Build. Environ. 2014, 77, 110–118. [Google Scholar] [CrossRef]
  29. Lenzholzer, S.; de Vries, S. Exploring Outdoor Thermal Perception—A Revised Model. Int. J. Biometeorol. 2020, 64, 293–300. [Google Scholar] [CrossRef]
  30. Klemm, W.; Heusinkveld, B.G.; Lenzholzer, S.; van Hove, B. Street greenery and its physical and psychological impact on thermal comfort. Landsc. Urban Plan. 2015, 138, 87–98. [Google Scholar] [CrossRef]
  31. Zhang, T.; Hong, B.; Su, X.; Li, Y.; Song, L. Effects of tree seasonal characteristics on thermal-visual perception and thermal comfort. Build. Environ. 2022, 212, 108793. [Google Scholar] [CrossRef]
  32. Teramoto, Y.; Tokura, H.; Ohkura, K.; Ohmasa, Y.; Suho, S.; Inoshiri, R.; Masuda, M. Effects of different light intensities during the forenoon on the afternoon thermal sensation in mild cold. J. Therm. Biol. 1996, 21, 339–343. [Google Scholar] [CrossRef]
  33. Pearlmutter, D.; Jiao, D.; Garb, Y. The relationship between bioclimatic thermal stress and subjective thermal sensation in pedestrian spaces. Int J Biometeorol 2014, 58, 2111–2127. [Google Scholar] [CrossRef]
  34. Nikolopoulou, M.; Steemers, K. Thermal comfort and psychological adaptation as a guide for designing urban spaces. Energy Build. 2003, 35, 95–101. [Google Scholar] [CrossRef]
  35. Wang, Y.; de Groot, R.; Bakker, F.; Wörtche, H.; Leemans, R. Thermal comfort in urban green spaces: A survey on a Dutch university campus. Int. J. Biometeorol. 2017, 61, 87–101. [Google Scholar] [CrossRef]
  36. Xu, X.; Sun, S.; Liu, W.; García, E.H.; He, L.; Cai, Q.; Xu, S.; Wang, J.; Zhu, J. The cooling and energy saving effect of landscape design parameters of urban park in summer: A case of Beijing, China. Energy Build. 2017, 149, 91–100. [Google Scholar] [CrossRef]
  37. Xu, M.; Hong, B.; Jiang, R.; An, L.; Zhang, T. Outdoor thermal comfort of shaded spaces in an urban park in the cold region of China. Build. Environ. 2019, 155, 408–420. [Google Scholar] [CrossRef]
  38. Khalid, Z.; Mutaz, T.; Kamoona, H.H.A. Introduction to methods for simulating urban heat islands: Subject review. J. Univ. Babylon Eng. Sci. 2022, 30, 41–57. [Google Scholar]
  39. Liu, Y.; Zhang, M.; Li, Q.; Zhang, T.; Yang, L.; Liu, J. Investigation on the distribution patterns and predictive model of solar radiation in urban street canyons with panorama images. Sustain. Cities Soc. 2021, 75, 103275. [Google Scholar] [CrossRef]
  40. Zhou, H.; Tao, G.; Nie, Y.; Yan, X.; Sun, J. Outdoor thermal environment on road and its influencing factors in hot, humid weather: A case study in Xuzhou City, China. Build. Environ. 2022, 207, 108460. [Google Scholar] [CrossRef]
  41. Zhang, T.; Su, M.; Hong, B.; Wang, C.; Li, K. Interaction of emotional regulation and outdoor thermal perception: A pilot study in a cold region of China. Build. Environ. 2021, 198, 107870. [Google Scholar] [CrossRef]
  42. Li, H.; Wang, G.; Tian, G.; Jombach, S. Mapping and Analyzing the Park Cooling Effect on Urban Heat Island in an Expanding City: A Case Study in Zhengzhou City, China. Land 2020, 9, 57. [Google Scholar] [CrossRef] [Green Version]
  43. China Meteorological Administration; Tsinghua University. Meteorological Data for Built Environment Analysis in China; China Architecture and Building Press: Beijing, China, 2005.
  44. de Vries, S.; van Dillen, S.M.E.; Groenewegen, P.P.; Spreeuwenberg, P. Streetscape greenery and health: Stress, social cohesion and physical activity as mediators. Soc. Sci. Med. 2013, 94, 26–33. [Google Scholar] [CrossRef]
  45. Lu, Y.; Sarkar, C.; Xiao, Y. The effect of street-level greenery on walking behavior: Evidence from Hong Kong. Soc. Sci. Med. 2018, 208, 41–49. [Google Scholar] [CrossRef] [PubMed]
  46. Long, J.; Shelhamer, E.; Darrell, T. Fully Convolutional Networks for Semantic Segmentation. In Proceedings of the IEEE Conference on Computer Vision and Pattern Recognition, CVPR, Boston, MA, USA, June 8–10 2015. [Google Scholar]
  47. Helbich, M.; Yao, Y.; Liu, Y.; Zhang, J.; Liu, P.; Wang, R. Using deep learning to examine street view green and blue spaces and their associations with geriatric depression in Beijing, China. Environ. Int. 2019, 126, 107–117. [Google Scholar] [CrossRef] [PubMed]
  48. Li, X.; Zhang, C.; Li, W.; Kuzovkina, Y.A.; Weiner, D. Who lives in greener neighborhoods? The distribution of street greenery and its association with residents’ socioeconomic conditions in Hartford, Connecticut, USA. Urban For. Urban Green. 2015, 14, 751–759. [Google Scholar] [CrossRef]
  49. Gong, F.-Y.; Zeng, Z.-C.; Zhang, F.; Li, X.; Ng, E.; Norford, L.K. Mapping Sky, Tree, and building view factors of street canyons in a high-density urban environment. Build. Environ. 2018, 134, 155–167. [Google Scholar] [CrossRef]
  50. Ma, X.; Tian, Y.; Du, M.; Hong, B.; Lin, B. How to Design Comfortable Open Spaces for the Elderly? Implications of Their Thermal Perceptions in an Urban Park. Sci. Total Environ. 2021, 768, 144985. [Google Scholar] [CrossRef]
  51. Xu, X.; Liu, S.; Sun, S.; Zhang, W.; Liu, Y.; Lao, Z.; Guo, G.; Smith, K.; Cui, Y.; Liu, W.; et al. Evaluation of Energy Saving Potential of an Urban Green Space and Its Water Bodies. Energy Build. 2019, 188–189, 58–70. [Google Scholar]
  52. Lam, C.K.C.; Yang, H.; Yang, X.; Liu, J.; Ou, C.; Cui, S.; Kong, X.; Hang, J. Cross-Modal Effects of Thermal and Visual Conditions on Outdoor Thermal and Visual Comfort Perception. Build. Environ. 2020, 186, 107297. [Google Scholar] [CrossRef]
  53. ASHRAE Standard 55; Thermal Environmental Conditions for Human Occupancy. ANSI/ASHRAE Standard: Atlanta, GA, USA, 2017.
  54. International Standard 7730; Ergonomics of the Thermal Environment-Analytical Determination and Interpretation of Thermal Comfort Using Calculation of the PMV and PPD Indices and Local Thermal Comfort Criteria. International Standard Organization: Geneva, Switzerland, 2005.
  55. International Standard 10551; Ergonomics of the Physical Environment-Subjective Judgement Scales for Assessing Physical Environments. International Standard Organization: Geneva, Switzerland, 2019.
  56. Huang, T.; Li, J.; Xie, Y.; Niu, J.; Mak, C.M. Simultaneous Environmental Parameter Monitoring and Human Subject Survey Regarding Outdoor Thermal Comfort and Its Modelling. Build. Environ. 2017, 125, 502–514. [Google Scholar]
  57. Wang, H.; Liu, L. Experimental Investigation about Effect of Emotion State on People’s Thermal Comfort. Energy Build. 2020, 211, 109789. [Google Scholar] [CrossRef]
  58. Baron, R.M.; Kenny, D.A. The Moderator–Mediator Variable Distinction in Social Psychological Research: Conceptual, Strategic, and Statistical Considerations. J. Personal. Soc. Psychol. 1986, 51, 1173–1182. [Google Scholar] [CrossRef]
  59. Rijnhart, J.J.M.; Lamp, S.J.; Valente, M.J.; MacKinnon, D.P.; Twisk, J.W.R.; Heymans, M.W. Mediation analysis methods used in observational research: A scoping review and recommendations. BMC Med. Res. Methodol. 2021, 21, 226. [Google Scholar] [CrossRef]
  60. Nguyen, T.Q.; Schmid, I.; Stuart, E.A. Clarifying causal mediation analysis for the applied researcher: Defining effects based on what we want to learn. Psychol. Methods 2021, 26, 255–271. [Google Scholar] [CrossRef]
  61. Wang, R.; Helbich, M.; Yao, Y.; Zhang, J.; Liu, P.; Yuan, Y.; Liu, Y. Urban greenery and mental wellbeing in adults: Cross-sectional mediation analyses on multiple pathways across different greenery measures. Environ. Res. 2019, 176, 108535. [Google Scholar] [CrossRef]
  62. He, D.; Miao, J.; Lu, Y.; Song, Y.; Chen, L.; Liu, Y. Urban greenery mitigates the negative effect of urban density on older adults’ life satisfaction: Evidence from Shanghai, China. Cities 2022, 124, 103607. [Google Scholar] [CrossRef]
  63. Sobel, M.E. Asymptotic Confidence Intervals for Indirect Effects in Structural Equation Models. Sociol. Methodol. 1982, 13, 290–312. [Google Scholar] [CrossRef]
  64. Sun, S.; Xu, X.; Lao, Z.; Liu, W.; Li, Z.; Higueras García, E.; He, L.; Zhu, J. Evaluating the Impact of Urban Green Space and Landscape Design Parameters on Thermal Comfort in Hot Summer by Numerical Simulation. Build. Environ. 2017, 123, 277–288. [Google Scholar]
  65. Chen, X.; Gao, L.; Xue, P.; Du, J.; Liu, J. Investigation of outdoor thermal sensation and comfort evaluation methods in severe cold area. Sci. Total Environ. 2020, 749, 141520. [Google Scholar]
  66. Hystad, P.; Payette, Y.; Noisel, N.; Boileau, C. Green space associations with mental health and cognitive function. Environ. Epidemiol. 2019, 3, e040. [Google Scholar] [CrossRef]
  67. Stigsdotter, U.K.; Corazon, S.S.; Sidenius, U.; Refshauge, A.D.; Grahn, P. Forest design for mental health promotion—Using perceived sensory dimensions to elicit restorative responses. Landsc. Urban Plan. 2017, 160, 1–15. [Google Scholar] [CrossRef]
  68. Niu, J.; Hong, B.; Geng, Y.; Mi, J.; He, J. Summertime physiological and thermal responses among activity levels in campus outdoor spaces in a humid subtropical city. Sci. Total Environ. 2020, 728, 138757. [Google Scholar] [CrossRef] [PubMed]
  69. Dzhambov, A.M.; Lercher, P.; Browning, M.H.E.M.; Stoyanov, D.; Petrova, N.; Novakov, S.; Dimitrova, D.D. Does greenery experienced indoors and outdoors provide an escape and support mental health during the COVID-19 quarantine? Environ. Res. 2021, 196, 110420. [Google Scholar] [CrossRef] [PubMed]
  70. Morakinyo, T.E.; Ouyang, W.; Lau, K.K.-L.; Ren, C.; Ng, E. Right tree, right place (urban canyon): Tree species selection approach for optimum urban heat mitigation—Development and evaluation. Sci. Total Environ. 2020, 719, 137461. [Google Scholar] [CrossRef]
  71. Leslie, E.; Sugiyama, T.; Ierodiaconou, D.; Kremer, P. Perceived and objectively measured greenness of neighbourhoods: Are they measuring the same thing? Landsc. Urban Plan. 2010, 95, 28–33. [Google Scholar] [CrossRef]
  72. He, H.; Lin, X.; Yang, Y.; Lu, Y. Association of street greenery and physical activity in older adults: A novel study using pedestrian-centered photographs. Urban For. Urban Green. 2020, 55, 126789. [Google Scholar] [CrossRef]
Figure 1. Hypothesized impact pathways of greenery on OTC.
Land 11 01442 g001
Figure 2. Study site locations and landscape characteristics of these sites.
Land 11 01442 g002
Figure 3. The extraction process from images to greening indices.
Land 11 01442 g003
Figure 4. The classical mediating effect model.
Land 11 01442 g004
Figure 5. The models in mediation analysis.
Land 11 01442 g005
Figure 6. Analyses and workflow on the basis of the above definition.
Land 11 01442 g006
Figure 7. Hourly mean Ta, RH, Tg, and Va on each day.
Land 11 01442 g007
Figure 8. Frequency of the TCVs.
Land 11 01442 g008
Figure 9. Results of regressing greenery on TCV, greenery on microclimate, and microclimate on TCV.
Land 11 01442 g009
Figure 10. The impact of greenery on TCV with the microclimate as the mediator.
Land 11 01442 g010
Table 1. Values of the GVI and TVF at each sampling point.
Greening Index123456789101112
GVI (%)25.822.542.232.127.576.146.557.622.729.936.243.7
TVF (%)2.175.836.85.79.981.910.411.45.612.79.144.8
Table 2. Metrological properties of measuring instruments.
Microclimatic ParametersInstrumentRangeAccuracy
Air temperature (Ta)HOBO U23-001A−40–70 °C±0.21 °C
Relative humidity (RH)HOBO U23-001A0–100%±2.5%
Wind speed (Va)HD32.30–5 m/s±0.05 m/s (0–1 m/s)
±0.15 m/s (1–5 m/s)
Global temperature (Tg)HD32.3−10–100 °C±0.5 °C
Table 3. Summary statistics of the data.
VariablesMaxMinMean (SD)25% Quantile75% QuantileProportion (Number)
Response
Gender (%): Male 65.63% (947)
Female 34.37% (496)
Type of activity (%): Seated 6.24% (90)
Standing 9.63% (139)
Stroll 81.01% (1169)
Exercising 3.12% (45)
Clothing insulation (Clo)2.940.941.40 (0.19)1.231.49
TCV4.000.002.24 (0.76)1.702.80
Microclimate
Ta (°C)19.401.607.88 (4.81)4.0012.30
Tg (°C)24.200.409.02 (5.78)4.3012.60
RH (%)100.6021.3043.44 (17.59)31.3049.80
Va (m/s)9.600.001.23 (1.24)0.351.71
Greening indices
GVI (%)76.1022.5038.55 (15.24)25.8045.10
TVF (%)81.902.1025.50 (26.84)7.4040.80
Table 4. Results of the mediating effect of microclimatic parameters on the greenery–TCV correlation.
Model 3aModel 3cModel 3eModel 3gModel 3i
Ta (Coef.)
(SE)
Tg (Coef.)
(SE)
RH (Coef.)
(SE)
Va (Coef.)
(SE)
Multi (Coef.)
(SE)
GVI−0.581 **
(0.111)−
−0.634 ***
(0.112)
−1.315 ***
(0.131)
−0.990 ***
(0.120)
−0.274 **
(0.110)
Ta−0.091 ***
(0.004)
——————−0.086 ***
(0.004)
Tg——−0.073 ***
(0.003)
——————
RH————−0.005 ***
(0.001)
——−0.006 ***
(0.001)
Va——————0.246 ***
(0.015)
0.097 ***
(0.016)
Model 3bModel 3dModel 3fModel 3hModel 3j
Ta (Coef.)
(SE)
Tg (Coef.)
(SE)
RH (Coef.)
(SE)
Va (Coef.)
(SE)
Multi (Coef.)
(SE)
TVF−0.461 ***
(0.062)−
−0.601 ***
(0.061)
−0.936 ***
(0.082)
−0.532 ***
(0.073)
−0.104
(0.072)
Ta−0.089 ***
(0.004)−
——————−0.087 ***
(0.004)
Tg——−0.072 ***
(0.003)
——————
RH————−0.003 **
(0.001)
——−0.006 ***
(0.001)
Va——————0.227 ***
(0.016)
0.095 ***
(0.016)
The dependent variable: TCV. Significance levels: *** p < 0.001, ** p < 0.01; Coef. = coefficient; SE: standard error.
Table 5. Total, direct, and mediation effects of the mediation analyses.
Total EffectDirect EffectMediation Effect% Mediation Effect
GVI
Ta−1.445−0.581−0.86459.79%
Tg−1.445−0.634−0.81156.12%
RH−1.445−1.315−0.139.00%
Va−1.441−0.99−0.45131.30%
Multiple mediators−1.442−0.274−1.16881.00%
TVF
Ta−0.952−0.461−0.49151.58%
Tg−0.95−0.6−0.3536.84%
RH−0.952−0.871−0.0818.51%
Va−0.949−0.532−0.417 43.94%
Multiple mediators−0.948−0.104−0.84489.02%
Publisher’s Note: MDPI stays neutral with regard to jurisdictional claims in published maps and institutional affiliations.

