Article

Land Cover and Human Disturbance Impact on Water Chemistry and Ecological Health in an Asian Temperate Lotic System

Department of Bioscience and Biotechnology, Chungnam National University, Daejeon 34134, Korea
*
Author to whom correspondence should be addressed.
Land 2022, 11(9), 1428; https://doi.org/10.3390/land11091428
Submission received: 26 July 2022 / Revised: 19 August 2022 / Accepted: 24 August 2022 / Published: 29 August 2022
(This article belongs to the Section Water, Energy, Land and Food (WELF) Nexus)

Abstract

:
The ecological integrity of lotic ecosystems is influenced by land cover type and human activity throughout the watershed. This study evaluated Nakdong River conditions in 2016 using two multi-metric models, the index of biotic integrity (IBI) and the water pollution index (WPI), and compared model outputs for four land cover types: predominantly urban, forest, barren land, and agricultural. The primary objective of this study was to determine whether the land cover type and human disturbance metrics effectively regulate water quality, fish communities, and ecological integrity in the Nakdong River basin. Predominantly forest sites had low nutrient, organic matter, suspended solids, ion, and algal chlorophyll concentrations. In contrast, these concentrations were higher in predominantly agricultural, urban, and barren land areas. Concentrations of nutrients, organic matter, ions, suspended particle loadings, and algal growth regulated by the intensity of the Asian summer monsoon. Model outputs indicated that total phosphorus (TP) was the most important factor in algal growth in agricultural (R2 = 0.25) and barren land (R2 = 0.35) sites, and evidence of P limitation was found, with TN:TP ratios >17 in ambient water. Fish community analysis indicated that tolerant species dominated the fish community in the agricultural (52%), barren land (85%), and urban sites (53%), and sensitive species were dominant in the forest sites (56%). Fish composition analysis indicated that two exotic species (Lepomis macrochirus (3.99%) and Micropterus salmoides (3.92%)) were identified as the fifth and seventh most abundant fish species in the watershed and labeled as “ecologically disturbing species” in Korea. Nutrient enrichment, organic pollution, and algal blooms enhanced the mean relative abundance of omnivorous and tolerant fish species. Mean WPI and IBI scores indicated fair or poor conditions in the agricultural (WPI: 22, IBI: 16), barren land (WPI: 21, IBI: 14), and urban (WPI: 21, IBI: 17) sites and good or fair conditions in forest (WPI: 28, IBI: 21) sites. The chemical (r = −0.34) and biological (r = −0.21) health of the river basin were negatively related to human disturbance metrics. The findings suggested that regional land cover, summer monsoon intensity, and human disturbance are important drivers of water quality, fish community, and ecological health. The resulting information suggested that agricultural diffuse pollution control, cutting-edge wastewater treatment technologies, and reducing the degrees of human disturbance could improve the Nakdong River’s ecological integrity.

1. Introduction

Lotic ecosystems (i.e., streams and rivers) are critical natural resources that have multiple ecological and socioeconomic functions [1,2,3]. Because of their intimate connection with the adjacent surroundings, lotic systems are vulnerable to external change; their geochemistry and aquatic biota reflect natural and anthropogenic features of the entire catchment area [1,4,5]. Extensive anthropogenic activity, changes in land use types, and summer monsoons have severely impacted the ecological integrity of Asian temperate lotic ecosystems [6,7,8]. Rapid river runoff during the summer monsoon period reduces water residence time, hence altering nutrient levels, organic matter, and light availability, which directly influence algal growth [8,9,10]. The summer monsoon-induced flow could be a crucial factor in the movement of fish communities; it alters the functional linkages between nutrients, organic matter, and biological components [8,11].
Although summer monsoons play an important role in determining water quality and fish community dynamics, human impacts and land use patterns can be critical drivers of ecological integrity in Asian lotic systems [2,8,12,13,14]. In Korea, seventy percent of the landscape is forest-dominated and mountainous [15]. Increases in agricultural land and fertilizer use increase the productivity of Korean lotic systems and degrade ecological integrity [8,16], and urbanization tends to increase salinity and negatively affect water quality and ecological integrity [17,18].
As concerns about sustainable development and preservation of healthy ecosystems grow, understanding how land use and anthropogenic activity impact water quality, fish communities, and ecological integrity is critical [2,19]. Previous studies have demonstrated that land use influences water quality and fish species assemblages in the Etowah River Basin, USA [20]. Allan [21] provided evidence of significant causal relationships between land use types and certain parameters related to fish. At the local scale, land use type affects water quality and fish distributions in the streams and rivers of the USA [22]. Wang et al. [23] demonstrated that native species might be particularly susceptible to replacement by generalist species following increased sediment inputs in the trout streams of Wisconsin and Minnesota, USA. Recent studies have suggested that land use type is an indicator of water quality and changes in biological communities in aquatic systems worldwide [7,24,25,26]. For example, the ecological integrity of rivers in China is strongly related to the amount of urban and farmland area and the intensity of nighttime light [27]. Additional work in China has focused on spatial patterns of pollutants in aquatic systems and their correlation with human activity [28,29].
However, assessments of individual land use impacts may not adequately represent the collective effects of human activity on lotic systems [30]. The human modification index of terrestrial systems (HMITS) has been utilized in determining water quality [31], biodiversity [32], and the primary productivity condition of aquatic systems. It represents the accumulative effect of humans on a particular location by considering multiple types of human activity [33,34]. Degrees of anthropogenic influence vary spatially, and interactions between humans and lotic systems occur on a regional scale [5,31]. Therefore, spatial analyses may provide insight into the current conditions of lotic ecosystems.
Ecological health assessments of streams and rivers based on water quality and fish assemblages are common worldwide [8,19]. A multi-metric water pollution index (WPI) based on water chemistry is used to assess the chemical health of aquatic systems. Kim and An [11] developed this index for diagnosing the chemical health of lotic systems on a regional basis based on nutrients, organic matter, ionic content, and algal productivity. On the other hand, a multi-metric index of biotic integrity (IBI) model was used to assimilate information from multiple levels of fish communities to provide the biological condition of streams and rivers and assess human impacts on stream or river communities [19,35,36,37]. In addition, an empirical investigation between trophic state parameters (TP, TN, CHL-a) as well as fish trophic and tolerance guilds with the index of biotic integrity must be evaluated to comprehend trophic interactions at various trophic levels in the food chain [8,38]. Trophic preferences and interactions can affect river water chemistry, community structures, and ecological integrity [8,39].
Assessments of human impacts on the ecological integrity of lotic systems on a regional scale are scarce. South Korea is intensely industrialized and urbanized with distinct climatic and geographic features. There is substantial concern about the integrity of aquatic systems within the country, particularly the interactive effects among land cover, ecological services, and lotic ecosystems. The ecological integrity of the Nakdong River basin was severely compromised by the presence of Gumi and Daegu, two cities with national industrial complexes, as well as small industrial and agricultural areas [40]. As a result, we sought to determine how land use type influences water quality, fish communities, and ecological integrity in temperate lotic systems in South Korea. We determined HMITS values to understand cumulative human impacts on the ecological integrity of the selected river. Biological integrity and chemical integrity were assessed with the IBI and WPI, respectively. We further assessed interactions among nutrients, organic matter, and algal chlorophyll against fish guilds and IBI values.

2. Materials and Methods
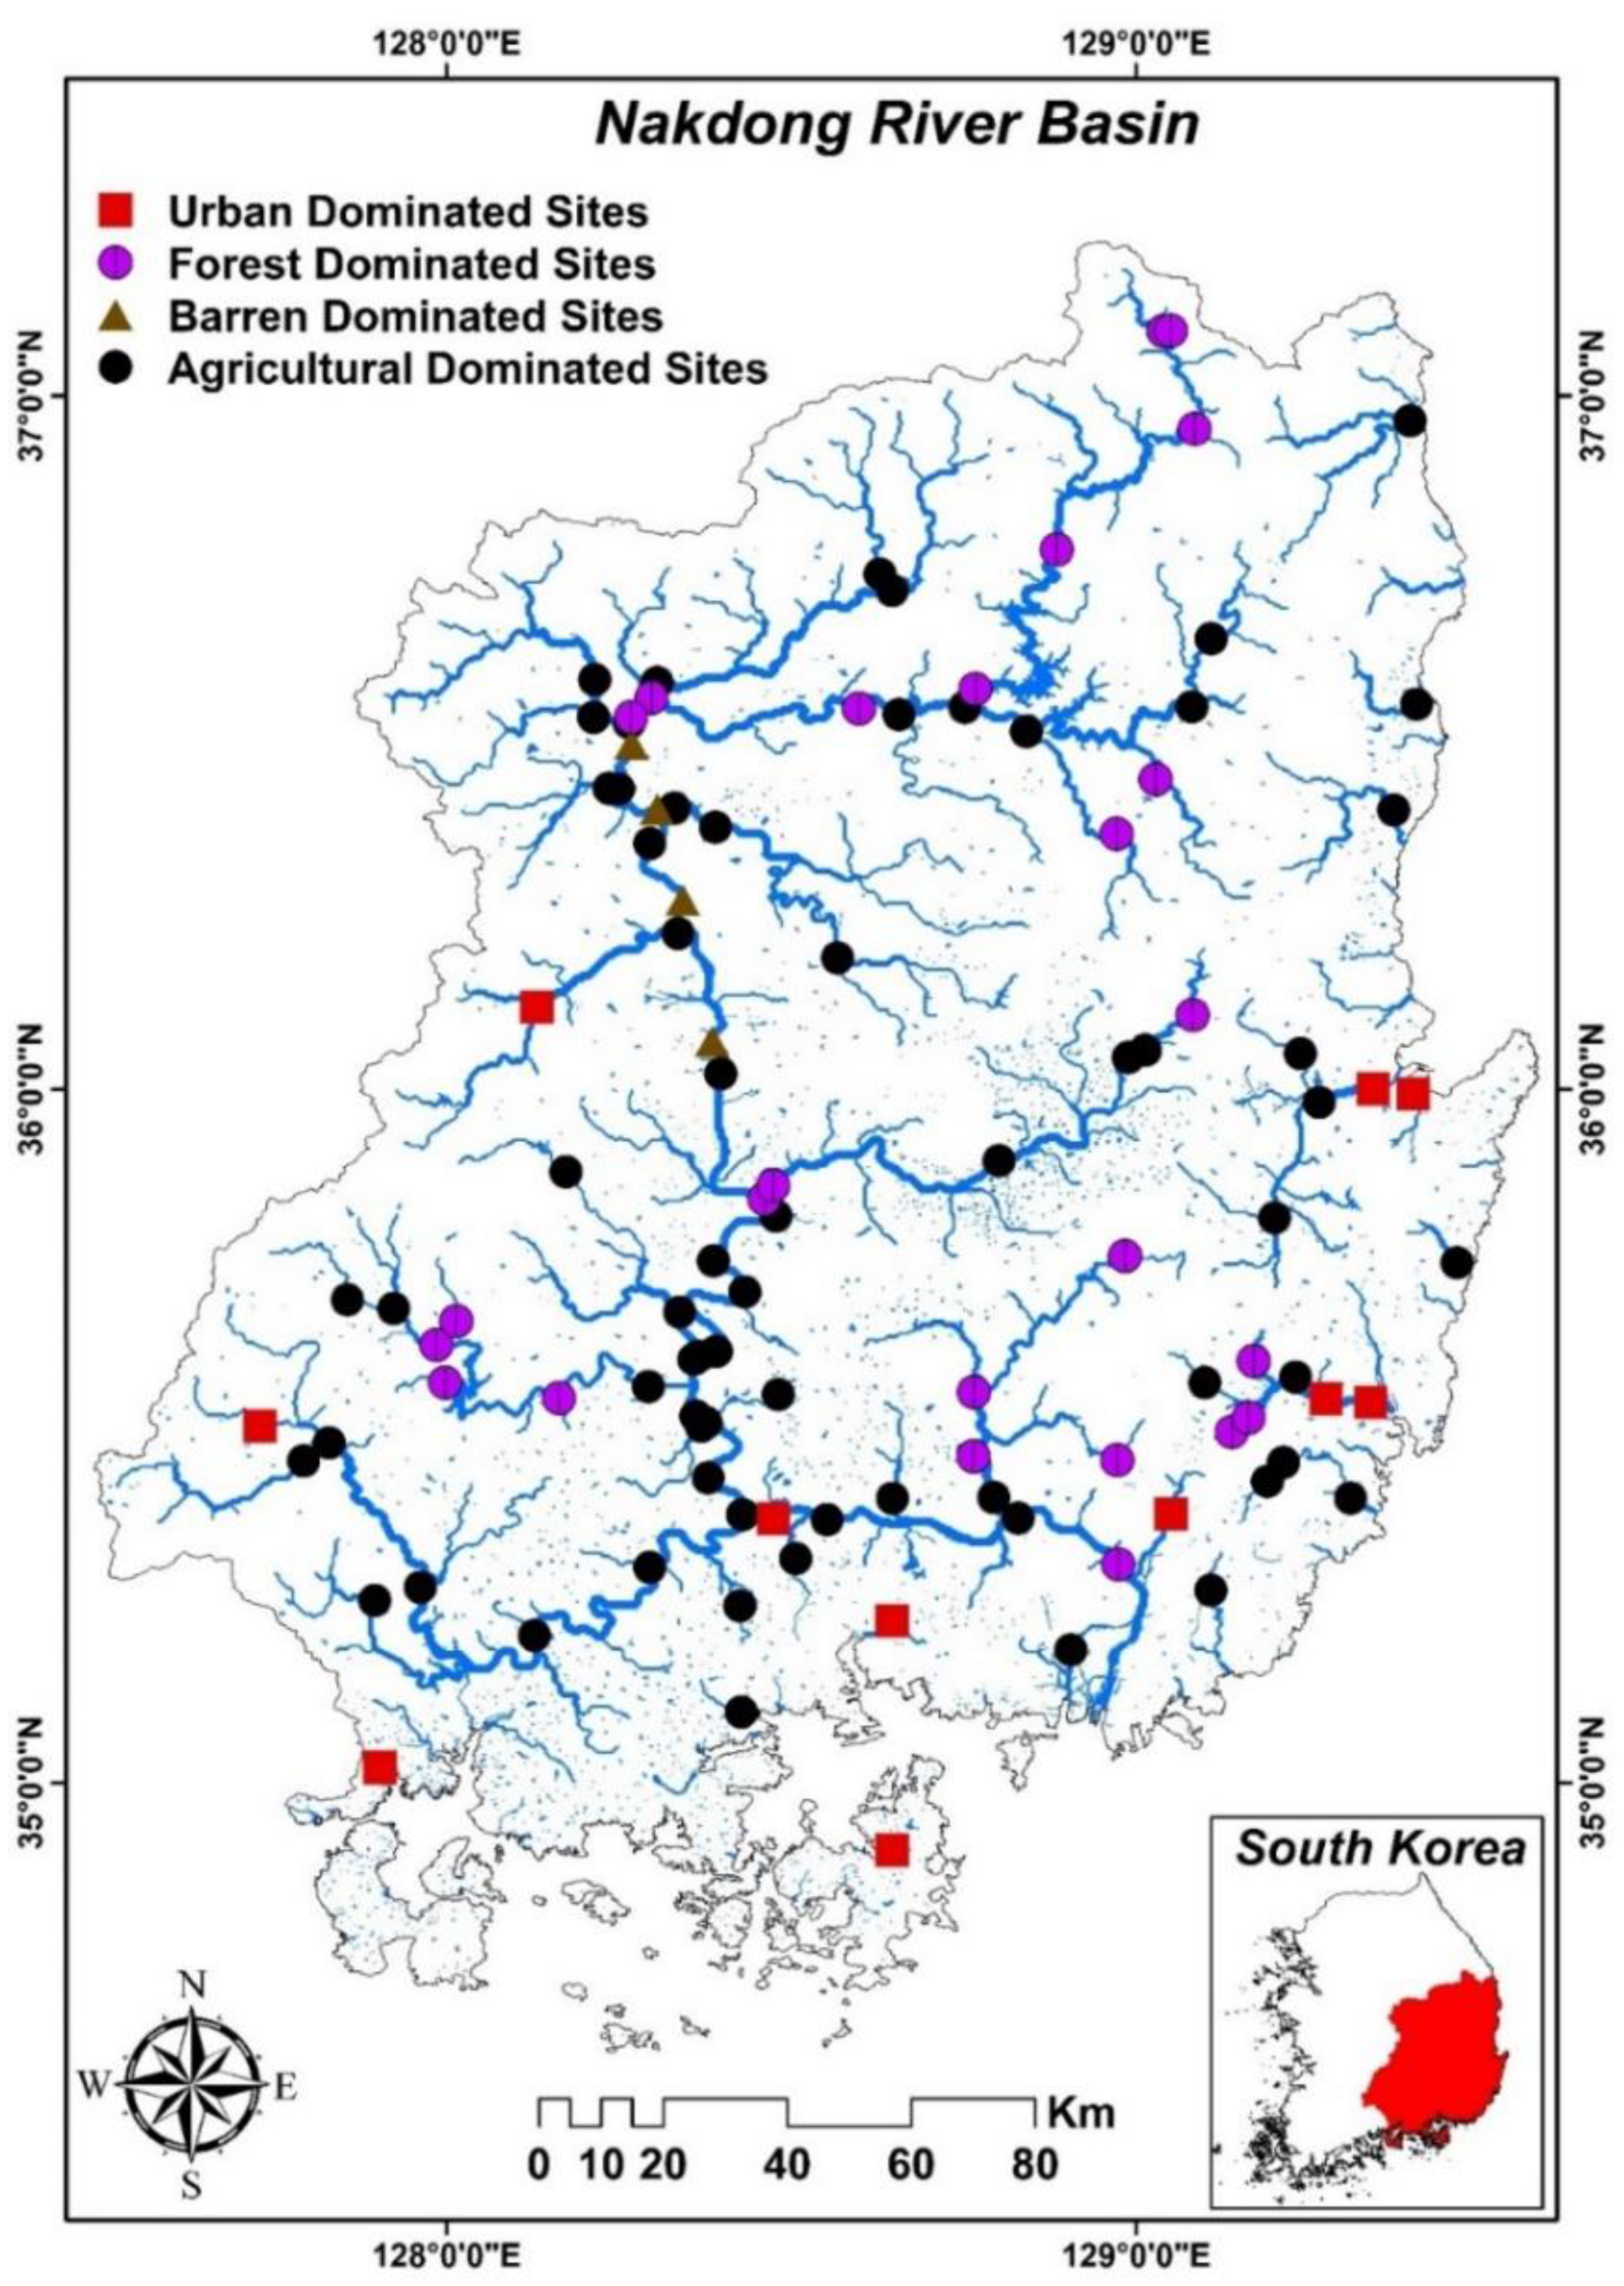
2.1. Study Area

The Nakdong River basin, which comprises 25% of South Korea’s total land area, begins in the Taebaek Mountains in Gangwon Province and runs through Gyeongsangbuk Province, Daegu Metropolitan City, Gyeongsangnam Province, Busan Metropolitan City, and Ulsan Metropolitan City. The Nakdong River basin is South Korea’s second largest watershed. The watershed is 23,817.3 km2 in size, with a channel length of 521.5 km and a circumference of 1097.13 km. The average slope is 32.26%. To determine the effects of land cover type on the Nakdong River basin, we classified study sites into four categories: predominantly urban, forest, barren land, and agricultural (Figure 1).

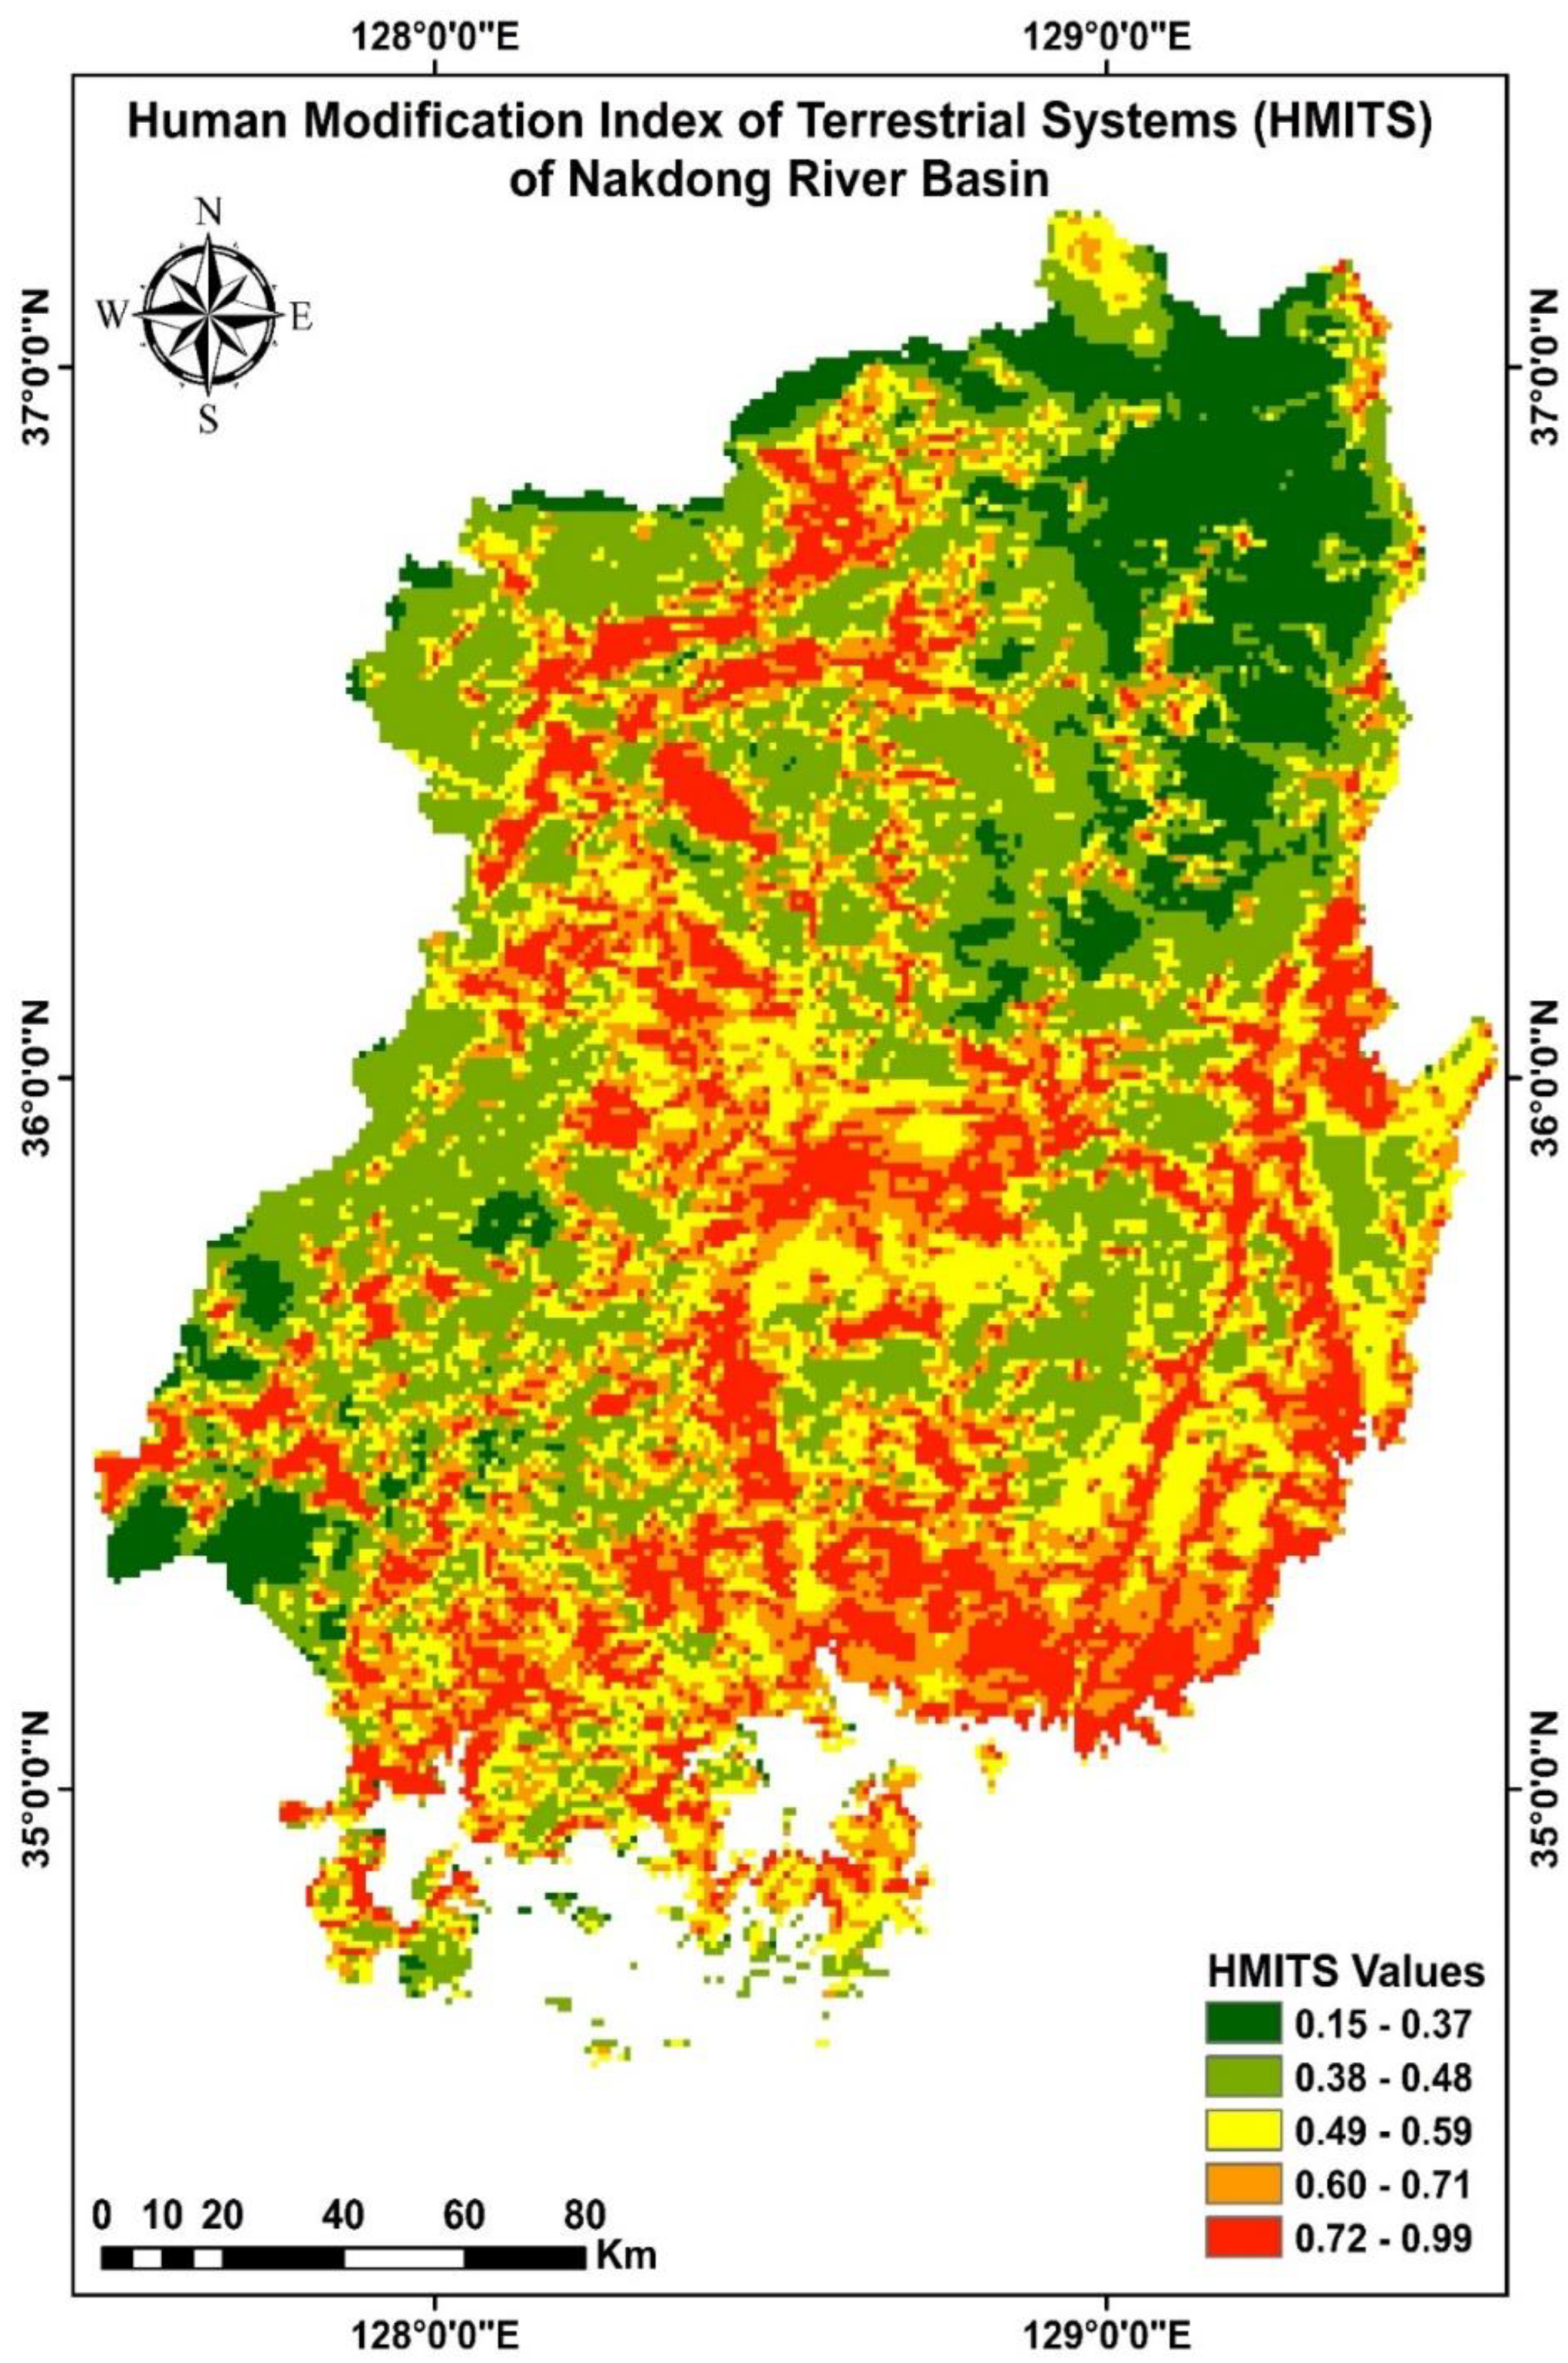
2.2. Cumulative Human Pressure Data Set

We extracted HMITS values current to 2016 [30] for the Nakdong River basin from https://sedac.ciesin.columbia.edu/data/set/Lulc-human-modification-terrestrial-systems, accessed on 25 May 2022 (Figure 2). These data included modeled metrics representing 13 anthropogenic activities and included population density, urbanized area, crops, livestock, major and minor roads, double-track railroads, mining, oil wells, wind turbines, power lines, and nighttime light.

2.3. Water Quality Parameters

Monthly surface water quality data were obtained from the Ministry of the Environment’s (MOE’s) Water Information Network (http://water.nier.go.kr, accessed on 25 May 2022). We included nine water quality metrics available for the Nakdong River basin in 2016. The sampling time of water quality data was 11 ± 0.30 a.m. A portable Sonde Model 6600 multiparameter analyzer (YSI, Yellow Springs, OH, USA) was used to directly measure water temperature (WT), electrical conductivity (EC), and dissolved oxygen (DO). Samples were collected, preserved and analyzed via Korean Ministry of Environment protocols to determine total suspended solids (TSS), chemical oxygen demand (COD), biological oxygen demand (BOD), total phosphorus (TP), total nitrogen (TN), and chlorophyll-a (CHL-a) [41]. The Ministry of Environment stated that nutrients, organic matter and solids analyses were performed in triplicate, while CHL-a was measured in duplicate to ensure validity [41].

2.4. Fish Sampling

Fish were sampled using a methodology adapted from the Ohio Environmental Protection Agency [42] that was modified for regional use by An et al. [43]. Fish were sampled overnight using fyke, gill, and trammel nets. Cast and kick nets were used to capture fish in run, riffle, and pool locations. A boat was used to set up fyke, gill, and trammel nets along the shoreline, and cast and kick nets were used in nearshore waters. The sampled river length was 200 m, and the sampling period was 60 min at each study location. Fish were identified to the species level, and any abnormalities in sampled individuals were recorded following sample collection. Trophic and tolerance guilds were determined following An et al. [12]. Sensitive species are the most susceptible to significant degradation types such as eutrophication, organic pollution, siltation, lowered flow, low dissolved oxygen, and toxic chemicals [35,37]. Sensitive species are those that first decline with environmental degradation. Tolerant species were classified as those generally known to be affected least detrimentally by typical anthropogenic disturbances to streams and watersheds; many of these species’ historical ranges or local proportional abundances have increased with increases in anthropogenic disturbances (blue gill, bass etc.) [35,37,39]. Omnivores are those who can digest considerable amounts of both plant and animal foods [35,37]. Insectivores primarily consume insects taken from the water surface or bottom substrate. Carnivores are species that feed, as adults, predominantly on fish, other vertebrates, or crayfish [35,37].

2.5. Multi-Metric WPI Model

A multi-metric WPI model was used to determine the chemical health of the sampled river [11,24]. The WPI was calculated using seven metrics: M1: TN (mg/L), M2: TP (µg/L), M3: TN:TP ratio, M4: BOD (mg/L), M5: TSS (mg/L), M6: EC (µS/cm), and M7: CHL-a (µg/L). Each metric was assigned a score of 5, 3, or 1 based on the measured concentration (Table 1). We determined the overall chemical health of the river by aggregating all metric scores and categorized it as excellent (31–35), good (25–29), fair (19–23), poor (13–17), or very poor (7–11).

2.6. Multi-Metric IBI Model

A multi-metric IBI model was used to determine the river’s biological health based on the fish community. The IBI model was developed by An et al. [37] for use on a national scale. The IBI was calculated using eight metrics: M1: total number of native fish species, M2: number of riffle benthic species, M3: number of sensitive species, M4: proportion of individuals belonging to tolerant species, M5: proportion of individuals belonging to omnivorous species, M6: proportion of individuals belonging to native insectivorous species, M7: total number of native individuals, and M8: percentage of individuals with anomalies. Each metric was assigned a value of 5, 3, or 1 based on the relative abundance and number of fish (Table 2). We determined the river’s overall biological health by summing all metric scores and classified it as excellent (36–40), good (28–34), fair (20–26), poor (14–18), or very poor (8–13).

2.7. Statistical Analyses

Water quality parameters were log10-transformed prior to regression analyses to improve the normality. Pearson correlation and regression analyses were performed with SigmaPlot (ver. 14, San Jose, CA, USA) to determine causal relationships between water quality variables, HMITS, fish guilds (trophic level and tolerance), and IBI scores. Box plots based on analysis of variance (ANOVA) and post hoc Tukey’s tests were used to depict spatial and seasonal variation in water quality in the Nakdong River using R (ver. 4.1.1).

3. Results

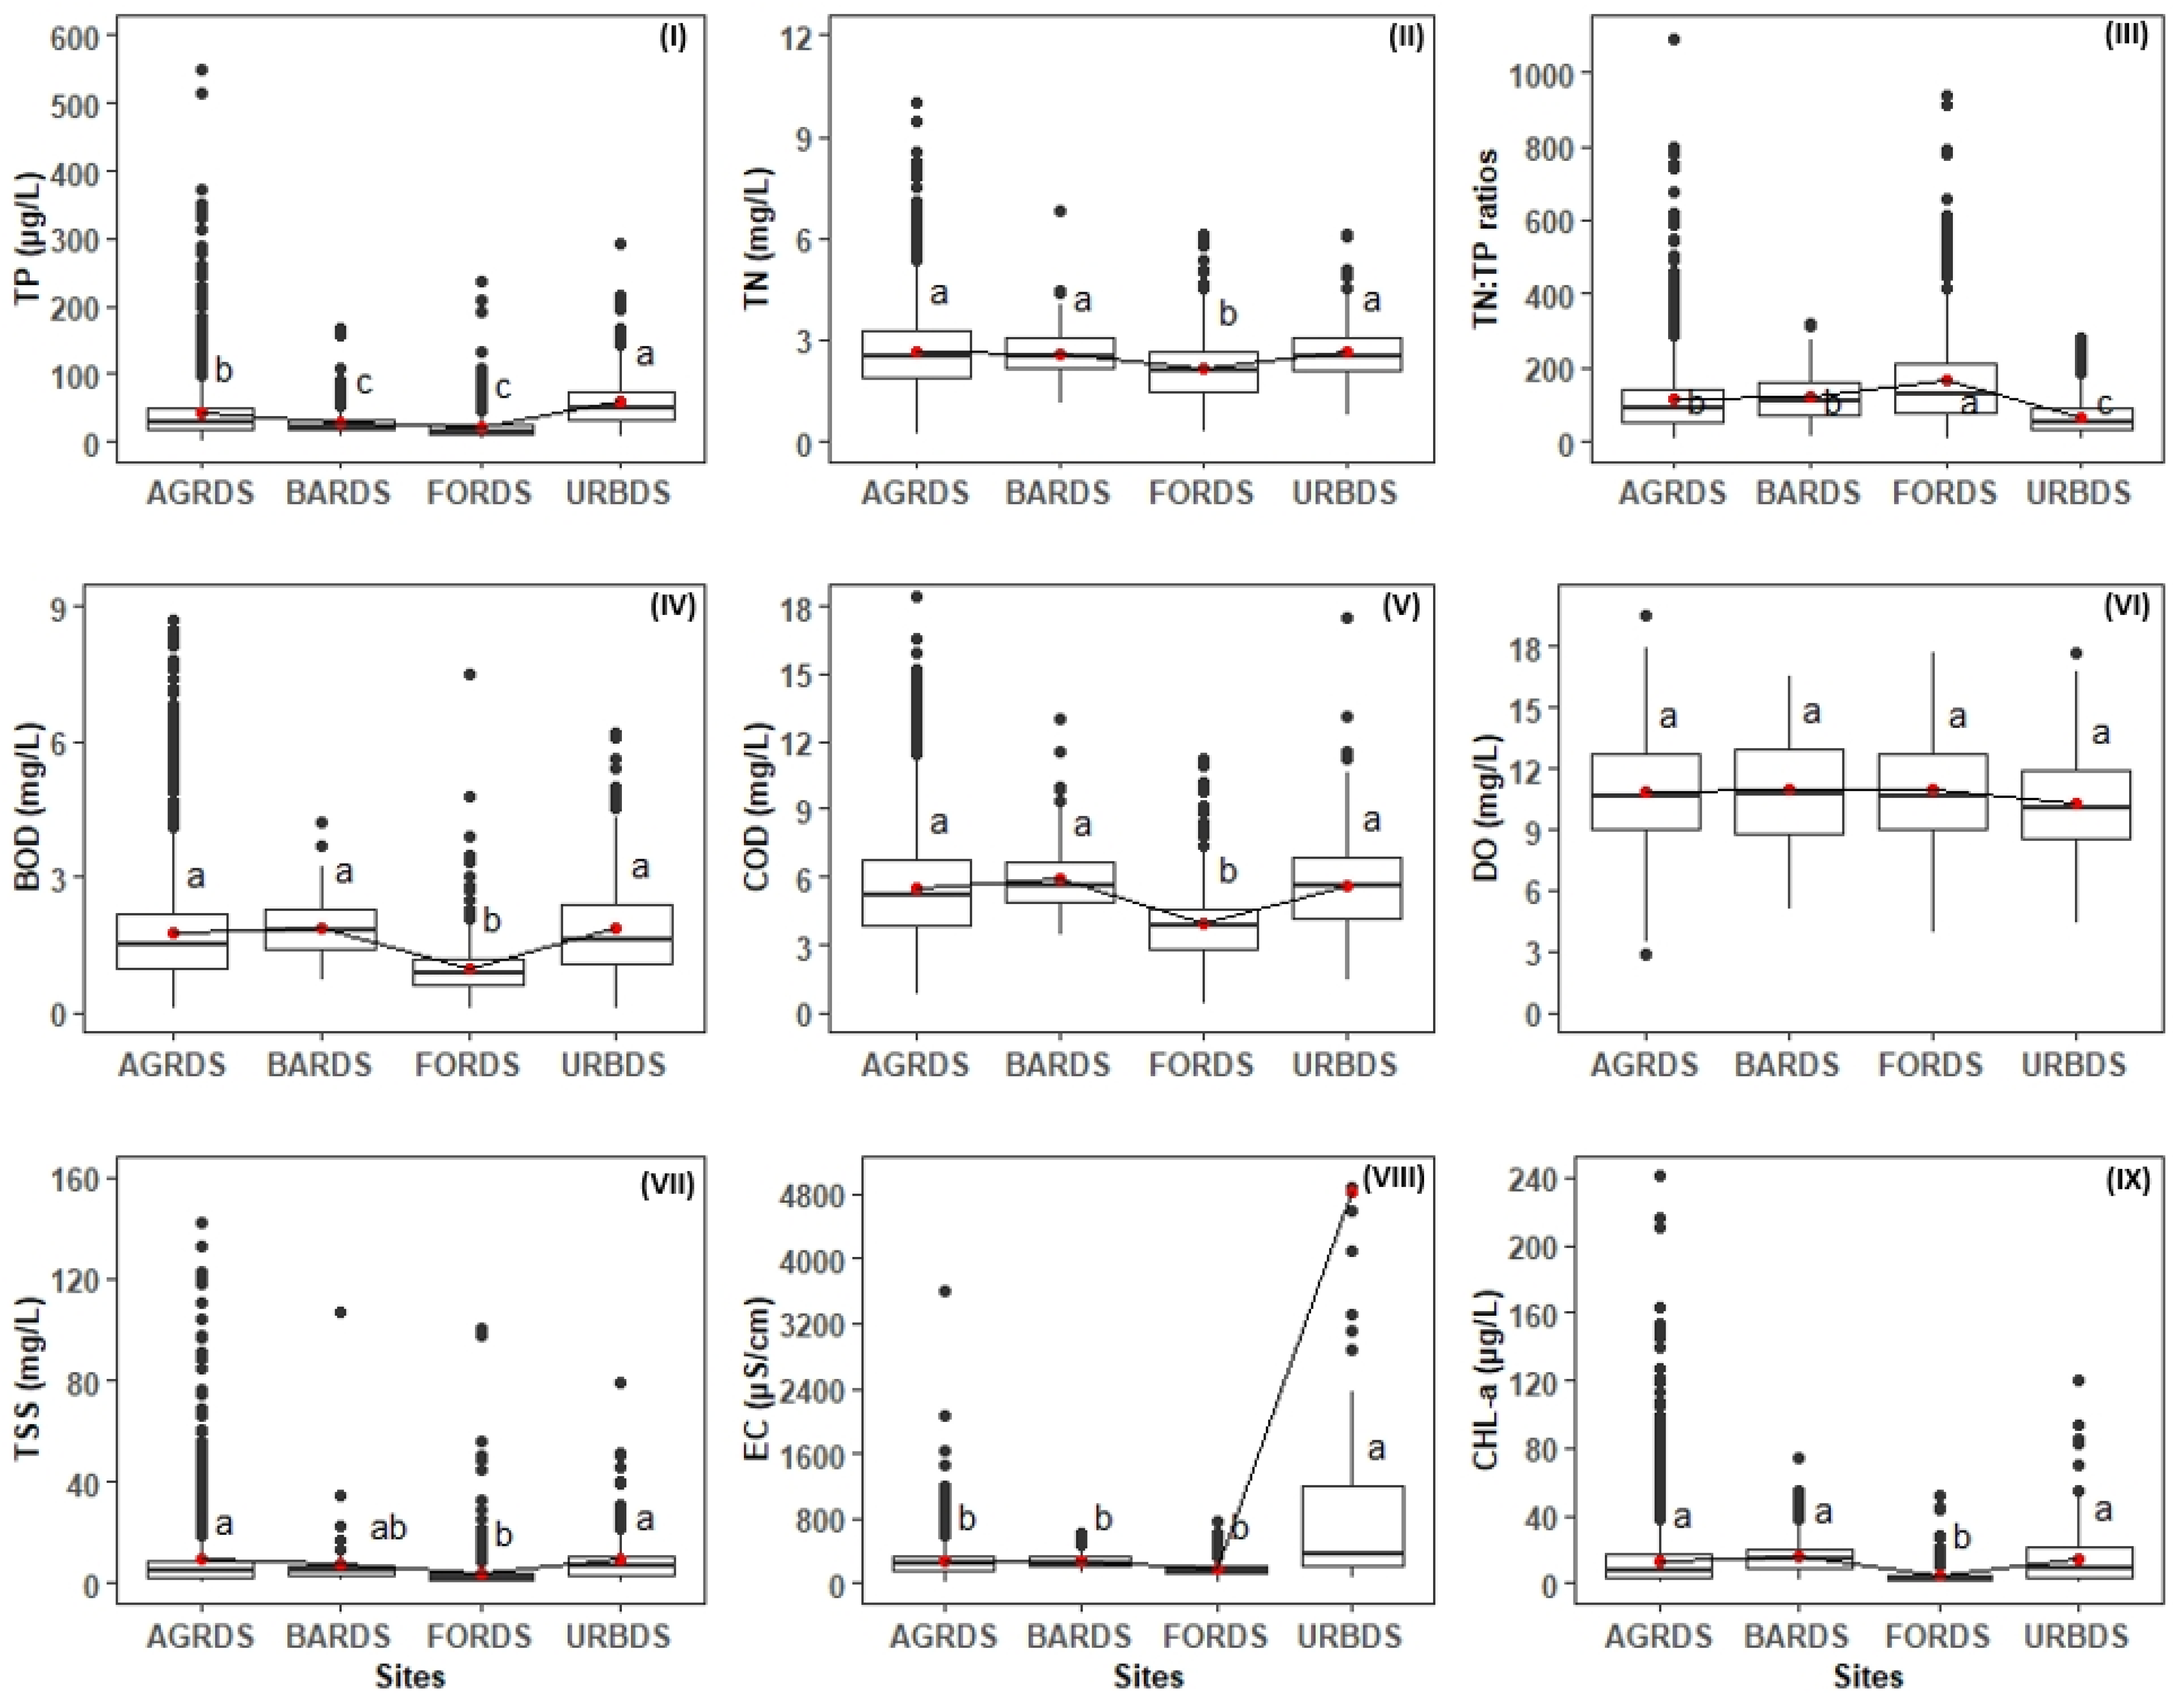
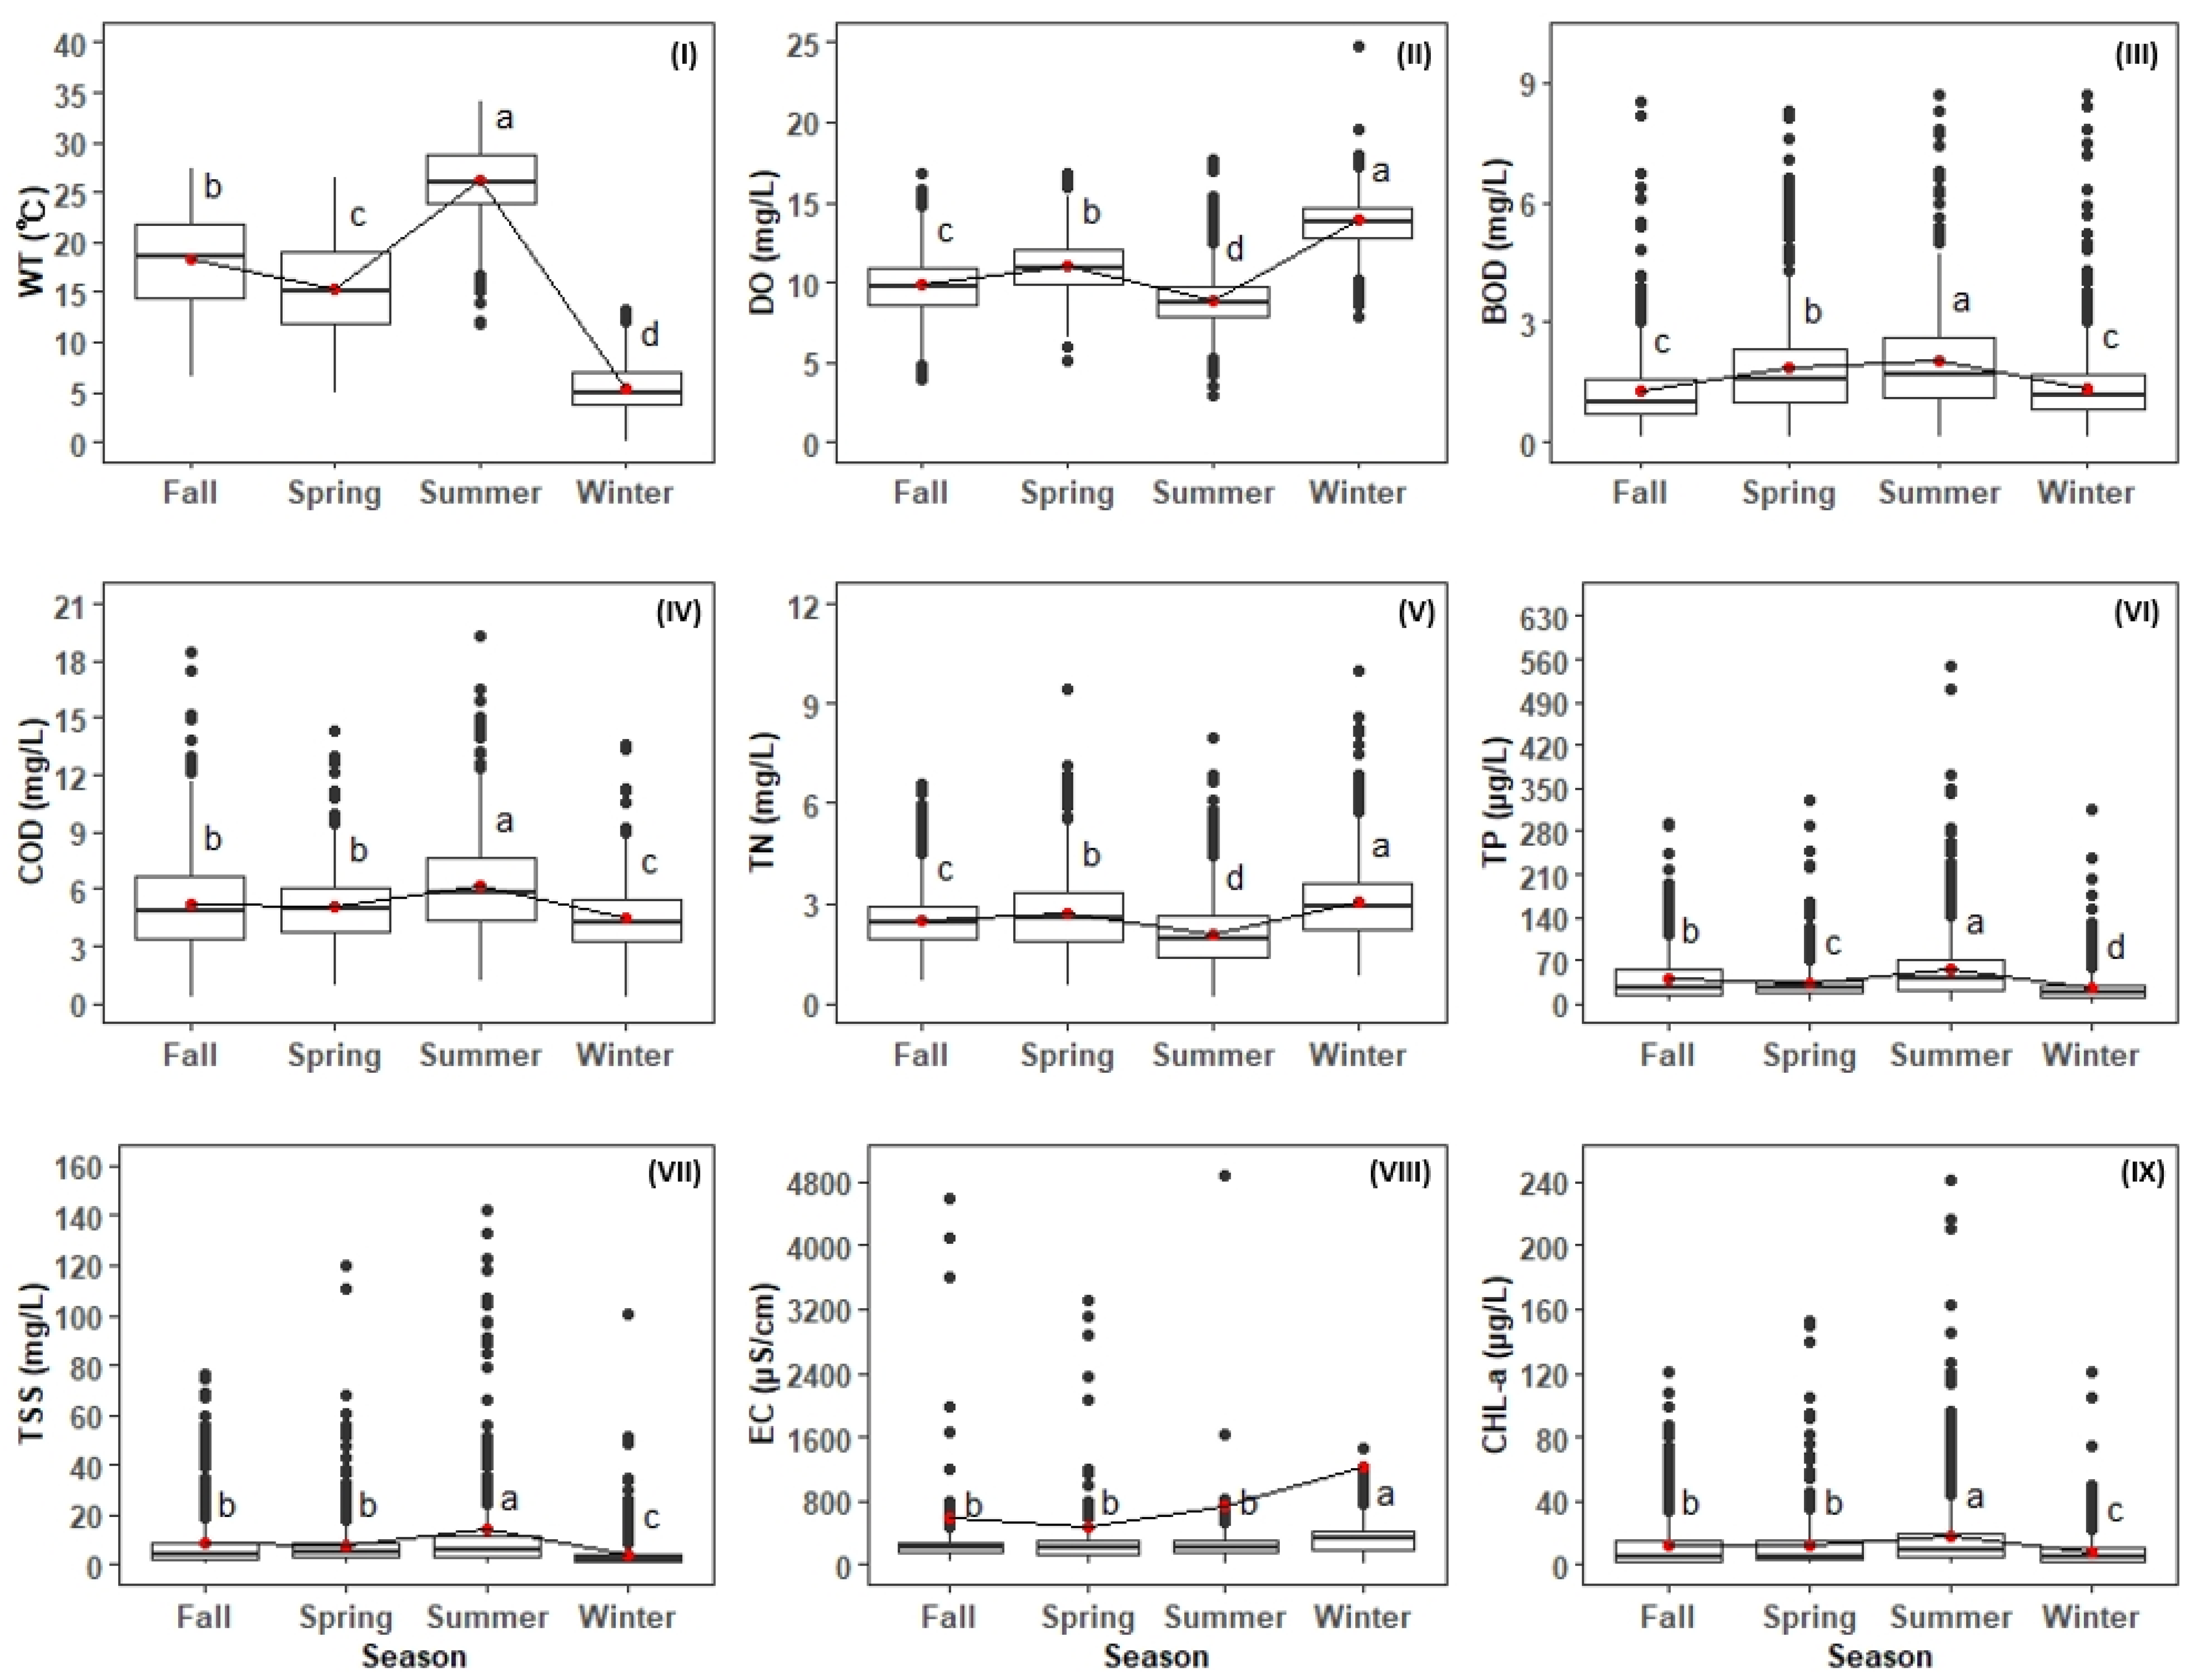
3.1. Spatial and Seasonal Variation in Water Quality Parameters

Nutrients (TP, TN), organic matter (BOD, COD), DO, EC, and CHL-a varied significantly among the four land use types (Figure 3). It is notable that mean TP (59.5 µg/L) and EC (4811 µS/cm) were highest in predominantly urban sites. Mean TN, BOD, COD, EC, and CHL-a did not vary significantly among predominantly agricultural, barren land, and urban sites. Mean TN, BOD, COD, TSS, EC, and CHL-a were lowest in the forest sites. Overall, water quality was poorer in agricultural, barren land, and urban sites than in forest sites.
The water quality parameters showed substantial seasonal variation (Figure 4). Average WT was highest in summer (26.2 °C). DO was low (8.89 mg/L) in summer and high (13.9 mg/L) in winter. Due to the dilution effect, the lowest TN values (2.10 mg/L) were observed in summer. Mean BOD (2.01 mg/L), COD (6.18 mg/L), TP (56.1 µg/L), and TSS (14.2 mg/L) were highest in summer because of increased water flow in the river basin. CHL-a levels (17.6 µg/L) were also highest in summer. Mean EC values (1223 µS/cm) were observed in winter because of low river flow.

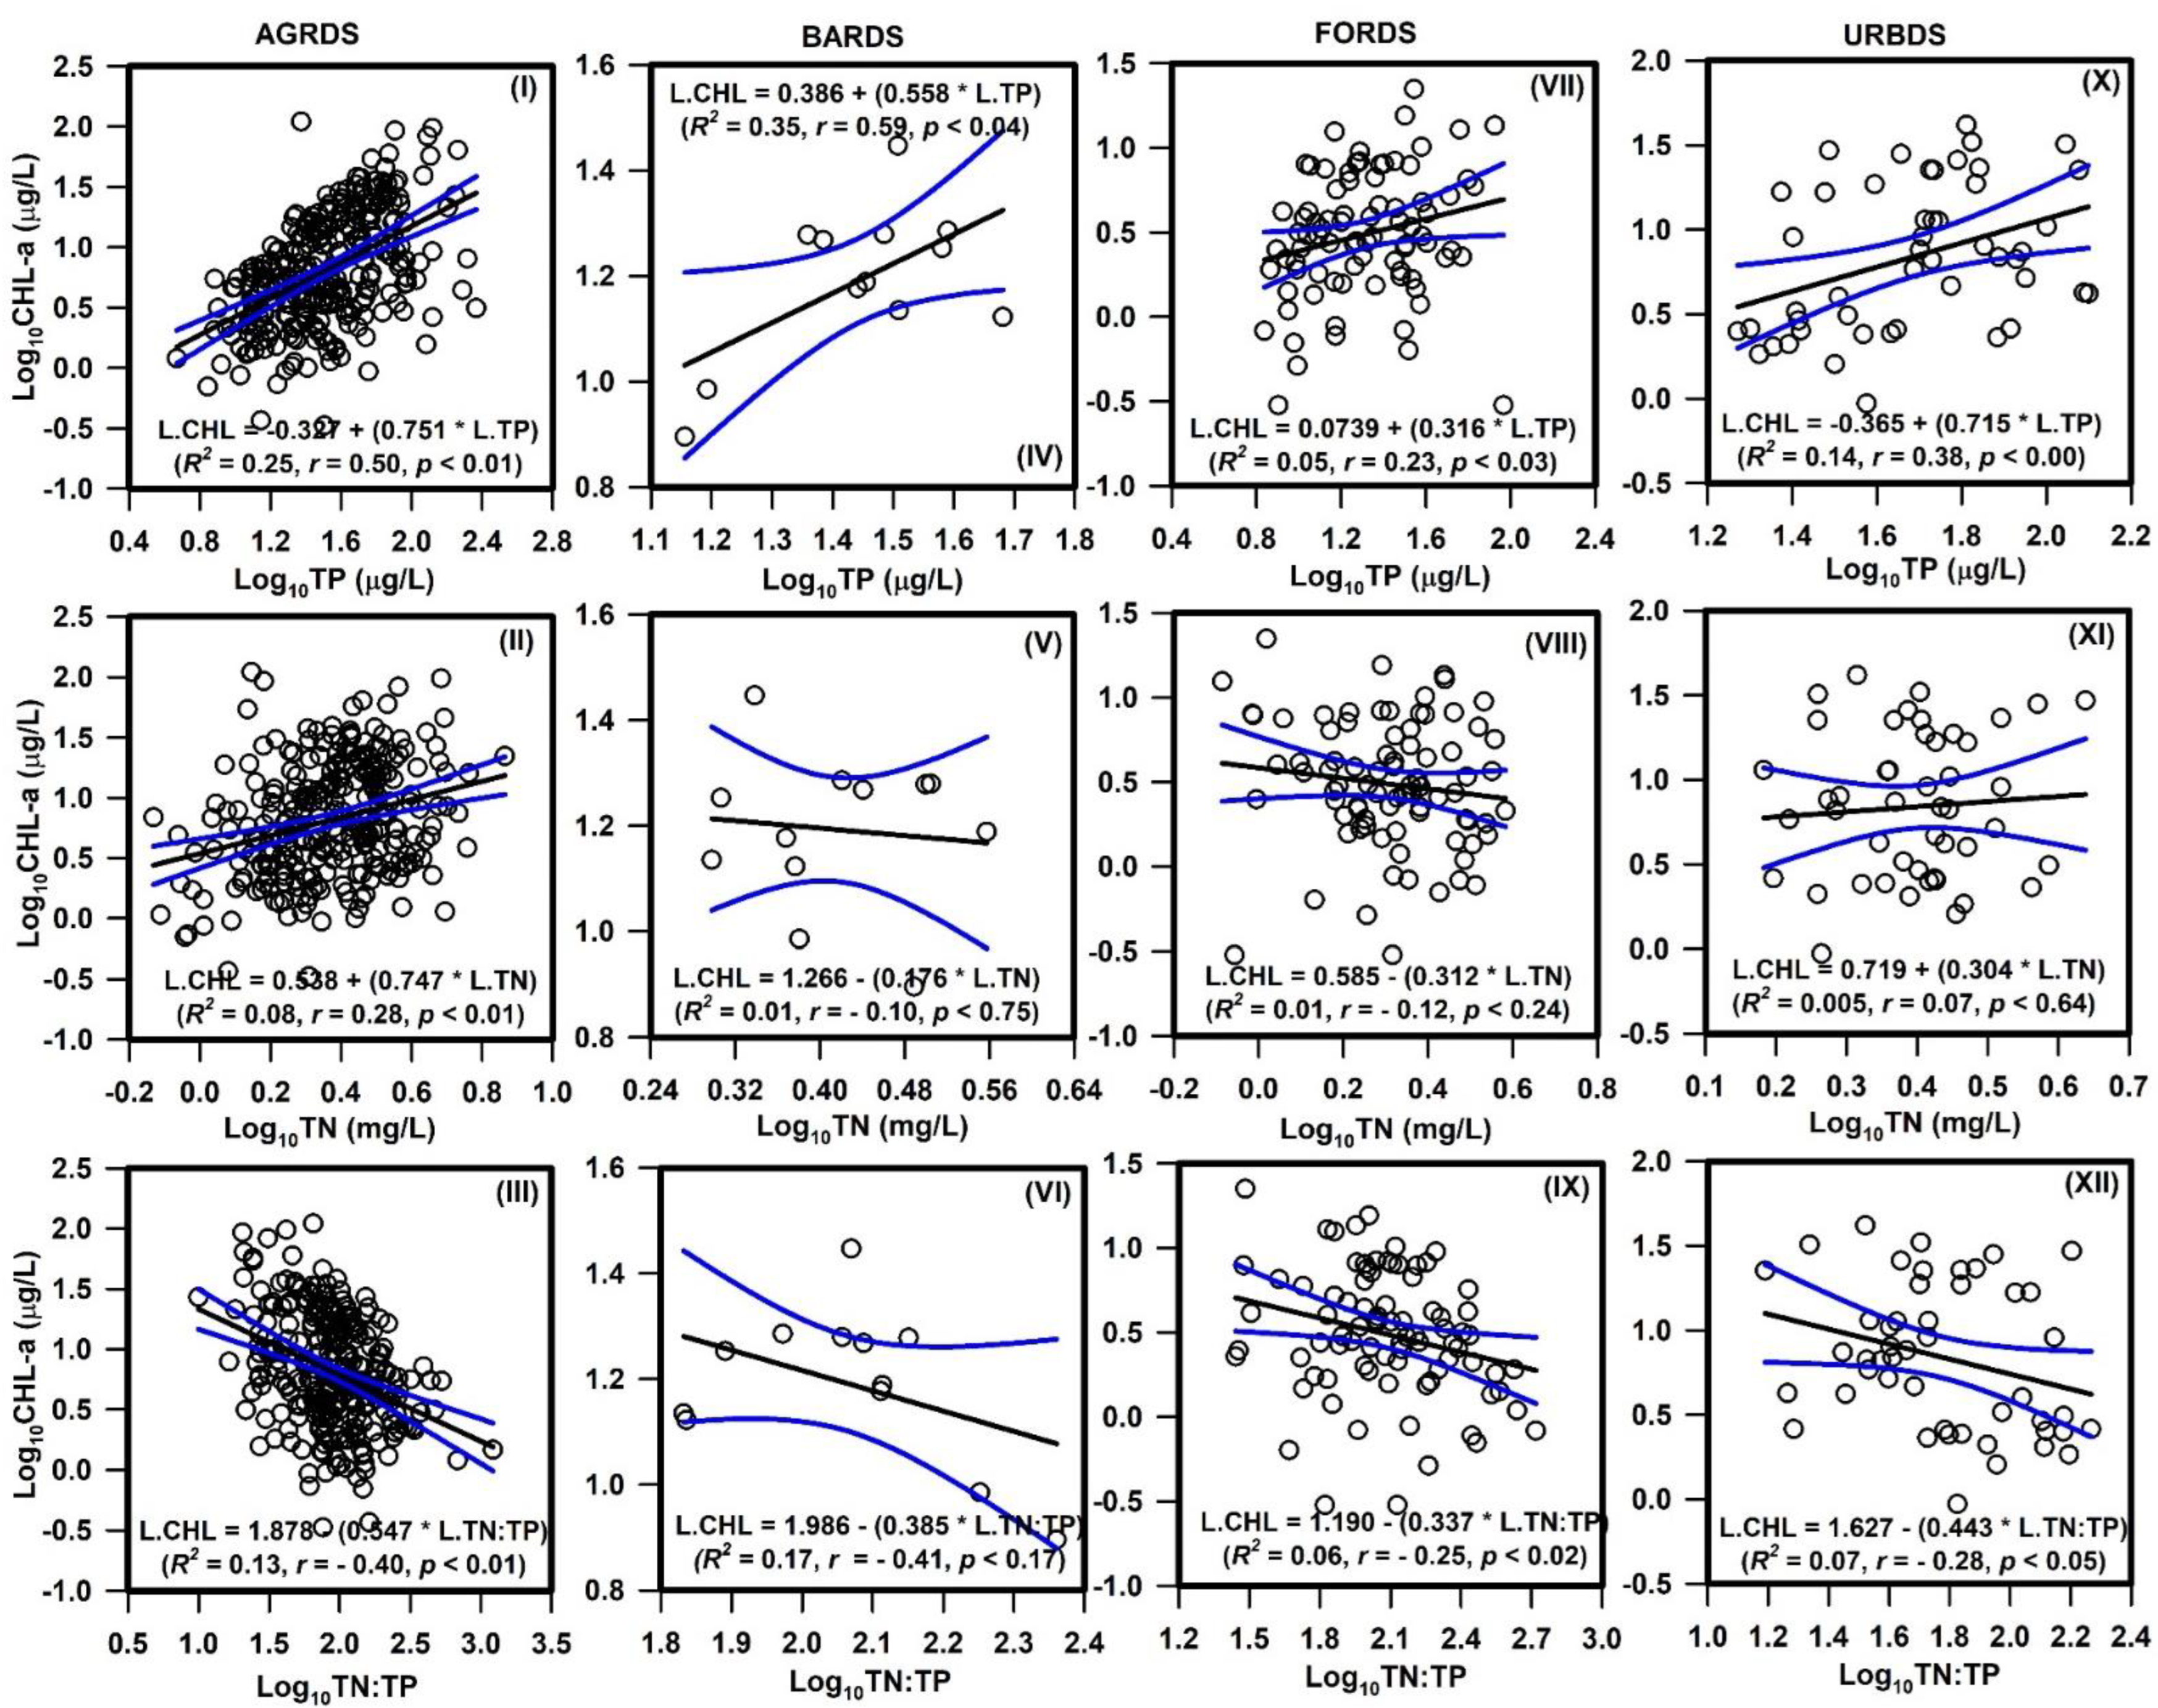
3.2. Relationships between Nutrients and CHL-a

Regression analyses indicated the TP was a stronger predictor of CHL-a concentrations than TN or TN:TP (Figure 5). Agricultural (R2 = 0.25, p < 0.01) and barren land (R2 = 0.35, p < 0.04) sites showed significant positive relationships between TP and CHL-a, as did forest (R2 = 0.05, p < 0.03) and urban (R2 = 0.14, p < 0.00) sites. However, a significant negative relationship was found between TN:TP and CHL-a, with TN:TP explaining 13% and 7% of the variance in agricultural and urban sites, respectively. The TN:TP ratio was used as a predictor variable in regression analyses to explain nutrient limitations for algal CHL-a, wherein a larger TN:TP ratio should indicate a greater risk for P limitation. We found that as the TN:TP ratio increased, there was a considerable decrease in CHL-a, which indicates P limitation.

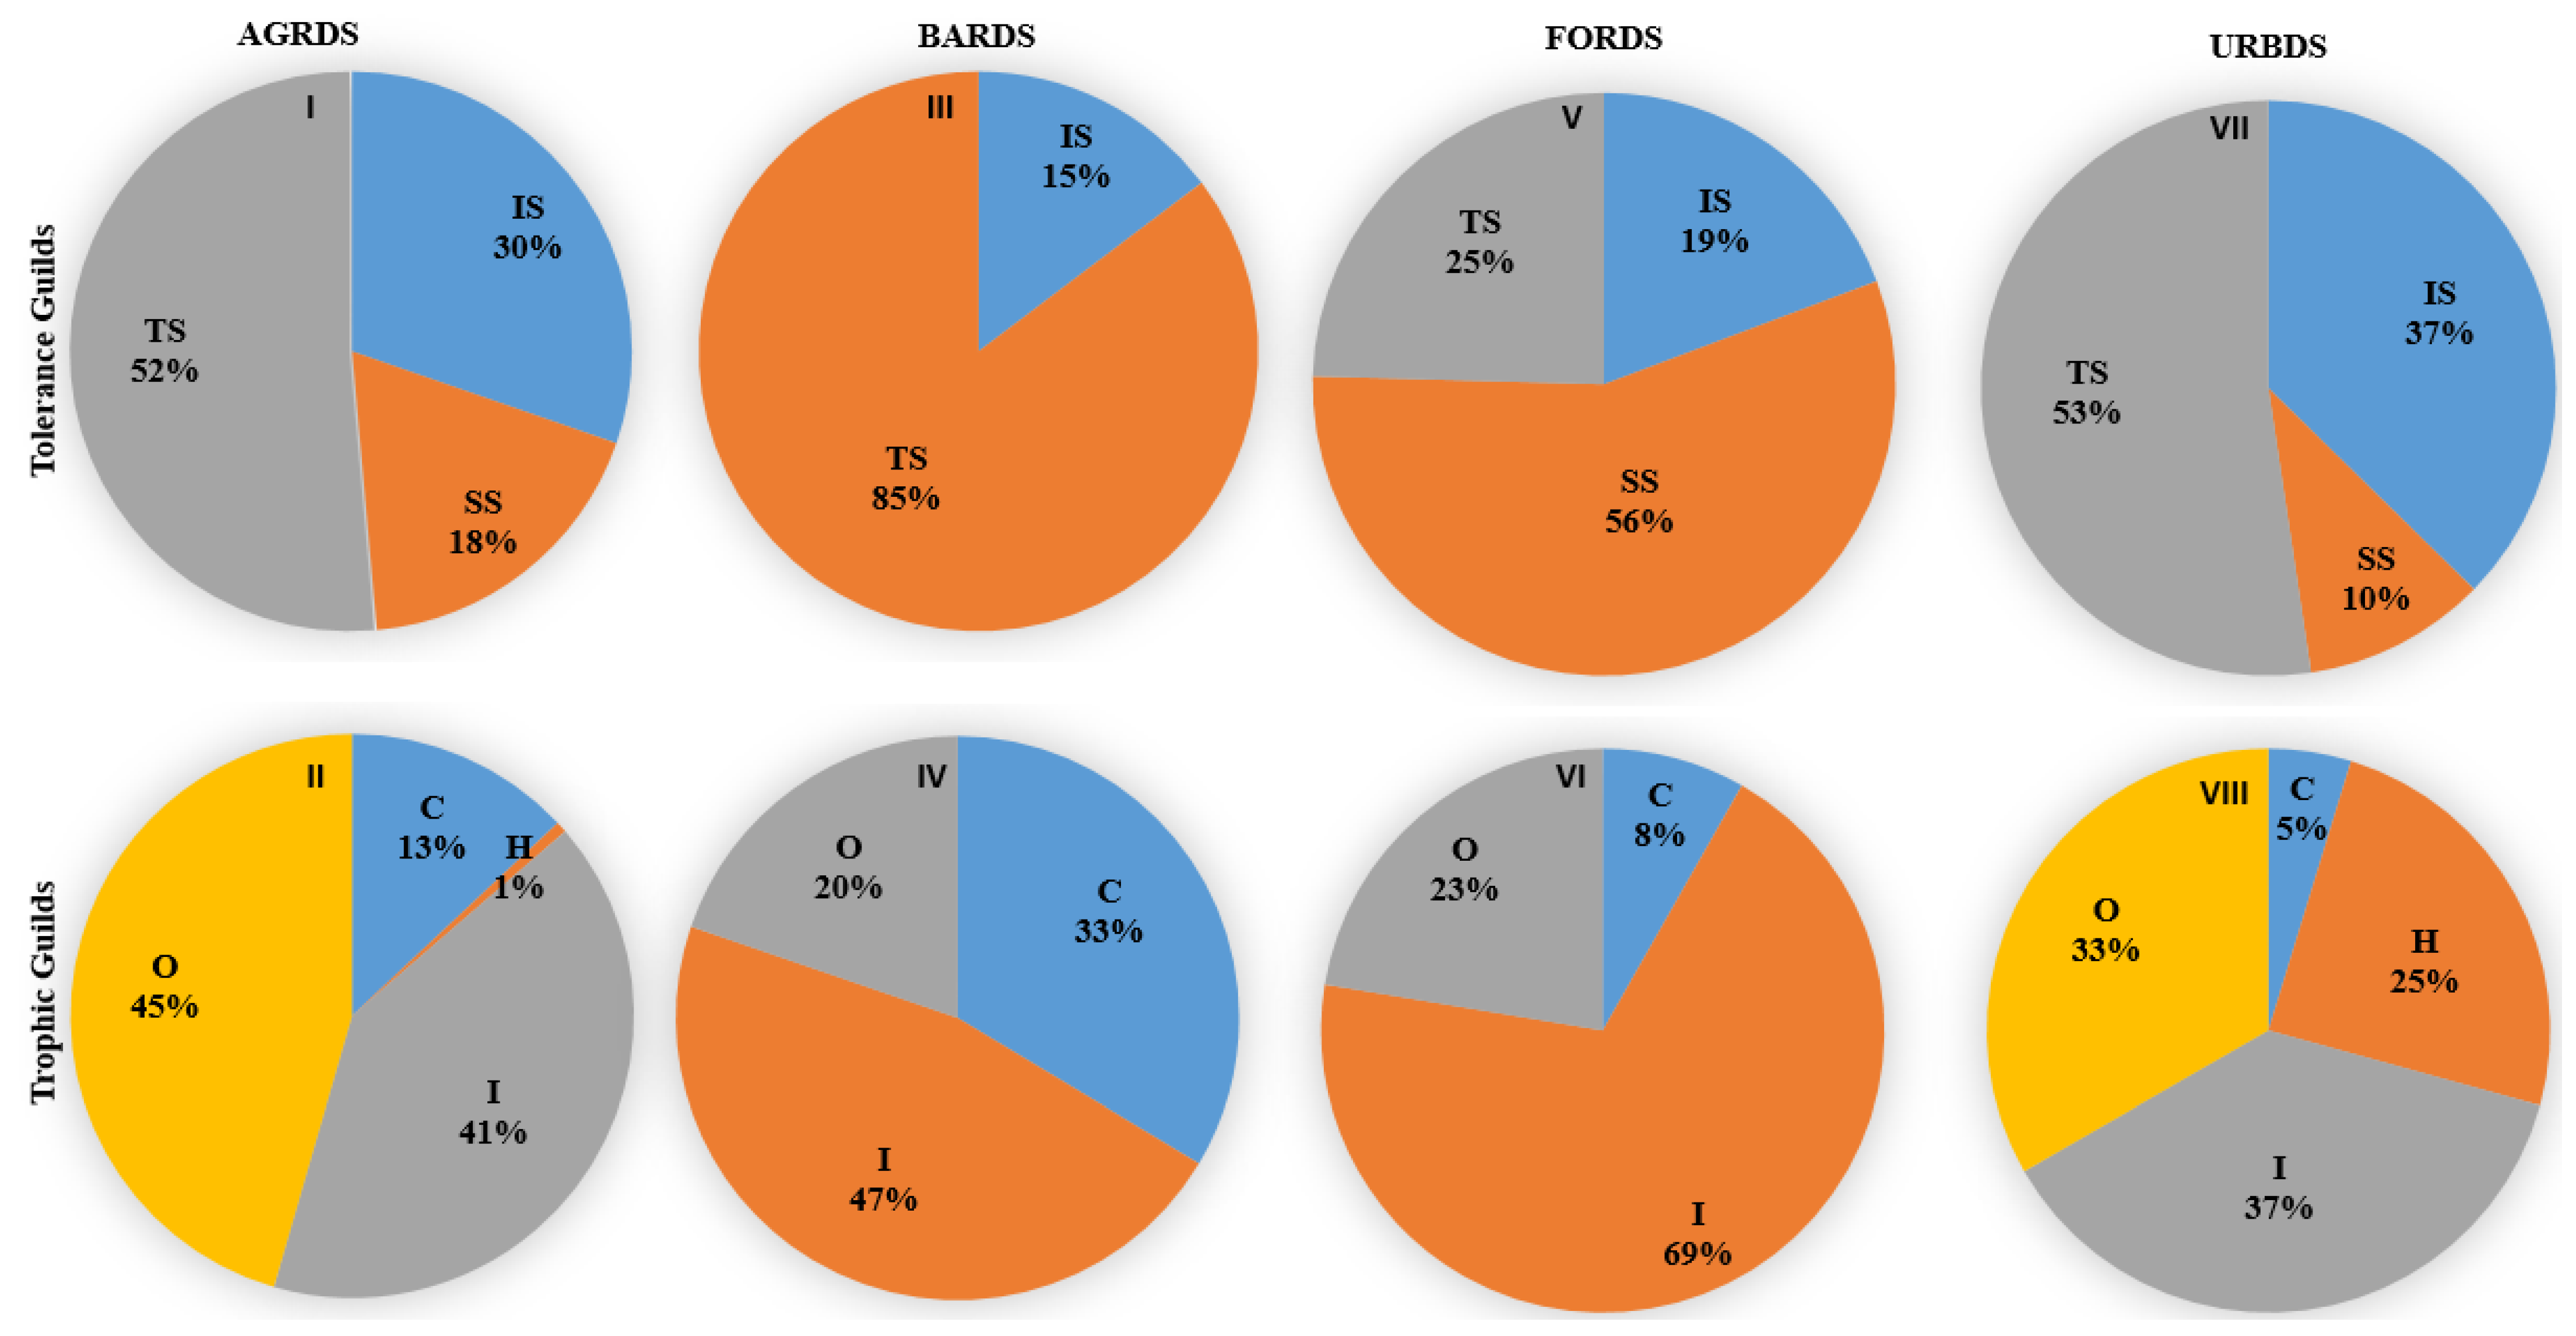
3.3. Spatial Variation in Fish Guilds and Community Composition

There was substantial spatial variation in fish guild structures among the four land use types (Figure 6). Tolerant species dominated the fish community in agricultural (52%), barren land (85%), and urban (53%) sites, but sensitive species dominated the community in forest sites (56%). The relative abundance of insectivore fish species was higher than that of omnivores and carnivores in the barren land, forest, and urban sites; omnivorous species were more prevalent in the agricultural sites. Analyses of fish community composition indicated that Zacco platypus was the dominant species across the study area, with 2416 individuals captured and a relative abundance of 23.42% (Table 3). Based on relative abundance, the most abundant fish species (in decreasing order) were Zacco platypus, Zacco koreanus, Opsarichthys uncirostris, Pseudogobio esocinus, Lepomis macrochirus, Pungtungia herzi, and Micropterus salmoides, which collectively accounted for 64.05% of all captured fish. Two of these species, L. macrochirus and M. salmoides, are exotic and have been designated “ecologically disturbing species” in Korea by the MOE [44]. Two endangered fish species, Cottus hangiongensis and Koreocobitis naktongensis, were observed during the study period.

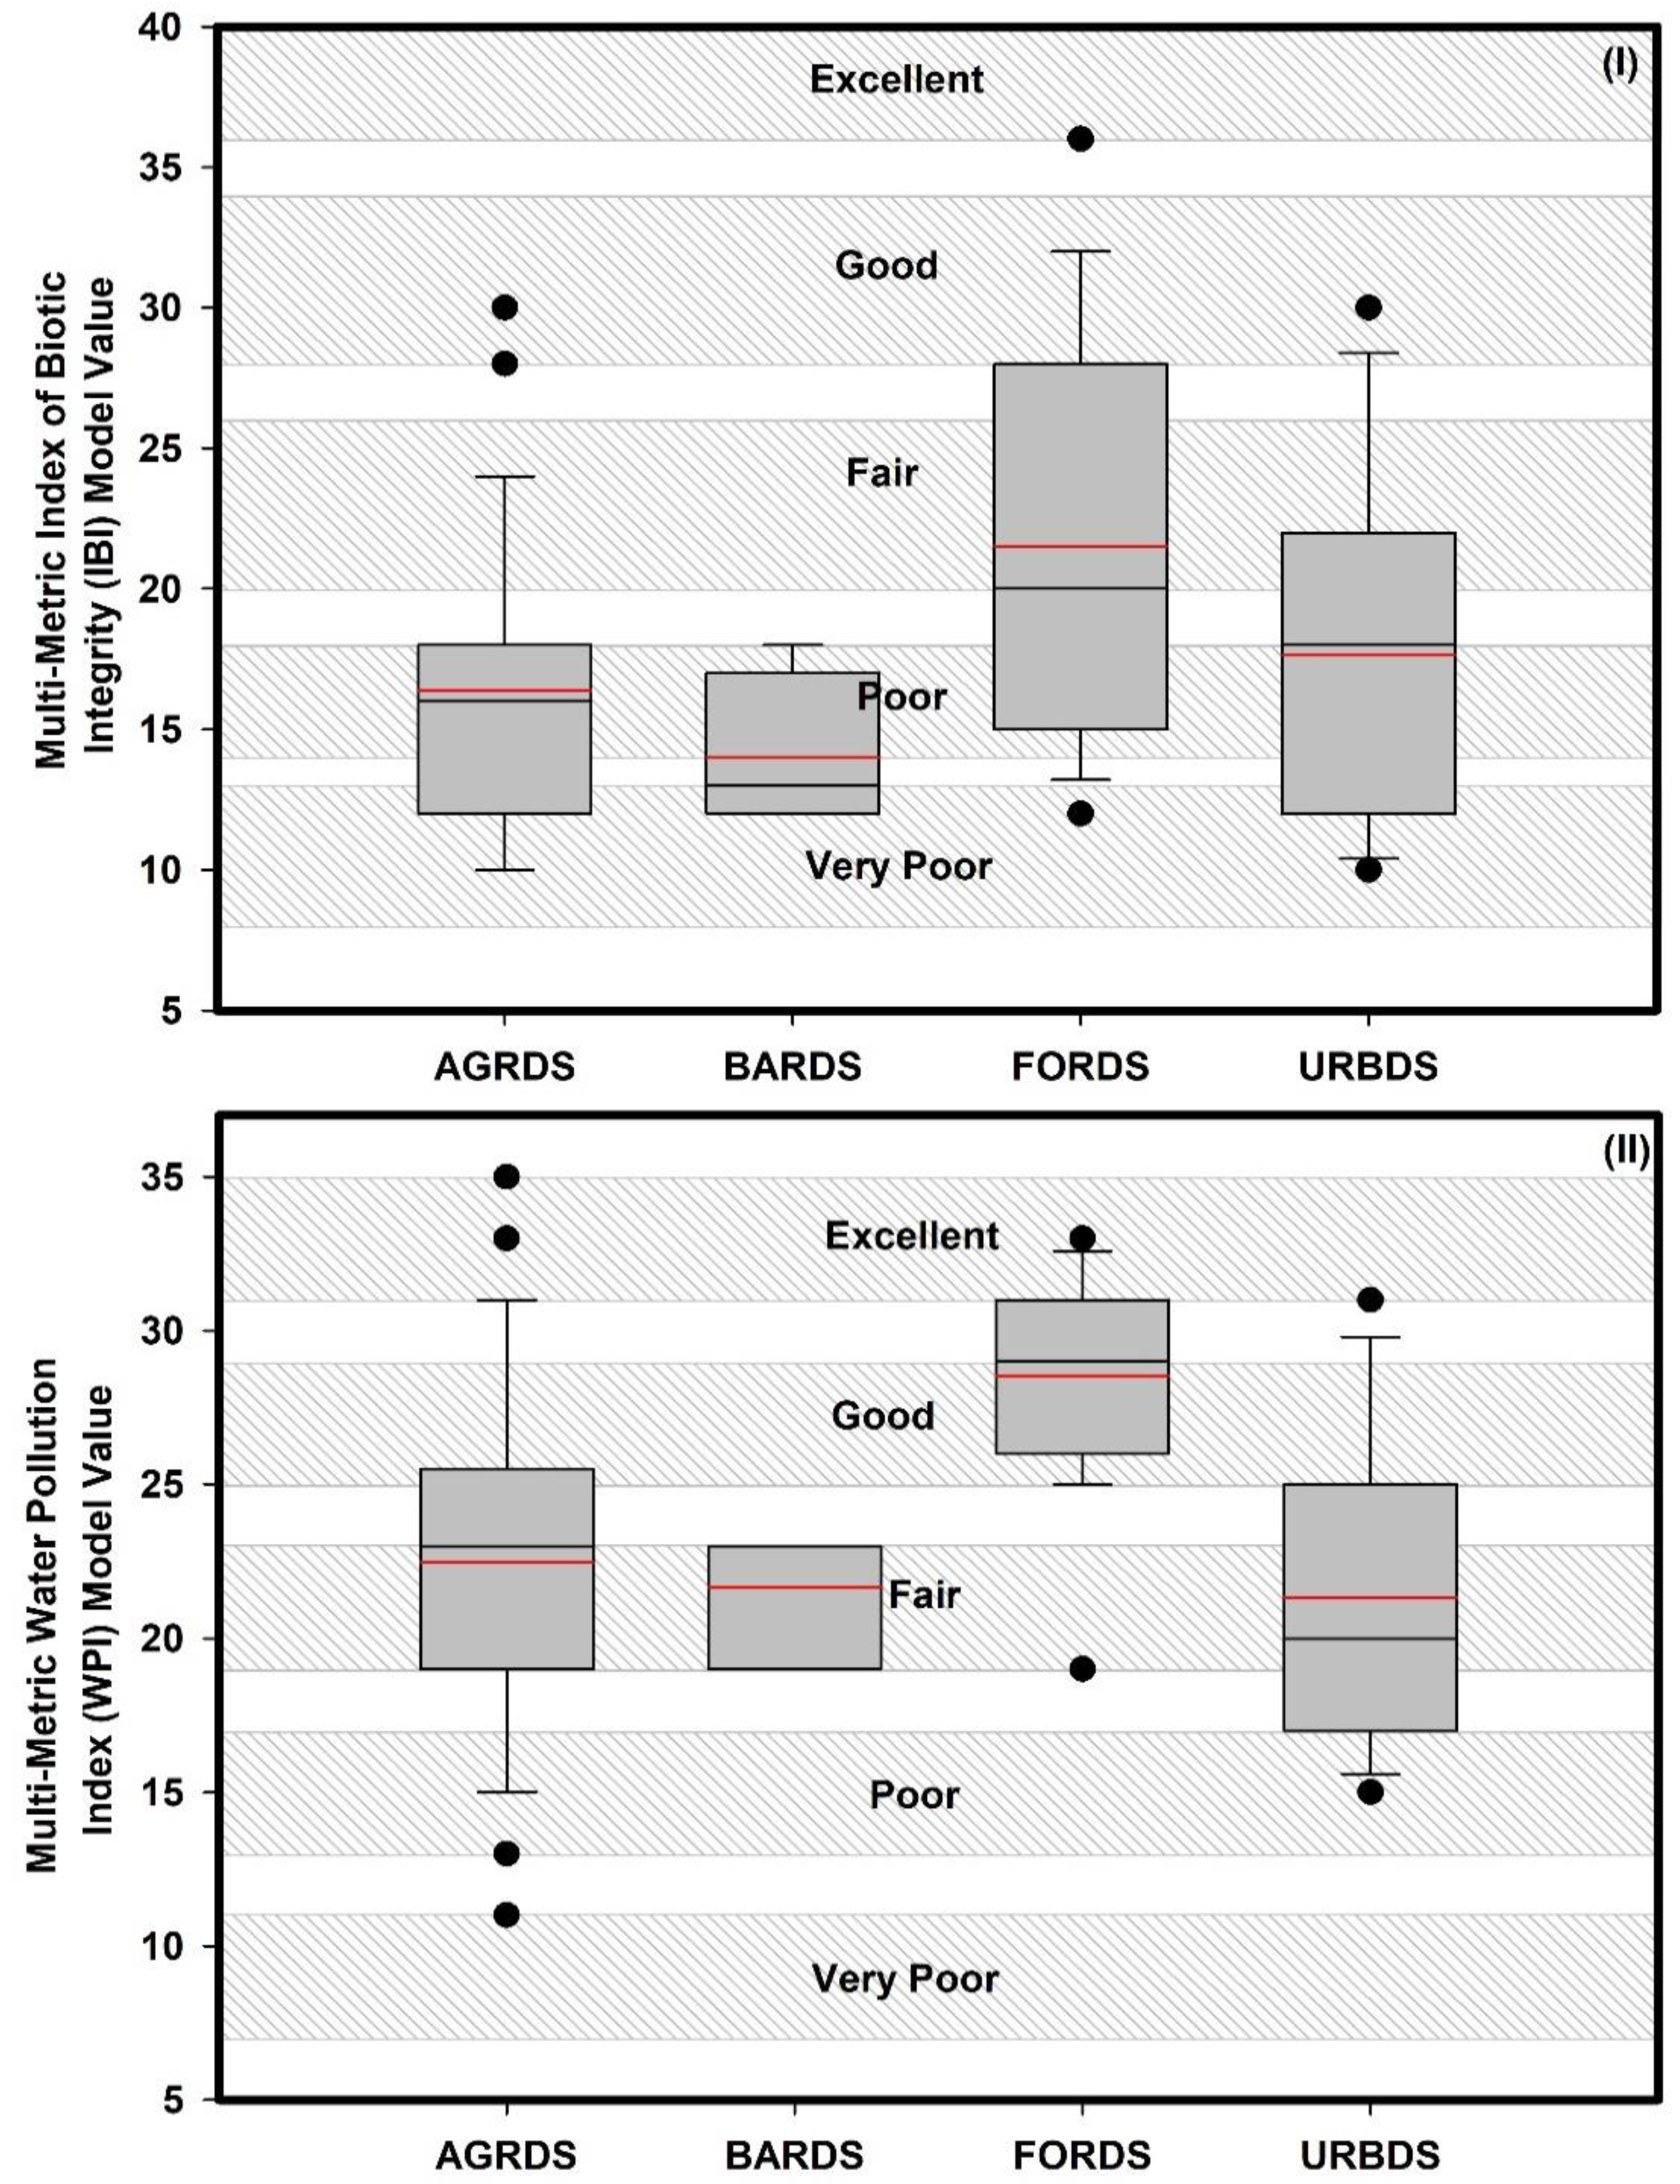
3.4. Chemical and Biological Health

The chemical and biological health of the river basin varied significantly among the four land use categories (Figure 7, Supplementary Information Tables S1 and S2). Based on mean WPI scores, the chemical health of the river was fair in agricultural (22), barren land (21), and urban areas (21) but good in forested areas (28). Mean IBI scores indicated poor biological health in agricultural (16), barren land (14), and urban sites (17), characterized by the dominance of omnivores, tolerant species, and habitat generalists; few top carnivores; depressed growth rates and fish conditions; and the presence of hybrids and diseased fish. The biological health of the forest region was only fair (21), with signs of community deterioration, including the loss of sensitive fish species, reduced richness, highly skewed trophic structures (increased frequency of omnivores, sunfish, and other tolerant species), and the rarity of older age classes among top predatory species.

3.5. Correlations between Water Quality and Human Disturbance and Fish Guilds, WPI, and IBI

Nutrient, organic matter, and primary productivity metrics were related to the relative abundance of fish trophic and tolerance guilds (Table 4). The relative abundance of herbivorous, insectivorous, and carnivorous species was negatively correlated with TP, TN, BOD, COD, and CHL-a, but these metrics were positively correlated with the relative abundance of omnivorous species. Sensitive and intermediate species decreased when nutrients, organic matter, and CHL-a increased, whereas tolerant species increased. IBI values decreased when TP (r = −0.12), TN (r = −0.03), BOD (r = −0.12), COD (r = −0.07), and CHL-a (r = −0.13) increased. Our results suggested a significant negative association between HMITS and WPI (r = −0.34) and IBI (r = −0.21; Figure 8).

4. Discussion

4.1. Land Cover Type, Monsoons, and Water Quality

Land cover affects lotic systems and their associated watersheds [21,45,46]; it is a crucial landscape component that alters the physicochemical features of rivers [47]. Researchers have long recognized that streams and rivers are impacted primarily by their surrounding land cover [45,48]. The types of land cover present within a river catchment control the transport of TP, TN, BOD, COD, and TSS to recipient waters by modifying surface- and groundwater flows, organic matter inputs, and atmospheric deposition [46,47]. The present study found that land cover type was a strong predictor of river water quality. In the forest sites, river water had low nutrient, organic matter, suspended solid, ion, and algal chlorophyll concentrations; these concentrations were higher in agricultural, urban, and barren land areas. Many other studies have reported a tendency for improved water quality in forested regions relative to regions with other land cover types [7,8,15,21]. For example, increases in TN, TP, BOD, COD, TSS, EC, and CHL-a in river water have all been directly linked to increases in agricultural and urban land use, and reductions in these same parameters have been linked to increases in forest cover [15,21,23,45]. The proportion of agricultural and urban land cover at the watershed scale is an important predictor of nutrient and organic matter, which in turn influences algal productivity in the water body [8,45].
More than 60% of Asia’s annual precipitation falls during the summer monsoon season [8,11]. This weather cycle results in water quality patterns at seasonal and annual scales intimately tied to river ecosystems’ longitudinal morphology. The summer monsoon determines the flow regime in the Asian lotic system; it decreases water residence time and regulates nutrients, organic matter, ion levels, suspended particle loadings, and algal growth. Summer monsoons also substantially affect an ecosystem’s functional connections between water quality elements. The present results found that TP, TSS, BOD, COD, and CHL-a concentrations were greater in summer than in other seasons, which indicates that the summer monsoon may impact water quality in the Nakdong River basin.
The elevated TSS concentrations we observed throughout the summer months are attributed to an increase in TP concentration. TP, TSS, and COD input are linked to flow regimes in Asian river basins [49,50,51]. Therefore, increased TP input during the monsoon season may affect algal growth in rivers. In addition, because of seasonal effects, a strong negative relationship was observed between WT and DO. This inverse relationship is a product of the fact that warmer water absorbs oxygen more rapidly and stores less DO. Finally, the diluting effect of the summer monsoon decreased mean TN concentrations in the sampled river [8,11].

4.2. Nutrients and CHL-a Dynamics

According to Hutchinson [52], “Phosphorus is the most critical element for the biologist since it limits the biological productivity of any region of the earth’s surface more than the other major elements.” This assertion prompted the creation of empirical models containing trophic state variables that can be used for eutrophication management [5,53,54]. Earlier research on algal biomasses and nutrients focused on lentic habitats found that TP was the most important predictor of algal development [53]. This prediction has also been used in lotic systems; however, because of seasonality and the complicated relationships between water quality and environmental factors, TP is a poor indicator of algal growth in lotic water [55,56,57]. The association between TP and algal biomass in lotic systems is extremely unpredictable; consequently, it is inappropriate for eutrophication management. However, our findings suggest that TP can operate as a regulator of algal growth in agricultural and barren land areas, although the R2 values are low. These findings corroborate previous findings in other Korean river systems [58,59].
In addition, the TN:TP ratio has been used to define algal nutrient limitation status. P limitation is deemed more probable in systems with a greater TN:TP ratio [54]. The present study found a notable tendency for CHL-a concentrations to decrease as the TN:TP ratio increased, which implies significant P limitation in agricultural sites. In a review of 157 published studies, Yan et al. [60] reported that the TN:TP ratio is inversely linked with CHL-a worldwide.

4.3. The Impacts of Land Cover, Water Chemistry, and Human Disturbance on Fish Guilds, Chemical Health, and Biological Health

The catchment-scale relationships among land cover, fish guilds, and community structure are complex. Allan [61] noted that decreases in forest cover and increases in agricultural and urban cover adversely affect river water chemistry, habitats, and biota. This study found that tolerant species dominated the fish community in agricultural, barren land, and urban sites, but the community in the forest sites was dominated by sensitive species. These findings are consistent with previous results and suggest that forest sites have greater ecological integrity than different land use regimes. Trophic guild analyses indicated that omnivorous species dominated the community in agricultural areas, which is indicative of poor biological health. This study suggests that the two exotic fish species encountered, bluegill (L. macrochirus) and largemouth bass (M. salmoides), are influencing the biological structure of the river basin. Choi and Kim [62] suggested that these two exotic species are responsible for significant declines in the abundance of native species, including Pseudosbora parva and Opsariichthys uncirostris. They further noted that these two species dominate southeastern regions in Korea, occurring in approximately 70% of sites, with associated imbalances in diversity and food web structures at these locations.
This study found that the river’s chemical health was fair in the agricultural, barren land, and urban sites and good in the forest sites. The biological condition was poor in the agricultural, barren land, and urban sites and fair in the forest sites. Extensive research has shown that poor chemical and biological health directly indicates increased agricultural and urban land cover [7,21,45,63]. Wang et al. [64] suggested that the amount of impervious area within urban land cover may be the most significant predictor of fish assemblages and significantly impact fish and river health. Numerous studies on urban rivers have shown that river conditions respond nonlinearly to impervious surfaces, and severe degradation occurs in 15–25% of rivers in areas with urban land cover [65]. Many research studies have shown that biological health improves when forest cover increases within the basin [8,19,21,63].
Fish trophic and tolerance guilds have been used to estimate the influence of change in water quality on the riverine food chain and biological integrity. We found that nutrient enrichment, organic pollution, and algal blooms enhanced the mean relative abundance of omnivorous fish species. A similar relationship was observed for tolerant species. As a consequence, the relative abundance of sensitive and intermediate species declined with increasing TP, TN, BOD, COD, and CHL-a. These findings support the hypothesis that increases in tolerant and omnivorous species damage the ecological quality of a river basin and contribute to the extinction of sensitive species [12,66]. Overall, the relationships we found between biological health and chemical parameters and fish trophic and tolerance guild compositions suggest that river or stream health is closely related to nutrient enrichment, organic pollution, and algal growth. Furthermore, the chemical and biological health of the river basin was negatively related to the extent of human disturbance, which suggests that anthropogenic disruption has a greater impact on ecological integrity than other factors. These findings align with those of previous studies indicating that the ecological integrity of freshwater systems is strongly linked with indices of human disturbance [2,5,19,31,32].

5. Conclusions

Changes in land-use practices and human activity are emerging issues concerning the ecological integrity and preservation of the lotic ecosystem in South Korea. This study demonstrates that riverine ecosystems are particularly vulnerable to land cover type and anthropogenic activities. The current results provide important insight into how land cover and human disturbance metrics relate to water quality, fish guilds, and chemical and biological health in a temperate monsoon river basin. Land cover type was a major determinant of the water quality in the river basin. Forest sites had low nutrient, organic matter, suspended solid, ion, and algal chlorophyll concentrations; these concentrations were higher in agricultural, urban, and barren land areas. The summer monsoon season regulated nutrients, organic matter, ion levels, suspended particle loadings, and algal growth in the river basin. The present results suggest that TP can be a useful predictor of algal growth in agricultural (R2 = 0.25) and barren land (R2 = 0.25) sites. Fish community analyses indicated that tolerant species dominated the fish community in the agricultural (52%), barren land (85%), and urban sites (53%), but sensitive species dominated in the forest sites (56%). Omnivorous species (45%) dominated the community in agricultural areas, which is indicative of poor biological health. The relative abundance of carnivorous, herbivorous, sensitive, and intermediate fish species declined with increasing TP, TN, BOD, COD, and CHL-a concentrations. Overall, the findings indicate that the chemical and biological integrity of the Nakdong River basin is being degraded because of human disturbance.

Supplementary Materials

The following supporting information can be downloaded at: https://www.mdpi.com/article/10.3390/land11091428/s1, Table S1: Chemical health assessment based on multi-metric water pollution index (WPI) model in the Nakdong River basin; Table S2: Biological health assessment based on the multi-metric index of biotic integrity (IBI) model in the Nakdong River basin.

Author Contributions

Conceptualization, M.M.; methodology, M.M.; software, M.M.; validation, M.M.; formal analysis, M.M.; investigation, M.M., J.-E.K.; resources, M.M., J.-E.K.; data curation, M.M., J.-E.K.; writing—original draft preparation, M.M.; writing—review and editing, M.M.; visualization, M.M.; supervision, K.-G.A.; project administration, K.-G.A.; funding acquisition, K.-G.A. All authors have read and agreed to the published version of the manuscript.

Funding

This work was supported by Korea Environment Industry & Technology Institute (KEITI) through the Aquatic Ecosystem Conservation Research Program, funded by the Korea Ministry of Environment (MOE) (2020003050004).

Institutional Review Board Statement

Not applicable.

Informed Consent Statement

Not applicable.

Data Availability Statement

The data may be available upon request to the corresponding author; however, they are subject to approval from the funding agency.

Acknowledgments

This paper acknowledges the Korea Environment Industry and Technology Institute (KEITI) for their funding and also acknowledges Daejeon Green Environment Center (Yr. 2019) for partial data support.

Conflicts of Interest

The authors declare no conflict of interest.

References

  1. Wetzel, R.G. Limnology Lake and River Ecosystem; Academic Press: Cambridge, MA, USA, 2001; ISBN 9780127447605. [Google Scholar]
  2. Wang, Q.; Li, Y.; Liu, L.; Cui, S.; Liu, X.; Chen, F.; Jeppessen, E. Human impact on current environmental state in Chinese lakes. J. Environ. Sci. 2022, 126, 297–307. [Google Scholar] [CrossRef]
  3. Karr, J.R. Defining and measuring river health. Freshw. Biol. 1999, 41, 221–234. [Google Scholar] [CrossRef]
  4. Allan, J.D.; Castillo, M.M. Stream Ecology: Structure and Function of Running Waters: Second edition. In Stream Ecology; Springer: Berlin/Heidelberg, Germany, 2007; pp. 1–436. [Google Scholar] [CrossRef]
  5. Dodds, W.K.; Smith, V.H. Nitrogen, phosphorus, and eutrophication in streams. Inl. Waters 2016, 6, 155–164. [Google Scholar] [CrossRef]
  6. Wang, L.; Lyons, J.; Kanehl, P.; Bannerman, R. Impacts of urbanization on stream habitat and fish across multiple spatial scales. Environ. Manag. 2001, 28, 255–266. [Google Scholar] [CrossRef] [PubMed]
  7. Mamun, M.; An, K.-G. Ecological health assessments of 72 streams and rivers in relation to water chemistry and land-use patterns in South Korea. Turk. J. Fish. Aquat. Sci. 2018, 18, 871–880. [Google Scholar] [CrossRef]
  8. Choi, J.W.; Han, J.H.; Park, C.S.; Ko, D.G.; Kang, H.I.; Kim, J.Y.; Yun, Y.J.; Kwon, H.H.; An, K.G. Nutrients and sestonic chlorophyll dynamics in Asian lotic ecosystems and ecological stream health in relation to land-use patterns and water chemistry. Ecol. Eng. 2015, 79, 15–31. [Google Scholar] [CrossRef]
  9. Jones, J.R.; Knowlton, M.F.; An, K.G. Trophic state, seasonal patterns and empirical models in South Korean Reservoirs. Lake Reserv. Manag. 2003, 19, 64–78. [Google Scholar] [CrossRef]
  10. An, K.G.; Park, S.S.; Shin, J.Y. An evaluation of a river health using the index of biological integrity along with relations to chemical and habitat conditions. Environ. Int. 2002, 28, 411–420. [Google Scholar] [CrossRef]
  11. Kim, J.Y.; An, K.G. Integrated ecological river health assessments, based on water chemistry, physical habitat quality and biological integrity. Water 2015, 7, 6378–6403. [Google Scholar] [CrossRef] [Green Version]
  12. An, K.G.; Kim, D.S.; Kong, D.S.; Kim, S.D. Integrative assessments of a temperate stream based on a multimetric determination of biological integrity, physical habitat evaluations, and toxicity tests. Bull. Environ. Contam. Toxicol. 2004, 73, 471–478. [Google Scholar] [CrossRef]
  13. Miserendino, M.L.; Casaux, R.; Archangelsky, M.; Di Prinzio, C.Y.; Brand, C.; Kutschker, A.M. Assessing land-use effects on water quality, in-stream habitat, riparian ecosystems and biodiversity in Patagonian northwest streams. Sci. Total Environ. 2011, 409, 612–624. [Google Scholar] [CrossRef] [PubMed]
  14. Pacheco-Díaz, R.I.; Schmitter-Soto, J.J.; Schmook, B.; Islebe, G.A.; Weissenberger, H. Land use and biotic integrity in shallow streams of the Hondo River basin, Yucatan Peninsula, Mexico. Rev. Biol. Trop. 2017, 65, 1448. [Google Scholar] [CrossRef]
  15. Atique, U.; An, K.G. Landscape heterogeneity impacts water chemistry, nutrient regime, organic matter and chlorophyll dynamics in agricultural reservoirs. Ecol. Indic. 2020, 110, 105813. [Google Scholar] [CrossRef]
  16. Mamun, M.; An, K.G. Stream health assessment using chemical and biological multi-metric models and their relationships with fish trophic and tolerance indicators. Ecol. Indic. 2020, 111, 106055. [Google Scholar] [CrossRef]
  17. Mamun, M.; An, K.G. The application of chemical and biological multi-metric models to a small urban stream for ecological health assessments. Ecol. Inform. 2019, 50, 1–12. [Google Scholar] [CrossRef]
  18. Kim, J.H.; Oh, H.M.; Kim, I.S.; Lim, B.J.; An, K.G. Ecological health assessments of an urban lotic ecosystem using a multimetric model along with physical habitat and chemical water quality assessments. Int. J. Environ. Res. 2013, 7, 659–668. [Google Scholar]
  19. Karr, J.R.; Larson, E.R.; Chu, E.W. Ecological integrity is both real and valuable. Conserv. Sci. Pract. 2022, 4, e583. [Google Scholar] [CrossRef]
  20. Walters, D.M.; Leigh, D.S.; Bearden, A.B. Urbanization, sedimentation, and the homogenization of fish assemblages in the Etowah River Basin, USA. Hydrobiologia 2003, 494, 5–10. [Google Scholar] [CrossRef]
  21. Allan, J.D. Landscapes and Riverscapes: The Influence of Land Use on Stream Ecosystems. Annu. Rev. Ecol. Evol. Syst. 2004, 35, 257–284. [Google Scholar] [CrossRef]
  22. Wohl, E. Mountain Rivers. Water Resources Monograph 14; American Geophysical Union: Washington, DC, USA, 2000; ISBN 9781118665800. [Google Scholar]
  23. Wang, L.; Lyons, J.; Kanehl, P. Impacts of Urban Land Cover on Trout Streams in Wisconsin and Minnesota. Trans. Am. Fish. Soc. 2003, 132, 825–839. [Google Scholar] [CrossRef]
  24. Atique, U.; An, K.G. Stream health evaluation using a combined approach of multi-metric chemical pollution and biological integrity models. Water 2018, 10, 661. [Google Scholar] [CrossRef]
  25. Kraemer, S.A.; Barbosa da Costa, N.; Shapiro, B.J.; Fradette, M.; Huot, Y.; Walsh, D.A. A large-scale assessment of lakes reveals a pervasive signal of land use on bacterial communities. ISME J. 2020, 14, 3011–3023. [Google Scholar] [CrossRef] [PubMed]
  26. Marmen, S.; Blank, L.; Al-Ashhab, A.; Malik, A.; Ganzert, L.; Lalzar, M.; Grossart, H.P.; Sher, D. The Role of Land Use Types and Water Chemical Properties in Structuring the Microbiomes of a Connected Lake System. Front. Microbiol. 2020, 11, 89. [Google Scholar] [CrossRef] [PubMed]
  27. Huang, J.; Zhang, Y.; Bing, H.; Peng, J.; Dong, F.; Gao, J.; Arhonditsis, G.B. Characterizing the river water quality in China: Recent progress and on-going challenges. Water Res. 2021, 201, 117309. [Google Scholar] [CrossRef] [PubMed]
  28. Wang, M.; Bao, K.; Heathcote, A.J.; Zhu, Q.; Cheng, G.; Li, S.; Zhang, C. Spatio-temporal pattern of metal contamination in Chinese lakes since 1850. Catena 2021, 196, 104918. [Google Scholar] [CrossRef]
  29. Li, Z.; Zhang, R.; Liu, C.; Zhang, R.; Chen, F.; Liu, Y. Phosphorus spatial distribution and pollution risk assessment in agricultural soil around the Danjiangkou reservoir, China. Sci. Total Environ. 2020, 699, 134417. [Google Scholar] [CrossRef]
  30. Kennedy, C.M.; Oakleaf, J.R.; Theobald, D.M.; Baruch-Mordo, S.; Kiesecker, J. Managing the middle: A shift in conservation priorities based on the global human modification gradient. Glob. Chang. Biol. 2019, 25, 811–826. [Google Scholar] [CrossRef]
  31. Dodds, W.K.; Perkin, J.S.; Gerken, J.E. Human impact on freshwater ecosystem services: A global perspective. Environ. Sci. Technol. 2013, 47, 9061–9068. [Google Scholar] [CrossRef]
  32. Venter, O.; Sanderson, E.W.; Magrach, A.; Allan, J.R.; Beher, J.; Jones, K.R.; Possingham, H.P.; Laurance, W.F.; Wood, P.; Fekete, B.M.; et al. Sixteen years of change in the global terrestrial human footprint and implications for biodiversity conservation. Nat. Commun. 2016, 7, 12558. [Google Scholar] [CrossRef]
  33. Sanderson, E.W.; Jaiteh, M.; Levy, M.A.; Redford, K.H.; Wannebo, A.V.; Woolmer, G. The human footprint and the last of the wild. Bioscience 2002, 52, 891–904. [Google Scholar] [CrossRef] [Green Version]
  34. Venter, O.; Sanderson, E.W.; Magrach, A.; Allan, J.R.; Beher, J.; Jones, K.R.; Possingham, H.P.; Laurance, W.F.; Wood, P.; Fekete, B.M.; et al. Global terrestrial Human Footprint maps for 1993 and 2009. Sci. Data 2016, 3, 160067. [Google Scholar] [CrossRef]
  35. Karr, J.R. Assessment of Biotic Integrity Using Fish Communities. Fisheries 1981, 6, 21–27. [Google Scholar] [CrossRef]
  36. Snyder, C.D.; Young, J.A.; Villella, R.; Lemarié, D.P. Influences of upland and riparian land use patterns on stream biotic integrity. Landsc. Ecol. 2003, 18, 647–664. [Google Scholar] [CrossRef]
  37. An, K.; Lee, J.; Bae, D.; Ja-hyun, K.; Hwang, S.-J.; Won, D.-H.; Lee, J.-K.; Kim, C.-S. Ecological Assessments of Aquatic Environment using Multi-metric Model in Major Nationwide Stream Watersheds. J. Korean Soc. Water Environ. 2006, 22, 796–804. [Google Scholar]
  38. Mamun, M.; Jargal, N.; Atique, U.; An, K. Ecological River Health Assessment Using Multi-Metric Models in an Asian Temperate Region with Land Use/Land Cover as the Primary Factor Regulating Nutrients, Organic Matter, and Fish Composition. Int. J. Environ. Res. Public Health 2022, 19, 9305. [Google Scholar] [CrossRef]
  39. Karr, J.R. Biological Integrity: A Long-Neglected Aspect of Water Resource Management. Ecol. Appl. 1991, 1, 66–84. [Google Scholar] [CrossRef]
  40. Shin, W.J.; Ryu, J.S.; Min, J.S.; Lee, K.S. Identification of sources affecting water chemistry in the Nakdong River, South Korea. Environ. Earth Sci. 2017, 76, 376. [Google Scholar] [CrossRef]
  41. MOE. Standard Methods for the Examination of Water Quality Contamination, 7th ed.; Ministry of Environemnt (MOE): Gwacheon, Korea, 2000; p. 435. (In Korean)
  42. Ohio, E. Biological Criteria for the Protection of Aquatic Life. Standardized Biological Field Assessment of Ohio Surface Waters; EPA: Columbus, OH, USA, 1989; Volume III.
  43. An, K.-G.; Jung, S.-H.; Choi, S.-S. An Evaluation on Health Conditions of Pyong-Chang River using the Index of Biological Integrity (IBI) and Qualitative Habitat Evaluation Index (QHEI). Korean J. Limnol. 2001, 34, 153–165. [Google Scholar]
  44. Choi, J.Y.; Kim, S.K.; Kim, J.C.; Yun, J.H. Invasion and dispersion of the exotic species procambarus clarkii (Decapoda cambaridae) in yeongsan river basin, south korea. Animals 2021, 11, 3489. [Google Scholar] [CrossRef]
  45. Allan, J.D.; Erickson, D.L.; Fay, J. The influence of catchment land use on stream integrity across multiple spatial scales. Freshw. Biol. 1997, 37, 149–161. [Google Scholar] [CrossRef]
  46. Hamid, A.; Bhat, S.U.; Jehangir, A. Local determinants influencing stream water quality. Appl. Water Sci. 2020, 10, 24. [Google Scholar] [CrossRef]
  47. Brogna, D.; Dufrêne, M.; Michez, A.; Latli, A.; Jacobs, S.; Vincke, C.; Dendoncker, N. Forest cover correlates with good biological water quality. Insights from a regional study (Wallonia, Belgium). J. Environ. Manag. 2018, 211, 9–21. [Google Scholar] [CrossRef] [PubMed] [Green Version]
  48. Vannote, R.L.; Minshall, G.W.; Cummins, K.W.; Sedell, J.R.; Cushing, C.E. The River Continuum Concept. Can. J. Fish. Aquat. Sci. 1980, 37, 130–137. [Google Scholar] [CrossRef]
  49. Dudgeon, D. Large-scale hydrological changes in tropical Asia: Prospects for riverine biodiversity. Bioscience 2000, 50, 793–806. [Google Scholar] [CrossRef]
  50. Chen, J.; Wang, Y.; Li, F.; Liu, Z. Aquatic ecosystem health assessment of a typical sub-basin of the Liao River based on entropy weights and a fuzzy comprehensive evaluation method. Sci. Rep. 2019, 9, 14045. [Google Scholar] [CrossRef] [PubMed]
  51. Atique, U.; Kwon, S.; An, K.G. Linking weir imprints with riverine water chemistry, microhabitat alterations, fish assemblages, chlorophyll-nutrient dynamics, and ecological health assessments. Ecol. Indic. 2020, 117, 106652. [Google Scholar] [CrossRef]
  52. Hutchinson, G.E. A Treatise on Limnology. Geography, Physics and Chemistry; Wiley: Hoboken, NJ, USA, 1957; Volume 1. [Google Scholar]
  53. Dillon, P.J. The phosphorus-chlorophyll in lakes. Limnol. Oceanogr. 1974, 19, 767–773. [Google Scholar] [CrossRef]
  54. Dodds, W.K. Eutrophication and trophic state in rivers and streams. Limnol. Oceanogr. 2006, 51, 671–680. [Google Scholar] [CrossRef]
  55. Pringle, C. Effects of water and substratum nutrient supplies on lotic periphyton growth—An integrated bioassay. Can. J. Fish. Aquat. Sci. 1987, 44, 619–629. [Google Scholar] [CrossRef]
  56. Munn, M.; Frey, J.; Tesoriero, A. The influence of nutrients and physical habitat in regulating algal biomass in agricultural streams. Environ. Manag. 2010, 45, 603–615. [Google Scholar] [CrossRef]
  57. Corkum, L. Responses of chlorophyll-a, organic matter, and macroinvertebrates to nutrient additions in rivers flowing through agricultural and forested land. Arch. Hydrobiol. 1996, 136, 391–411. [Google Scholar] [CrossRef]
  58. Kwak, S.D.; Choi, J.W.; An, K.G. Chemical water quality and fish component analyses in the periods of before- and after-the weir constructions in Yeongsan River. J. Ecol. Environ. 2016, 39, 99–110. [Google Scholar] [CrossRef] [Green Version]
  59. Li, J.; Dong, S.; Liu, S.; Yang, Z.; Peng, M.; Zhao, C. Effects of cascading hydropower dams on the composition, biomass and biological integrity of phytoplankton assemblages in the middle Lancang-Mekong River. Ecol. Eng. 2013, 60, 316–324. [Google Scholar] [CrossRef]
  60. Yan, Z.; Han, W.; Peñuelas, J.; Sardans, J.; Elser, J.J.; Du, E.; Reich, P.B.; Fang, J. Phosphorus accumulates faster than nitrogen globally in freshwater ecosystems under anthropogenic impacts. Ecol. Lett. 2016, 19, 1237–1246. [Google Scholar] [CrossRef]
  61. Allan, J.D. Influence of land use and landscape setting on the ecological status of rivers. Limnetica 2004, 23, 187–198. [Google Scholar] [CrossRef]
  62. Choi, J.Y.; Kim, S.K. Effects of aquatic macrophytes on spatial distribution and feeding habits of exotic fish species lepomis macrochirus and micropterus salmoides in shallow reservoirs in south korea. Sustainability 2020, 12, 1447. [Google Scholar] [CrossRef]
  63. Wang, L.; Lyons, J. Fish and Benthic Macroinvertebrate Assemblages as Indicators of Stream Degradation in Urbanizing Watersheds. In Biological Response Signatures: Indicator Patterns Using Aquatic Communities; Simon, T.P., Ed.; CRC Press: Boca Raton, FL, USA; London, UK; New York, NY, USA; Washington, DC, USA, 2003; pp. 227–250. ISBN 0-8493-0905-0. [Google Scholar]
  64. Wang, L.; Lyons, J.; Kanehl, P.; Gatti, R. Influences of Watershed Land Use on Habitat Quality and Biotic Integrity in Wisconsin Streams. Fisheries 1997, 22, 6–12. [Google Scholar] [CrossRef]
  65. Wang, L.; Lyons, J.; Kanehi, P.; Bannerman, R.; Emmons, E. Watershed urbanization and changes in fish communities in southeastern Wisconsin streams. J. Am. Water Resour. Assoc. 2000, 36, 1173–1189. [Google Scholar] [CrossRef]
  66. Barbour, M.T.; Faulkner, C.; Gerritsen, J. Rapid Bioassessment Protocols for Use in Streams and Wadeable Rivers: Periphyton, Benthic Macriinvertebrates and Fish, 2nd ed.; EPA 841-B-99-002; EPA Office of Water: Washington, DC, USA, 1999; p. 337.
Figure 1. The map shows the study sites in the Nakdong River basin.
Land 11 01428 g001
Figure 2. Human modification index of terrestrial systems (HMITS) of Nakdong River basin.
Land 11 01428 g002
Figure 3. Land cover-dominated site variations in water quality variables in the Nakdong River basin. AGRDS: agricultural coverage-dominated sites, BARDS: barren coverage-dominated sites, FORDS: forest coverage-dominated sites, URBDS: urban coverage-dominated sites. (I) TP: total phosphorus, (II) TN: total nitrogen, (III) TN:TP: total nitrogen and total phosphorus ratios, (IV) BOD: biological oxygen demand, (V) COD: chemical oxygen demand, (VI) DO: dissolved oxygen, (VII) TSS: total suspended solids, (VIII) EC: electrical conductivity and (IX) CHL-a: chlorophyll-a. The red dots indicate the mean value in all of the figures, the first highest mean receives the letter “a”, the second and third highest mean receives the letter “b”, and “c”, respectively, and means with no significant difference receive the same letter).
Land 11 01428 g003
Figure 4. Seasonal variations in water quality parameters in the Nakdong River basin. Spring: March–May, Summer: June–August, Fall: September–November, Winter: December–February. (I) WT: water temperature, (II) DO: dissolved oxygen, (III) BOD: biological oxygen demand, (IV) COD: chemical oxygen demand, (V) TN: total nitrogen, (VI) TP: total phosphorus, (VII) TSS: total suspended solids, (VIII) EC: electrical conductivity and (IX) CHL-a: chlorophyll-a, The red dots indicate the mean value in all of the figures, the first highest mean receives the letter “a”, the second, third and fourth, highest mean receives the letter “b”, “c”, and “d”, respectively, and means with no significant difference receive the same letter).
Land 11 01428 g004
Figure 5. Influence of total phosphorus (TP), total nitrogen (TN), and TN:TP ratios on algal chlorophyll (CHL-a) in the Nakdong River basin. (AGRDS: agricultural coverage-dominated sites—(IIII), BARDS: barren coverage-dominated sites—(IVVI), FORDS: forest coverage-dominated sites—(VIIIX), URBDS: urban coverage-dominated sites—(XXII).
Land 11 01428 g005
Figure 6. Trophic and tolerance guild variations at different land cover-dominated sites in the Nakdong River basin. SS: sensitive species, IS: intermediate species, TS: tolerant species, O: omnivores, I: insectivores, C: carnivores, and H: herbivores. (AGRDS: agricultural coverage-dominated sites—(I,II), BARDS: barren coverage-dominated sites—(III,IV), FORDS: forest coverage-dominated sites (V,VI), URBDS: urban coverage-dominated sites—(VII,VIII).
Land 11 01428 g006
Figure 7. Biological and chemical health assessments at different land cover-dominated sites in the Nakdong River basin. (I) index of biotic integrity (IBI) model and (II): multi-metric water pollution index (WPI). AGRDS: agricultural coverage-dominated sites, BARDS: barren coverage-dominated sites, FORDS: forest coverage-dominated sites, URBDS: urban coverage-dominated sites (red lines in the box indicate mean value).
Land 11 01428 g007
Figure 8. Relations of human modification index of terrestrial systems (HMITS) with chemical and biological health in the Nakdong River basin. (I) Influence of HMITS on the multi-metric water pollution index (WPI) model and (II) influence of HMITS on the index of biotic integrity (IBI) model.
Land 11 01428 g008
Table 1. Water pollution index (WPI) model and scoring criteria of seven metrics.
CategoryModel MetricScoring Criteria
531
Nutrient regimeM1: total nitrogen (mg/L)<1.51.5–3.0>3
M2: total phosphorus (µg/L)<3030–100>100
M3: TN: TP ratio>5020–50<20
Organic matterM4: biological oxygen demand (mg/L)<11–2.5>2.5
Ionic contents and solids M5: total suspended solids (mg/L)<44–10>10
M6: electrical conductivity (µS/cm)<180180–300>300
Primary production indicatorM7: chlorophyll (µg/L)<33–10>10
Table 2. Index of biotic integrity (IBI) model and scoring criteria of eight metrics.
Model CategoryModel MetricScoring Criteria
531
Species richness and compositionM1: total number of native fish species>67%33–67%<33%
M2: number of riffle benthic species>67%33–67%<33%
M3: number of sensitive species>67%33–67%<33%
M4: proportion of individuals as tolerant species<5%5–20%>20%
Trophic compositionM5: proportion of individuals as omnivore species<20%20–45%>45%
M6: proportion of individuals as native insectivore species>45%20–45%<20%
Fish abundance and conditionM7: total number of native individuals>67%33–67%<33%
M8: percentage of individuals with anomalies0%0–1%>1%
Table 3. Fish fauna and guild composition in the Nakdong River watershed. (Tol. G.: tolerance guild, Tro. G.: trophic guild, Hab. G.: habitat guild, AGRDS: agricultural coverage-dominated sites, BARDS: barren coverage-dominated sites, FORDS: forest coverage-dominated sites, URBDS: urban coverage-dominated sites, TNI: total number of individuals, TRA: total relative abundance, TNS: total number of species, ¥: exotic species, EDS: ecologically disturbing species, *: endangered species, SS: sensitive species, IS: intermediate species, TS: tolerant species, O: omnivores, I: insectivores, C: carnivores, H: herbivores, RB: riffle benthic species).
Fish SpeciesTypes of Fish GuildRelative Abundance of Fish Species (%)TNITRA (%)
Tol. G.Tro. G.Hab. GAGRDSBARDSFORDSURBDS
Zacco platypusTSO 28.8415.1312.3219.16241623.42
Zacco koreanusSSI 12.55 38.769.76190018.42
Opsarichthys uncirostrisTSC 6.425.212.561.735565.39
Pseudogobio esocinusISI 6.412.941.654.475114.95
Lepomis macrochirus ¥ (EDS)TSI 4.0128.152.831.374123.99
Pungtungia herziISI 3.42 6.222.744083.96
Micropterus salmoides ¥ (EDS)TSC 4.468.43.540.644043.92
Tridentiger brevispinisISIRB2.2510.082.287.763123.02
Coreoleuciscus splendidusSSIRB1.97 6.140.092842.75
Rhinogobius brunneusISIRB2.51.681.572.372312.24
Squalidus chankaensisISO 2.41 2.280.642202.13
Rhynchocypris oxycephalusSSI 0.78 6.61 2182.11
Squalidus gracilisISI 2.58 0.393.832182.11
Squalidus multimaculatusISO 3.39 2182.11
Mugil cephalusTSH 0.2 16.151901.84
Carassius auratusTSO 1.612.10.944.381811.75
Microphysogobio yaluensisISORB1.54 2.950.271771.72
Hemibarbus labeoTSI 2.222.940.75 1691.64
Niwaella multifasciataSSORB1.1 2.36 1311.27
Tribolodon hakonensisISO 1.38 3.191241.2
Plecoglossus altivelisISH 0.43 8.391201.16
Acheilognathus koreensisISO 1.26 0.55 950.92
Coreoperca herziSSC 0.9 1.180.27910.88
Hemiculter eigenmanniTSO 1.09 0.351.09910.88
Odontobutis platycephalaSSC 0.84 0.710.18740.72
Pseudorasbora parvaTSO 0.68 0.042.55730.71
Hemibarbus longirostrisISI 0.68 0.280.91610.59
Chaenogobius urotaeniaISI 0.53 2.28590.57
Acheilognathus lanceolatusISO 0.78 0.2 550.53
Erythroculter erythropterusTSC 0.37 0.21.82490.48
Cobitis hankugensisISI 0.53 0.240.09410.4
Misgurnus anguillicaudatusTSO 0.362.10.240.09350.34
Squalidus japonicusTSO 0.54 350.34
Oryzias latipesTSO 0.25 1.09280.27
Cyprinus carpioTSO 0.230.420.120.55250.24
Iksookimia longicorpaISI 0.63 160.16
Leiocassis nitidusTSI 0.55 140.14
Acanthogobius flavimanusTSI 1.19130.13
Pseudobagrus fulvidracoTSI 0.140.840.08 130.13
Liobagrus mediadiposalisSSIRB0.06 0.08 60.06
Rhodeus uyekiiISO 0.05 0.2760.06
Gasterosteus aculeatusISI 0.06 40.04
Iksookimia yongdokensisISI 0.06 40.04
Liobagrus andersoniSSIRB 0.16 40.04
Orthrias nudusSSIRB 0.16 40.04
Cottus hangiongensis *SSIRB0.05 30.03
Synechogobius hastaTSI 0.2730.03
Tridentiger bifasciatusTSI 0.2730.03
Koreocobitis naktongensis *SSORB0.02 0.04 20.02
Odontobutis interruptaISC 0.03 20.02
Sarcocheilichthys variegatusISI 0.03 20.02
Silurus asotusTSC 0.02 0.04 20.02
Lateolabrax maculatusISC 0.0910.01
Pseudobagrus koreanusISIRB0.02 10.01
TNS 46123633
TNI 64402382541109610315
Table 4. Pearson correlation coefficients (r) among nutrients, organic matter, algal chlorophyll with trophic and tolerance guilds, and index of biotic integrity (IBI) model value in the Nakdong River basin. (−) indicate a negative relationship. TN: total nitrogen, TP: total phosphorus, BOD: biological oxygen demand, COD: chemical oxygen demand, CHL-a: chlorophyll-a.
Water Quality ParametersTrophic GuildsTolerance GuildsModel IBI Value
% Carnivores% Herbivores% Insectivores% Omnivores% Sensitive Species% Intermediate Species% Tolerant Species
NutrientsTN−0.12−0.120.010.13−0.05−0.020.05−0.03
TP−0.08−0.14−0.050.12−0.08−0.140.16−0.12
Organic mattersBOD−0.07−0.15−0.0050.12−0.02−0.120.1−0.12
COD−0.05−0.160.020.1−0.02−0.070.07−0.07
Primary productivityCHL-a−0.06−0.10−0.020.1−0.07−0.080.11−0.13
Publisher’s Note: MDPI stays neutral with regard to jurisdictional claims in published maps and institutional affiliations.

