Abstract
Tourism plays an important role in rural restructuring, especially in mountainous areas. Mismatches between tourism and rural in terms of the development level and efficiency have given rise to a variety of challenges. In order to achieve the orderly growth of tourism and sustainable rural restructuring, there is an urgent need to explore the interaction between the two. Thus, we introduce the concept of synergistic development potential (SDP) and construct an assessment framework using coupling analysis. Southern Shaanxi, in the Qin-Ba mountainous area, a Chinese region rich in ecological tourism resources, was selected as a case study to evaluate the SDP during the period 2013 to 2018. In our framework, a comprehensive index system with 21 indicators was developed to evaluate the tourism development levels (TDL) and rural development levels (RDL) in 2013 and 2018, and the tourism development efficiency (TDE) and rural restructuring efficiency (RRE) during this period. Secondly, correlations between TDL and RDL, as well as correlations between TDE and RDE, were quantified using the coupling coordination degree model (CCDM). Finally, the SDP evaluation model was constructed through combing the coupling coordination degrees of current development levels and development efficiencies. The case study results indicate that the primary-level coordination counties are both dominated in this region in terms of the relationship of development levels as well as the development efficiencies. Additionally, the SDP results show a significant difference in 25 counties, with 36% of them having low potential, 48% having medium potential, and 16% having high potential. This study could intuitively show the development differences among various units and provide theoretical and methodological support for the rural tourism zoning strategies.
1. Introduction
Since the middle of the 20th century, significant changes have taken place in rural areas driven by modernization, globalization, and urbanization [1], involving the massive flow of rural and urban population [2], the recession of agricultural economy, and the rise of manufacturing, tourism, and services [3]. Distinguished by intensity, persistence, and totality, the changes have attracted widespread attention as “rural restructuring” [4], which could be regarded as a process of the self-adjustment of socio-economic structures and land use patterns to adapt to a series of external and internal changes [5]. In this process, tourism, with its high correlation with other industries, strong driving capacity, and environmental friendliness [6], has become an important driving force for rural restructuring and transformation [7,8], effectively assisting in the upgrading of the rural industrial structure, the revival of traditional culture, and the improvement of land-use efficiency. Despite the flourishing development of tourism, mismatches between tourism and rural in terms of the development level and efficiency have given rise to a variety of challenges, such as excessive commercialization [9], a decrease in biodiversity [10], declining rurality [11], and the waste of investment. Given these facts, the question of how to achieve a coordinated development between the two has become a matter of great concern.
There has been extensive research on tourism and rural restructuring [12,13,14]. Since the end of the 20th century, rural tourism has progressively grown to be a significant driving force to promote the endogenous rural development in many regions of the developed world [15]. The focus of rural agricultural development under the influence of tourism is not only on increasing productivity, but also on farm diversification and on increasing the value of agricultural products [16]. In this process, organic farming is gaining importance, and various types of agricultural parks are flourishing [17]. The economic and industrial structure of rural areas has undoubtedly changed as a result of tourism [18,19,20,21], with agriculture changing from a dominant to a peripheral position and tourism-related manufacturing and services rising in popularity [22]. The livelihoods of agricultural households have also changed as a result; now, the villagers have more diverse sources of income and are less dependent on agriculture [23]. Furthermore, the growth of the tourism industry has drawn people back to their hometowns, alleviating the issue of rural hollowing out and promoting bottom-up rural regeneration [24]. As a destination for people seeking relaxation in modern society, rural space, with its idyllic image, satisfies the psychological needs of urbanites to return to nature and seek a healthy lifestyle; consequently, the commodification of rural space is also a process of adding value to the rural landscape, environment, and products [1,25]. As the commodification of space advances, driven by consumer culture, rural space is increasingly being created towards abstraction and symbolism. The spatial problems of the countryside brought about by excessive commodification are particularly pronounced in the rural areas surrounding metropolitans, reflecting the change from explicit to implicit in the urban dispossession of the countryside [26].
Different from the relatively mature mode in developed countries, rural tourism is only in its infancy in most developing countries [27,28], especially in the mountainous regions of China, which account for about 70% of the land area, and 45% of its population still resides there. Therefore, mountainous rural areas continue to be a significant form of habitation, and their development occupies an important position in the revitalization of the nation’s rural areas. Despite an abundance of natural scenic resources, rural tourism development is quite rudimentary, with general issues of strong policy dependency, fragmented distribution, and serious homogenized competition [29]. Many villages benefit from subsidies from various government departments and enterprises, with substantial funding available for the construction of infrastructure and supporting services. Although the overall living environment has been generally improved, the tourism economy may not be sustainable, resulting in an enormous waste of investment and resources. Therefore, in order to achieve the orderly development of tourism and the sustainable transformation of the rural landscape, there is an urgent need to explore the coupling and coordination relationship between tourism development and rural restructuring.
The two features of the present research methods on rural–tourism interactions are as follows: (1) employing a series of theoretical models to explore the interrelationships, that are, for instance, based on the theory of the production of space to analyze the multi-dimensional impact of tourism on rural physical space, economic and social relations, and power structures [30], and based on actor–network theory (ANT) to analyze the change of relationships and roles of various participants, both human and non-human actors, in the process of rural development under the influence of tourism [31,32]; (2) adopting a series of quantitative models to investigate the interrelationships, which incorporate but are not limited to data envelopment analysis (DEA) [33], grey correlation analysis [34,35], the pressure–state–response (PSR) model, the system dynamics (SD) model, and the coupling coordination degree model (CCDM) [36,37], all of which have their application scenarios. However, previous studies have tended to concentrate on the effects of tourism development on rural areas rather than the influence of rural restructuring on tourism. Moreover, existing studies have generally concentrated on the interactions between tourism and certain rural elements, such as agriculture, habitation, and livelihoods. There is still a lack of studies on the relationship between rural and tourism development from a holistic perspective. What is more, most of the previous research studies have used the tourist location theory to examine tourism’s spatial organization qualitatively [38]; however, they have seldom linked it to the development status of tourism and rural tourism based on quantitative analysis.
To assess the synergistic relationship between tourism and rural restructuring, an evaluation framework for synergistic development potential (SDP) based on the CCDM was developed in our study, taking southern Shaanxi in Qin-Ba mountainous area as an example (Figure 1). The structure of the paper is as follows: Firstly, we constructed an index system to evaluate the tourism development level (TDL) and rural development level (RDL) in 2013 and 2018, as well as the tourism development efficiency (TDE) and rural restructuring efficiency (RRE) during this period. Secondly, correlations between TDL and RDL, as well as correlations between TDE and RDE, were quantified by CCDM. Finally, an SDP evaluation model was established, combing the coupling coordination degrees (CCDs) of current development levels and development efficiencies. The result of the SDP could intuitively show the development differences among various units and provide theoretical and methodological support for the rural tourism zoning strategies.
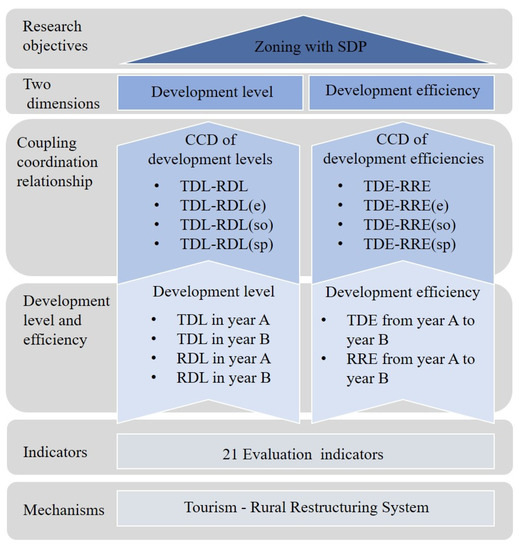
Figure 1.
General framework of this study. RDL(e) is rural economic development level, RDL(so) is rural society development level, RDL(sp) is rural space development level, RRE(e) is rural economic restructuring efficiency, RRE(so) is rural society restructuring efficiency, RRE(sp) is rural space restructuring efficiency.
2. Materials and Methods
2.1. Research Area
Southern Shaanxi (105°30′~111°07′, 31°42′~34°39′) consists of the cities of Hanzhong, Ankang, and Shangluo, including 3 municipal districts and 25 counties, covering 63,343 square kilometers (Figure 2). With the Qinling Mountains to the north, the Bashan Mountains to the south, and the HanJiang River running through, southern Shaanxi is located in the heart of the Qin-Ba mountainous area, which produces a variety of ecotourism resources. Moreover, cultural resources, such as traditional villages and ancient relics, have also been fully explored in recent years under the strategy of all-area, tourism-based development. There have been 81 A-class tourist attractions with 129.14 million visitors of 2018 in southern Shaanxi. The tourism industry has developed into a key driver of economic development and industrial transformation. However, restricted by the landform of mountainous areas, it suffers inconvenient transportation, low development efficiency, and considerable discrepancies in regional development. Poverty is particularly common in the deep mountains. By the end of 2018, the rural residents had reached 4.24 million, accounting for 65% of the total. Nevertheless, the average annual disposable income of rural residents was only 38.6% of the urban residents. Facing the large gap in economic and social development, there is an urgent need to promote rural restructuring through the growth of the tourism industry in this region.
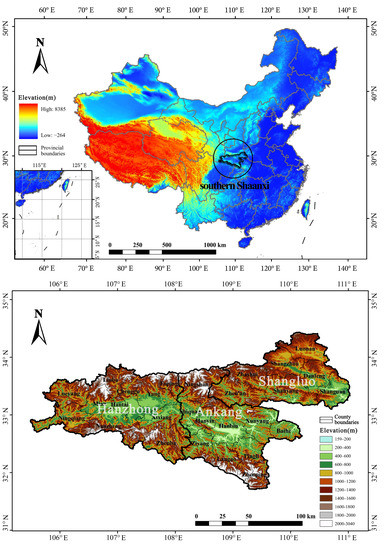
Figure 2.
The location and topography of southern Shaanxi.
The urbanization in municipal districts is much higher than that in counties, which is outside the purview of this work, as the research object is the countryside. Based on the administrative subdivision in 2018, 25 county-level administrative units in southern Shaanxi are eventually obtained as the research objects (Nanzheng County was abolished and upgraded to a municipal district in 2017 but is still included in this study).
2.2. Data Sources
The research period was determined from 2013 to 2018. First, tourism in southern Shaanxi developed slowly before 2013. With the implementation of “The Outline of National Tourism and Leisure Development in Shaanxi Province (2013–2020)”, the importance of tourism industry has been raised to a new level. Since then, the tourism industry in southern Shaanxi has developed rapidly. Therefore, this paper takes 2013 as the research starting point. Second, most materials, such as the yearbook published by the government, were accessed late, therefore the end time was determined to be 2018 on the premise that the materials are available by then.
The data needed in this paper mainly include vector data and statistical data. The administrative boundary data of 25 counties in southern Shaanxi and the normalized difference vegetation index (NDVI) raster datasets in 2013 and 2018 with a spatial resolution of 1 km both come from the Resource and Environment Science and Data Center (https://www.resdc.cn, accessed on 5 November 2021). The land use data with a spatial resolution of 30 m in 2013 and 2018 are obtained from remote sensing images through visual interpretation in ArcGIS10.5, and the remote sensing images are obtained from Landsat 8 OLI_TIRS satellite data from the Geospatial Data Cloud (http://www.gscloud.cn, accessed on 4 December 2021). The statistical data are derived from China’s county (city) socio-economic statistical yearbook (National Bureau of Statistics, 2014 and 2019), China’s County statistical yearbook (National Bureau of Statistics, 2014 and 2019), Shaanxi Statistical Yearbook (Shaanxi Municipal Bureau of Statistics, 2014 and 2019), and Hanzhong, Ankang and Shangluo Statistical Yearbook (2014 and 2019). In order to compare the economic data of different years, the impact of price change has been eliminated, and the data were converted into comparable prices in 2018.
2.3. Conceptual Framework
Rural restructuring is a process employed to adapt to the changes of rural internal factors and external regulation through reshaping the economic structure, social relationships, and regional spatial pattern [5]. The involvement of the tourism industry has influenced the internal and external factors of the rural restructuring system, including the changes in development policies, the improvement of traffic, and the change of employment structure, which induces the transformation of rural economic development, deconstruction of the social relations, and reshaping of the rural space [39,40]. The rural restructuring system and tourism system, which co-exist in the rural area, are intrinsically linked by mutual interaction and influence, and can be regarded as an organic coupled whole, which was defined in this study as the tourism–rural restructuring (TRR) system (Figure 3).
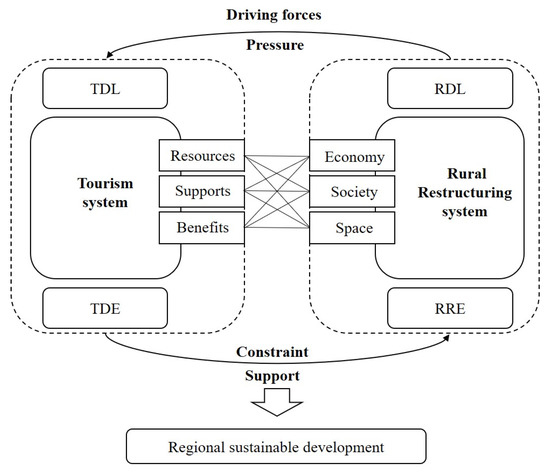
Figure 3.
The TRR system. TDL is tourism development level, TDE is tourism development efficiency, RDL is rural development level, RRE is rural restructuring efficiency.
The TRR system is open, intricate, and has complicated interaction mechanisms [15]. While the development of the tourism industry has a positive impact on rural restructuring, it also brings about negative effects such as the landscape fragmentation, the weakening of rural interpersonal relations, and the decline of rural culture [41]. Similarly, the active rural restructuring offers significant assistance for the development of tourism activities. Meanwhile, the development of tourism-related businesses is often explosive in nature, while the rural restructuring system, which arises from self-organization and serves traditional agricultural production, is complex, comprehensive, and evolves slowly over time [42]. Their difference makes it easy for tourism development to be incompatible with the rural economic–social structure and land use mode, and the lagging response to the rural restructuring has a more pronounced constraining effect on the development of the tourism. Altogether, the development of tourism contributes positively or negatively to the rural restructuring through a series of factor flows. Conversely, the changes of rural economy, society, and space inevitably affect the process of tourism development. Therefore, there is a complex interaction and coupling relationship between rural restructuring and tourism development. The two systems are correlative, mutually supportive, and restrictive. Their positive interaction is an important way to realize regional sustainable development in the post-productivity era [43,44].
2.4. Evaluation Index System Construction
According to the principles of measurability, availability, and objectivity [45], based on the existing research of tourism and rural area [46,47,48,49], an index system that can reflect the tourism and rural development was constructed from six aspects (Table 1).

Table 1.
Indicators for tourism and rural development level and efficiency.
The tourism system can be structured into three parts, i.e., the resources subsystem, the supports subsystem, and the benefits subsystem [50]. The number of scenic spots above class A is selected to represent the abundance of tourism resources. Three indicators, investment on fixed asset, the proportion of employees in the tertiary industry to permanent population, and the density of the road network, are selected to reflect the tourism support capabilities. Three indicators are selected to reflect the tourism benefits, including the ratio of tourism income to gross domestic product (GDP), the number of tourists, and the proportion of tertiary industry output to GDP.
Rural restructuring is a systematic process involving economic, social, and spatial restructuring [51]. Six indicators are selected to reflect the economic development, including GDP per capita, the income of rural residents, total retail sales of social consumer goods, and the proportion of employees in secondary and tertiary industries to the permanent population, degree of agricultural mechanization represented by the ratio of total agricultural machinery power to cultivated land area, and the proportion of primary sector added value to GDP. Four indicators are selected to reflect the social development, including the number of permanent residents in the countryside, medical conditions represented by the proportion of beds in medical and sanitary institutions in the whole society, educational conditions represented by the proportion of the students in primary and secondary schools in the whole society, and the ratio of the disposable income of urban residents to that of rural residents. Four indicators, ecological function represented by the normalized difference vegetation index (NDVI), area of rural settlements per capita, rationality of village and town system represented by the ratio of the number of villages to the number of towns, and efficiency of cultivated land use, are selected to measure the spatial development.
2.5. Methods
2.5.1. Evaluation of Development Level
- (1)
- Determination of the index weights
As one of the objective weighting methods [52], the entropy method was employed in this study [53,54,55]. Since the data are from two years, determining the weight by entropy method according to the year separately will produce inconsistent results, which will affect the comparison of the development level and calculation of development efficiency. Therefore, the overall entropy method was introduced to calculate the weight of tourism and rural development, respectively. The specific steps are as follows.
➀ Forming a matrix. According to the basic idea of overall entropy method, the three-dimensional data table is sorted into a two-dimensional table in time order. Taking tourism indicators as an example, it is necessary to evaluate the tourism development level of 25 counties in 2013 and 2018 with 7 indicators. Thus, a 25 × 7-order matrix each year can be obtained. According to the overall entropy method, the attribute “county + year” is regarded as a whole, therefore the above two tables are rearranged to a 50 × 7 order overall matrix. The data sorting of rural indicators is the same as that of tourism.
➁ Data standardization. In order to eliminate the influence of magnitude and dimensions, the raw data needs to be standardized using the following formula. In this study, the range normalization method was adopted, and non-negative translation was carried out to ensure that all normalized data are positive and can be calculated. According to the positive and negative attributes of the indicator, the calculation formulas are as follows:
where is the primitive values of row (county) i and column (indicator) j in the overall matrix; is the standardized value; is the minimum index of column j; is the maximum index of column j. In order to ensure that logarithm calculation is meaningful, 0.01 is added.
➂ Calculate the proportion of the j-th indicator of the i-th “county+ year”:
where m is the number of “county + year” in matrix, m = 50.
➃ Calculation of the information entropy:
where K is a constant, and K > 0.
➄ Calculation of the weight of each indicator:
- (2)
- Calculation of the development level index of tourism and rural using the weighted sum method, for which the equation is:
Significantly, in the process of rural restructuring, the importance of economic, social, and spatial components are equal, therefore the weights of (RDL(e)), (RDL(so)), and (RDL(sp)) are equal too. The formula of the rural comprehensive development level is as follows:
- (3)
- Classification of development level.
Taking the “mean ± 1 × standard deviation” as the critical value [56,57], the development level can be divided into four levels, namely extremely low [0, mean − 1 × standard deviation], low [mean − 1 × standard deviation, mean], high [mean, mean + 1 × standard deviation], extremely high [mean + 1 × standard deviation, 1].
2.5.2. Evaluation of Development Efficiency
Tourism development efficiency is the comprehensive development rate of tourism resources, tourism supports, and tourism benefits. Rural restructuring efficiency is the transformation rate of rural economic–social–spatial structure. Both the efficiencies of tourism development and rural restructuring are affected by the development level in the early stage and the driving forces in the process [58].
The evaluation matrix was constituted by the changes of 21 indicators between 2013 and 2018. The methods for the weights’ determination, the development efficiency index calculation, and the grade classification are the same with the evaluation of development level in Section 2.5.1. The weights obtained are different from the development level since the basic data sets used for the two weights are different.
2.5.3. Evaluation Model for SDP
The following factors are required for a sustainable interaction between tourism development and rural restructuring: (1) Strong capacity of tourism industry to drive rural restructuring. The higher the level of tourism development, the greater the driving force for rural restructuring. (2) Considerable ability of the rural areas to support the development of tourism. The higher the level of rural economic–social–ecological development, the better it is for the implementation of tourism strategies. (3) High consistency between tourism development efficiency and rural restructuring efficiency. The greater and closer the two efficiencies are, the more mutually reinforcing the effect is. Thus, there is a significant correlation between tourism development and rural restructuring. The higher the rural restructuring system and the tourist system are coordinated, the more effectively the rural regional system is promoted to grow sustainably.
CCDM is a quantitative method used to explore the degree of correlation between two or more systems based on the coupling theory in physics [59], which is consistent with the goal of this study and was selected as the basic evaluation method. Currently, CCDM has been extensively used in the field of geographical research and urban–rural planning [60,61]. The synergistic development potential of tourism development and rural restructuring is reflected both in their current level and the development efficiency of recent progress. Consequently, an evaluation model for SDP was built by integrating CCDs of current development level and development efficiency. The formulas are as follows.
where C is the coupling degree, [0, 1]. D is the coupling coordination degree, [0, 1]; l stands for development level, and e stands for development efficiency. T is the coordination index. In this paper, tourism development efficiency and rural development efficiency are considered to be equally important, therefore the weights, α and β, are both set at 0.5. Referring to relevant research results [62,63] and considering the actual situation, the CCD was divided into six levels, namely, [0~0.2), severe disorder; [0.2~0.3), moderate disorder; [0.3~0.5), mild disorder; [0.5~0.6), primary coordination; [0.6~0.7), intermediate coordination; [0.7~1), advanced coordination.
3. Results
3.1. County Differences in TDL and RDL
As shown in Figure 4a, from 2013 to 2018, the median of TDL in southern Shaanxi increased from 0.3255 to 0.4288, while the median of RDL increased from 0.4131 to 0.5873, indicating that both the development of tourism and rural in the whole region have significantly improved; however, RDL progressed much more than TDL. Moreover, the range of the box has a minor growth both in TDL and RDL, revealing that the gap among counties has widened. Comparing the TDL and RDL in 2013 and 2018, respectively, the medians of TDL were both lower than RDL, showing that the development of tourism lagged behind that of rural during this period. Through the results of RDL(e), RDL(so), RDL(sp), it could be found that the economy and society have dramatically improved, which was mainly a result of the policies of New Urbanization, New Rural Construction, Beautiful Countryside, Ecological Migration, and Rural Revitalization.
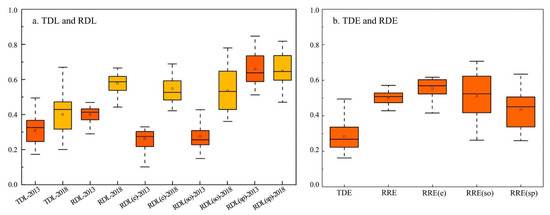
Figure 4.
The evaluation results of TDL, RDL, TDE, and RRE.
The spatial distribution of TDL and RDL in 2013 and 2018 were formed through ArcGIS 10.5, as shown in Figure 5. There was little change in TDL except for the extremely high-level counties, which changed from being scattered in the three cities to being concentrated in Shangluo. This is more related to the better conditions of location and transportation. Shangluo is closer to Xi’an, the main source city for tourists in the north of the region. With an increase in tourism demand, more and more counties in Shangluo are deeply involved in tourism. The average number of tourists received by each county was Shangluo (8.44 million) > Hanzhong (4.34 million) > Ankang (3.90 million), and the proportion of total tourism revenue in GDP was Shangluo (45.89%) > Ankang (38.78%) > Hanzhong (29.16%) in 2018. There was little variation in the number of counties at different levels of rural development. However, an obvious change in the distribution has been found. The distribution of counties at all levels has changed from being evenly dispersed throughout the region to one that is clustered, where the counties in levels of extremely low and low were in the west and the counties in levels of high and extremely high were in the east. Counties with similar levels of development show a trend of cluster mainly due to the elements of rural development, especially the industry and population, which can flow freely in adjacent counties, resulting in the development levels of several neighboring counties being similar. The exchange of rural development elements, however, is restricted across a vast area affected by the law of distance attenuation, demonstrating that the gap in development levels on a large spatial scale is obvious.
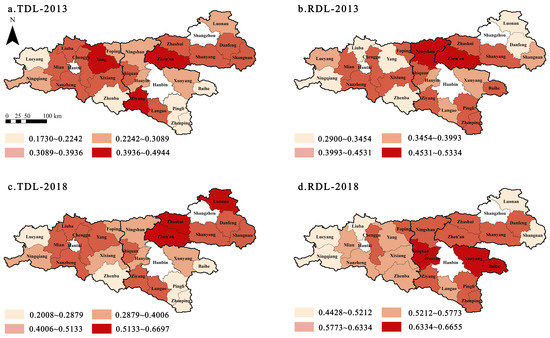
Figure 5.
Distribution map of TDL and RDL in 2013 and 2018.
3.2. County Differences in TDE and RRE
From the box plot in Figure 4b, the median of RDE was 1.6673 in the period from 2013 to 2018, which was greater than that of TDE, 1.2746, indicating that the development of tourism lagged behind the rural restructuring. Moreover, the box height of RRE was shorter than that of TDE, revealing that the gap of RRE among counties was smaller. According to the distribution map in Figure 6, the number of high-value areas (high-level + extremely high-level) of TDE was less than that of low-value areas (low-level + extremely low-level), which accounted for only 40% of the total area and were scattered at the edge of the area. RRE has nearly equal amounts of low-value and high-value areas, with the majority of the former being concentrated in the Qinling Mountains.
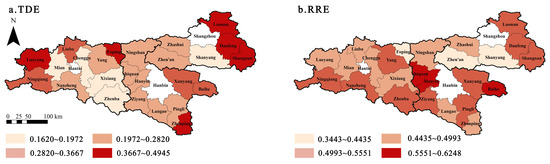
Figure 6.
Distribution map of TDE and RRE.
Tourism development is a long-term process. Policies have played a significant role in the recent economic and social growth of southern Shaanxi’s rural areas. However, the growth of tourism not only depends on policy promotion, but also requires a series of supporting facilities, such as public services, infrastructure, and reception facilities. The relatively lower efficiency of tourism development was still significantly related to low accessibility and inadequate tourism facilities. The comparison of TDE and RDE shows that rural restructuring has not yet fully played its role in promoting tourism development, and that the tourism development efficiency needs further substantial improvement.
3.3. Coupling Coordination Relationship between TDL and RDL
The CCDs of development level and efficiency between tourism and rural could be measured via the Formulas (8)–(10) in Section 2.5.3. Moreover, in order to clarify the relationship between tourism and rural subsystems, the CCDs between tourism and rural economy–society–space were further measured.
As shown in Figure 7a, there has been a significant increase in the coupling coordination between TDL and RDL from 2013 to 2018, and differences among counties also show a narrowing trend. In terms of the relationships of the coupling degree (C) and the coupling coordination degree (D) between tourism and the rural economic–social–spatial development level in 2018, the median of C(TDL-RDL(sp)) and D(TDL-RDL(sp)) were the biggest, while the D(TDL-RDL(e)) was the minimum, indicating that the coordination between tourism and rural space development levels was the best, and the coordination between tourism and rural economy was the worst. The reason for that is because the rural economic restructuring in recent years was rapid, and the rural development level was significantly ahead of the tourism, leading to a low synergy with the slow development of tourism. Moreover, it was difficult to make a significant change in the society and space due to the loss of population and the intensification of hollow villages, leading to a much closer development level and a high synergy with tourism. At the same time, the range of C(TDL-RDL(so)) and D(TDL-RDL(so)) are both the widest, indicating that the degrees of coordination between tourism and rural society are more varied across the 25 counties.
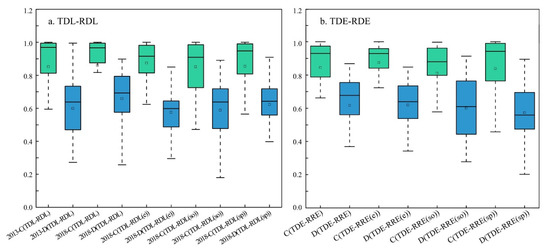
Figure 7.
The results of coupling coordination degrees of TDL-RDL and TDE-RDE.
The distribution map (Figure 8a,b) demonstrates that it was still dominated by primary coordination counties in 2018 despite an increase in coordinated counties from 60 to 84 percent. In addition, the average coordination degree in the west was lower than that in the east both in 2013 and 2018, and there were more variations of coordination types and a greater level of disparity in the west than in the east. As shown in Figure 8c–e, the primary coordination counties were also dominated in the relationships between TDL and RDL(e), RDL(so), and RDL(sp).
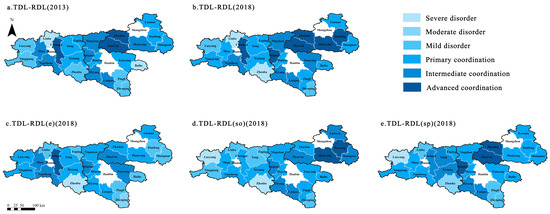
Figure 8.
Distribution map of coordinating types between TDL and RDL, RDL(e), RDL(so), RDL(sp).
3.4. Coupling Coordination Relationship between TDE and RRE
From the distribution map (Figure 9), counties with primary coordination make up the majority, and three kinds of coordinated counties account for 76%. The main reason for that is the development efficiency of tourism fell far behind that of rural development. Although both rural restructuring and tourism are in a period of rapid development, tourism in southern Shaanxi is still in a crude mode, and the integration with rural restructuring needs to be strengthened. We can only progress to a highly connected and coordinated level by maximizing the resource advantages of each system, enhancing the correlation, and promoting the integration. Moreover, the high-coordination counties are concentrated towards the east, west, and south edges, while the disordered counties are distributed in the middle. Counties on the edge of the region and adjacent to other provinces or cities have more convenient transportation and a larger tourism market, which is favorable for both rural and tourism development.
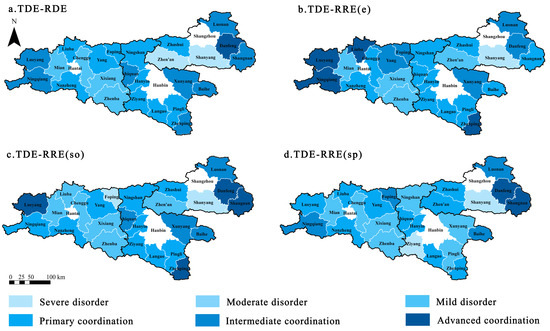
Figure 9.
Distribution map of coordinating types between TDE and RDE, RDE(e), RDE(so), RDE(sp).
The average, median, and range of the CCD of TDE–RRE(e) are the closest to those of TDE–RRE from Figure 7b, and also better than that of TDE–RRE(so) and TDE–RRE(sp). As Figure 9b–d shows, the primary coordination counties are the most prevalent of the three, and the disordered counties in TDE–RRE(so) and TDE–RRE(sp) are obviously more than that of TDE–RRE(e). Additionally, the distribution of various types of counties shows strong matching among TDE–RRE(e), TDE–RRE(so), and TDE–RRE(sp), with the highly coordinated counties being scattered at the ends. These features confirm that economic restructuring is the most active part of rural restructuring and play a leading role in social and spatial restructuring.
3.5. County Differences in Synergistic Development Potential
The SDP index was determined through the Formula (11) in Section 2.5.3, and Table 2 shows the result. According to the natural breakpoint classification method, the SDP index in 25 counties was divided into three categories: low potential areas [0.3070–0.5950], medium potential areas [0.6390–0.7085], and high potential areas [0.7315–0.8375] (Figure 10).
Table 2.
The result of the SDP.
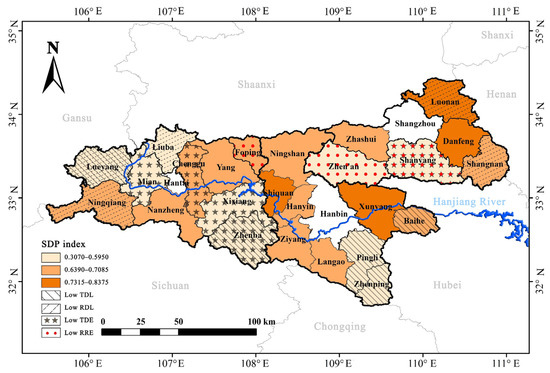
Figure 10.
Distribution map of different SDP areas.
There are nine low potential counties, making up 36% of the total, showing a pattern of multiple clusters scattered at the edges of the region and the municipal boundaries, generally facing various problems, such as low TDL, low RDL, low TDE, or low RRE. The cities of Hanzhong, Ankang, and Shangluo show substantial discrepancy in the performance of problems. The issues facing the low-potential counties of Hanzhong are diverse and overlapping. The first reason for this is that they are all located in remote, deep mountains that are too far from the tourist source market to be easily accessible. Secondly, these counties have long been underdeveloped and heavily rely on the mining and agriculture industries. The investment and support allocated to tourism are far from enough, and are restricted by the local lagging economy. Thirdly, most of the young and middle-aged workforce relocate to the metropolis to earn a living, resulting in the lack of relevant talents in rural and tourism development. However, the major problem faced by the low-potential counties of Ankang is the low level of tourism development. Pingli and Zhenping are situated in the southernmost region of Shaanxi Province, the Bashan area, where transportation is difficult. Moreover, the primary problem the low-potential counties of Shangluo encountered is the low level of rural restructuring. Although Zhen’an and Shanyang County are both in a high level of tourism and rural development, which suggests that tourism and rural development have recently entered a period of stability, the driving force from tourism to rural restructuring is still insufficient.
Twelve medium potential counties, accounting for 48% of the total, are continuously distributed along the Hanjiang River. They are the populated area of southern Shaanxi and are important grain-producing areas, leading to a relatively higher level of rural development. At the same time, the advantages of ecotourism resources, transportation, and markets make the region well placed to develop weekend tourism.
Four high potential counties, accounting for 16% of the total, are in Shangluo and Ankang City. Relying on the advantages of location and market proximity to Xi’an, the countryside and tourism of Luonan and Danfeng counties are developing rapidly. Shiquan and Xunyang counties, in Ankang, in contrast, rely on the strong economy to fully develop the tourism industry, creating a good situation of synergistic development between tourism and rural areas.
In addition, Ankang faces a relatively singular problem compared to the other two cities. We introduced the Cpk (process capability index) from industrial production to reflect the discrepancy in SDP among counties in their respective city. The specific relationship of Cpk is Ankang (1.757) > Hanzhong (1.368) > Shangluo (1.085), as shown in Figure 11, indicating that the gap of SDP among counties within Ankang City is much smaller than that in Shangluo and Hanzhong. Therefore, it is necessary to enhance the balance of regional development in these two cities by adjusting cooperation and support mechanisms.
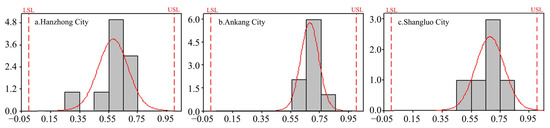
Figure 11.
Differences of SDP among counties within three cities.
4. Discussion
Most villages in mountainous areas are in low-level development and face severe population loss constrained by ecological protection policies and harsh natural conditions. In light of this, promoting tourism is a practical and essential approach to supporting rural transformation and restructuring. Despite the flourishing development of tourism, mismatches between tourism and rural in terms of the development level and efficiency have given rise to a variety of challenges. How to achieve a coordinated development between the two has become a matter of great concern. Southern Shaanxi, located in the heart of the Qin-Ba mountainous area, is a typical region of China that is rich in ecological tourism resources and backward in rural development. However, there are few studies on the interaction between tourism and rural development in the region. In this study, we constructed comprehensive evaluation index systems to assess the levels and efficiencies of rural and tourism development. On this basis, a model for evaluating the synergistic development potential was constructed using the coupled coordination degree model, thoroughly revealing the interactive relationships of these two systems, their spatiotemporal evolution characteristics, and differences in county development. Compared with other studies, we focus more on the quantitative interaction between rural restructuring and tourism development, which contributes to a comprehensive picture of the development situation and provides a new perspective and approach for modifying the spatial distribution of rural tourism development.
The assessment results of the development level show that both rural and tourism development in southern Shaanxi have made great achievements between 2013 and 2018, which mainly benefitted from a series of top-down development strategies such as Beautiful Countryside, Ecological Migration, Rural Revitalization, and all-area, tourism-based development. In the process, the rural habitat was improved, and the tourism resources were developed in a more comprehensive and in-depth manner. Moreover, by comparing their development levels and development efficiencies, it was found that tourism development in southern Shaanxi lagged behind the rural during the study period, and there were obvious spatial differences between rural and tourism development-advantaged areas. Contrary to our preconceived notions, this is rather different. The rise of rural tourism currently offers the image of prosperity, while the obtained result indicates that rural restructuring and tourism have not yet formed a highly coordinated development, and that the quality of rural tourism still needs to be improved. Moreover, the coupled coordination analysis shows that, although the coordination between rural development level and tourism development level has increased significantly during the study period, the primary coordination counties are both dominated in the relationship between TDL and RDL and in the relationship between TDE and RDE. In addition, while the rural economic development level is the least coordinated with the tourism development, the rural economic development efficiency is the most coordinated with the tourism development, indicating that the level of rural economic development is ahead of tourism, although the two are growing at the most consistent rate. These findings are consistent with other studies that have revealed a strong correlation between tourism economy and rural restructuring, and the economic restructuring plays a leading role in rural restructuring. Furthermore, a significant difference in 25 counties is also revealed by the SDP results, with 36% of them having low potential, 48% having medium potential, and 16% having high potential. Moreover, the spatial distribution of counties with various potential displayed significant regional differences in the study area. The low potential counties showed a pattern of multiple clusters scattered at the edges of the region and the municipal boundaries. Although the majority of counties in southern Shaanxi are relatively similar in terms of natural geography and can often find a section of the mountain range with excellent tourism resources to exploit, the above results suggest that transport and location are still the most significant obstacles impeding the development of rural tourism in the mountainous regions.
On the basis of the findings of the synergistic development potential, the paper makes the following recommendations. The approach to rural development should be planned from the macro-level according to the resource characteristics and development foundation. Specifically, the high potential counties should be taken as the key development areas, and the medium potential counties should strengthen the advantageous fields to enhance the driving force of rural and tourism development; at the same time, low potential counties should also be incorporated into the regional development framework through a reasonable ecological compensation mechanism [64], so as to improve the coordination between rural and tourism development in the whole region. Moreover, it is essential to fully recognize the cultural, ecological, and strategic value of the Hanjiang River and to form a consensus on the development of tourism in southern Shaanxi with the Hanjiang River as a link and brand [65]. It is suggested that the three cities in southern Shaanxi could establish a tourism alliance to create a better tourism mechanism of cooperation and communication. Finally, the three cities in southern Shaanxi need to work together on traffic master planning and accelerate the construction of infrastructure such as tourism transport. The counties with poor traffic conditions in southern Shaanxi are mainly located in the high-altitude areas of Qinling Mountains and Ba Shan Mountains [66], which greatly hinders the flow of economic factors including humans, information, and technology. In order to achieve barrier-free access among provinces, cities and scenic spots, and to enhance the reception capacity of tourism in the whole region, there is an urgent demand to build a comprehensive transportation network with highways, railways, airlines, and waterways.
This paper enables a differentiated classification of the entire study area by evaluating the synergistic development potential between tourism and rural restructuring. Rural areas that have a strong synergy with the current tourism industry will be a key focus for the development of leisure activities and tourism services in the future. Thus, the research can support a thorough understanding of the current state of tourism and rural development. Furthermore, this study advances knowledge of the interaction between tourism and rural restructuring and contributes to the promotion of a better coupling relationship. Finally, this study advocates tourism-oriented rural planning and mutually beneficial cooperation across administrative boundaries, so that it can provide a scientific basis for the formulation of regional development strategies and provide development references for other similar mountainous areas.
The innovation of this paper can be reflected in the methodology, which has generated an SDP assessment framework combining the two coupling coordination degrees of current development levels and development efficiencies. In comparison, the existing research mainly focuses on the impact of tourism on the rural [7,9,21] and rarely takes into account the coupling relationship, especially the relationship between development efficiencies. In addition, the interactive relationships between tourism and rural economy, society, and space have been described in this paper, which provides a detailed path with which to find the weakness. Overall, the methodology of this study could accurately and systematically describe the relationship between tourism and rural restructuring. Last but not least, this assessment framework can be referenced by other regions.
Nevertheless, some limitations still exist in this study. First, this study only noted the synergistic development potential differences and explained the reasons, without comparing it with the current tourism and rural development plans. Second, the method may suffer from data acquisition problems, since it is based on a large number of indicators and data of two years. For example, the statistical caliber of the data may differ among administrative units, or some data of the year to be studied may be missing. Although this method is relatively objective and accurate, the preliminary work is substantial and time-consuming. Our future work will focus on improving the practicability and efficiency of the method in this regard.
5. Conclusions
This paper establishes a comprehensive evaluation index system to assess tourism and rural development, including tourism development level, tourism development efficiency, rural development level, and rural restructuring efficiency. Moreover, to quantify the interaction between tourism and rural restructuring, a CCDM-based evaluation framework for SDP was constructed. Southern Shaanxi of the Qin-Ba mountainous area in China was selected as a case study with which to evaluate the SDP during the period from 2013 to 2018.
The results of the development level indicate that both rural and tourism in southern Shaanxi have improved significantly during the study period, while tourism development lagged behind the rural in terms of development level and efficiency. The coupling coordination degree results show that there is a low coupling and coordination degree not only in the relationship between TDL and RDL, but also in the relationship between TDE and RDE. The results of SDP reveal a significant spatial difference in 25 counties, with 36% of them having low potential, 48% having medium potential, and 16% having high potential, and the low-potential counties showed a pattern of multiple clusters scattered at the edges of the region and the municipal boundaries. The study could provide an important reference for the orderly development of tourism and the policy implementation of a rural revitalization strategy in southern Shaanxi, as well as theoretical support for tourism-oriented rural development in other similar mountainous areas.
Author Contributions
Conceptualization, W.J.; Methodology, W.J.; Software, W.J.; Validation, L.W. (Lei Wang) and K.Y.; Formal analysis, W.J., L.W. (Lian Wu) and P.L.; Investigation, P.L., L.W. (Lei Wang) and K.Y.; Resources, W.Z.; Data Curation, W.J.; Writing—Original Draft, W.J.; Writing—Review and Editing, W.J. and P.L. Visualization, W.J. and P.L.; Supervision, L.W. (Lian Wu) and P.L.; Project administration, L.W. (Lian Wu); Funding acquisition, W.Z. All authors have read and agreed to the published version of the manuscript.
Funding
This research was supported by National Key R&D Program of China (grant No. 2019YFD1100901).
Institutional Review Board Statement
Not applicable.
Informed Consent Statement
Not applicable.
Data Availability Statement
The data that support the findings of this study are available from the author upon reasonable request.
Conflicts of Interest
The authors declare no conflict of interest.
References
- Woods, M. Rural Geography: Processes, Responses and Experiences in Rural Restructuring; Sage: London, UK, 2004. [Google Scholar]
- Hedlund, M.; Lundholm, E. Restructuring of rural Sweden–employment transition and out-migration of three cohorts born 1945–1980. J. Rural Stud. 2015, 42, 123–132. [Google Scholar] [CrossRef]
- Paniagua, A. Urban-rural migration, tourism entrepreneurs and rural restructuring in Spain. Tour. Geogr. 2002, 4, 349–371. [Google Scholar] [CrossRef]
- Hoggart, K.; Paniagua, A. What rural restructuring? J. Rural Stud. 2001, 17, 41–62. [Google Scholar] [CrossRef]
- Tu, S.; Long, H. Rural restructuring in China: Theory, approaches and research prospect. J. Geogr. Sci. 2017, 27, 1169–1184. [Google Scholar] [CrossRef]
- Cheng, Z.; Cai, J.; Cui, L. Facilitating rural transformation development by tourism industry: A case study of Panjin, Liaoning Province. Res. Agric. Mod. 2016, 37, 143–150. [Google Scholar]
- Song, L.; Junmei, L.; Xiaofang, R. Research review on the rural reconstruction influenced by tourism. J. Chin. Ecotour. 2021, 11, 315–331. [Google Scholar]
- Xi, J.; Wang, X.; Kong, Q. From a traditional rural village to the modern coastal resort: Land use change in the past 20 years in Jinshitan and its policy implication. Hum. Geogr. 2016, 31, 130–139. [Google Scholar]
- Gao, H.; Zhang, J.; Luo, Z. Renaissance or alienation? Spatial transformation of rural space of metropolis fringe area driven by consumer culture: Empirical observation on Dashan Village of Gaochun International Slow City. Urban Plan. Int. 2014, 29, 68–73. [Google Scholar]
- Chung, M.G.; Dietz, T.; Liu, J. Global relationships between biodiversity and nature-based tourism in protected areas. Ecosyst. Serv. 2018, 34, 11–23. [Google Scholar] [CrossRef]
- Woods, M. Rural; Routledge: London, UK, 2010. [Google Scholar]
- Dahms, F. St. Jacobs, Ontario: From declining village to thriving tourist community. Ont. Geogr. 1991, 36, 1–13. [Google Scholar]
- Liu, Y.; Li, Y. Revitalize the world’s countryside. Nature 2017, 548, 275–277. [Google Scholar] [CrossRef] [PubMed]
- Tu, S.; Long, H.; Zhang, Y.; Ge, D.; Qu, Y. Rural restructuring at village level under rapid urbanization in metropolitan suburbs of China and its implications for innovations in land use policy. Habitat Int. 2018, 77, 143–152. [Google Scholar] [CrossRef]
- Gao, C.; Cheng, L. Tourism-driven rural spatial restructuring in the metropolitan fringe: An empirical observation. Land Use Policy 2020, 95, 104609. [Google Scholar] [CrossRef]
- Welteji, D.; Zerihun, B. Tourism–agriculture nexuses: Practices, challenges and opportunities in the case of Bale Mountains National Park, Southeastern Ethiopia. Agric. Food Secur. 2018, 7, 8. [Google Scholar] [CrossRef]
- Spagnoli, L.; Mundula, L. Between Urban and Rural: Is Agricultural Parks a Governance Tool for Developing Tourism in the Periurban Areas? Reflections on Two Italian Cases. Sustainability 2021, 13, 8108. [Google Scholar]
- Ramsey, D. Rural Restructuring and the New Rural Economy: Examples from Germany and Canada. In The Next Rural Economies. Constructing Rural Place in Global Economies; Halseth, G., Markey, S., Bruce, D., Eds.; CABI: Wallingford, CT, USA; Cambridge, UK, 2010; pp. 115–127. [Google Scholar]
- Shen, F.; Hughey, K.F.; Simmons, D.G. Connecting the sustainable livelihoods approach and tourism: A review of the literature. J. Hosp. Tour. Manag. 2008, 15, 19–31. [Google Scholar] [CrossRef]
- Kheiri, J.; Nasihatkon, B. The effects of rural tourism on sustainable livelihoods (case study: Lavij rural, Iran). Mod. Appl. Sci. 2016, 10, 10–22. [Google Scholar] [CrossRef]
- Abdollahzadeh, G.; Salehi, K.; Sharifzadeh, M.S.; Khajehshahkohi, A. Investigating the impact of tourism on sustainable rural livelihoods in Golestan Province. J. Tour. Plan. Dev. 2016, 4, 148–169. [Google Scholar]
- Prince, S. Craft-art in the Danish countryside: Reconciling a lifestyle, livelihood and artistic career through rural tourism. J. Tour. Cult. Change 2017, 15, 339–358. [Google Scholar] [CrossRef]
- Kim, S.; Jamal, T. The co-evolution of rural tourism and sustainable rural development in Hongdong, Korea: Complexity, conflict and local response. J. Sustain. Tour. 2015, 23, 1363–1385. [Google Scholar] [CrossRef]
- Sun, H.; Liu, Y.; Xu, K. Hollow villages and rural restructuring in major rural regions of China: A case study of Yucheng City, Shandong Province. Chin. Geogr. Sci. 2011, 21, 354–363. [Google Scholar] [CrossRef]
- Urry, J.; Larsen, J. The Tourist Gaze 3.0.; Sage: London, UK, 2011. [Google Scholar]
- Chen, P.; Kong, X. Tourism-led Commodification of Place and Rural Transformation Development: A Case Study of Xixinan Village, Huangshan, China. Land 2021, 10, 694. [Google Scholar] [CrossRef]
- Liu, Y.; Zhou, Y.; Li, Y. Rural regional system and rural revitalization strategy in China. Acta Geogr. Sin. 2019, 74, 2511–2528. [Google Scholar]
- Long, H.; Woods, M. Rural restructuring under globalization in eastern coastal China: What can be learned from Wales? J. Rural. Community Dev. 2011, 6, 70–94. [Google Scholar]
- Su, B. Rural tourism in China. Tour. Manag. 2011, 32, 1438–1441. [Google Scholar] [CrossRef]
- Ye, C.; Ma, X.; Gao, Y.; Johnson, L. The lost countryside: Spatial production of rural culture in Tangwan village in Shanghai. Habitat Int. 2020, 98, 102137. [Google Scholar] [CrossRef]
- Van der Duim, R.; Ren, C.; Jóhannesson, G.T. Actor-Network Theory and Tourism; Taylor & Francis: Abingdon-on-Thames, UK, 2012. [Google Scholar]
- Jóhannesson, G.T. Tourism translations: Actor–Network Theory and tourism research. Tour. Stud. 2005, 5, 133–150. [Google Scholar] [CrossRef]
- Liu, J.; Zhang, J.; Fu, Z. Tourism eco-efficiency of Chinese coastal cities–Analysis based on the DEA-Tobit model. Ocean Coast. Manag. 2017, 148, 164–170. [Google Scholar] [CrossRef]
- Chen, J.; Yang, X.-J.; Wen, X.; Deng, M.-Q. The theoretical framework and demonstration of rural adaptive evolution in the context of tourism development. J. Nat. Resour. 2020, 35, 7001586. [Google Scholar] [CrossRef]
- Xu, S.; Yue, Q.; Lu, B. Grey correlation analysis on the synergistic development between innovation-driven strategy and marine industrial agglomeration: Based on China’s coastal provinces. Grey Syst. Theory Appl. 2020, 12, 269–289. [Google Scholar] [CrossRef]
- Qiu, P.; Zhou, Z.; Kim, D.-J. A New Path of Sustainable Development in Traditional Agricultural Areas from the Perspective of Open Innovation—A Coupling and Coordination Study on the Agricultural Industry and the Tourism Industry. J. Open Innov. Technol. Mark. Complex. 2021, 7, 16. [Google Scholar] [CrossRef]
- Li, Y.; Li, Y.; Zhou, Y.; Shi, Y.; Zhu, X. Investigation of a coupling model of coordination between urbanization and the environment. J. Environ. Manag. 2012, 98, 127–133. [Google Scholar] [CrossRef] [PubMed]
- Xu, J.; Wang, P. Study on distribution characteristic of tourism attractions in international cultural tourism demonstration region in South Anhui in China. PLoS ONE 2022, 17, e0269948. [Google Scholar] [CrossRef] [PubMed]
- Xi, J.; Wang, X.; Kong, Q.; Zhang, N. Spatial morphology evolution of rural settlements induced by tourism. J. Geogr. Sci. 2015, 25, 497–511. [Google Scholar] [CrossRef]
- Gao, J.; Wu, B. Revitalizing traditional villages through rural tourism: A case study of Yuanjia Village, Shaanxi Province, China. Tour. Manag. 2017, 63, 223–233. [Google Scholar] [CrossRef]
- Frisvoll, S. Power in the production of spaces transformed by rural tourism. J. Rural Stud. 2012, 28, 447–457. [Google Scholar] [CrossRef]
- Liu, Y. Research on the urban-rural integration and rural revitalization in the new era in China. Acta Geogr. Sin. 2018, 73, 637–650. [Google Scholar]
- Wilson, S.; Fesenmaier, D.R.; Fesenmaier, J.; Van Es, J.C. Factors for success in rural tourism development. J. Travel Res. 2001, 40, 132–138. [Google Scholar] [CrossRef]
- Bodin, Ö. Collaborative environmental governance: Achieving collective action in social-ecological systems. Science 2017, 357, eaan1114. [Google Scholar] [CrossRef]
- Zhang, J.; Ji, M.; Zhang, Y. Tourism sustainability in Tibet–Forward planning using a systems approach. Ecol. Indic. 2015, 56, 218–228. [Google Scholar] [CrossRef]
- Blancas, F.J.; González, M.; Lozano-Oyola, M.; Pérez, F. The assessment of sustainable tourism: Application to Spanish coastal destinations. Ecol. Indic. 2010, 10, 484–492. [Google Scholar] [CrossRef]
- Pérez, V.; Guerrero, F.; González, M.; Pérez, F.; Caballero, R. Composite indicator for the assessment of sustainability: The case of Cuban nature-based tourism destinations. Ecol. Indic. 2013, 29, 316–324. [Google Scholar] [CrossRef]
- Lee, T.H.; Hsieh, H.-P. Indicators of sustainable tourism: A case study from a Taiwan’s wetland. Ecol. Indic. 2016, 67, 779–787. [Google Scholar] [CrossRef]
- Barkauskas, V.; Barkauskienė, K.; Jasinskas, E. Analysis of macro environmental factors influencing the development of rural tourism: Lithuanian case. Procedia-Soc. Behav. Sci. 2015, 213, 167–172. [Google Scholar]
- Zhi, L. The Spatial Characteristics and Driving Mechanism of the Coupling Relationship between Tourism Industry and Rural Sustainable Livelihoods: Take the Zhangjiajie Area as an Example. Econ. Geogr. 2020, 40, 209–216. [Google Scholar]
- Long, H.; Liu, Y. Rural Restructuring in China; Elsevier: Amsterdam, The Netherlands, 2016; pp. 387–391. [Google Scholar]
- Liu, X.; Liu, Z.; Zhong, H.; Jian, Y.; Shi, L. Multi-dimension evaluation of rural development degree and its uncertainties: A comparison analysis based on three different weighting assignment methods. Ecol. Indic. 2021, 130, 108096. [Google Scholar] [CrossRef]
- Ding, G.; Chen, Q. Competitiveness Evaluation and Promotion Strategies of Modern Service Industry‘s Sub-sectors Based on Global Entropy Method: Taking Fujian Province as an Example. J. China Univ. Pet. Ed. Soc. Sci. 2013, 29, 14–18. [Google Scholar]
- Pan, X.; Liu, Q.; Peng, X. Evalution and analysis of regional innovation ability in chia based on overall entropy method. Oper. Res. Manag. Sci. 2015, 24, 155–162. [Google Scholar]
- Zou, Z.-H.; Yi, Y.; Sun, J.-N. Entropy method for determination of weight of evaluating indicators in fuzzy synthetic evaluation for water quality assessment. J. Environ. Sci. 2006, 18, 1020–1023. [Google Scholar] [CrossRef]
- Hualou, L.; Yansui, L.; Jian, Z. Assessment of rural development types and their rurality in eastern coastal China. Acta Geogr. Sin. 2009, 64, 426–434. [Google Scholar]
- Tu, s.; Zheng, Y.; Long, H.; Wan, S.; Liang, X.; Wang, W. Spatio-temporal pattern of rural development and restructuring and regional path of rural vitalization in Guangxi, China. Acta Geogr. Sin. 2020, 75, 2000365. [Google Scholar]
- Li, T.; Long, H. Rural development from viewpoints of transformation and coordination: A case in Shandong Province. Prog. Geogr. 2014, 33, 531–541. [Google Scholar]
- Tang, Z. An integrated approach to evaluating the coupling coordination between tourism and the environment. Tour. Manag. 2015, 46, 11–19. [Google Scholar] [CrossRef]
- Zhu, C.; Lin, Y.; Zhang, J.; Gan, M.; Xu, H.; Li, W.; Yuan, S.; Wang, K. Exploring the relationship between rural transition and agricultural eco-environment using a coupling analysis: A case study of Zhejiang Province, China. Ecol. Indic. 2021, 127, 107733. [Google Scholar] [CrossRef]
- Li, Z. Research on the coupling mechanism and coordinated development of rural revitalization—Rural tourism system: A case study on Fenghuang County in Hunan. Geogr. Res. 2019, 38, 643–654. [Google Scholar]
- Feng, J.; Xie, S.; Knight, D.W.; Teng, S.; Liu, C. Tourism-induced landscape change along China’s rural-urban fringe: A case study of Zhangjiazha. Asia Pac. J. Tour. Res. 2020, 25, 914–930. [Google Scholar] [CrossRef]
- Wei, C.; Ge, D.; Long, H. The tourism-led rural transformation development mode in the metropolitan fringe region: The case of Wuhan City. Econ. Geogr. 2018, 38, 211–217. [Google Scholar]
- Yang, Y.; Yao, C.; Xu, D. Ecological compensation standards of national scenic spots in western China: A case study of Taibai Mountain. Tour. Manag. 2020, 76, 103950. [Google Scholar] [CrossRef]
- Fu, P.; Li, Y. Study on the Construction of Cultural Information Resources Security System in Hanjiang River. In Proceedings of the 2018 4th International Conference on Information Management (ICIM), Oxford, UK, 25–27 May 2018; IEEE: Piscataway, NJ, USA, 2018. [Google Scholar]
- Xu, J.; Yang, M.; Lu, Z.; Liu, D.; Wu, Y. Quality Analysis on Spatial Planning Pattern of Rural Area in Southern Shaanxi, China. Sustainability 2021, 13, 12668. [Google Scholar] [CrossRef]
Publisher’s Note: MDPI stays neutral with regard to jurisdictional claims in published maps and institutional affiliations. |
© 2022 by the authors. Licensee MDPI, Basel, Switzerland. This article is an open access article distributed under the terms and conditions of the Creative Commons Attribution (CC BY) license (https://creativecommons.org/licenses/by/4.0/).