Article

Momoge Internationally Important Wetland: Ecosystem Integrity Remote Assessment and Spatial Pattern Optimization Study

1
College of Earth Sciences, Jilin University, Changchun 130061, China
2
Northeast Institute of Geography and Agroecology, Chinese Academy of Sciences, Changchun 130012, China
*
Author to whom correspondence should be addressed.
Land 2022, 11(8), 1344; https://doi.org/10.3390/land11081344
Submission received: 7 July 2022 / Revised: 8 August 2022 / Accepted: 12 August 2022 / Published: 18 August 2022
(This article belongs to the Topic Nature-Based Solutions)

Abstract

:
Along the migration route between East Asia and Australia, numerous migratory birds use the Momoge Internationally Important Wetland as a habitat. Human activities and climate variability cause salinization and meadowization. We developed the “Quality-Pressure-Pattern-Service” remote assessment framework for ecosystem integrity, using a three level approach (TLA). The model was used to assess ecosystem integrity, identify improper wetland development, and provide spatial optimization strategies. The research region was dominated by wetlands, followed by dry fields. Wetlands continued to decrease between 1965 and 2019, as arable land and construction land continued to increase. Over the course of 54 years, ecosystem integrity declined. In 2019, around half of the areas had poor or extremely poor ecosystem integrity. Because the eastern study area contained many pristine inland beaches, the eastern study area displayed greater ecosystem integrity than the central and western areas. Priority should therefore be given to wetland restoration in the HJ core area (one of the three core areas of the reserve), where most of the herb marsh has been converted to arable land. This study revealed the integrity and authenticity of wetland ecosystems. Our results can aid in the protection of wetland habitats, encourage sustainable development, and help in the building of a national park in northeastern China.

1. Introduction

The historical legacy of nature reserves is one of China’s most significant environmental issues. In China’s 474 national nature reserves, there are currently 29 urban built-up areas, 531 built-up areas consisting of formed townships, and 779 administrative villages [1]. Over the past three decades, scholars have created a variety of frameworks for assessing ecosystem integrity to characterize the natural and wilderness states of unaltered nature reserves. Initially, ecosystem integrity was recommended as a scientific evaluation criterion for ecosystem management in national parks in Canada [2]. Traditional frameworks for assessing ecosystem integrity and authenticity include the Index of Biotic Integrity (IBI) [3,4,5], the Ecosystem Integrity Assessment Framework (EIAF) [6], and the Ecosystem Integrity Assessment System Based on Essential Ecosystem Characteristics (EECs) [7]. In general, local and international scholars have centered their evaluations of ecosystem integrity on environmental stress, ecological processes, and biodiversity [8].
Wetlands exhibit some combined functions with those of terrestrial and aquatic ecosystems and they are among the most critical ecosystems [9,10,11,12,13]. However, the global wetland area has decreased by 35% during the past 50 years (https://www.global-wetland-outlook.ramsar.org/ (accessed on 17 December 2021)). Land use and development contribute significantly to the loss of wetland habitats. Various reports have discussed the loss of wetlands as a result of land use change, such as the extensive and rapid transformation of natural wetlands in Asia [14], the loss of 33% of the total domestic wetland in China between 1978 and 2008 [15], and the extensive conversion of marshland to construction and arable land in China [16]. The conventional methodology used for assessing ecosystem integrity requires very high-altitude survey data and is challenging to apply to complex wetland habitats. The remote evaluation framework of the Three Level Approach (TLA) has established a number of evaluation indicators that can be evaluated through remote sensing [17,18]. On this basis, numerous evaluations of ecosystem integrity have been performed through the adoption of a Geographic Information System (GIS) analysis [19,20].
There is an urgent need to develop ecosystem integrity assessment frameworks that can be applied more frequently and repeatedly to nature wetlands to evaluate, monitor, and report on the condition of the region’s ecosystems. Natural wetland parcels are generally fragmented, and delineating multiple natural land use types at fine scales is a limited process. Wetland data from the Third National Land Survey of China (2019) and the Second National Wetland Survey (2013) provide more fine-scale wetland vector data. However, it is difficult to obtain sufficient vector data for most wetland studies. Therefore, few previous studies have studied wetland changes over periods longer than 50 years and studies have failed to explore the more primitive wetland landscapes in history.
Several research findings have emphasized the viability of employing CORONA images to gain information on fine wetland types [21,22]. However, it has been noted that CORONA images have certain deficiencies in terms of both feature identification and band calculation [23]. In this study, we gathered historical information on the research area, such as county records, almanacs, and reports outlining the distribution of wetlands and hydrothermal conditions, to address this issue. In addition, we employed a human visual interpretation technique to adjust the land use change data piece by piece, which dramatically enhanced our ability to identify natural wetland types with precision.
Managing wetland areas with historical legacies is essential in order to safeguard core wetland areas and repair degraded wetlands. In response to numerous unknown factors concerning the degradation and development of wetland areas in the study area [24,25], an area of inappropriate development was identified, and the spatial pattern of the wetland areas was modified to meet ecological requirements to the greatest extent possible. In addition to the basic functions of natural wetland systems, wetlands with historical legacies are typically tightly linked to the production activities and living situations of humans [26,27,28]. Consequently, resolving historical legacy issues in wetland nature reserves plays a crucial role in fostering high-quality economic development and high-level ecological environmental protection through synergistic means.
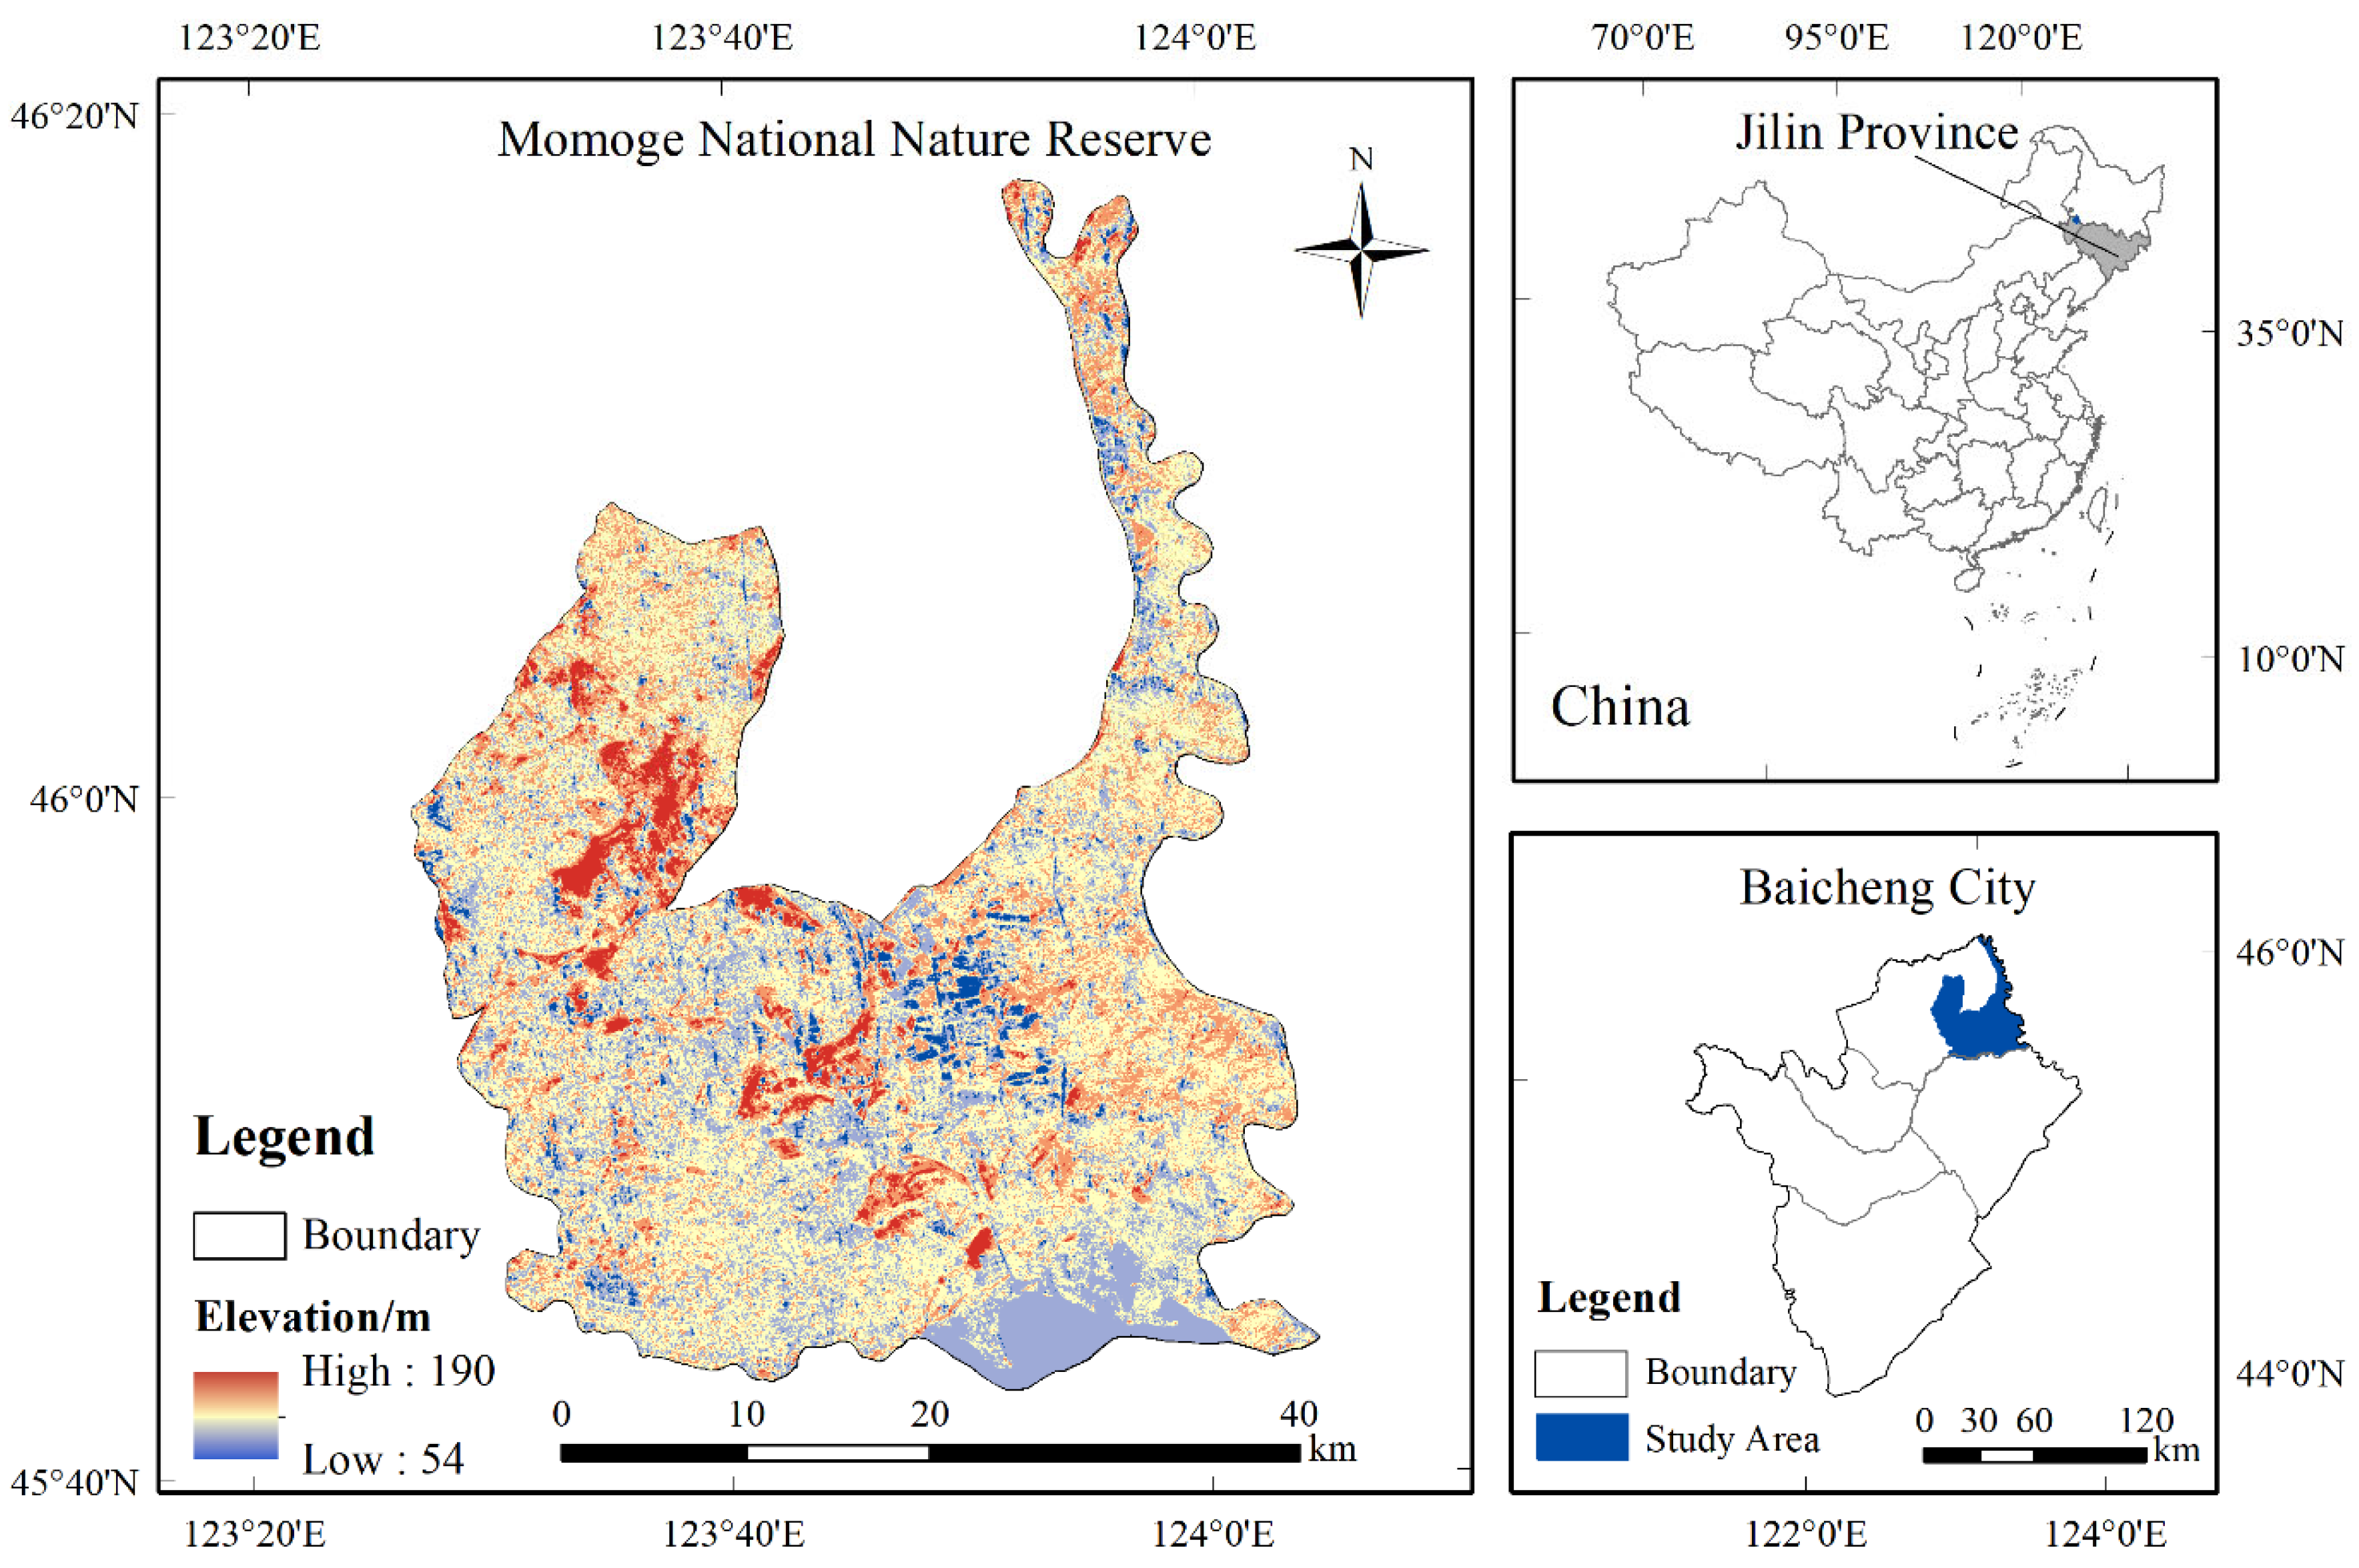
On the basis of RS and GIS technologies, we developed a framework for assessing the integrity of ecosystems that is less expensive and requires less time. Such a framework will not replace assessment methods based on rigorous field surveys, but it will aid in the constant monitoring of changes in ecosystem integrity and provide essential data for addressing legacy concerns in nature reserves. In this study, we investigated the spatial and temporal aspects of a wetland from 1965 to 2019, utilizing the Momoge National Nature Reserve as a case study. On the basis of the “Quality-Pressure-Pattern-Service” ecosystem integrity remote assessment methodology, wetland ecosystem integrity was assessed. The optimization of the spatial pattern in the reserve was also performed to assist in providing fine control over the wetland’s ecology.

2. Materials and Methods

2.1. Study Area

The Momoge Internationally Important Wetland is situated in Baicheng City, in the western portion of Jilin Province (Figure 1). The research area encompasses 144,000 ha and has a semi-humid, temperate continental monsoon climate. It sits at the western boundary of the Sonnen Plain, which was produced by the second northern subsidence zone of the Neocathasia tectonic structure. This structure is the Yingtai structure, which faces north-northeast. In the reserve, swamps have evolved in lakefront depressions, river floodplains, and low-lying places. The primary soil types of the reserve include meadow soil, chernozem soil, and alluvial soil. There are as many as 55 different varieties of vegetation in the Momoge wetland, which belongs to the Eurasian steppe region. The major plant communities consist of a Phragmities australis community, a Deyeuxia angusrifolia community, a Carex spp community, etc. It is one of the three greatest soda saline land distribution zones in the world and is a crucial stopover for 90 percent of the world’s large waterfowls and wading birds, such as Grus leucogeranus, migrating between Siberia and Oceania. The area was Established as a natural reserve in 1981 and designated as a globally significant wetland in 2013.

2.2. Data Sources and Data Processing

2.2.1. Ecological Assessment Unit

To balance the time- consumption of land use modeling and the richness of picture information, a 1 km × 1 km grid was used as the assessment cell size. First, all variable data were transformed to single-precision TIF images with the same raster size, and then 1 km grid cells were counted.

2.2.2. Basic Geographic Data

In this study, we utilized meteorological data, DEM data, and land use data as the basic forms of geographic data. Meteorological data and some data on vegetation cover were collected from the National Earth System Science Data Center, National Science and Technology Infrastructure of China (http://www.geodata.cn/ (accessed on 9 December 2021)). For the years 1965, 2015, and 2019, the monthly precipitation and annual mean temperature of China were computed with a 1 km resolution. Since it was difficult to collect data on the vegetation cover in 1965, we used Landsat 3 images of the Momoge Nature Reserve from 1981 for our calculations. The geospatial data cloud (http://www.gscloud.cn/ (accessed on 10 May 2020)) provided the ASTERG DEMv2.0 data with a spatial resolution of 30 m. In this study, we made use of the 2013 wetland survey data from the forestry department, the 2013 land use change data from the Second National Land Survey, and the 2019 data from the Third National Land Survey.

2.2.3. Remote Sensing Images

The Third National Land Survey utilized satellite remote sensing images with a resolution of over 1 m and classified wetlands in detail, whereas the Second National Land Survey utilized SPOT-5 satellite images with a resolution of 2.5 m and did not classify wetland types. To differentiate wetland types using the 2013 land use change data, this study should be complemented with by the use of additional remote sensing data with a m resolution. We chose the 1965 KH-4A satellite and the 2015 ZY-3 satellite as remote sensing information sources (Table 1).
Coronal images have panoramic aberrations. We used corrected ZY-3 satellite data as a reference for calibration. The root-mean-square error of the geometric correction results was less than 1.0. The 1965 and 2015 land cover vector data in the research region were finally generated by changing the 2013 land use change data patches. To maintain consistency in the classification accuracy of the data, we analyzed the 2019 land use vector data and combined road and ditch patches with widths of less than 2 m into adjacent land classes. In addition, industrial and mining land patches were eliminated from the land use map. We evaluated the accuracy of the 2015 and 2019 classification results using high-resolution Google Earth images. Due to the paucity of historical geographic data, we validated the correctness of the 1965 classification by creating a pseudo-color composite image of the Corona image using the density segmentation function. The results demonstrated that the overall accuracy of the secondary image classification reached 90%.

2.3. Method

The selection of 1965, 2015, and 2019 as the years for our analysis of land use type data was based on three main considerations:
  • The accessibility of meter resolution remote sensing images;
  • The avoidance of years of extreme flooding and drought; and
  • The accessibility of the wetland vector database.
This paper is structured as the follows (Figure 2). First, we merge several meter-resolution remote sensing photographs to obtain land use type data for 1965, 2015, and 2019 in the research area. Then, we model land use dynamics and discuss land use changes. We present the final version of the " Quality-Pressure-Pattern-Service " ecosystem integrity remote assessment framework based on the TLA remote assessment framework. Finally, by evaluating the ecosystem integrity and authenticity of the study area, we identify the inappropriate development areas within the reserve and make recommendations for optimizing its spatial pattern.

2.3.1. Land Classification System

We determined the land classification system employed in this work by referring to prior wetland classification studies, such as the Ramsar Convention, the Third National Land Survey Classification, and the National Forestry Administration wetland survey classification (Table 2). Our analysis focused on wetlands and we divided them into narrow wetlands and water.

2.3.2. Land Use Dynamic Model

The single land use change rate is the rate of a specific land use or cover change in the research region, and it is computed as follows [29]:
V = B 1 B 0 B 0 × 1 T × 100 %
In Equation (1), B0 and B1 are the area of a certain land use type at the beginning and conclusion of the study period, respectively, and T = 54 is the length of the study period.

2.3.3. Ecosystem Integrity Evaluation Index System

Ecosystem integrity can be understood in terms of the quality of the ecosystem, the stability of the landscape, the ecological services supplied by the ecosystem, and its capacity to withstand less external pressure. Consequently, we developed a “Quality-Pressure-Pattern-Service” ecosystem integrity remote assessment framework (Figure 3) by referring to the three-level approach (TLA).
The evaluation framework consists of four factors: ecosystem quality, ecological stressors, ecosystem patterns, and ecosystem services. The indicators were chosen based on the characteristics of wetland ecosystems and the concepts of comprehensiveness, representativeness, practicality, accessibility, and measurability. Table 3 displays the indicator system used to evaluate the ecosystem integrity of the Momoge Internationally Important Wetland. We selected 24 variables relevant to the integrity of wetland ecosystems, including 7 natural attribute variables, 5 spatial density variables, 3 landscape pattern variables, and 9 functional value variables, based on previous research. We did not select socio-economic characteristics in consideration of the reserve’s real population and economic growth.

2.3.4. Ecosystem Service Indicators

Using the global ecosystem service function evaluation model [40], Gao et al. determined the ecosystem service values per unit area in China [41]. Their findings established one standard equivalence factor for the net profit of food production per unit area of a farmland ecosystem. For research and comparison purposes, the 2007 grain price (449.1 CNY/hm2) was used as 1 ecological service value equivalent factor.
To make the evaluation model more regionally applicable, we revised the ecological service value per unit area of Chinese ecosystems (2007) [41]. The biomass factor in Jilin Province was 0.96 [3], compared to a national average biomass factor of 1. First, we used this factor to adjust the value of ecological services per unit area of the ecosystem and obtained an initial value factor appropriate for the Momoge Nature Reserve. The ecological value coefficients of farmland were then adjusted using the equivalence factors of paddy fields and drylands (Table 4) [38]. Finally, the ecological service value per unit area suited to the actual conditions of the research region was determined (Table 5).

2.3.5. Weighting and Standardization of Evaluation Indicators

The Decision-making Trial and Evaluation Laboratory (Dematel) was used to calculate the degree of influence of each element on the other elements and the degree of influence to determine the causal relationship between the indicators and the weight of each indication in the system [42]. Table 6 displays the relative importance of the ecosystem integrity indicators used in this study. The min–max normalization approach was used to standardize the evaluation indexes to make them comparable [43].

2.3.6. The Integrity Index and Grading Standards for Ecosystems

The ecosystem integrity index is a composite score that evaluates the significance and influence of each evaluation index on ecosystem integrity [20,44]. In this study, we used the comprehensive index method to calculate the Momoge Internationally Important Wetland’s ecosystem integrity index. The ecosystem integrity index is determined by the following formula:
E I = i = 1 n ω i A i
In Equation (2), EI is the ecosystem integrity index, n is the number of indicators, ωi is the weight value of the ith indicator, and Ai is the normalized value of the ith indicator. The higher the EI, the more intact the ecosystem is.
To examine the relative levels of ecosystem integrity in various regions, in this study, we constructed the Momoge Internationally Important Wetland Ecosystem Integrity Evaluation Scale based on the natural breakpoint method (Table 7).

2.3.7. Spatial Pattern Optimization Method

Based on the above ecosystem integrity remote assessment framework and the measurement method presented by Wei et al. [45], the integrated ecological function assessment value was subdivided into four degrees to illustrate the strength of the ecological function in different regions.
For the classification of the levels, we took into account the probability distribution of the values under all grids and established a, b, and c as the cut-off values for the integrated ecological functioning of the district, ranging from the lowest to the highest. Then, with reference to the functional area border of the Nature Reserve designated by the State Environmental Protection Administration (SEPA) in 2007, the principle of establishing the important ecological protection area as the area with the highest expected value of ecosystem integrity was chosen. According to the system integrity index distribution of all units assessed, the expected value of the core area was designated a a, and the expected value of the pilot area was designated a d (the minimum value of ecosystem integrity for the pilot area). The expected value for the buffer zone decreased with increasing distance from the core zone (divided into 25 classes with a value range of d–a). Finally, the actual value of the comprehensive evaluation of wetland ecological functioning was subtracted from the expected value, and if the result was less than a predetermined threshold value (we set this threshold value to −0.04), this indicated that the proposed development of the wetland was disproportionate.
The ultimate purpose of assessing ecosystem integrity is to provide scientific evidence for the transformation of future land use in a sensible manner. We assumed the following conditions for the future restoration of wetland areas:
  • Built-up construction land would be maintained;
  • The built-up wetland types in the pilot area and buffer zone of the reserve would not go back to their original state; and
  • Any occasional changes to the land were ignored.

3. Results

3.1. Land Use Change Analysis of the Momoge Internationally Important Wetland

3.1.1. Land Use Structure Investigation

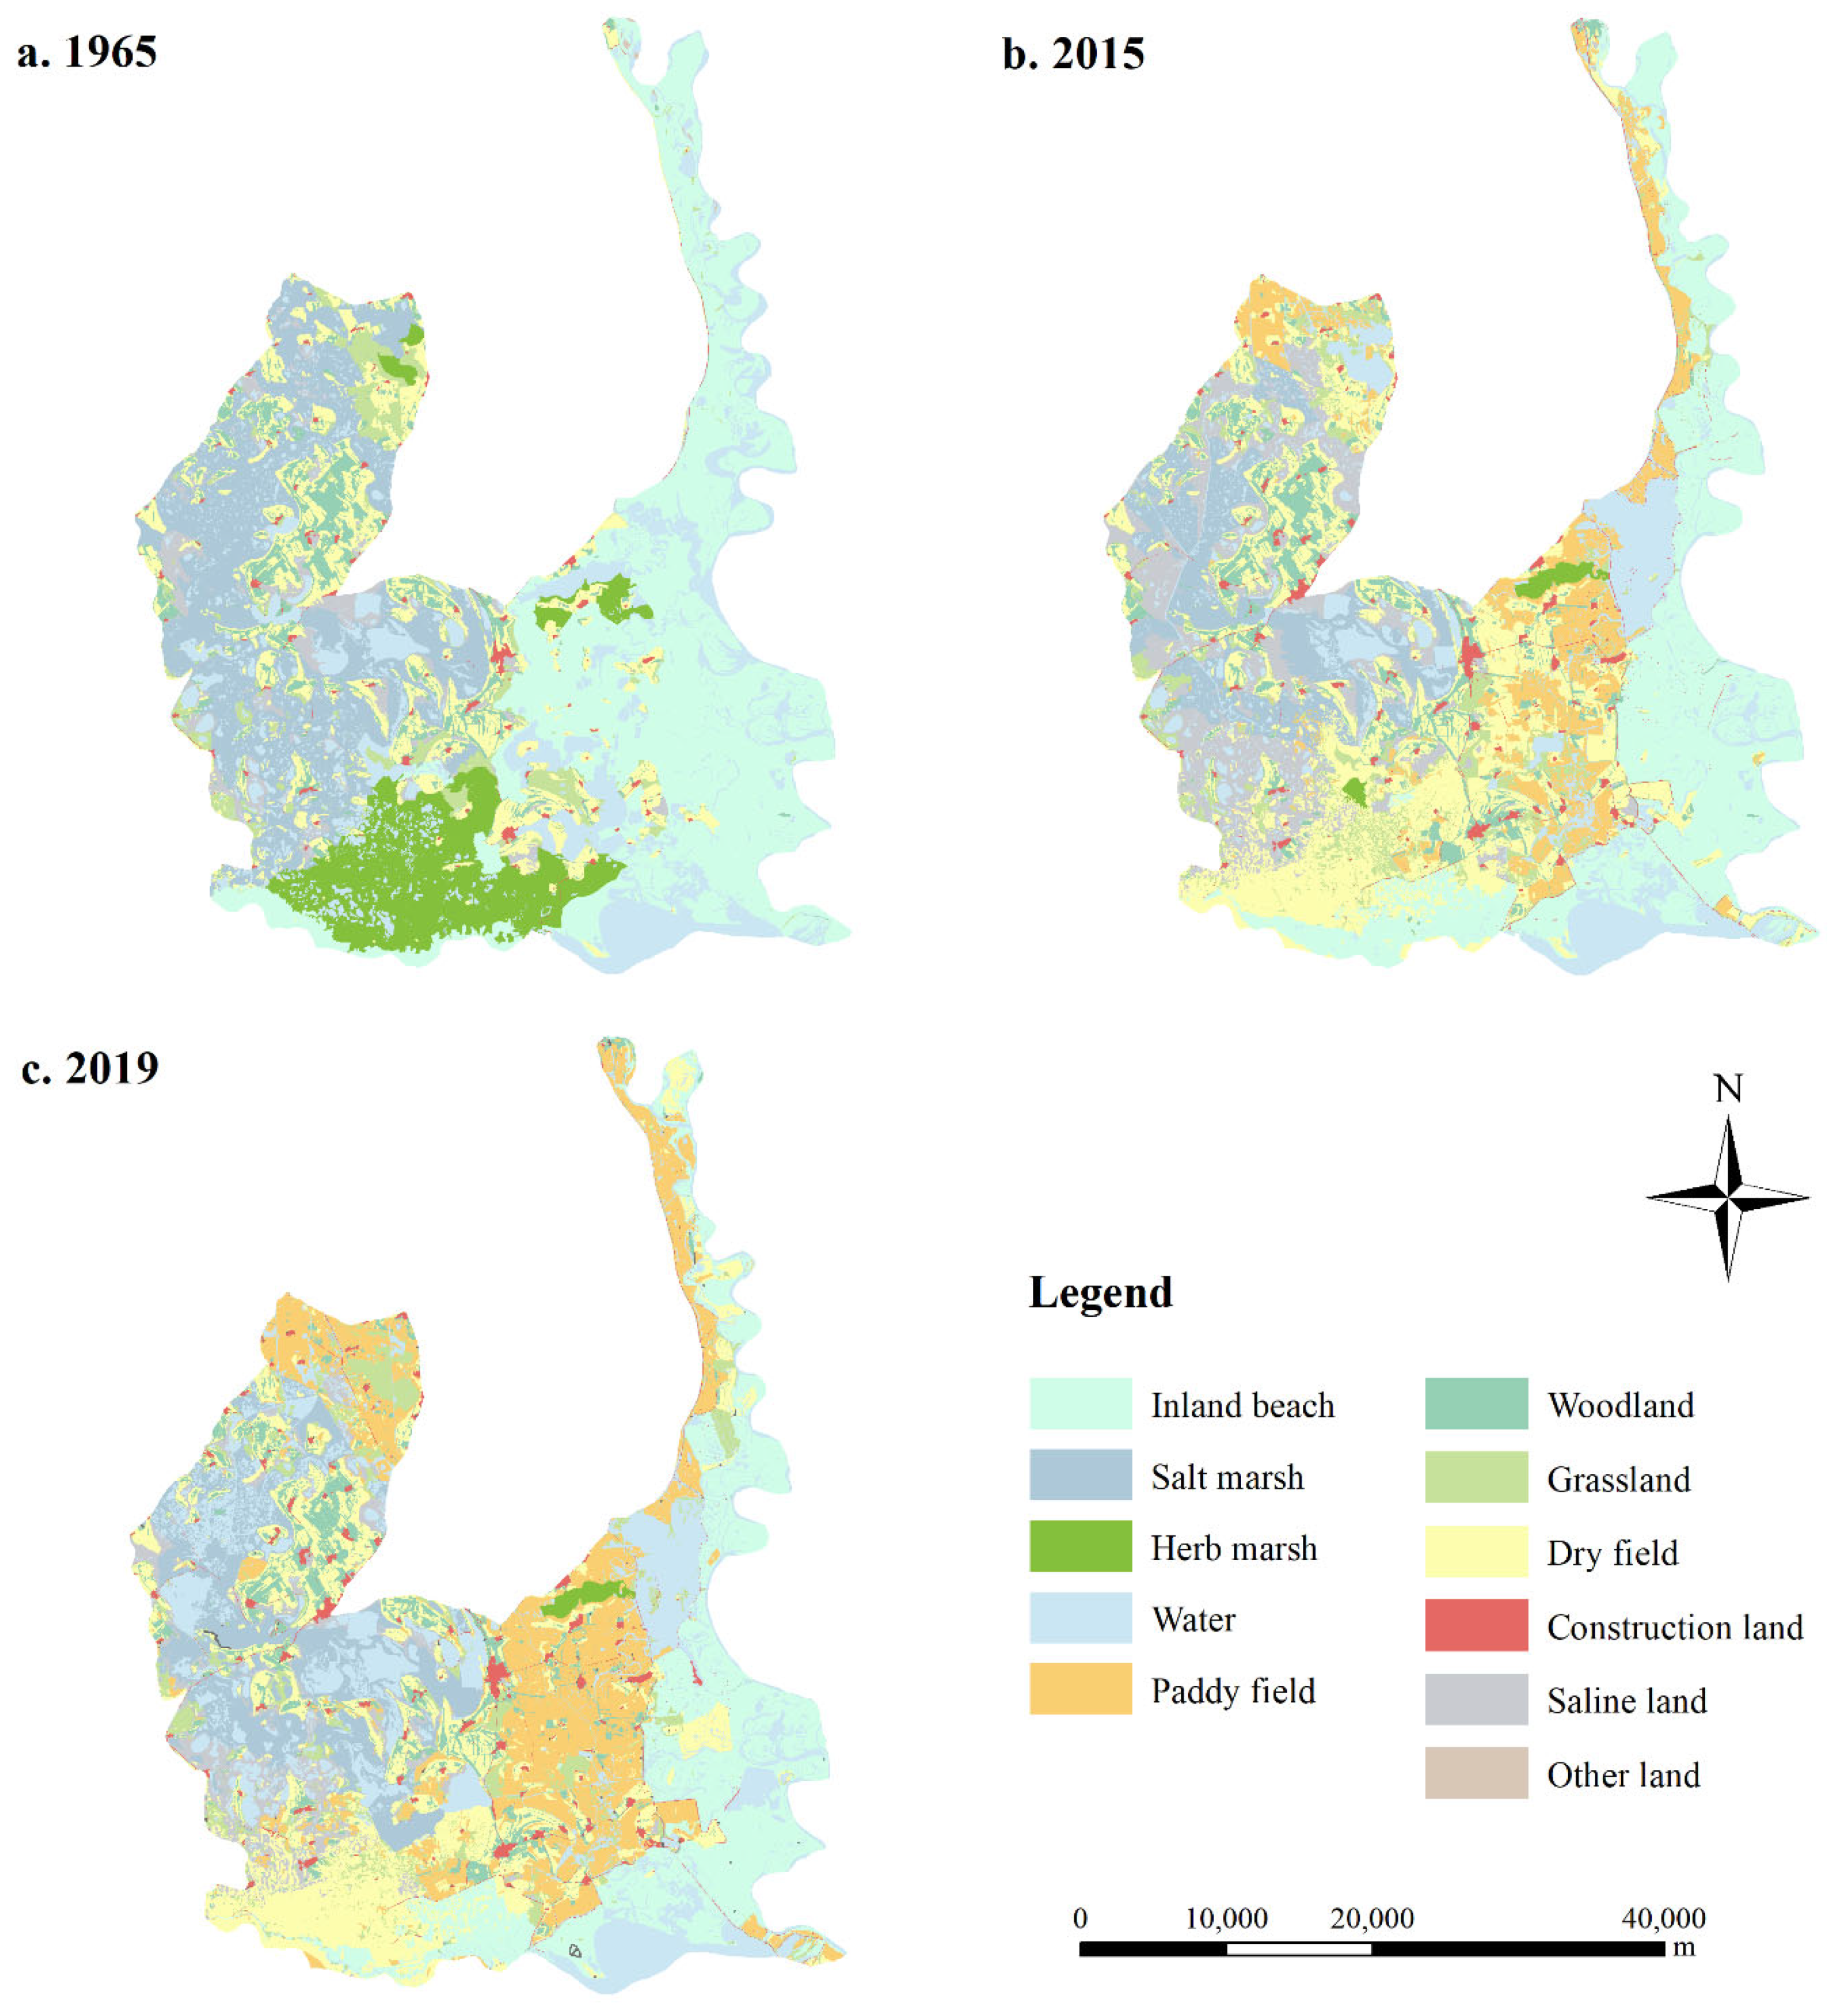
The real spatial distribution of Momoge Internationally Important Wetland in 1965, 2015, and 2019 is depicted in Figure 4. The wetland maps for different years had comparable spatial distributions. The main land cover type in the research region was always wetland, followed by dry field.
The dominant species of wetland was inland beaches, followed by water. Inland beaches and water were primarily distributed along the Nengjiang River in the east and the Tao’er River in the south; salt marshes were primarily distributed in the northwest, where the terrain was slightly elevated; and herb marshes were primarily distributed in the low-lying regions of the south-central portion of the study area. The middle portion of the research region was dominated by arable land. The majority of saline land was found in the depressions surrounding the western lakes and marshes.

3.1.2. Analysis of Wetland Change Spatial Patterns

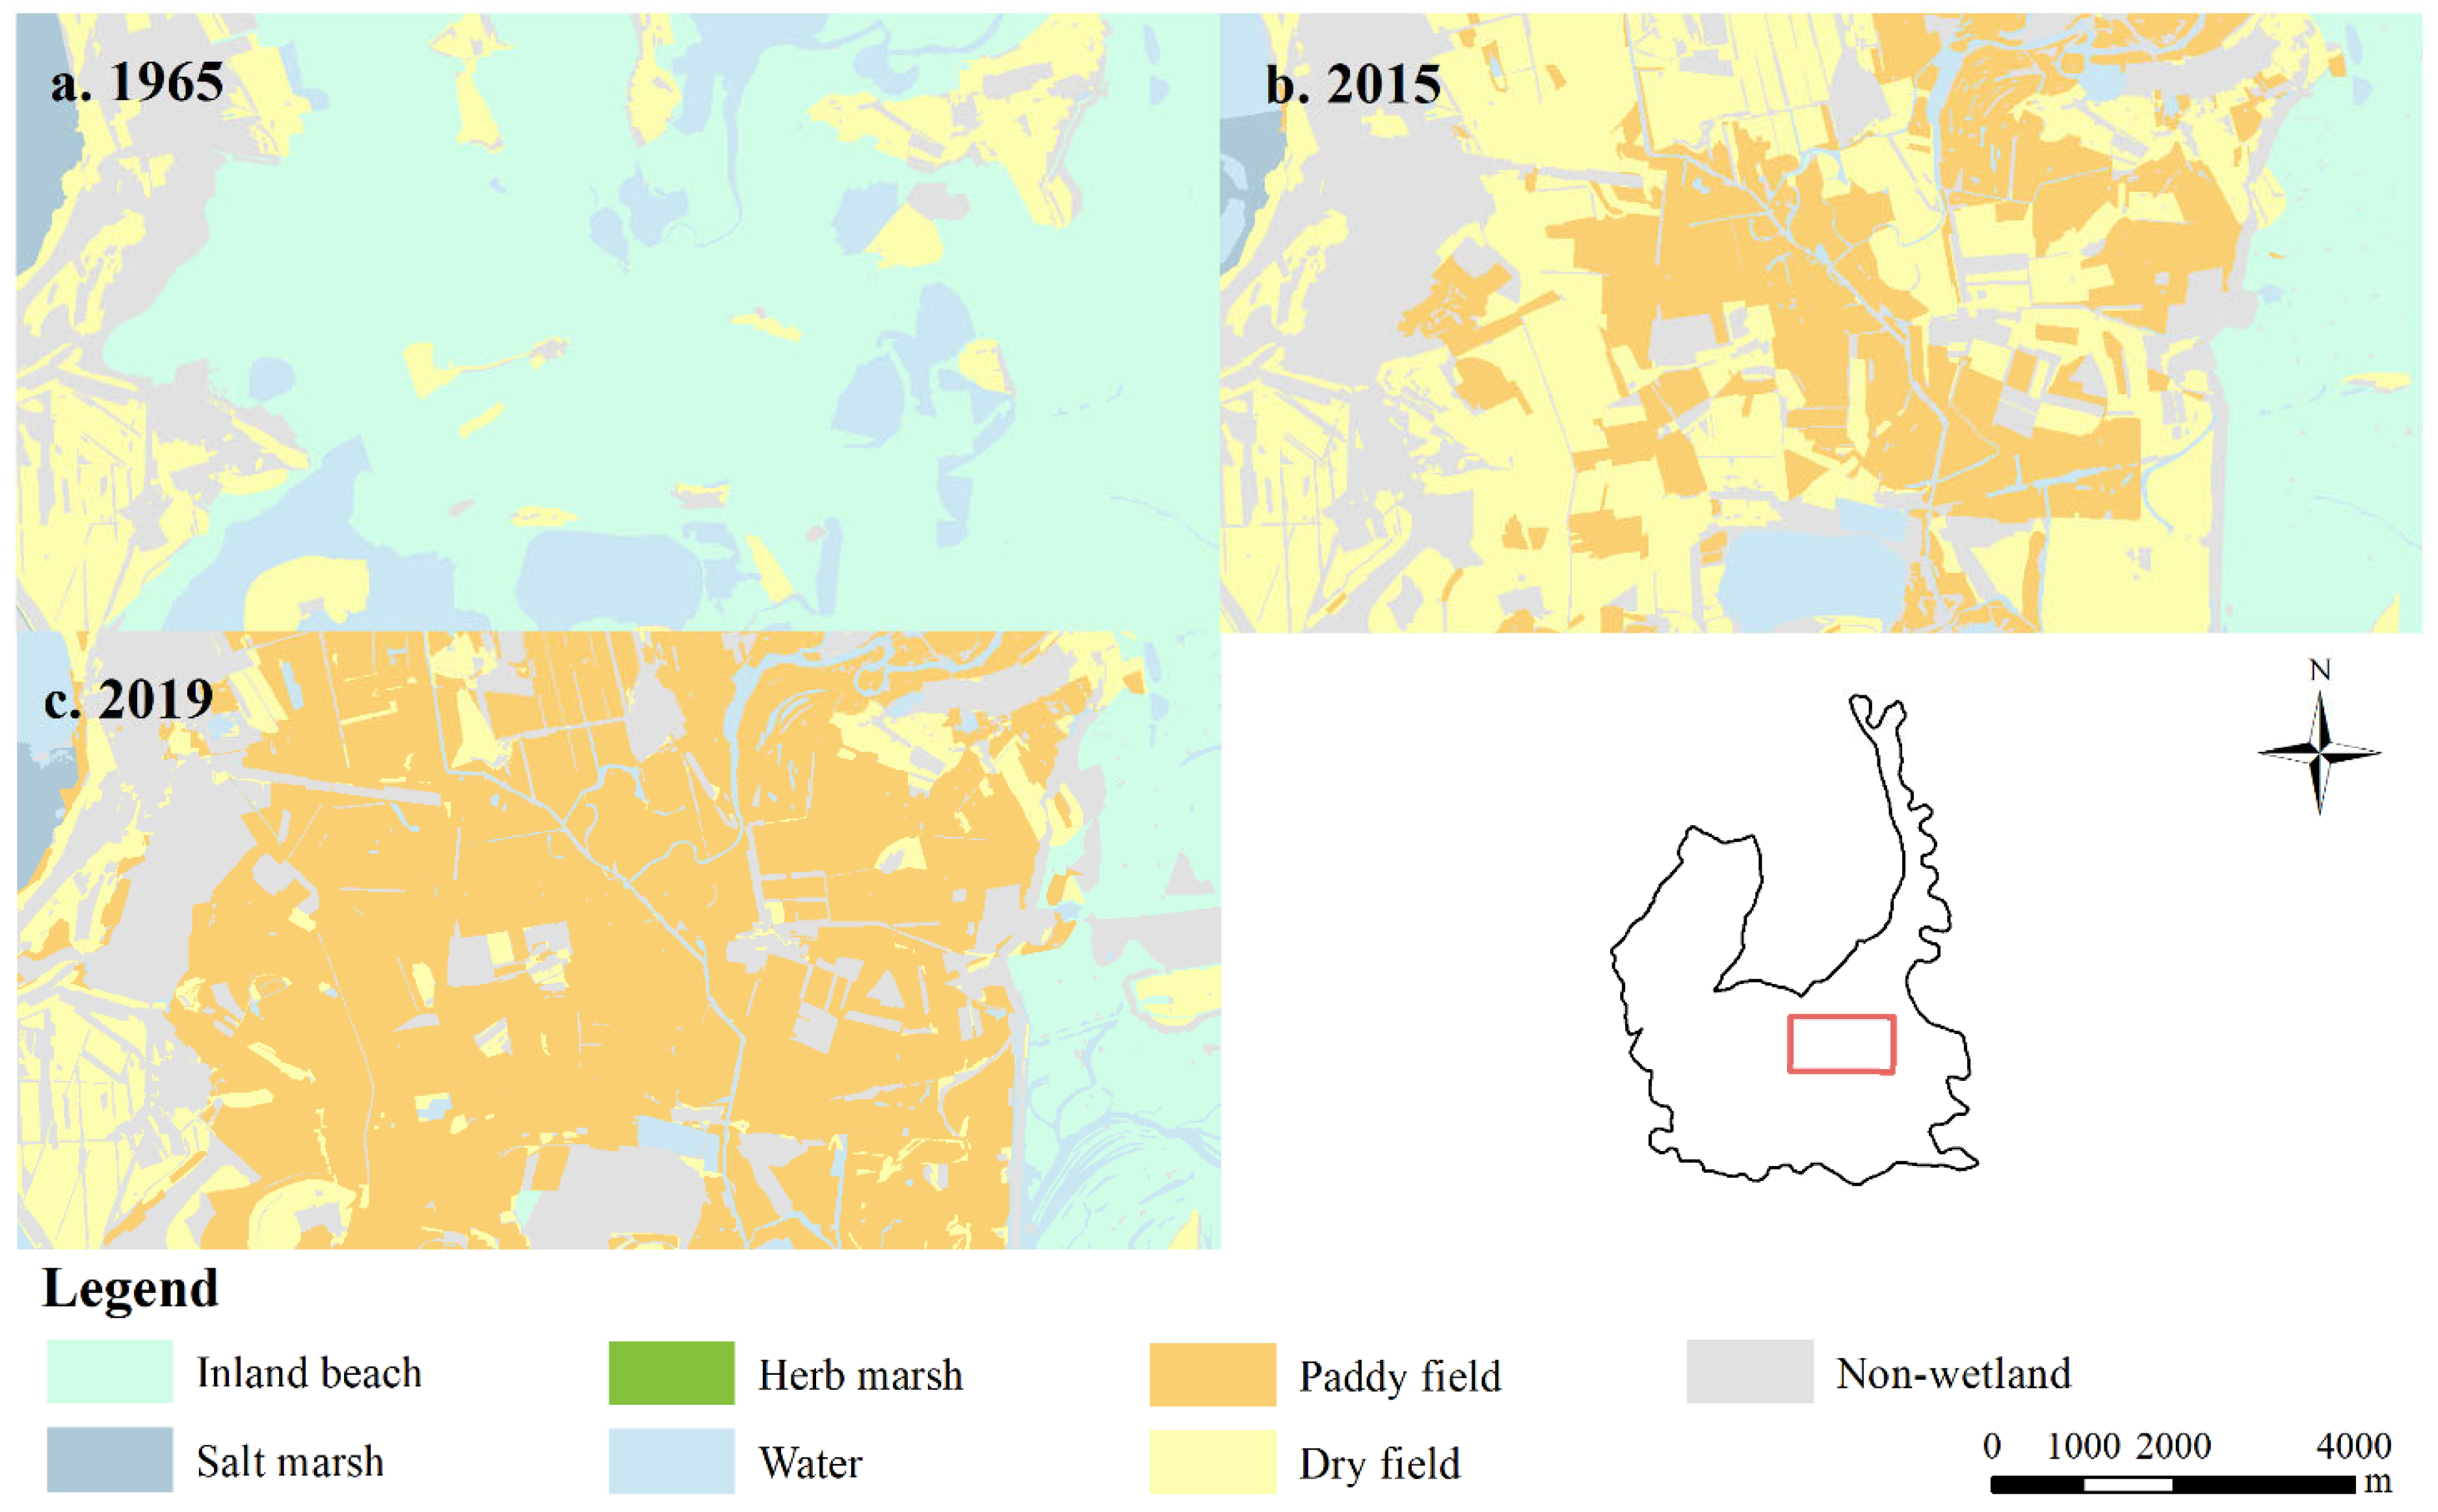
We focused on two degraded regions, which showed wetlands changed in protected areas, in order to investigate the spatial features of wetland at the regional scale during different years. The first area shown in Figure 5, was one of the places where wetland loss is the worst, and inland beaches were the most common type of wetland there.
This typical region was considered agricultural terrain. The government carried out agricultural reclamation in the reserve between 1965 and 2015 for the purpose of increasing food production. For instance, the southern herb marsh was almost entirely converted to a mixture of arable land and grassland, whereas the western salt marsh was also reclaimed and even degraded to saline land. From 2015 to 2019, the government converted dry fields to paddy fields in an effort to increase the productivity of arable land use. This measure slowed the encroachment of agricultural space on wetland ecosystems. However, in general, degradation continued to dominate the spatial change of narrow wetlands.
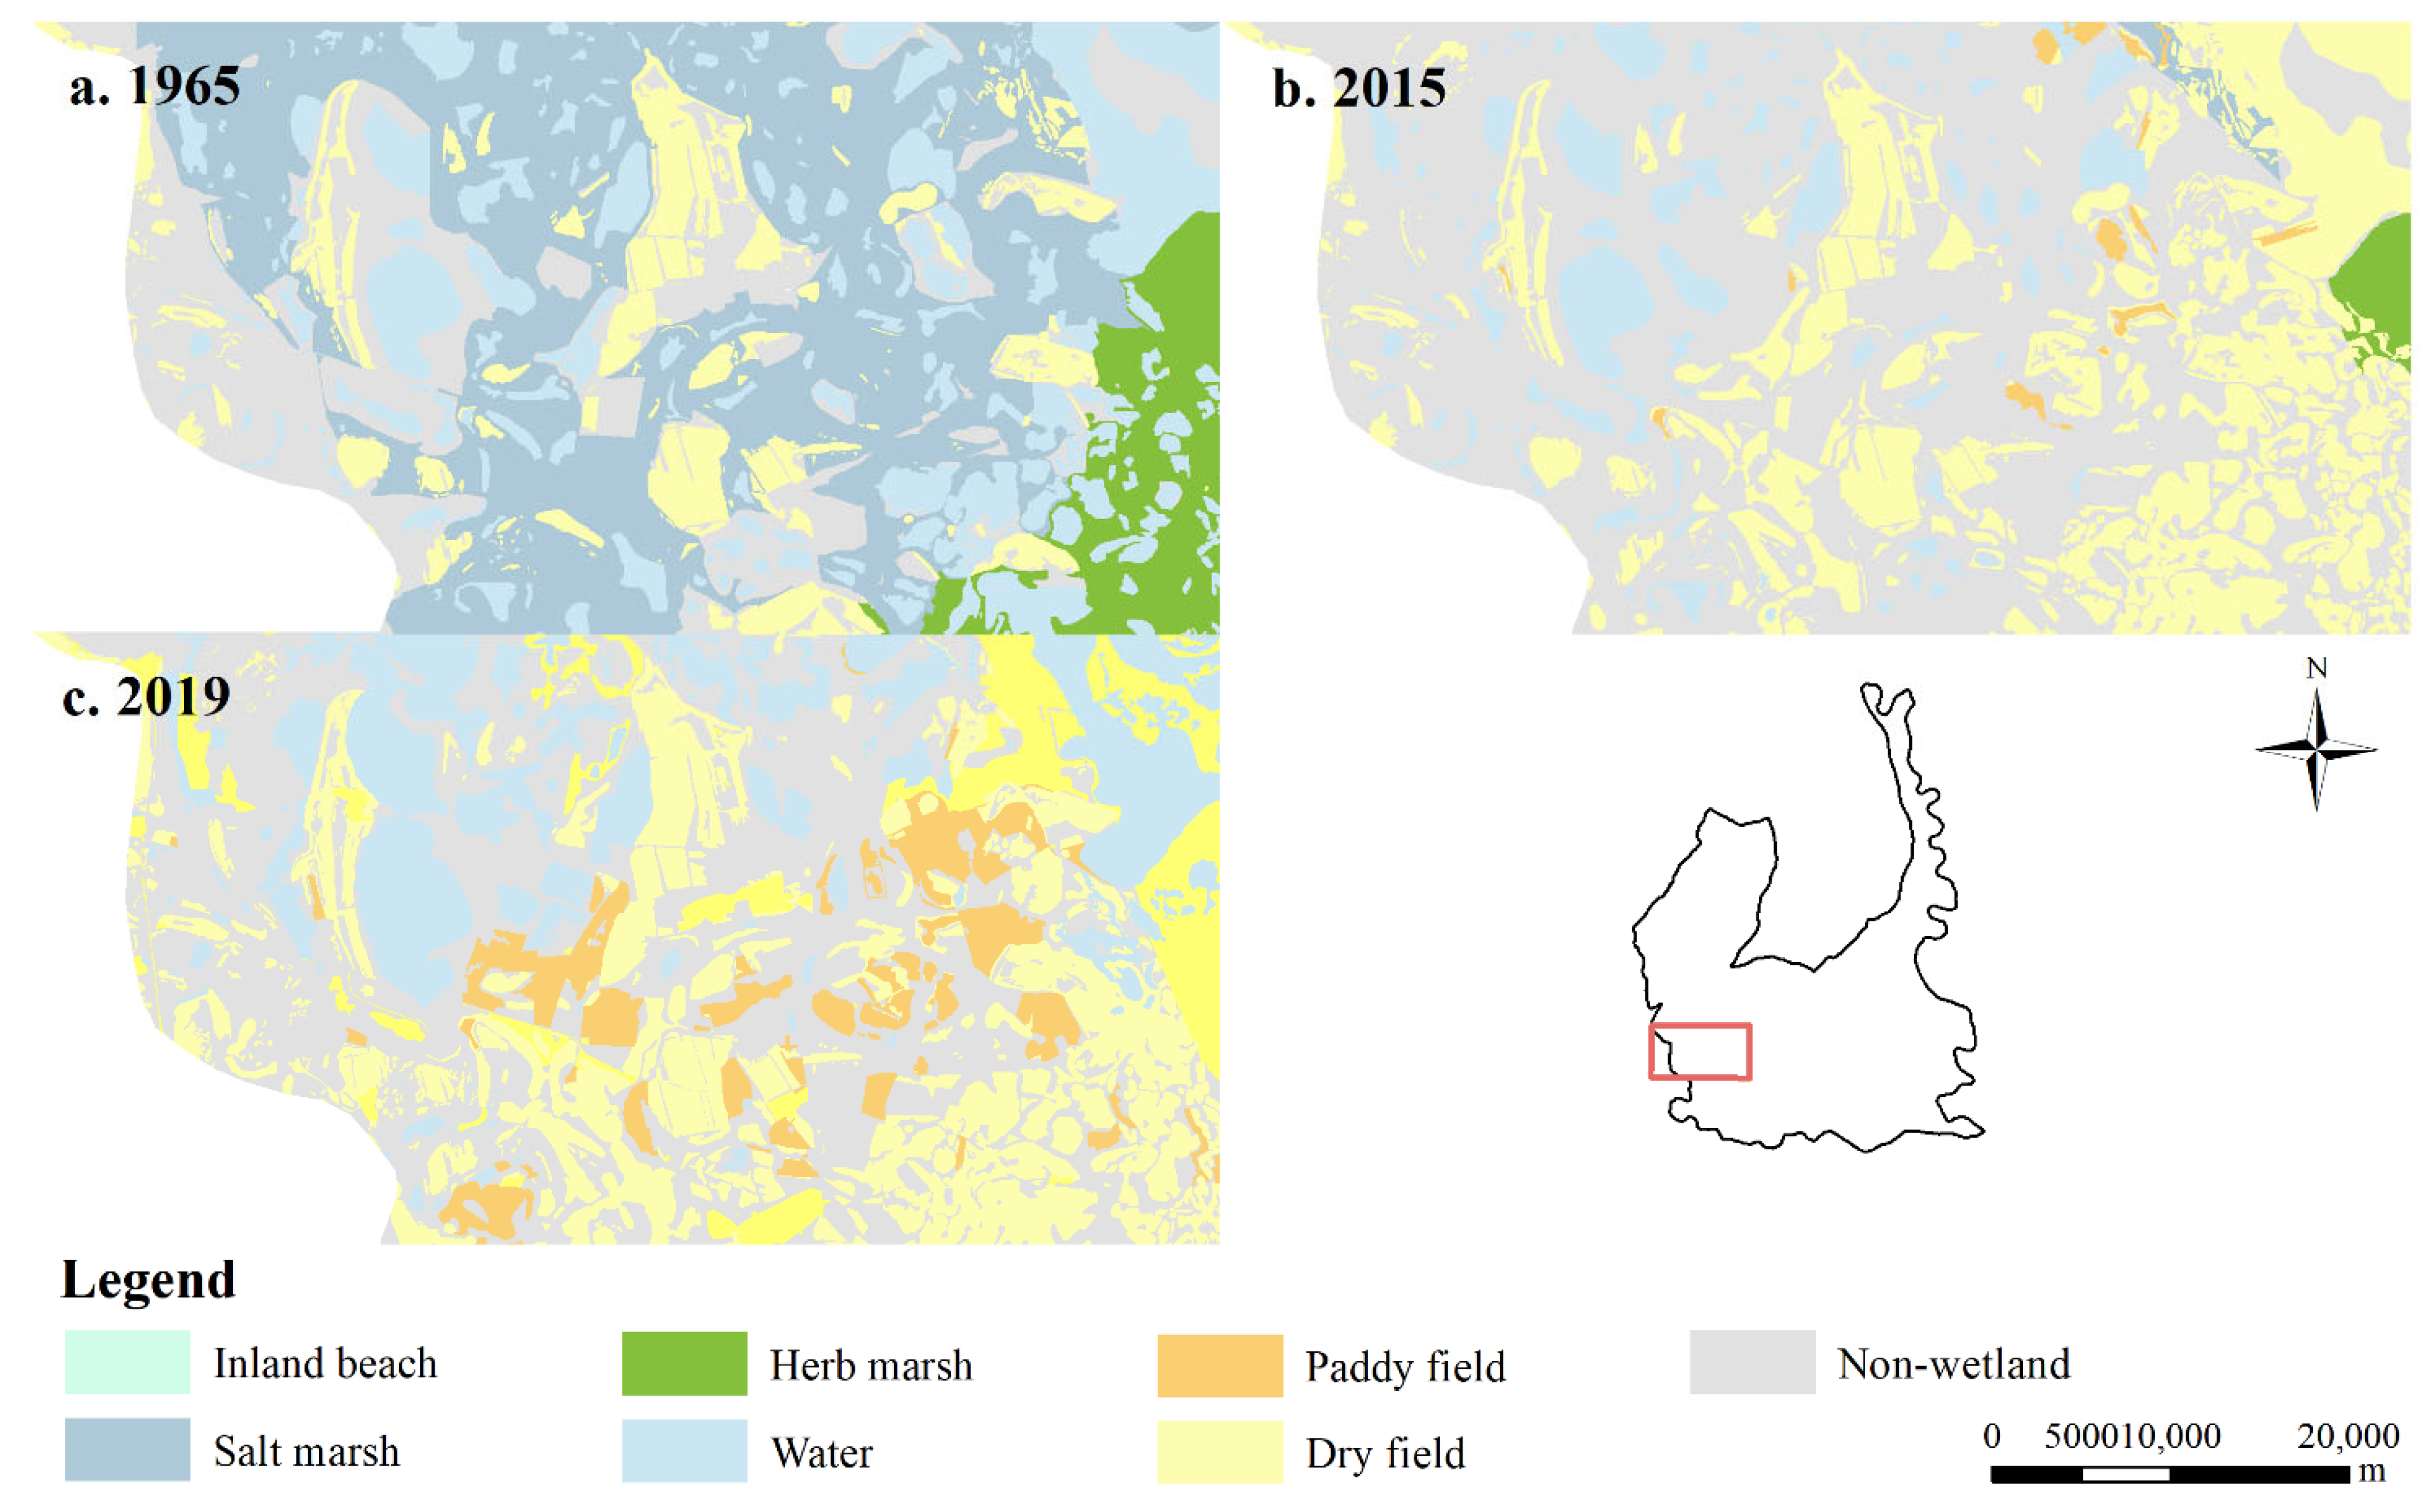
The second location was chosen to illustrate the evolution of water in the western portion of the research area (Figure 6). A sufficient water supply is required to prevent the salt marsh from degrading into saline land. From 1965 to 2019, the amount of water in this region decreased before increasing. From 1965 to 2015, the conversion of huge dry areas to paddy fields in the study area led to a dramatic increase in water demands for agricultural irrigation, resulting in a substantial decrease in the area of water. Between 2015 and 2019, the area of water in the research region increased by 6344.70 ha, or 31.21 percent. Different hydraulic engineering methods were employed to make sure that there was enough water to keep the wetland ecosystem healthy and to stop the wetland from becoming more salty and growing meadows.

3.1.3. Analysis of Wetland Changes throughout Time

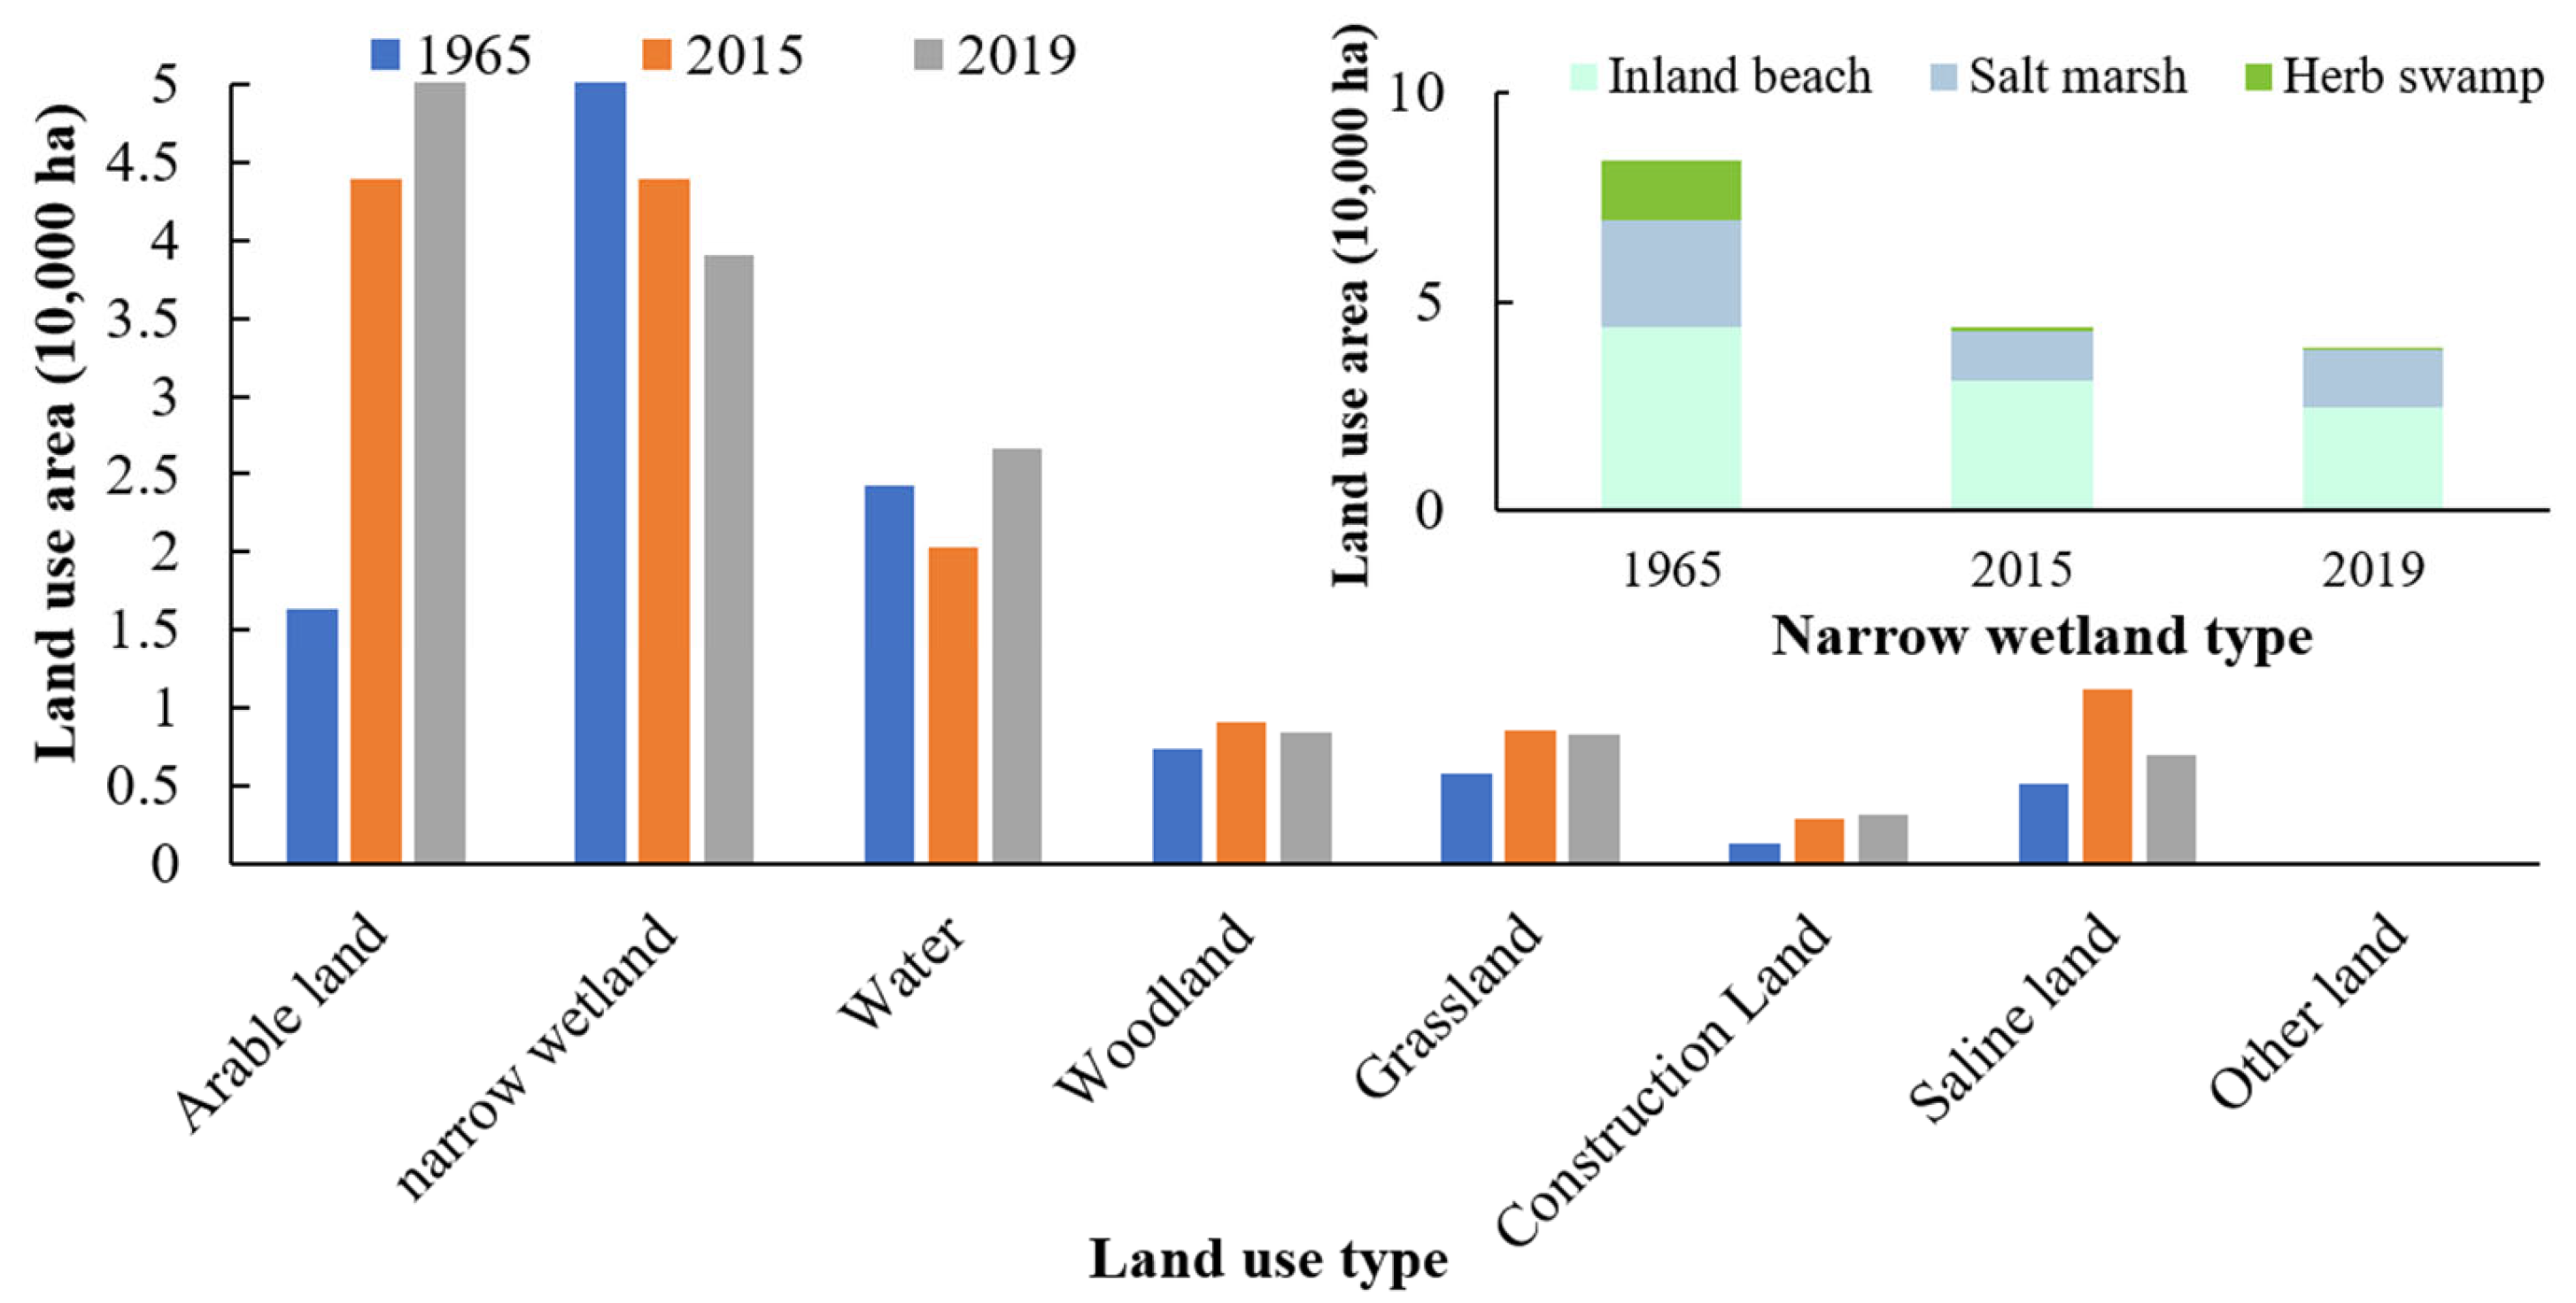
To investigate the temporal aspects of wetland changes, we computed the changes in wetland area from 1965 to 2019 (Figure 7). Over the two time periods, the areas of both arable land and construction land increased continuously. Wetlands were the only land type of which proportion of the area continued to decline, falling from 75.06 percent to 45.62 percent. The area of every subcategory of wetland except water and salt marsh dropped.
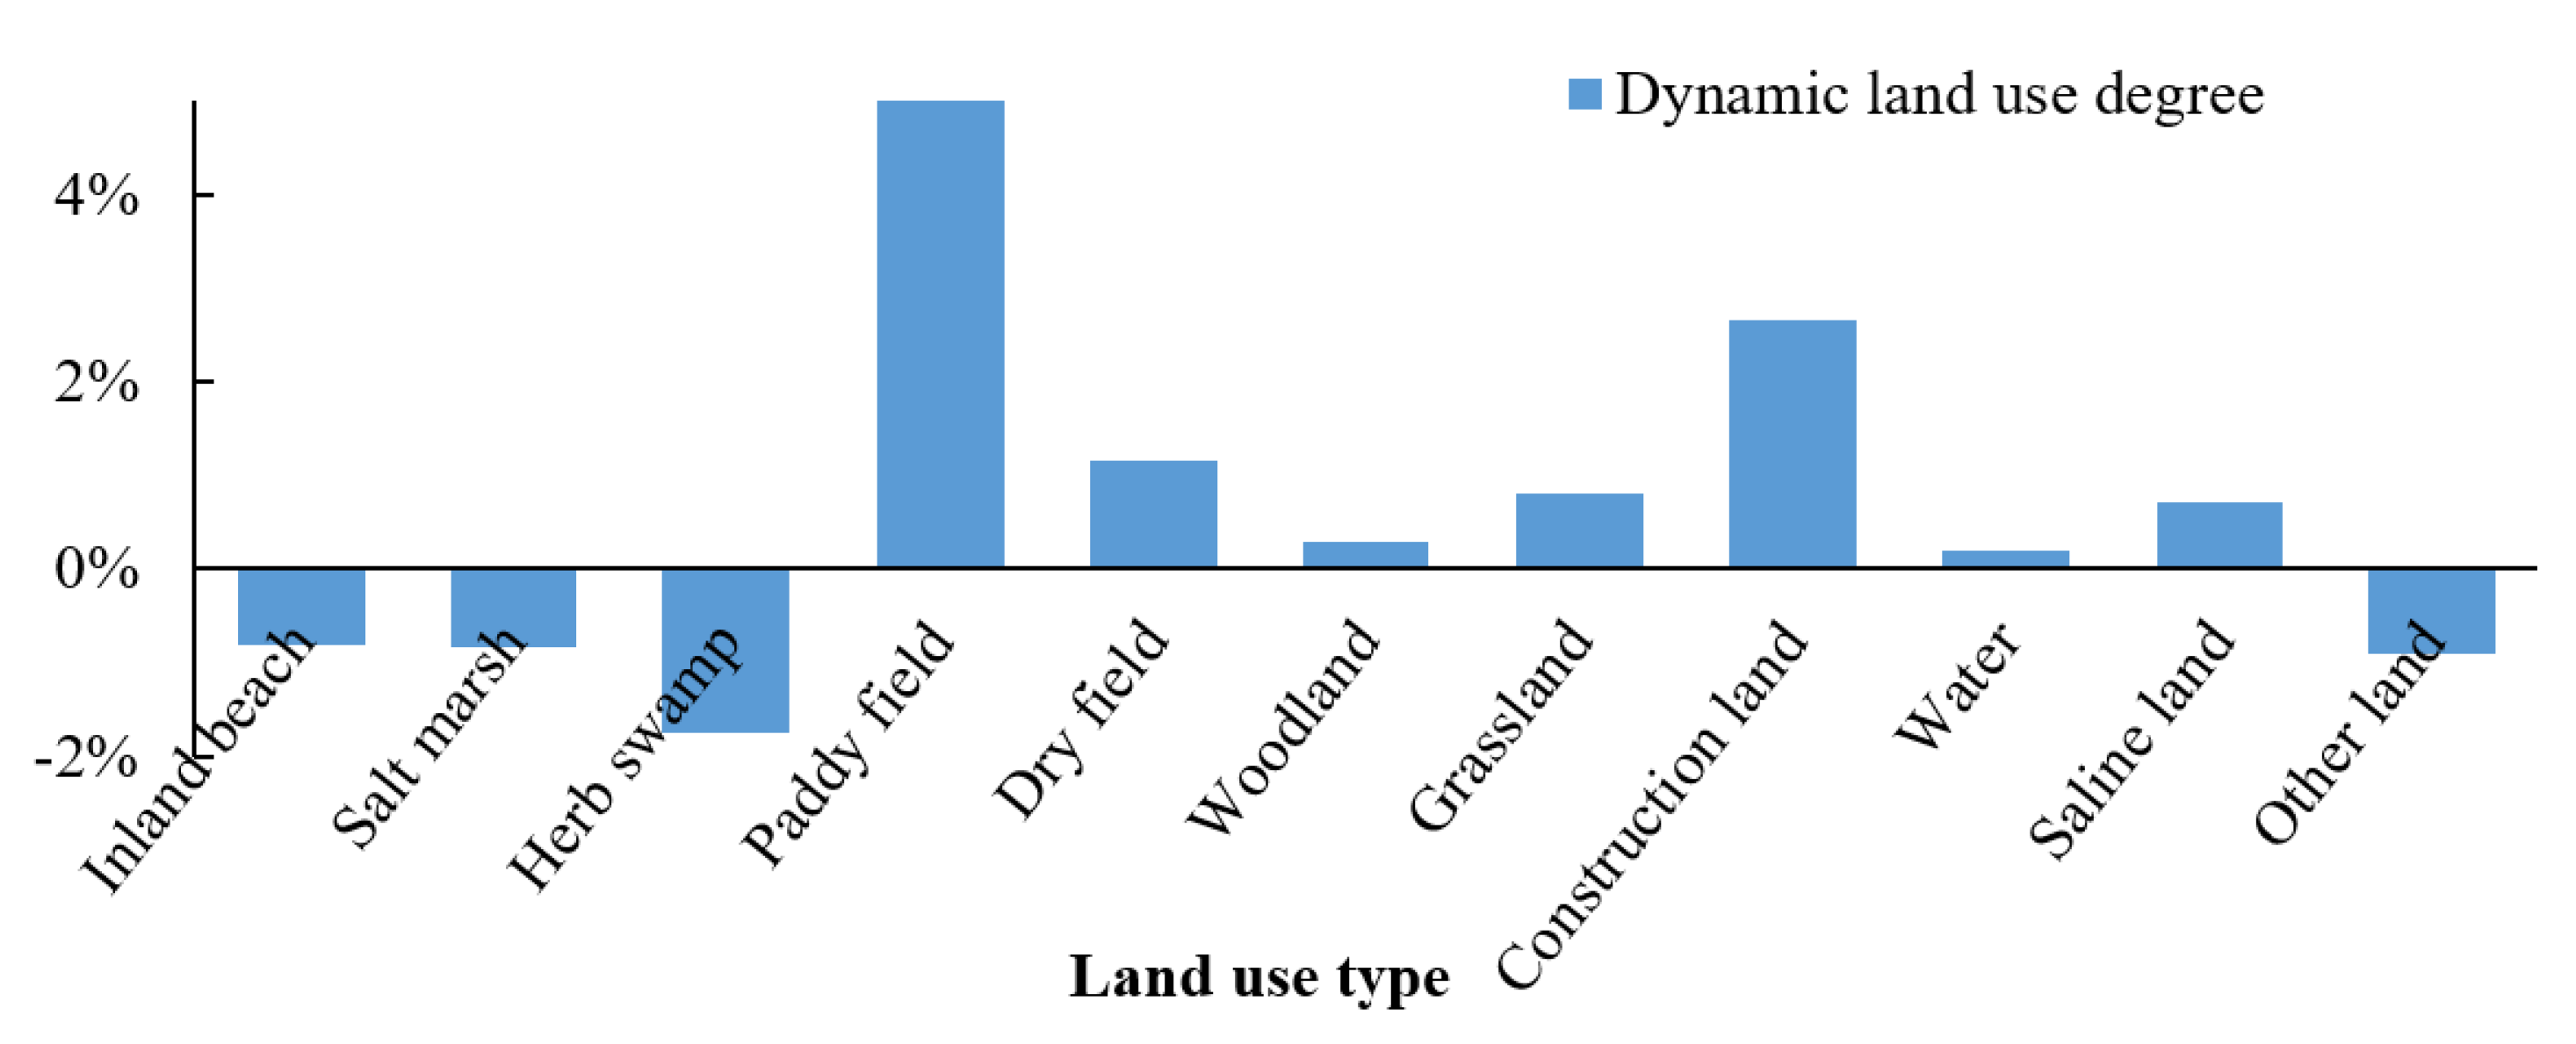
From 1965 to 2019, land use in the Momoge Internationally Important Wetland changed greatly (Figure 8), and the rates of change for different types of land were very different.
From 1965 to 2019, the area of paddy fields expanded by 24,936.17 ha at the highest yearly growth rate. This was followed by construction land, which increased by 142.67 percent with an annual growth rate of 2.64 percent. With an annual growth rate of 0.69 percent, the amount of saline land grew by 37.49 percent. The area of a narrow wetland was reduced by 53.43 percent, at a rate of 0.99 percent per year. It is likely that non-wetland areas such as arable land, construction land, grassland, and saline land grew at the expense of wetland in the research area.

3.2. Analysis of the Ecosystem Integrity Index

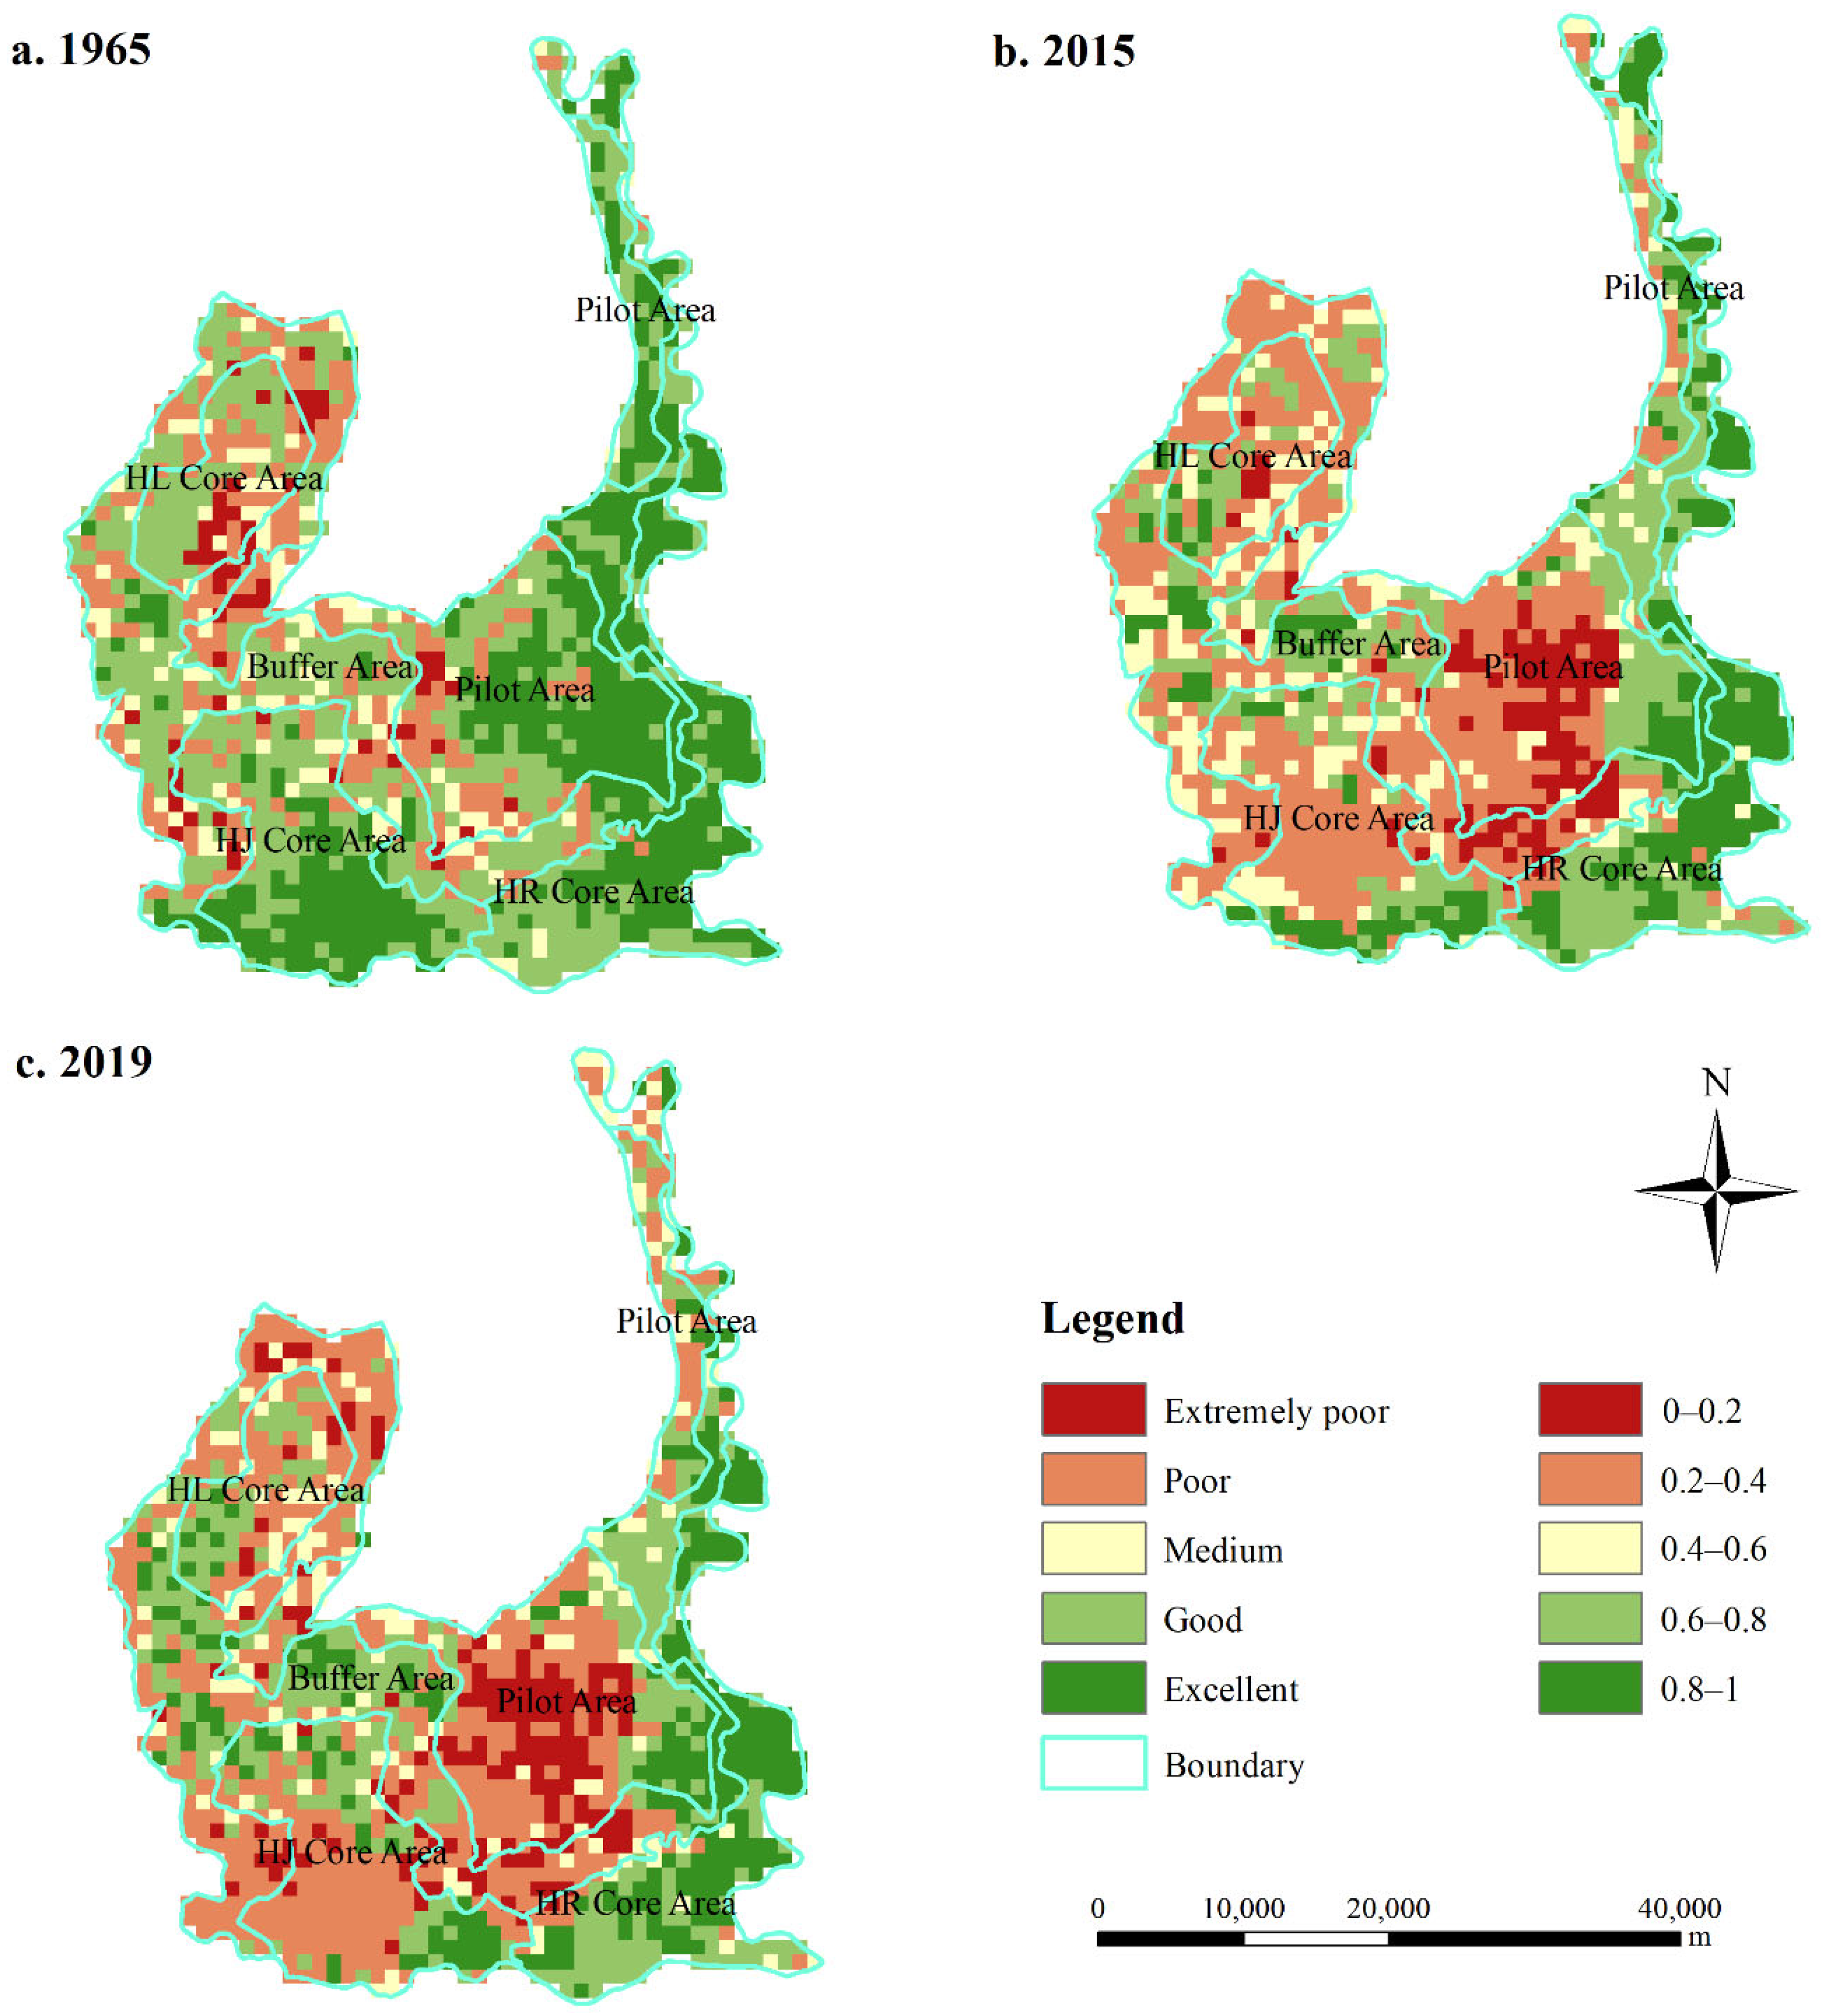
The Momoge Nature Reserve can be separated into three types of areas. The pilot area, buffer area, and core area are listed in descending order of the degree of human activity allowed in each area. The core area consists of the HJ core area, the HR core area, and the HL core area.
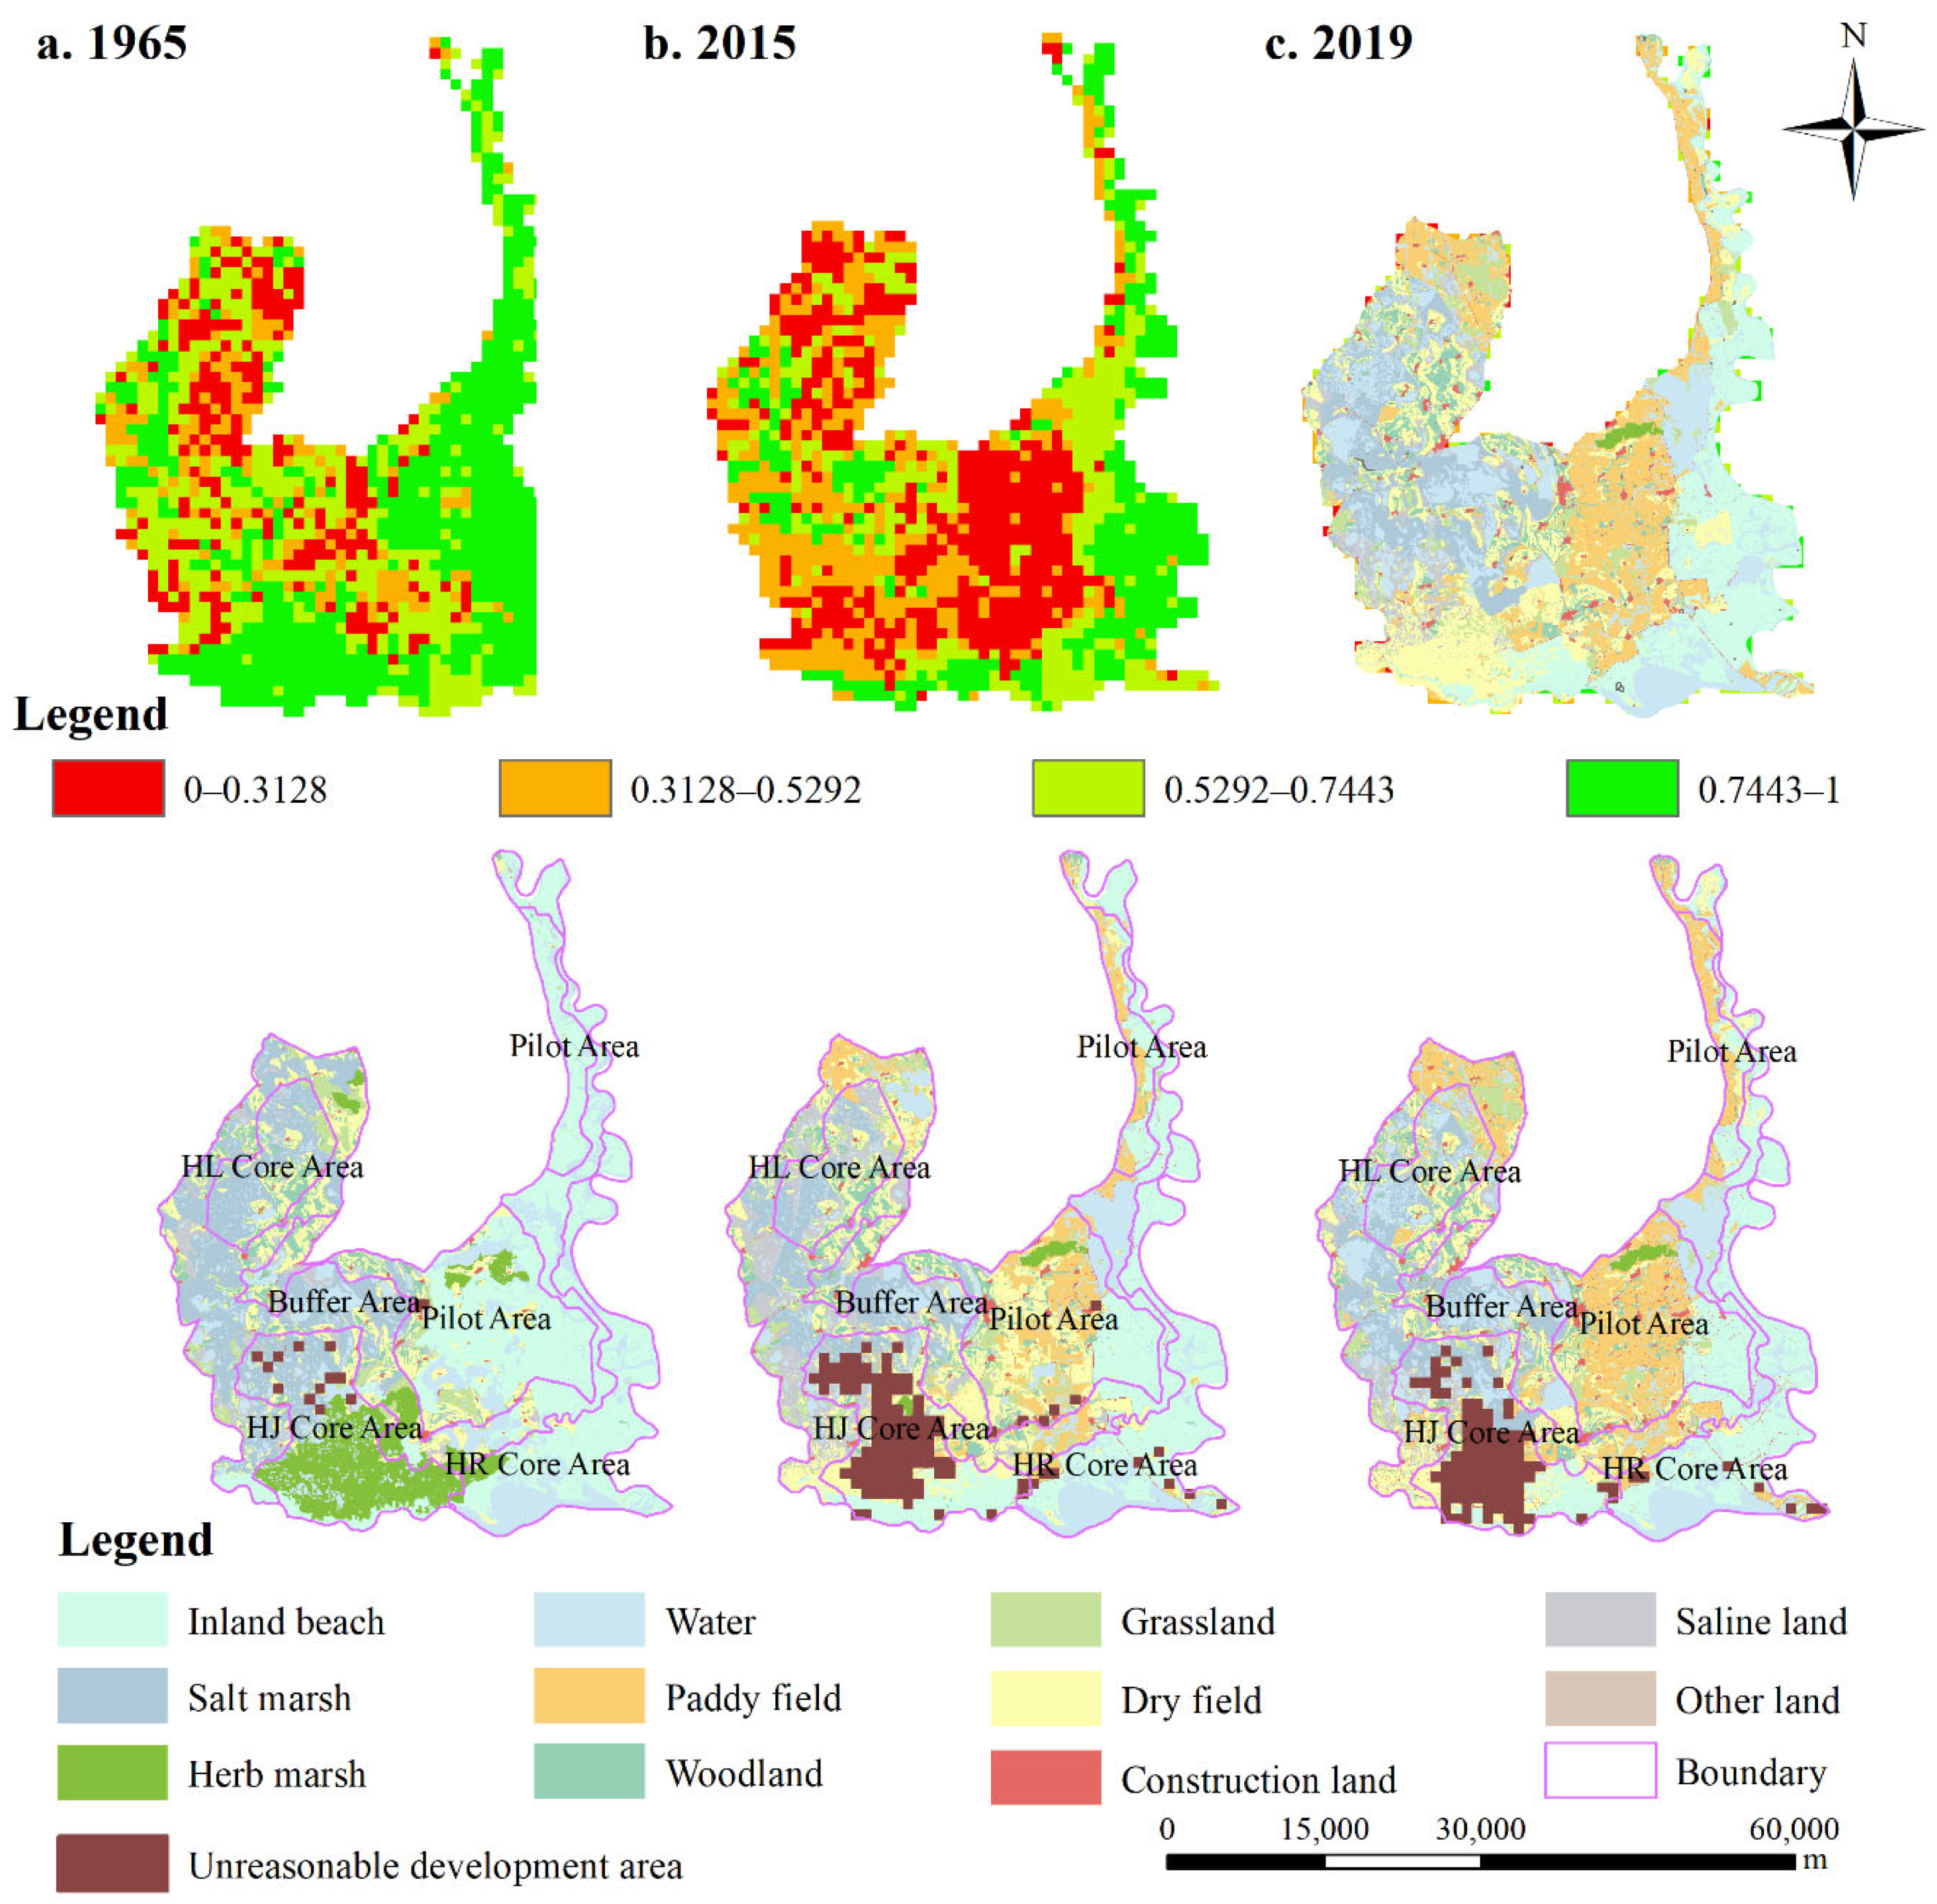
In terms of ecosystem integrity rating (Figure 9), the majority of the Momoge Internationally Important Wetland was in a relatively pristine and untouched state in 1965, with 31.64 percent, 38.83 percent, and 7.81 percent of the territory receiving excellent, good, and medium ratings, respectively. In 2015, 17.95 percent, 23.62 percent, and 13.86 percent of the research area received excellent, good, and medium ratings for ecosystem integrity. Ecosystem integrity was broken in some places, as 36.79% of the areas were rated as having low ecosystem integrity and 7.78% as having extremely poor ecosystem integrity. The 2019 assessment revealed that over half of the study area had an ecosystem integrity rating of poor or extremely poor. Notably, the number of places with excellent and good ratings for ecosystem integrity increased by 0.42 percent and 1.45 percent, respectively.
Figure 9 shows that the ecosystem integrity of the eastern part of the Momoge Internationally Important Wetland was much higher than those of the middle and western parts. Affected by the zoning of the nature reserve, the pilot area in the center of the research area contained the majority of the regions with low ecosystem integrity in 2015 and 2019. This was mostly due to the extensive conversion of herb marsh into paddy field. Secondly, the northwest region of the research area had poor ecosystem integrity. This region was more susceptible to wetland salinization. The regions with a moderate level of environmental integrity were primarily located near dry field and salt marsh. Most of the places with exceptional ecosystem integrity were located near the Nengjiang and Tao’er Rivers, which are very important for conservation.
The analysis of stacked single indicators revealed that elevation and hydrological conditions influence ecosystem quality components. Rare ducks were able to find better places to breed and grow in the HR core area near the water source. The overall distribution of ecological pressure in the research area exhibited a pattern of high pressure in the center, low pressure in the east and west, high pressure in the north, and low pressure in the south. The areas of high ecological pressure were centered on densely populated rural settlements and arable land, and were distributed in points and clusters. We determined that the central and western regions had a high intensity of human disturbance, a high degree of landscape fragmentation, and poor connectivity between wetland patches. Human activities are were weaker in the eastern zone, and wetland patches exhibited positive clustering and extension trends.

3.3. Identification of Unreasonably Developed Areas in the Momoge Internationally Important Wetland

The irresponsible overexploitation of the historical Momoge region ultimately resulted in the rapid degeneration of wetland ecological processes. The results of this study can be used to effectively diagnose historically overdeveloped areas (Figure 10).
First, we separated the integrated ecological function evaluation value into four grades for the three years to demonstrate the strength of ecological function in different portions of the Momoge Internationally Important Wetland, with the ecological function being stronger the higher the ecological function value. We found that the inappropriate development area in 2015 and 2019 was primarily concentrated in the HJ core area and the adjoining paddy fields within the HR core region that were closer to the buffer zone.

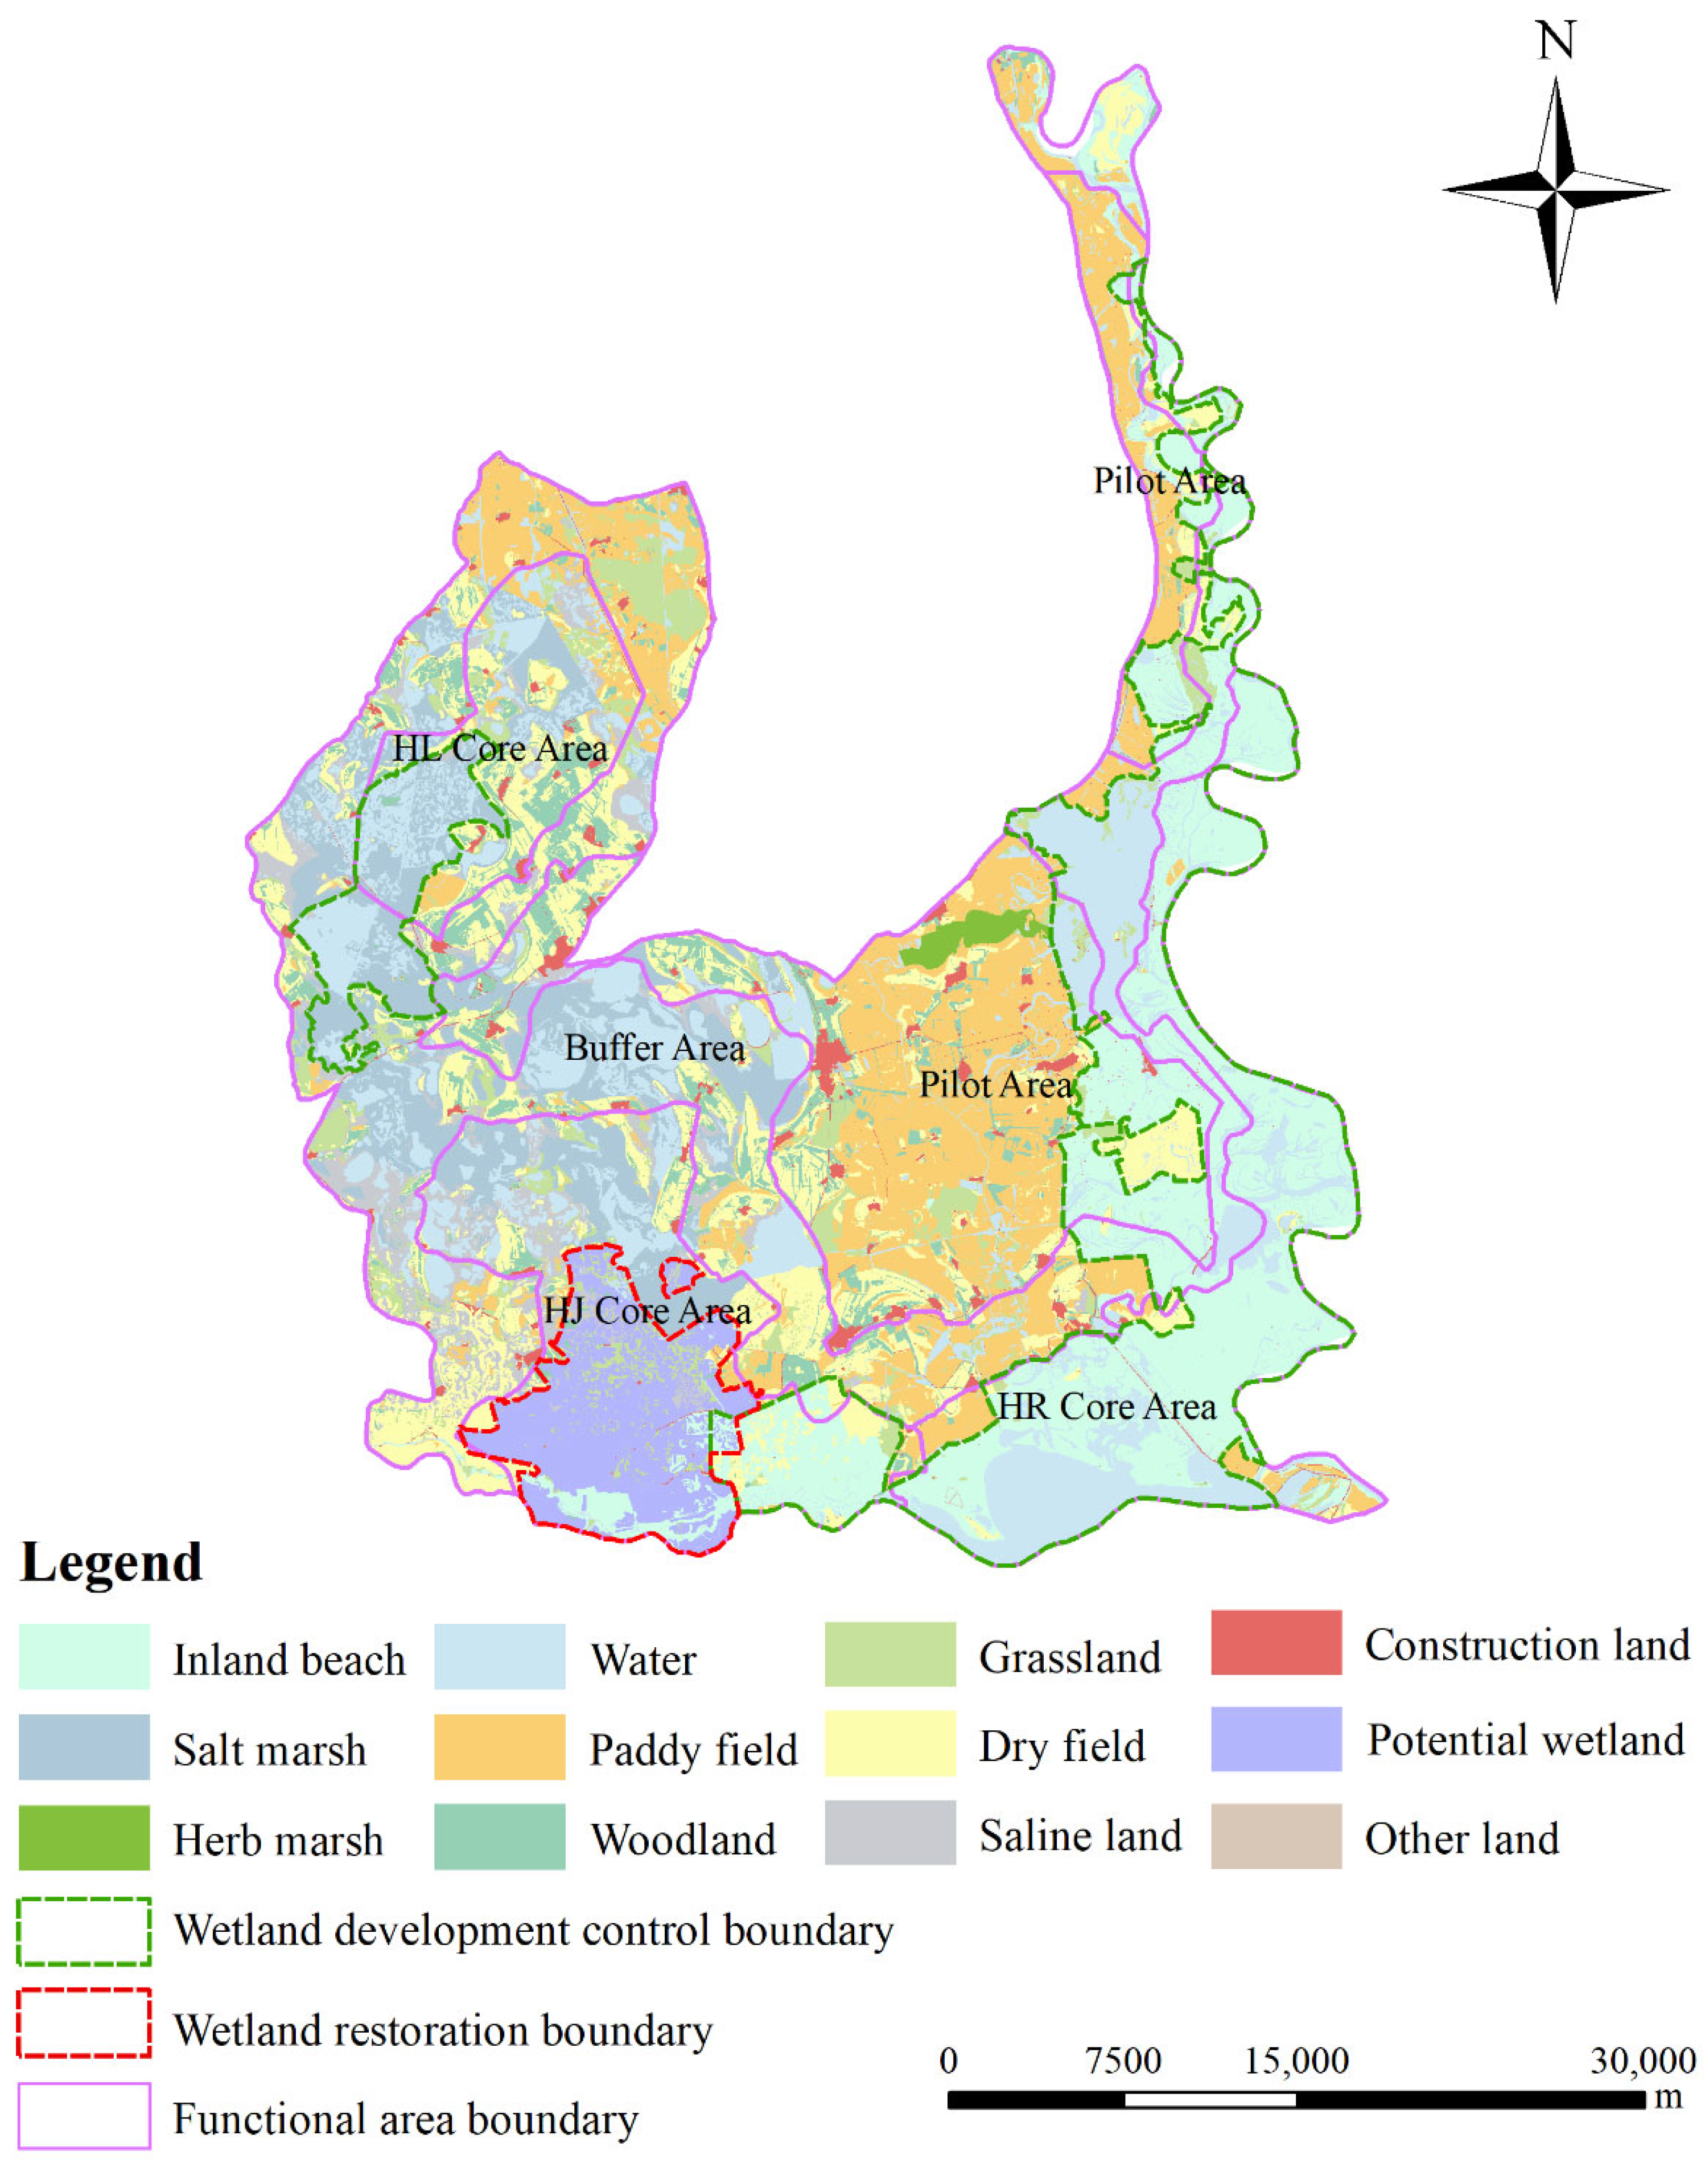
3.4. Delineation for Projects Converting Arable Land to Wetland in the Momoge Internationally Important Wetland

To determine the future boundaries for converting arable land to wetland in the Momoge Internationally Important Wetland, we focused primarily on the identification of the historically over-exploited wetland regions in 2019 and the distribution of wetlands in the area’s original state in 1965. Figure 11 depicts the precise spatial pattern distribution.
Since agricultural land in the pilot area of the Momoge Internationally Important Wetland has already been acquired on a large scale, it would not be possible to convert the arable land to inland beach in the foreseeable future. Therefore, we proposed to maintain the area of arable land in the pilot region and further improve ecological function by converting dry fields to paddy fields (refer to 2015, where areas of dry field have changed to areas of paddy field).
The Momoge Internationally Important Wetland, arable land, woodland, grassland, construction land, and saline land will be adjusted to 72,565.84 hectares, 8332.43 hectares, 4564.55 hectares, 3115.80 hectares, 8389.77 hectares, and 6979.55 hectares, respectively. Based on our assessment of the ecosystem’s integrity and the nature reserve’s future development trends, we drew the wetland control development boundaries of the research area to conserve wildlife-habitat wetlands. Both the eastern and western halves of the nature reserve contain sufficient wetland habitats. In addition, in the pilot area, moderately developed for agricultural purposes could be permitted. For the inappropriate development area in the southern HJ core region, the project of converting arable land to wetland was given priority.

4. Discussion

4.1. Comparative Analysis of the Results

Taking the Momoge National Nature Reserve as an example, the main objective of this study was to evaluate the ecosystem integrity of the study area in 1965, 2015, and 2019. On this basis, unreasonable developed regions were identified, and the restoration of wetland habitats was prioritized. First, we presented a framework for the remote assessment of the integrity and authenticity of ecosystems. Land use data were used to assess the dynamic changes of wetlands. Using the framework provided in this article, we investigated the spatial and temporal trends of ecosystem integrity. Based on the ecosystem integrity index, we identified inappropriately developed regions and determined wetland restoration boundaries.
Most previous studies have concentrated on a single aspect of a wetland’s historical evolution or ecological function evaluation [46,47]. However, few studies have been conducted on wetland restoration through the evaluation of ecosystem integrity and authenticity. Ecosystem authenticity and integrity are mutually integrated and holistic concepts, and integrity is more widely discussed in ecology than authenticity.
Land use change is the primary cause of wetland degradation [48,49,50]. Agriculture, the most common cause of land use change, has destroyed more than 50 percent of the internationally significant wetland habitats worldwide [51,52]. Dong, Z. et al. and Wang, Z. et al. researched the processes and causes underlying wetland fragmentation and contraction, and they discovered that agricultural growth in the context of climate change was the primary cause of the massive loss of wetland in the western Sonnen Plain [53,54].
The simultaneous stress of climate change and human disturbance has destabilized the wetland’s basic ecological structure and constitutes a grave threat to the ecosystem [55]. The lack of water in wetlands is the primary cause of the considerable decline in ecosystem integrity in Momoge National Nature Reserve. Changes in land use type were spatially concentrated in the HJ core and the central pilot area, where wetland development has historically been more intense. Jilin Province’s 14th Five-Year Plan for Ecological Protection projected a 60 percent effective rate of wetland protection by 2035.
In environmental integrity and authenticity evaluations, one may use an undisturbed or slightly disturbed ecosystem as a reference standard. In the current context of human growth, few ecosystems remain untouched by human activity. As a result, the natural state (e.g., the state closest to the natural habitat in a regional ecosystem) is typically used as the benchmark in studies. In 1965, the study region had relatively few human disturbances. Therefore, the spatial pattern of the study area was optimized using the level of ecosystem integrity in 1965 as a standard. In this study, the restoration boundary and protection boundary of the wetland was not limited by those of the three original types of functional areas of protected areas.

4.2. Sustainable Development Measures

The following suggestions are provided for the future development of the Momoge Internationally Important Wetland.
(1)
Promoting the project of converting arable land to wetland and increase the quality of arable land.
From 1965 to 2019, the population density of the study region increased from 16 to 29 people per square kilometer, resulting in an increase in the local population’s demand for food. In this setting, if managers continue to increase the amount of arable land by reclaiming wetland, woodland, and grassland to fulfill increased agricultural production needs, the study area’s ecology will be affected by even more dire problems. Several studies have suggested that measures such as “rewetting” and water penetration can be used to mitigate the adverse effects of overexploitation on wetland ecosystems [56,57]. Wetland managers must give the ecological environment the highest priority. The project of converting arable land to wetland is executed gradually in historically overexploited areas, with farmers receiving compensation for the loss of land, in compliance with national legislation. Farmers are also urged to enhance the quality of arable land through reclamation or preparation.
(2)
Enhancing the hydrological connectivity of wetlands and restoring wildlife habitats.
In the past 50 years, climate-related droughts and human activities have contributed to a diminishing supply of water in the Momoge wetland. To restore the quality of waterfowl habitats, we can, on the one hand, execute water system penetration projects and remove unneeded ditches to restore the hydrological system in the study area to its original state. Alternatively, we should conserve the natural reed belt surrounding the habitats of waterfowls, such as whooping cranes, to separate human activity from the birds’ breeding grounds. These techniques will aid in maintaining the stability of the wetland ecosystem to restore these habitats for birds and other animals.

4.3. Uncertainties and Prospects

There are numerous unknown factors relating to the deterioration and development of wetlands in the research area, including policy shifts, population expansion, and climate change. The objective of wetland spatial pattern optimization is not to predict the future exactly, as there are innumerable uncertainties involved, but to explore the potential of the restoration of wetlands in the future in a way that meets biological needs as much as possible.
The remote evaluation approach provides quick assessments of ecosystem integrity, although the framework has some shortcomings. First, the data processing methods used for certain indicators must be enhanced. Due to the limited availability of data, we did not consider many variables that are strongly related to biodiversity. Secondly, the accounting technique for ecological service values must be enhanced. Thirdly, the assessment framework did not effectively take into account the indicators that are used to judge how pristine an ecosystem is. In future research, we will thus consider introducing the spatial and temporal distributions of rare species such as Grus leucogeranus, utilizing the InVEST model to address the effects of climate change or anthropogenic disturbances on ESV [57], and introducing remote metrics aimed at characterizing the authenticity of ecosystems.

5. Conclusions

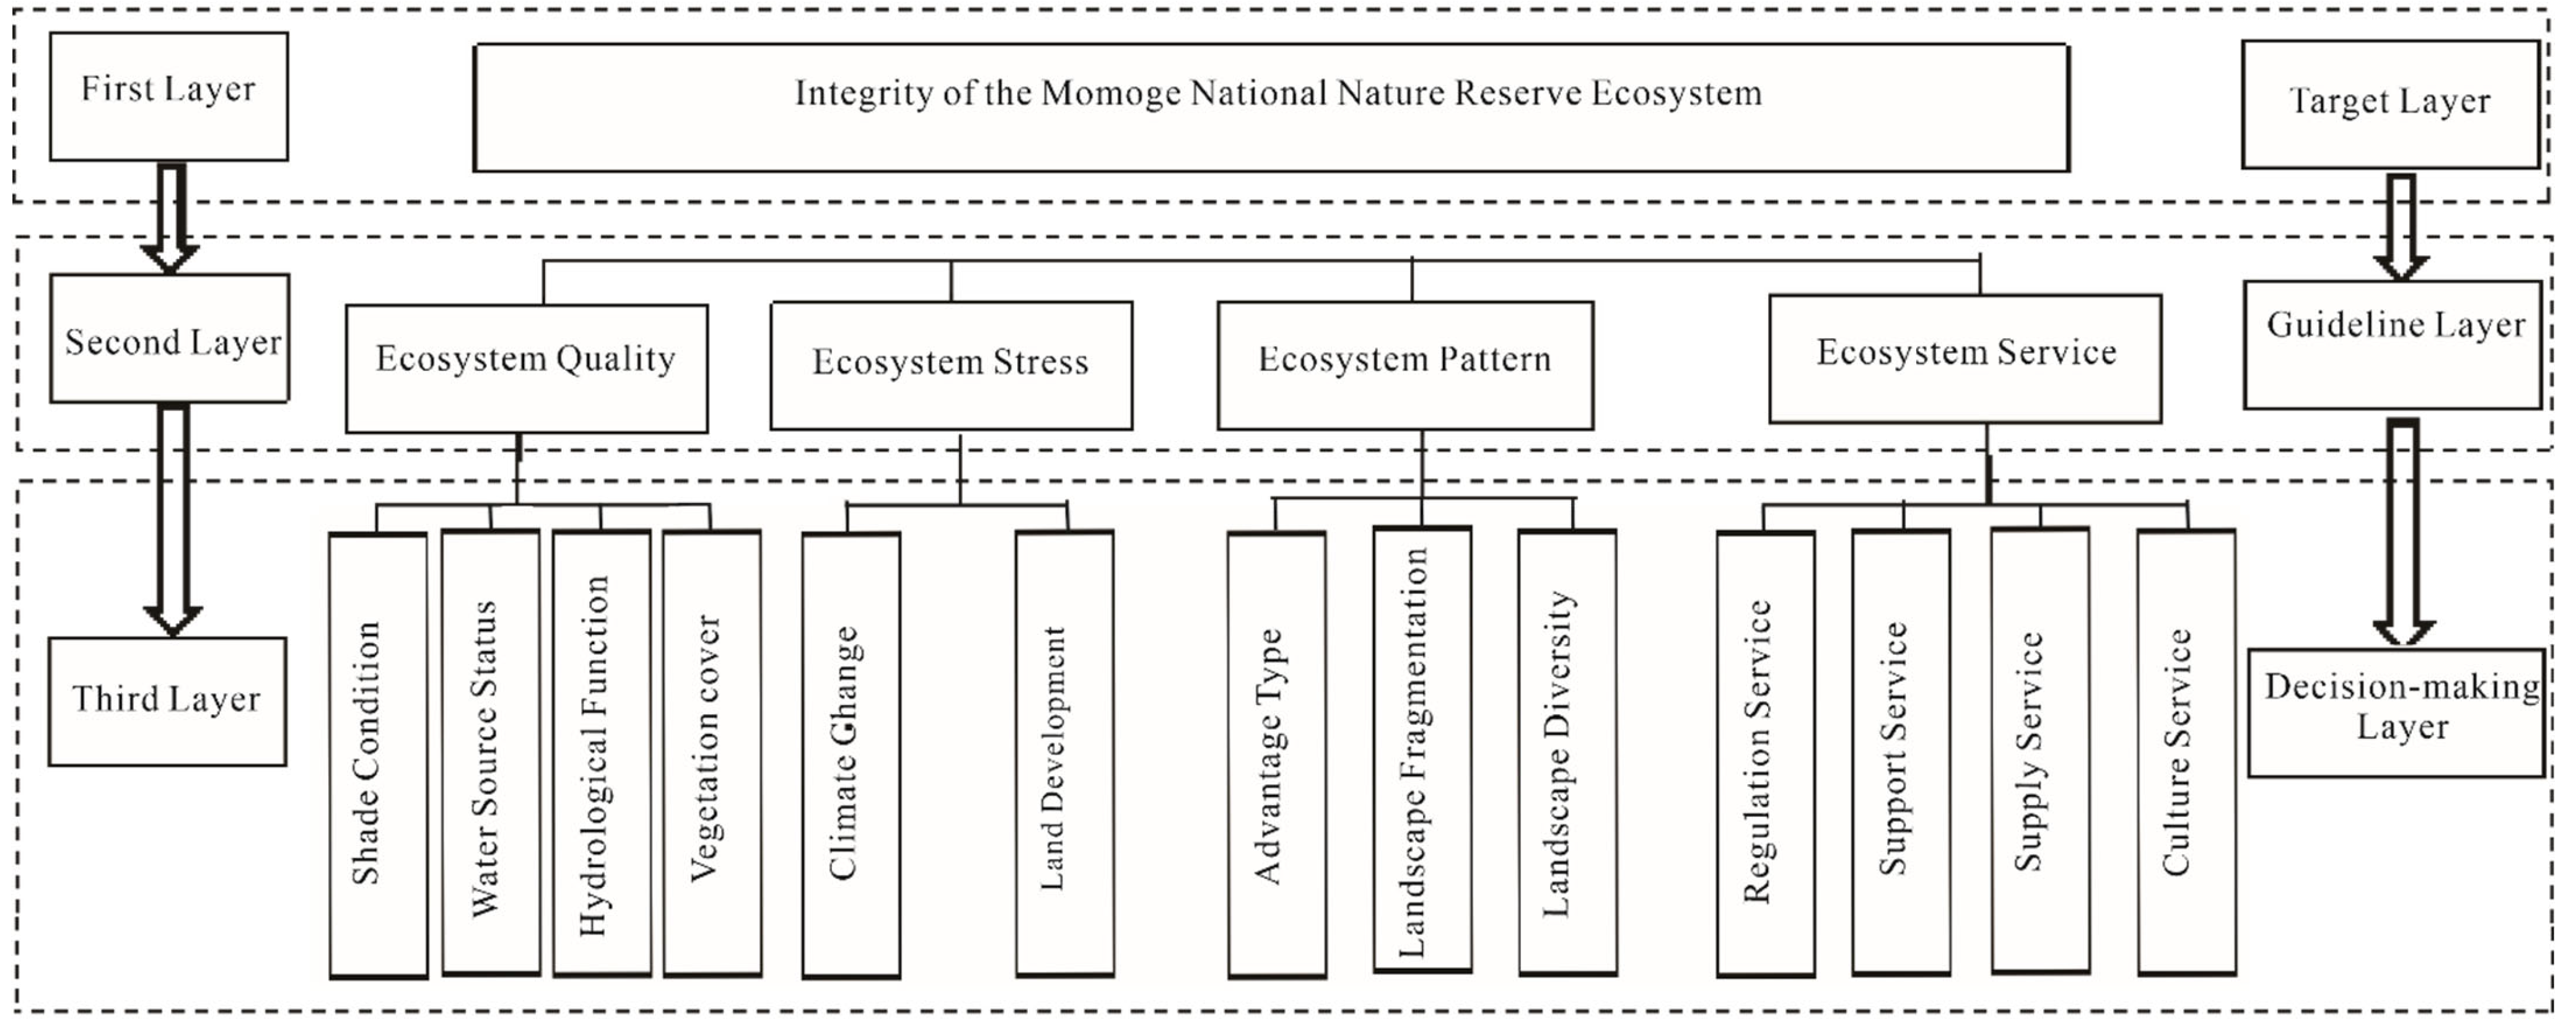
In this study, we combined the EIAF, TLA, and PCFAEI models to develop a “Quality-Pressure-Pattern-Service” remote assessment framework, investigating the ecosystem integrity pattern of the study area, and identifying wetland restoration boundaries and wetland development control boundaries. This framework is an efficient tool for assessing the environmental impact of complex ecosystems. Our research was less costly and applicable on a broader regional scale than conventional methods. In general, the framework can be easily updated and repeated regularly, providing additional data for continued adaptive-management.
The “Quality-Pressure-Pattern-Service” ecosystem integrity remote assessment framework can be broken down into four indices: the ecosystem qualityindex, the ecosystem stress index, the ecosystem pattern index, and the ecosystem service value index. These indices can be used as a set of indicators for natural resource agencies and organizations to monitor the condition of ecosystems. The information gathered to create these indexes can be used to create databases and atlases depicting the condition and trends of important nature reserves. The framework can also be used to identify areas of unreasonable development that need to be prioritized for ecological restoration, while highlighting areas that need to be protected. It can help managers to improve spatial patterns and create ecological restoration targets for entire ecosystems.
In future studies, this remote evaluation system will be integrated with a spatial pattern simulation model. The consequences of land use changes on ecosystem integrity will be investigated under several scenarios based on future simulations.

Author Contributions

Conceptualization, D.W. and S.Z.; methodology, J.H.; software, J.H.; validation, J.H.; formal analysis, J.H.; investigation, J.H.; resources, D.W., S.Z. and J.H.; data curation, J.H.; writing—original draft preparation, J.H.; writing—review and editing, D.W.; visualization, J.H.; supervision, D.W.; project administration, S.Z.; funding acquisition, D.W. All authors have read and agreed to the published version of the manuscript.

Funding

This research was funded by the National Natural Science Foundation of China, grant number 42071255.

Institutional Review Board Statement

Not applicable.

Informed Consent Statement

Not applicable.

Data Availability Statement

All data, models, and codes generated or used during the study appear in the submitted article.

Acknowledgments

Acknowledgement for the data support from “National Earth System Science Data Center, National Science & Technology Infrastructure of China. (http://www.geodata.cn (accessed on 1 July 2022))”.

Conflicts of Interest

The authors declare no conflict of interest.

References

  1. Xu, J.; Zhang, Z.; Liu, W.; McGowan, P.J.K. A review and assessment of nature reserve policy in China: Advances, challenges and opportunities. Oryx 2012, 46, 554–562. [Google Scholar] [CrossRef]
  2. Dearden, P.; Berg, L.D. Canada national-parks—A model of administrative penetration. Can. Geogr.-Geogr. Can. 1993, 37, 194–211. [Google Scholar] [CrossRef]
  3. Huang, X.; Xu, J.; Liu, B.; Guan, X.; Li, J. Assessment of Aquatic Ecosystem Health with Indices of Biotic Integrity (IBIs) in the Ganjiang River System, China. Water 2022, 14, 278. [Google Scholar] [CrossRef]
  4. Liao, J.-Q.; Huang, Y. Research progress on using index of biological integrity to assess aquatic ecosystem health. Ying Yong Sheng Tai Xue Bao = J. Appl. Ecol. 2013, 24, 295–302. [Google Scholar]
  5. Karr, J.R. Biological Integrity: A Long-Neglected Aspect of Water Resource Management. Ecol. Appl. Publ. Ecol. Soc. Am. 1991, 1, 66–84. [Google Scholar] [CrossRef]
  6. Tierney, G.L.; Faber-Langendoen, D.; Mitchell, B.R.; Shriver, W.G.; Gibbs, J.P. Monitoring and evaluating the ecological integrity of forest ecosystems. Front. Ecol. Environ. 2009, 7, 308–316. [Google Scholar] [CrossRef]
  7. Staszak, L.A.; Armitage, A.R. Evaluating Salt Marsh Restoration Success with an Index of Ecosystem Integrity. J. Coast. Res. 2013, 29, 410–418. [Google Scholar] [CrossRef]
  8. Fraser, R.H.; Olthof, I.; Pouliot, D. Monitoring land cover change and ecological integrity in Canada’s national parks. Remote Sens. Environ. 2009, 113, 1397–1409. [Google Scholar] [CrossRef]
  9. Moreno-Mateos, D.; Power, M.E.; Comin, F.A.; Yockteng, R. Structural and Functional Loss in Restored Wetland Ecosystems. Plos Biol. 2012, 10, e1001247. [Google Scholar] [CrossRef]
  10. Menendez, P.; Losada, I.J.; Torres-Ortega, S.; Narayan, S.; Beck, M.W. The Global Flood Protection Benefits of Mangroves. Sci. Rep. 2020, 10, 4404. [Google Scholar] [CrossRef]
  11. Colvin, S.A.R.; Sullivan, S.M.P.; Shirey, P.D.; Colvin, R.W.; Winemiller, K.O.; Hughes, R.M.; Fausch, K.D.; Infante, D.M.; Olden, J.D.; Bestgen, K.R.; et al. Headwater Streams and Wetlands are Critical for Sustaining Fish, Fisheries, and Ecosystem Services. Fisheries 2019, 44, 73–91. [Google Scholar] [CrossRef]
  12. Cavanaugh, K.C.; Kellner, J.R.; Forde, A.J.; Gruner, D.S.; Parker, J.D.; Rodriguez, W.; Feller, I.C. Poleward expansion of mangroves is a threshold response to decreased frequency of extreme cold events. Proc. Nat. Acad. Sci. USA 2014, 111, 723–727. [Google Scholar] [CrossRef] [PubMed]
  13. Sheaves, M.; Baker, R.; Nagelkerken, I.; Connolly, R.M. True Value of Estuarine and Coastal Nurseries for Fish: Incorporating Complexity and Dynamics. Estuar. Coasts 2015, 38, 401–414. [Google Scholar] [CrossRef]
  14. Davidson, N.C. How much wetland has the world lost? Long-term and recent trends in global wetland area. Mar. Freshw. Res. 2014, 65, 934–941. [Google Scholar] [CrossRef]
  15. Niu, Z.; Zhang, H.; Wang, X.; Yao, W.; Zhou, D.; Zhao, K.; Li, N.; Huang, H.; Li, C.; Yang, J.; et al. Mapping wetland changes in China between 1978 and 2008. Chin. Sci. Bull. 2012, 57, 2813–2823. [Google Scholar] [CrossRef]
  16. Shen, X.; Liu, B.; Jiang, M.; Lu, X. Marshland Loss Warms Local Land Surface Temperature in China. Geophys. Res. Lett. 2020, 47, e2020GL087648. [Google Scholar] [CrossRef]
  17. Mack, J.J. Landscape as a predictor of wetland condition: An evaluation of the Landscape Development Index (LDI) with a large reference wetland dataset from Ohio. Environ. Monit. Assess. 2006, 120, 221–241. [Google Scholar] [CrossRef]
  18. Hansen, A.J.; Noble, B.P.; Veneros, J.; East, A.; Goetz, S.J.; Supples, C.; Watson, J.E.M.; Jantz, P.A.; Pillay, R.; Jetz, W.; et al. Toward monitoring forest ecosystem integrity within the post-2020 Global Biodiversity Framework. Conserv. Lett. 2021, 14, e12822. [Google Scholar] [CrossRef]
  19. Brooks, R.P.; Wardrop, D.H.; Bishop, J.A. Assessing wetland condition on a watershed basis in the Mid-Atlantic region using synoptic land-cover maps. Environ. Monit. Assess. 2004, 94, 9–22. [Google Scholar] [CrossRef]
  20. Zeleny, J.; Mercado-Bettin, D.; Mueller, F. Towards the evaluation of regional ecosystem integrity using NDVI, brightness temperature and surface heterogeneity. Sci. Total Environ. 2021, 796, 148994. [Google Scholar] [CrossRef]
  21. Akin, A.; Berberoglu, S.; Erdogan, M.A.; Donmez, C. Modelling Land-Use Change Dynamics In A Mediterranean Coastal Wetland Using Ca-Markov Chain Analysis. Fresenius Environ. Bull. 2012, 21, 386–396. [Google Scholar]
  22. Yan, F. Large-Scale Marsh Loss Reconstructed from Satellite Data in the Small Sanjiang Plain since 1965: Process, Pattern and Driving Force. Sensors 2020, 20, 1036. [Google Scholar] [CrossRef] [PubMed]
  23. Brinkmann, K.; Hoffmann, E.; Buerkert, A. Spatial and Temporal Dynamics of Urban Wetlands in an Indian Megacity over the Past 50 Years. Remote Sens. 2020, 12, 662. [Google Scholar] [CrossRef]
  24. Shi, S.; Chang, Y.; Li, Y.; Hu, Y.; Liu, M.; Ma, J.; Xiong, Z.; Wen, D.; Li, B.; Zhang, T. Using Time Series Optical and SAR Data to Assess the Impact of Historical Wetland Change on Current Wetland in Zhenlai County, Jilin Province, China. Remote Sens. 2021, 13, 4514. [Google Scholar] [CrossRef]
  25. Wang, Y.; Feng, J.; Lin, Q.; Lyu, X.; Wang, X.; Wang, G. Effects of Crude Oil Contamination on Soil Physical and Chemical Properties in Momoge Wetland of China. Chin. Geogr. Sci. 2013, 23, 708–715. [Google Scholar] [CrossRef]
  26. Dong, J.; Xiao, X.; Kou, W.; Qin, Y.; Zhang, G.; Li, L.; Jin, C.; Zhou, Y.; Wang, J.; Biradar, C.; et al. Tracking the dynamics of paddy rice planting area in 1986–2010 through time series Landsat images and phenology-based algorithms. Remote Sens. Environ. 2015, 160, 99–113. [Google Scholar] [CrossRef]
  27. Vymazal, J.; Bfezinova, T. The use of constructed wetlands for removal of pesticides from agricultural runoff and drainage: A review. Environ. Int. 2015, 75, 11–20. [Google Scholar] [CrossRef]
  28. Wang, X.; Xiao, X.; Zou, Z.; Hou, L.; Qin, Y.; Dong, J.; Doughty, R.B.; Chen, B.; Zhang, X.; Cheng, Y.; et al. Mapping coastal wetlands of China using time series Landsat images in 2018 and Google Earth Engine. Isprs J. Photogramm. Remote Sens. 2020, 163, 312–326. [Google Scholar] [CrossRef]
  29. Wang, X.; Bao, Y. Exploration of methods for studying dynamic land use change. Prog. Geogr. 1999, 83–89. [Google Scholar]
  30. Ikhumhen, H.O.; Li, T.; Lu, S.; Matomela, N. Assessment of a novel data driven habitat suitability ranking approach for Larus relictus specie using remote sensing and GIS. Ecol. Model. 2020, 432, 109221. [Google Scholar] [CrossRef]
  31. Zhu, Y.; Wang, H.; Guo, W. The impacts of water level fluctuations of East Dongting Lake on habitat suitability of migratory birds. Ecol. Indic. 2021, 132, 108277. [Google Scholar] [CrossRef]
  32. Liu, X.; Liu, C.; Zhang, J.; Wei, Y.; Huang, B. Ecosystem integrity and authenticity assessment framework in Qinghai-Tibet Plateau National Park Cluster. J. Ecol. 2021, 41, 833–846. [Google Scholar]
  33. Beven, K.J.; Kirkby, M.J. A physically based, variable contributing area model of basin hydrology/Un modèle à base physique de zone d’appel variable de l’hydrologie du bassin versant. Hydrol. Sci. J. 1979, 24, 43–69. [Google Scholar] [CrossRef]
  34. Beven, K.J.; Kirkby, M.; Schofield, N.; Tagg, A. Testing a physically-based flood forecasting model (TOPMODEL) for three UK catchments. J. Hydrol. 1984, 69, 119–143. [Google Scholar] [CrossRef]
  35. Kriegler, F.; Malila, W.; Nalepka, R.; Richardson, W. Preprocessing transformations and their effects on multispectral recognition. Remote Sens. Environ. VI 1969, 97. [Google Scholar]
  36. Xu, W. Kira’s heat index and its application to vegetation in China. J. Ecol. 1985, 3, 35–39. [Google Scholar]
  37. Zhao, G.; Liu, J.; Kuang, W.; Ouyang, Z.; Xie, Z. Disturbance impacts of land use change on biodiversity conservation priority areas across China:1990–2010. J. Geogr. Sci. 2015, 25, 515–529. [Google Scholar] [CrossRef]
  38. Xie, G.; Zhang, C.; Zhang, L.; Chen, W.; Li, S. Improvement of the evaluation method for ecosystem service value based on perunit area. J. Nat. Resour. 2015, 30, 1243–1254. [Google Scholar]
  39. Xie, G.; Zhang, C.; Zhang, C.; Xiao, Y.; Lu, C. The value of ecosystem services in China. Resour. Sci. 2015, 37, 1740–1746. [Google Scholar]
  40. Costanza, R.; dArge, R.; de Groot, R.; Farber, S.; Grasso, M.; Hannon, B.; Limburg, K.; Naeem, S.; Oneill, R.V.; Paruelo, J.; et al. The value of the world’s ecosystem services and natural capital. Nature 1997, 387, 253–260. [Google Scholar] [CrossRef]
  41. Xie, G.; Zhen, L.; Lu, C.; Xiao, Y.; Chen, C. Expert knowledge based valuation method of ecosystem services in China. J. Nat. Resour. 2008, 23, 911–919. [Google Scholar]
  42. Si, S.-L.; You, X.-Y.; Liu, H.-C.; Zhang, P. DEMATEL Technique: A Systematic Review of the State-of-the-Art Literature on Methodologies and Applications. Math. Probl. Eng. 2018, 2018, 3696457. [Google Scholar] [CrossRef]
  43. Singh, D.; Singh, B. Investigating the impact of data normalization on classification performance. Appl. Soft Comput. 2020, 97, 105524. [Google Scholar] [CrossRef]
  44. Zhao, C.; Shao, N.; Yang, S.; Ren, H.; Ge, Y.; Zhang, Z.; Zhao, Y.; Yin, X. Integrated assessment of ecosystem health using multiple indicator species. Ecol. Eng. 2019, 130, 157–168. [Google Scholar] [CrossRef]
  45. Ou, W.; Xiao, J.; Li, W. Spatial pattern optimization simulation of coastal wetland use based on BP neural network and cellular automata—A case of Dafeng coastal wetland. J. Nat. Resour. 2014, 29, 744–756. [Google Scholar]
  46. Dar, S.A.; Rashid, I.; Bhat, S.U. Linking land system changes (1980–2017) with the trophic status of an urban wetland: Implications for wetland management. Environ. Monit. Assess. 2021, 193. [Google Scholar] [CrossRef]
  47. Hamandawana, H.; Eckardt, F.; Chanda, R. Linking archival and remotely sensed data for long-term environmental monitoring. Int. J. Appl. Earth Obs. Geoinf. 2005, 7, 284–298. [Google Scholar] [CrossRef]
  48. Herbert, E.R.; Boon, P.; Burgin, A.J.; Neubauer, S.C.; Franklin, R.B.; Ardon, M.; Hopfensperger, K.N.; Lamers, L.P.M.; Gell, P. A global perspective on wetland salinization: Ecological consequences of a growing threat to freshwater wetlands. Ecosphere 2015, 6, 1–43. [Google Scholar] [CrossRef]
  49. Hou, M.; Ge, J.; Gao, J.; Meng, B.; Li, Y.; Yin, J.; Liu, J.; Feng, Q.; Liang, T. Ecological Risk Assessment and Impact Factor Analysis of Alpine Wetland Ecosystem Based on LUCC and Boosted Regression Tree on the Zoige Plateau, China. Remote Sens. 2020, 12, 368. [Google Scholar] [CrossRef]
  50. Hoang Huu, N.; Dargusch, P.; Moss, P.; Aziz, A.A. Land-use change and socio-ecological drivers of wetland conversion in Ha Tien Plain, Mekong Delta, Vietnam. Land Use Policy 2017, 64, 101–113. [Google Scholar] [CrossRef]
  51. Verones, F.; Pfister, S.; Hellweg, S. Quantifying Area Changes of Internationally Important Wetlands Due to Water Consumption in LCA. Environ. Sci. Technol. 2013, 47, 9799–9807. [Google Scholar] [CrossRef] [PubMed]
  52. Zedler, J.B.; Kercher, S. Wetland resources: Status, trends, ecosystem services, and restorability. Annu. Rev. Environ. Resour. 2005, 30, 39–74. [Google Scholar] [CrossRef]
  53. Wang, Z.; Huang, N.; Luo, L.; Li, X.; Ren, C.; Song, K.; Chen, J.M. Shrinkage and fragmentation of marshes in the West Songnen Plain, China, from 1954 to 2008 and its possible causes. Int. J. Appl. Earth Obs. Geoinf. 2011, 13, 477–486. [Google Scholar] [CrossRef]
  54. Dong, Z.; Wang, Z.; Liu, D.; Song, K.; Li, L.; Jia, M.; Ding, Z. Mapping Wetland Areas Using Landsat-Derived NDVI and LSWI: A Case Study of West Songnen Plain, Northeast China. J. Indian Soc. Remote Sens. 2014, 42, 569–576. [Google Scholar] [CrossRef]
  55. Roe, S.; Streck, C.; Obersteiner, M.; Frank, S.; Griscom, B.; Drouet, L.; Fricko, O.; Gusti, M.; Harris, N.; Hasegawa, T.; et al. Contribution of the land sector to a 1.5 degrees C world. Nat. Clim. Chang. 2019, 9, 817. [Google Scholar] [CrossRef]
  56. Zhang, D.; Sun, J.; Cui, Q.; Jia, X.; Qi, Q.; Wang, X.; Tong, S. Plant growth and diversity performance after restoration in Carex schmidtii tussock wetlands, Northeast China. Community Ecol. 2021, 22, 391–401. [Google Scholar] [CrossRef]
  57. Xiang, H.; Wang, Z.; Mao, D.; Zhang, J.; Xi, Y.; Du, B.; Zhang, B. What did China’s National Wetland Conservation Program Achieve? Observations of changes in land cover and ecosystem services in the Sanjiang Plain. J. Environ. Manag. 2020, 267, 110623. [Google Scholar] [CrossRef]
Figure 1. Location of Momoge Internationally Important Wetland.
Land 11 01344 g001
Figure 2. Flowchart of the study.
Land 11 01344 g002
Figure 3. “Quality-Pressure-Pattern-Service” ecosystem integrity remote assessment framework.
Land 11 01344 g003
Figure 4. Map of land use types in the Momoge Internationally Important Wetland.
Land 11 01344 g004
Figure 5. Maps of typical water area changes from 1965 to 2019.
Land 11 01344 g005
Figure 6. Maps of typical narrow wetland changes from 1965 to 2019.
Land 11 01344 g006
Figure 7. Momoge Internationally Important Wetland dynamic land use change map.
Land 11 01344 g007
Figure 8. Momoge Internationally Important Wetland dynamic land use degree map.
Land 11 01344 g008
Figure 9. Momoge Internationally Important Wetland ecosystem integrity index map.
Land 11 01344 g009
Figure 10. Ecosystem integrity assessment and identification of unreasonable development areas for the Momoge Internationally Important Wetland in 1965, 2015, and 2019.
Land 11 01344 g010
Figure 11. Momoge Internationally Important Wetland conservation spatial pattern optimization for 2019.
Land 11 01344 g011
Table 1. ZY-3 satellite and KH-4A satellite specification information.
SatelliteYearDay/MonthResolution (m)Image TypeSource
ZY-3201509/December2.1panchromaticSatellite Environmental Application Center of the Ministry of Ecology and Environment (http://www.secmep.cn/ (accessed on 25 February 2020))
ZY-320152 6/October2.1panchromatic
KH-4A196523/September2.7panchromaticthe USGS (https://www.usgs.gov/ (accessed on 9 December 2019))
Table 2. The land classification system used in this study.
Class 1Class 2Class 3
WetlandNarrow wetlandInland beach
Salt marsh
Herb marsh
Water
Non-wetlandArable landPaddy field
Dry field
Woodland
Grassland
Construction land
Saline land
Other land
Table 3. “Quality-Pressure-Pattern-Service” ecosystem integrity evaluation factor table.
Level 1Level 2Level 3Calculation MethodsIndicator Sources
Ecosystem qualityShade conditionDEM-Evaluation of waterfowl habitat suitability [30,31].
SlopSlop tool in ArcGIS 10.8
Water source statusRiver densityKernel density analysis in ArcGIS 10.8The PCFAEI and EECs evaluation frameworks both contain indicators of hydrology and plant life [7,32].
Lake density
Hydrological functionTWI[33,34]
Vegetation coverNDVI[35]
Ecosystem stressClimate changeWI[36]Climate change indicators under the PCFAEI and EECs assessment frameworks [7,32].
HI
Land developmentEcosystem comprehensive anthropogenic disturbance index (ECADI)[37]Principal stressors in the evaluation frameworks of the PCFAEI, EIAF, and EECs [6,7,32].
Road densityKernel density analysis in ArcGIS 10.8
Ditch and dyke density
Density of residential land
Ecosystem patternAdvantage typeLPIThe index was computed in Fragstats 4.2 employing the moving window method with a 1000 m window sizeIndicators of landscape pattern in the PCFAEI assessment framework [19,32].
Landscape diversitySHDIIndicators of ecosystem quality within the EECs assessment system [7]
Landscape fragmentationCONTAG
Ecosystem serviceRegulation serviceGas regulationDetails of the method are provided in Section 2.3.4.Xie et al. improved China’s ecological valuation process for terrestrial ecosystem services [38,39].
Climate regulation
Waste disposal
Water conservation
Support serviceSoil conservation
Biodiversity conservation
Supply serviceFood production
Raw material production
Culture serviceAesthetic landscape
Table 4. Equivalent value per unit area of cropland ecosystem services in China (2011).
Ecological Service TypesPaddy FieldDry Field
Gas regulation1.110.67
Climate regulation0.570.36
Headwater conservation2.720.27
Waste treatment0.170.1
Soil formation and protection0.011.03
Biodiversity protection0.210.13
Food production1.360.85
Raw materials0.090.4
Cultural and recreation0.090.06
Total6.333.87
Table 5. Nature Reserve ecological service values per unit area (CNY/haa−1).
Ecological Service TypesPaddy FieldDry FieldWoodlandGrasslandWaterWetlandSaline Land
Gas regulation344.56207.981862.51646.70219.881039.0425.87
Climate regulation238.38150.551754.73672.58888.145841.9056.04
Headwater conservation902.9889.631763.35655.328092.435794.4630.18
Waste treatment101.8859.93741.55569.106402.376208.36112.10
Soil formation and protection6.34652.791733.16965.74176.76857.9673.30
Biodiversity protection92.3557.171944.42806.231478.791590.89172.45
Food production586.34366.47142.27185.39228.50155.218.62
Raw materials35.3167.261284.79155.21150.90103.4717.24
Cultural and recreation6.604.40896.76375.091914.242022.03103.47
Total2314.731656.1712,123.545031.3619,552.0223,613.32599.28
Table 6. “Quality-Pressure-Pattern-Service” ecosystem integrity evaluation factor weighting table.
Level 1Weight ValueLevel 2Weight ValueLevel 3Weight ValueIndicator Orientation
Ecosystem quality0.306Shade condition0.040DEM0.014
Slop0.026
Water source status0.137River density0.084+
Lake density0.053+
Hydrological function0.027TWI0.027+
Vegetation cover0.102NDVI0.102+
Ecosystem stress0.371Climate change0.052WI0.025
HI0.027+
Land development0.319ECADI0.068
Road density0.092
Ditch and dyke density0.057
Density of residential land0.102
Ecosystem pattern0.109Advantage type0.026LPI0.026+
Landscape diversity0.039SHDI0.039
Landscape fragmentation0.044CONTAG0.044+
Ecosystem service0.214Regulation service0.117Gas regulation0.025+
Climate regulation0.023+
Waste disposal0.035+
Water conservation0.034+
Support service0.049Soil conservation0.022+
Biodiversity conservation0.027+
Supply service0.028Food production0.019+
Raw material production0.009+
Culture service0.020Aesthetic landscape0.020+
Table 7. Evaluation and grading of Ecosystem Integrity results.
LevelIndexEcosystem Integrity Status
Excellent>0.8Ecosystem structure, composition, and function all shift within the range of natural disturbance. There are no or few ecological issues, and the anthropogenic disturbance pressure is minimal.
Good0.6–0.8The structure, composition, and function of ecosystems fluctuate within the range of natural disturbances. There are mild ecological concerns and low anthropogenic disturbance pressure.
Medium0.4–0.6The structure, composition, and function of the ecosystem vary within the range of natural disturbances, with certain ecological concerns and human disturbance pressure.
Poor0.2–0.4Changes in ecosystem structure, composition, and function of the ecosystem are beyond natural disturbance. There are serious ecological problems and high pressures from human interference.
Extremely poor0–0.2Changes in the structure, composition, and function of ecosystems beyond the scope of natural disturbances. There are serious ecological problems, high pressure from anthropogenic disturbance, and ecological processes that are difficult to reverse.
Publisher’s Note: MDPI stays neutral with regard to jurisdictional claims in published maps and institutional affiliations.

