
Vegetation Drastically Reduces Wind Erosion: An Implementation of the RWEQ in the Mongolian Gobi Steppe


Abstract
:1. Introduction
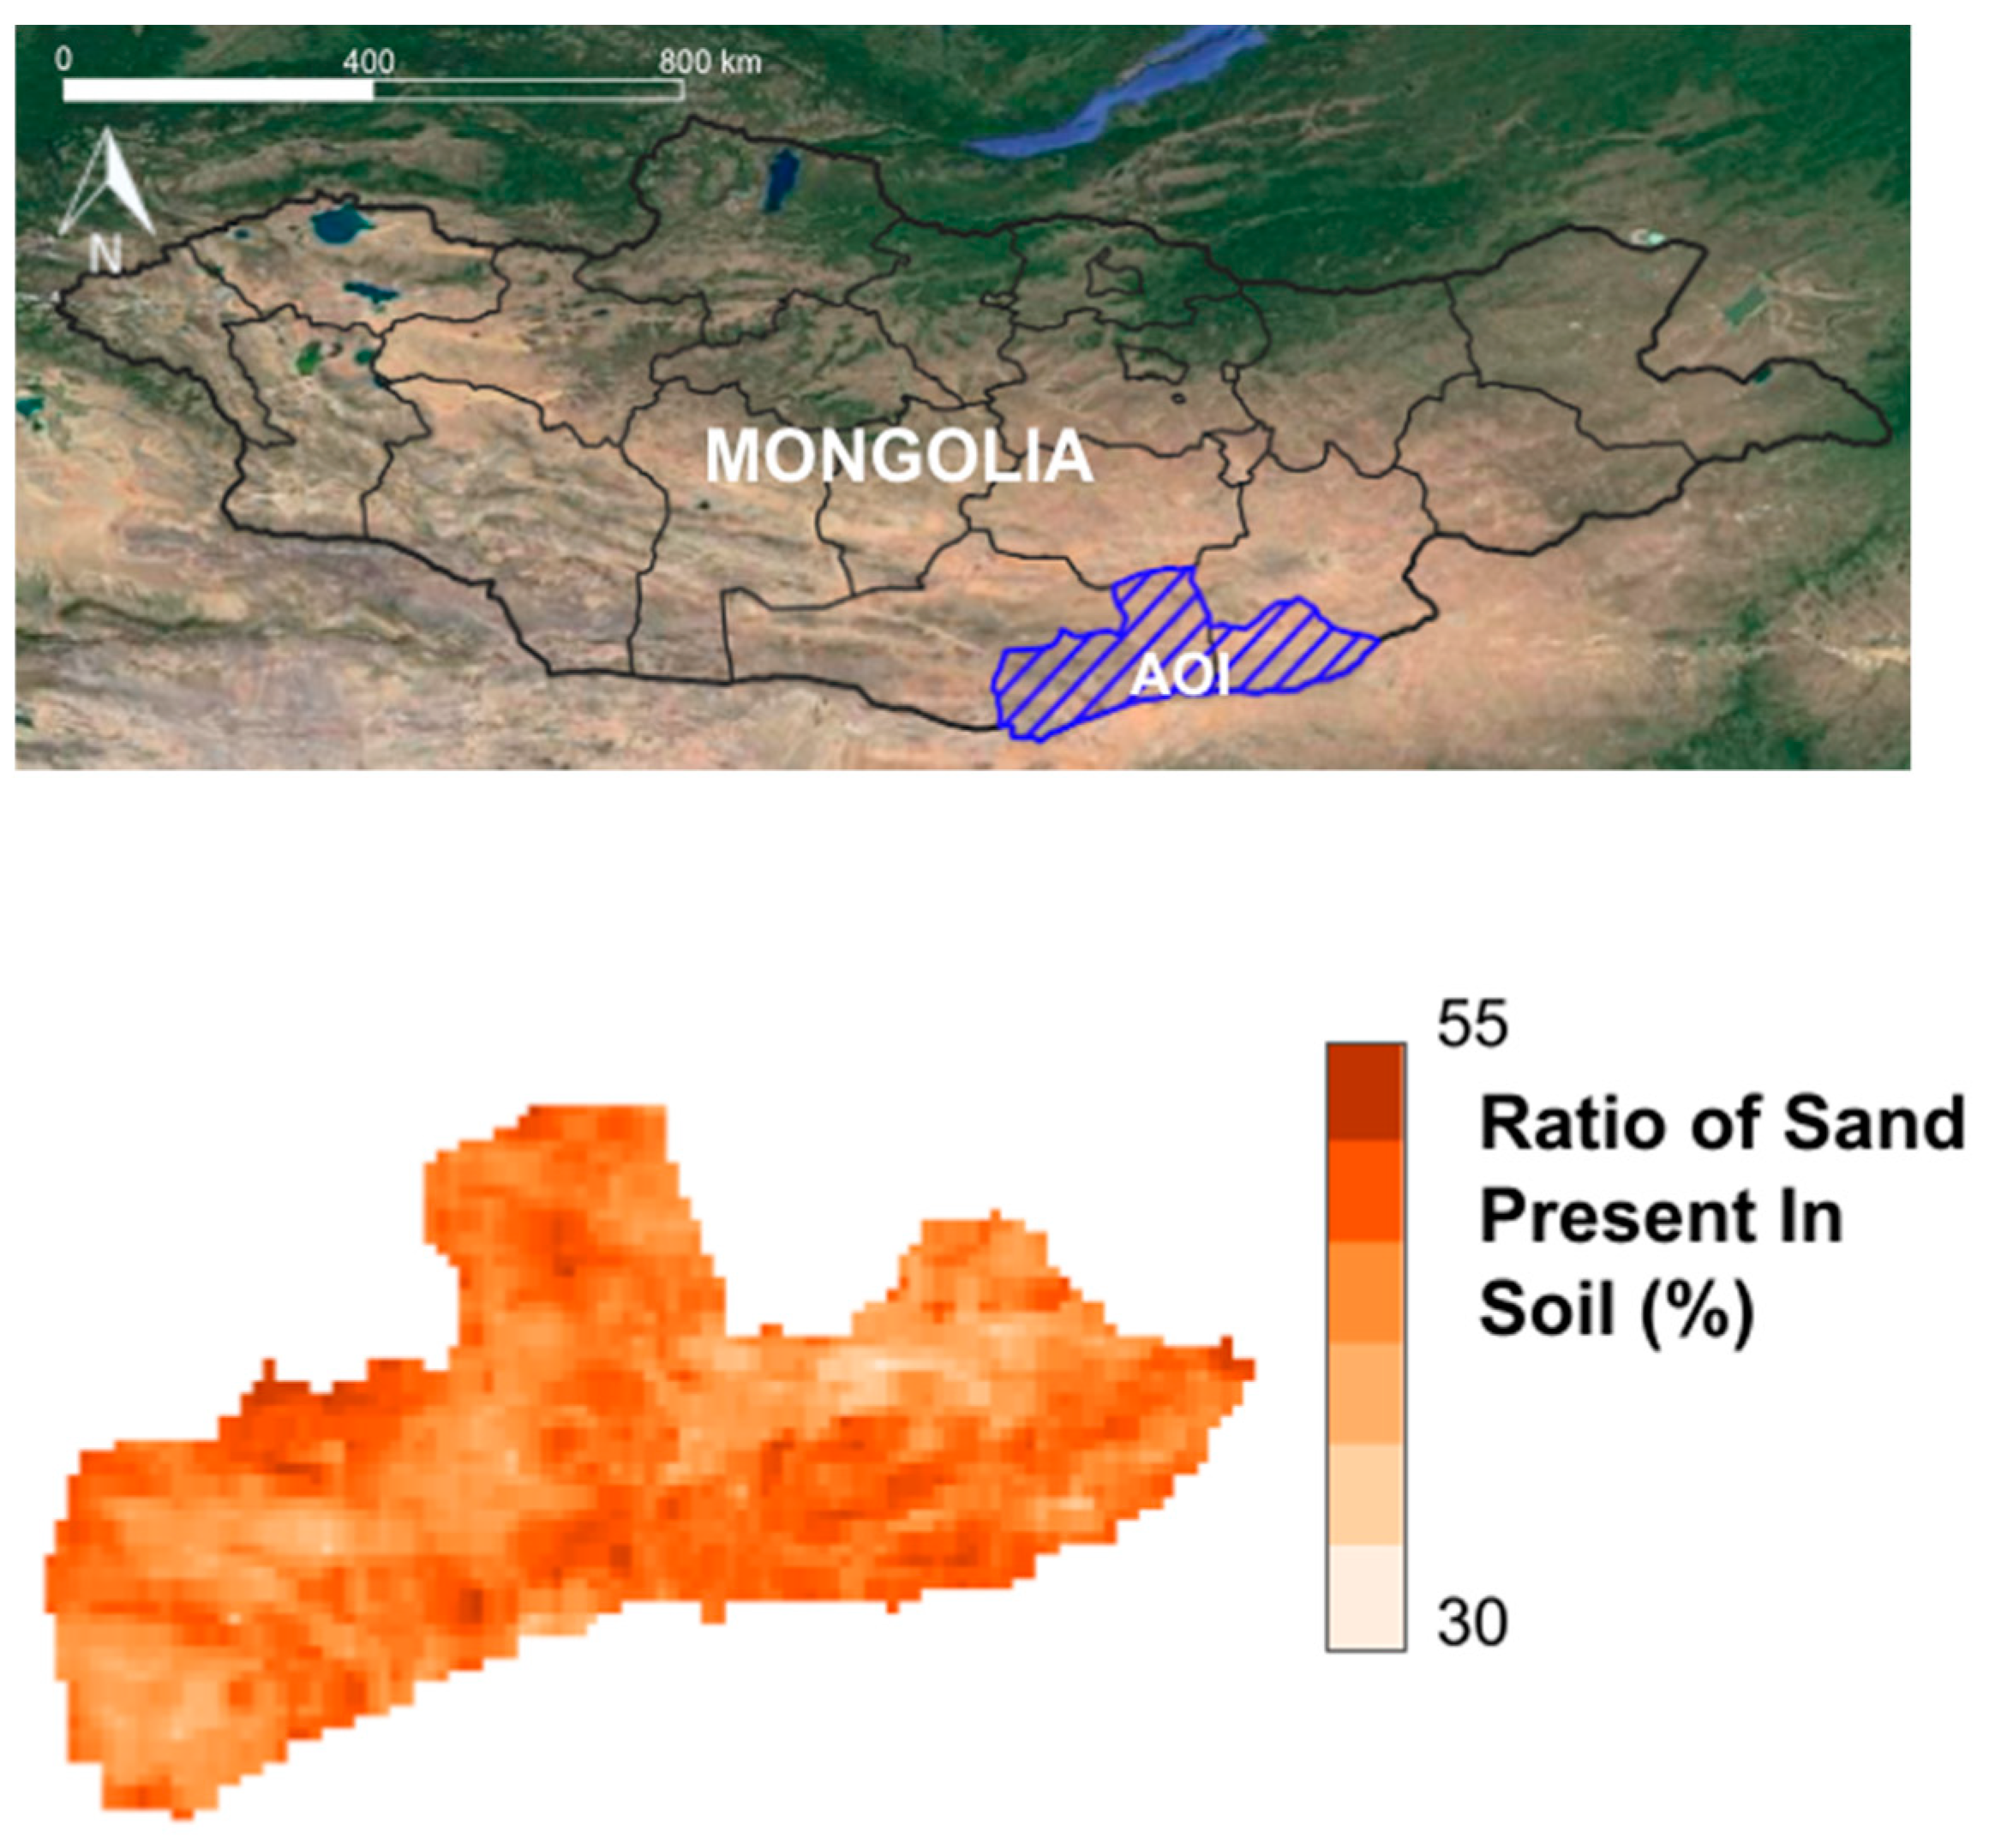
The Eastern Gobi Steppe
2. Methods
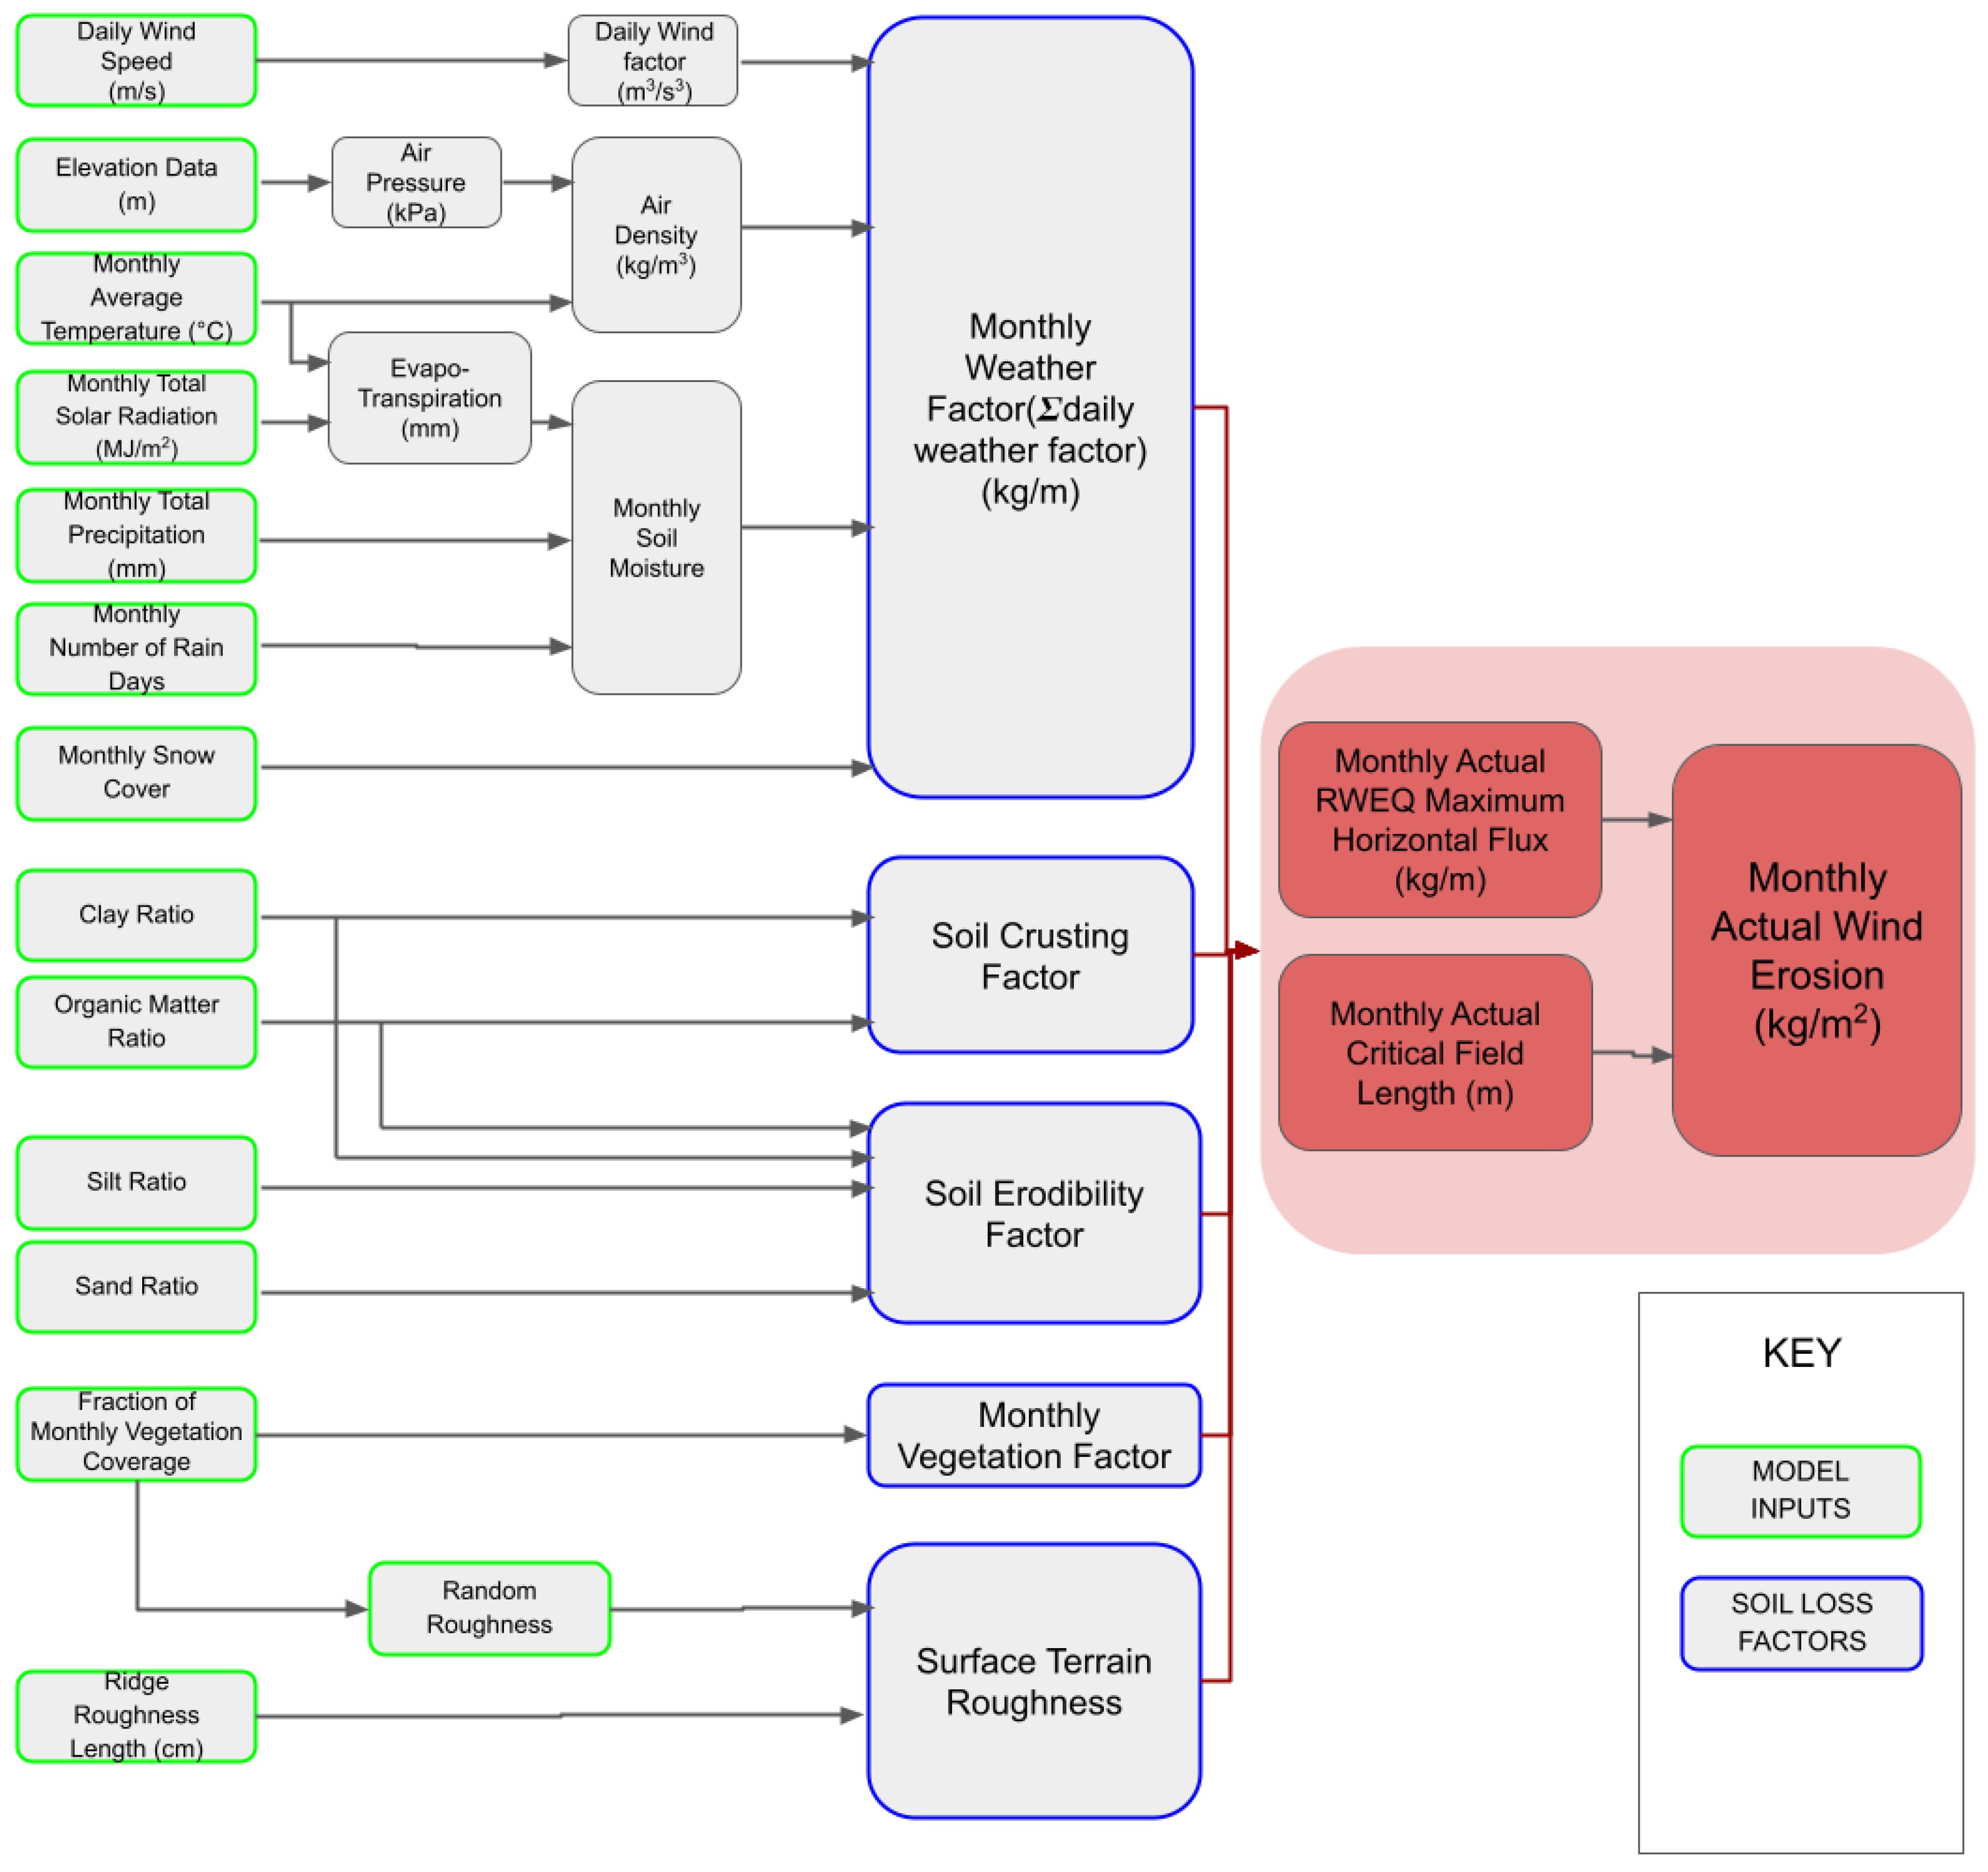
2.1. RWEQ Model
2.2. Input Data Sources
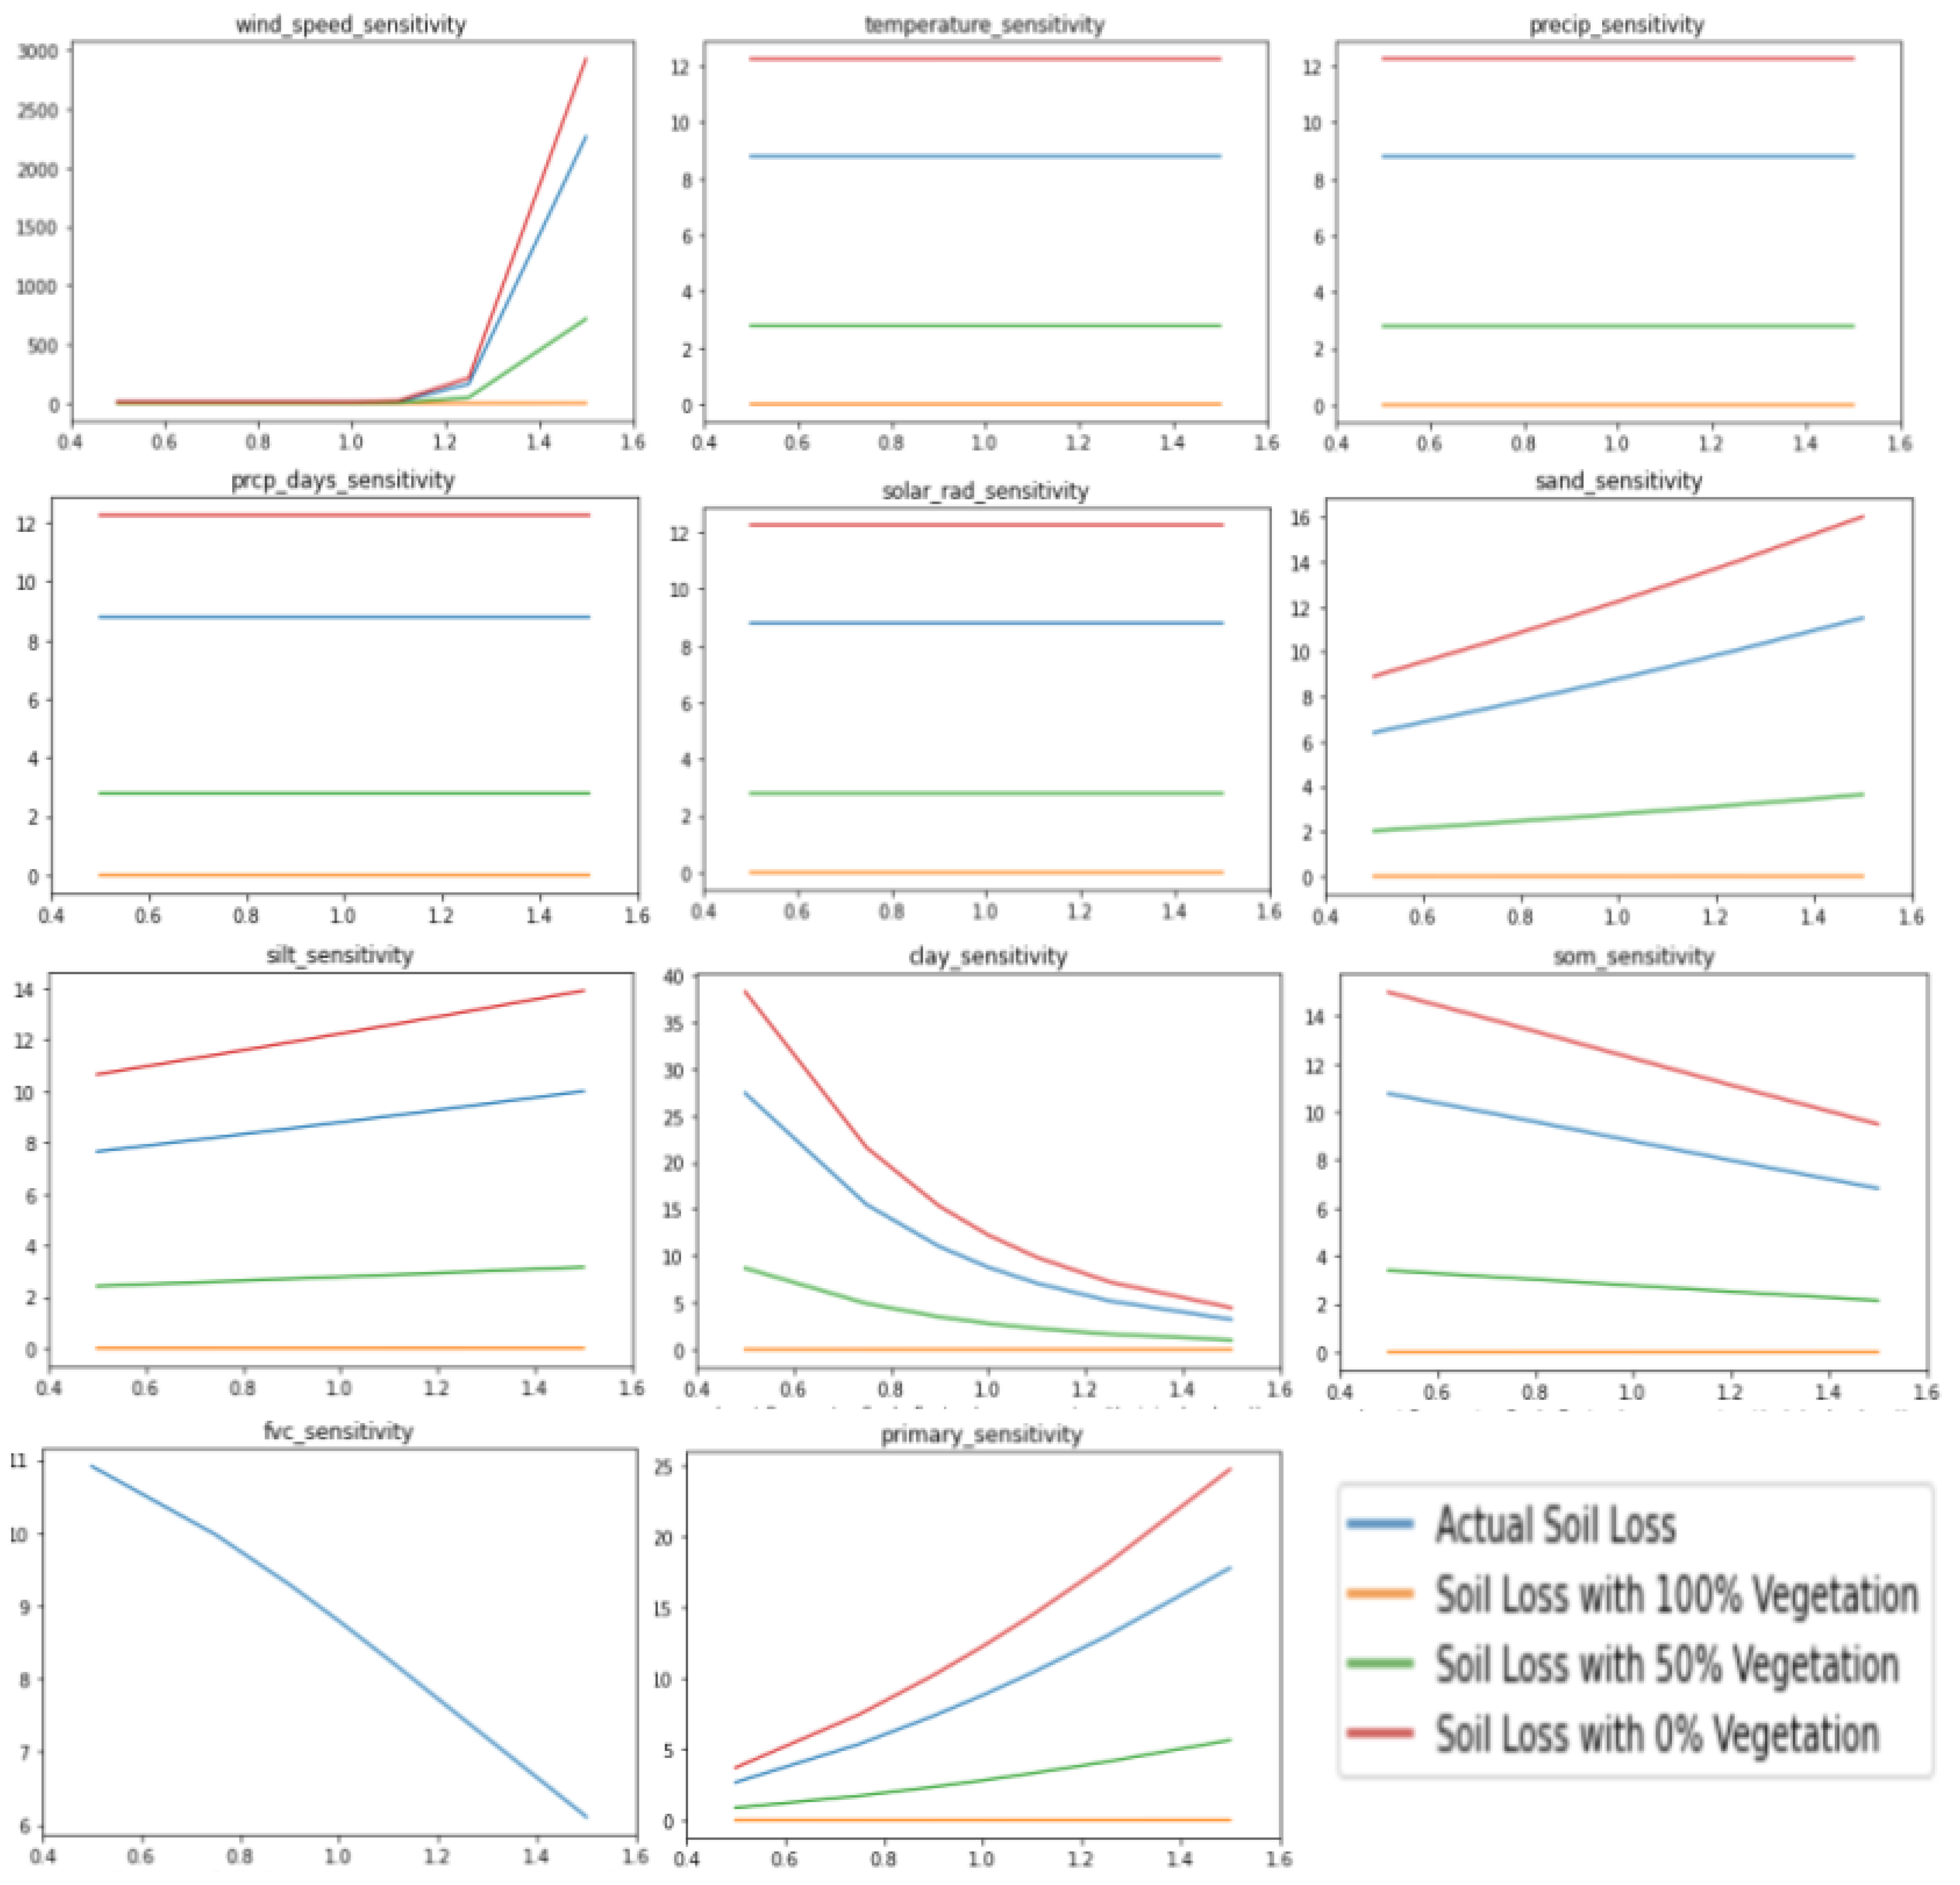
2.3. Sensitivity Analysis
3. Results and Discussion
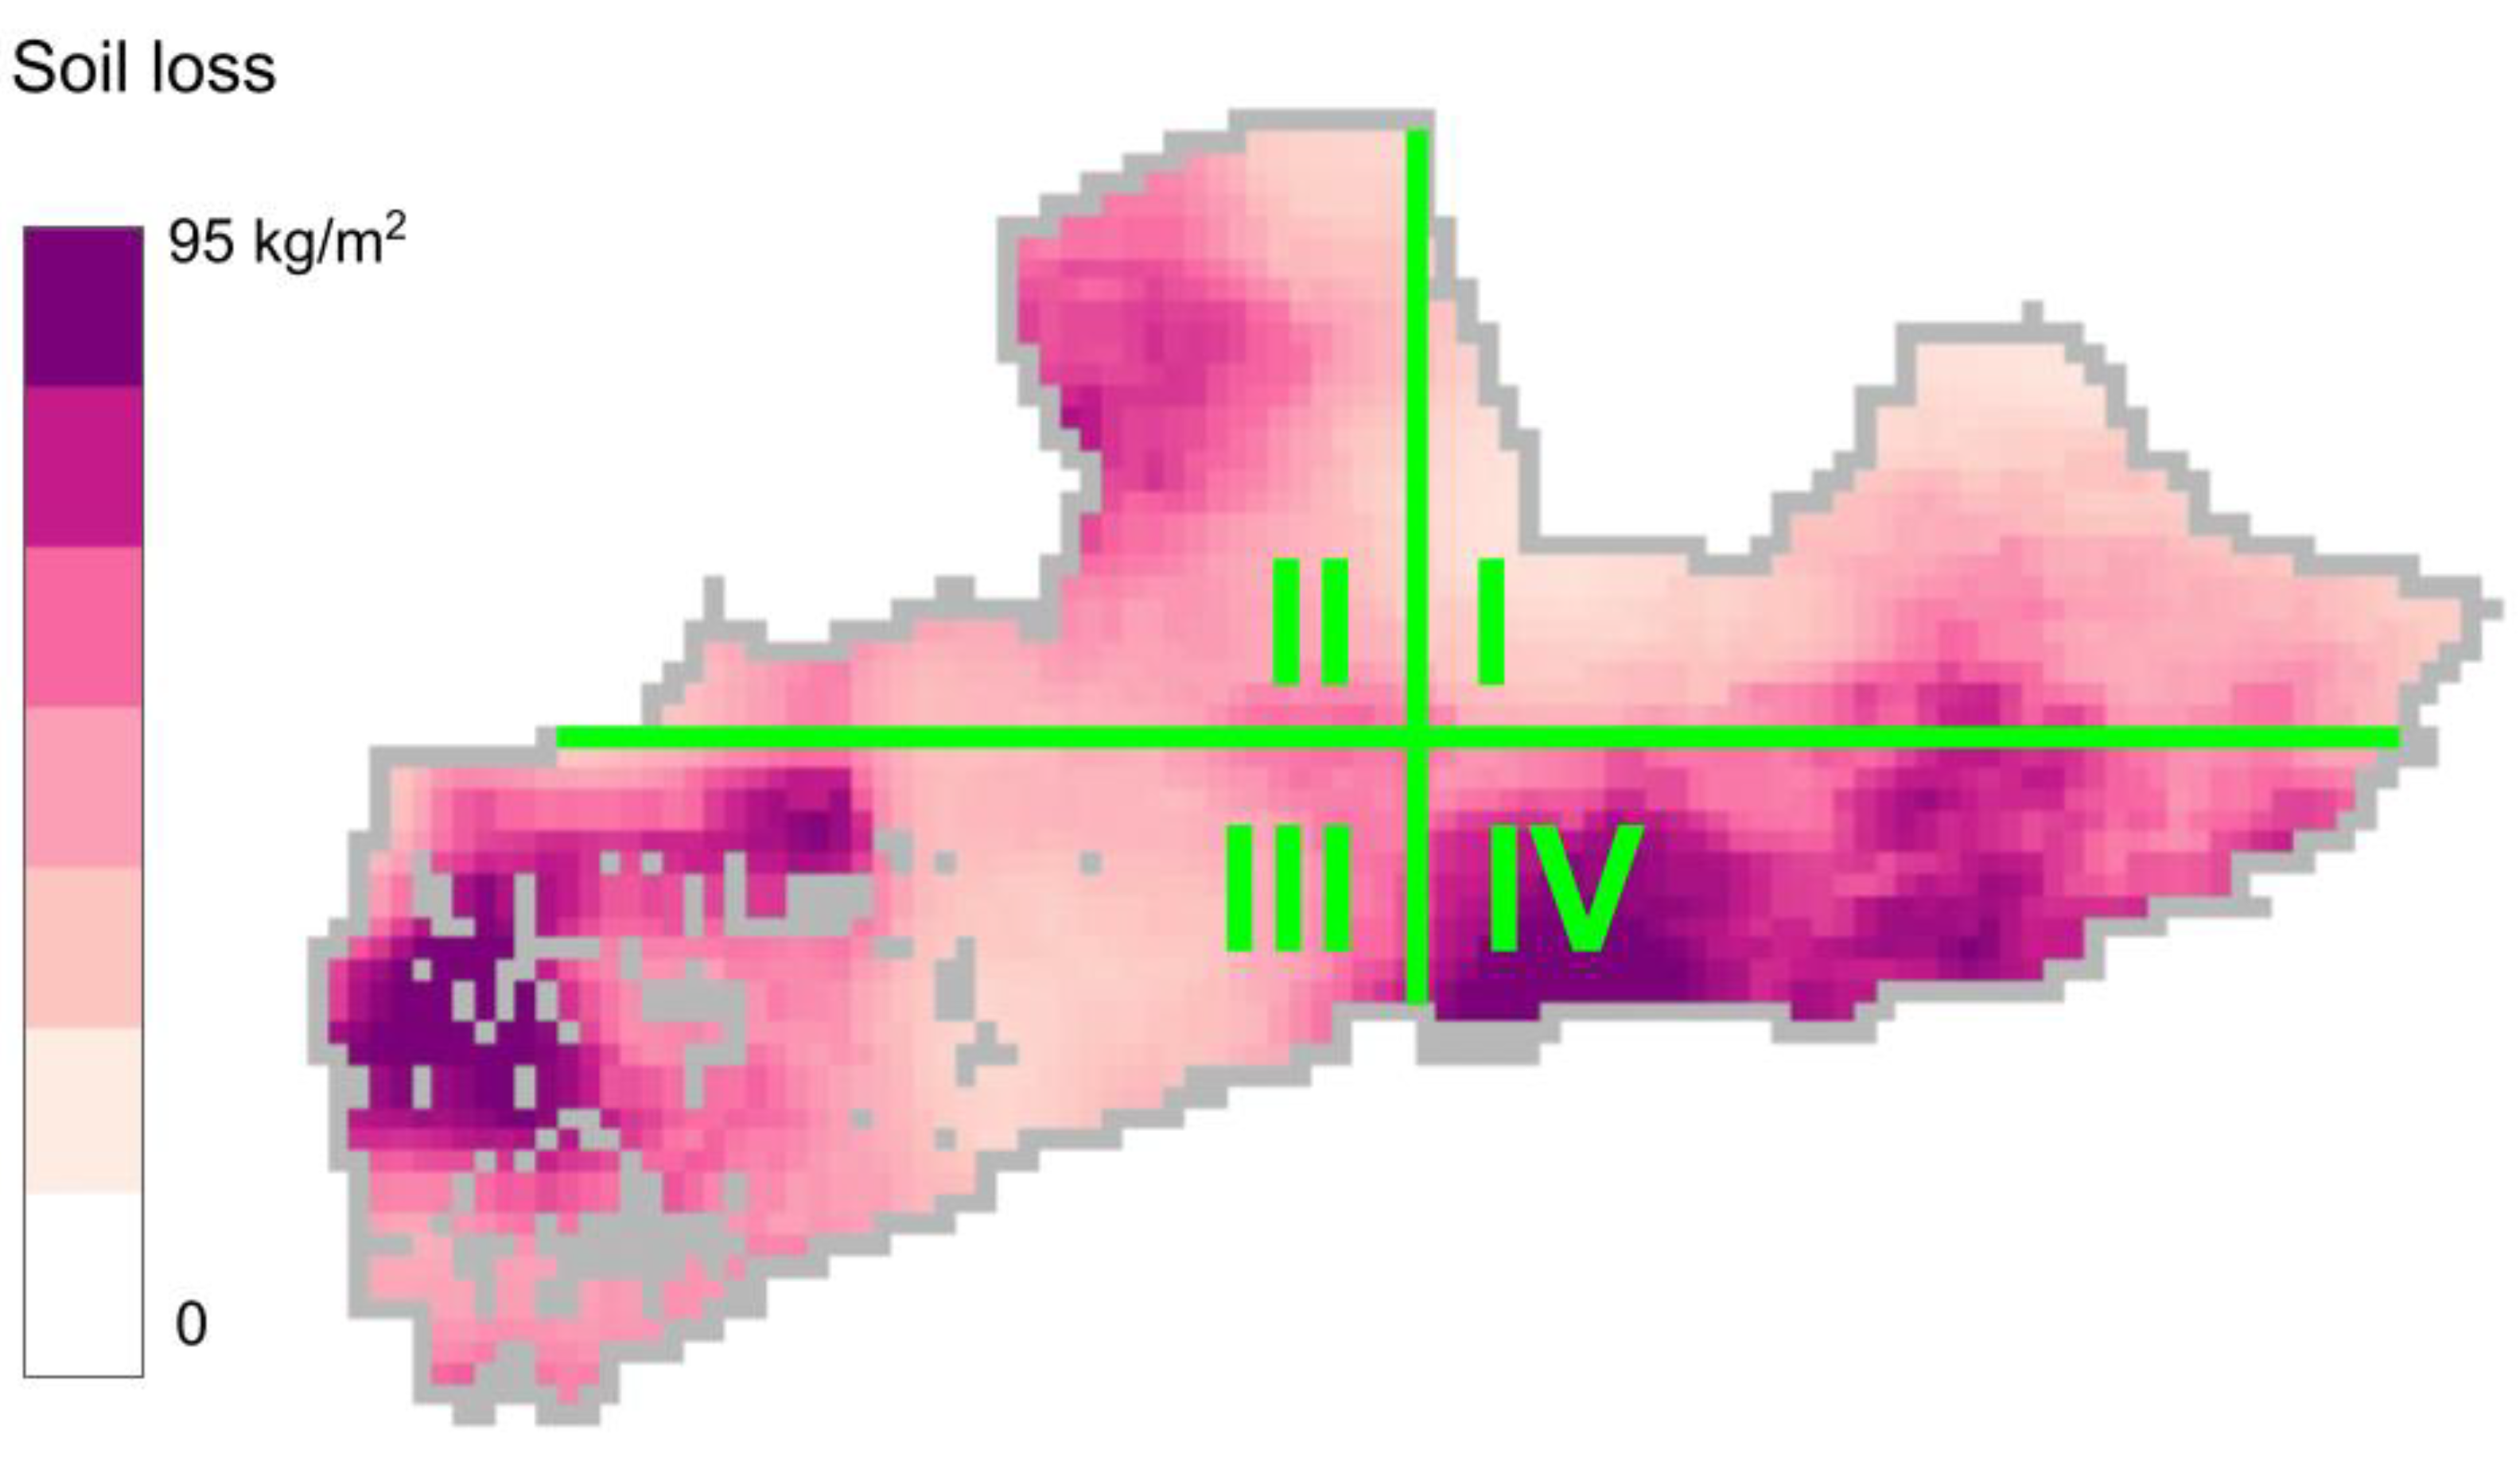
3.1. Model Results in Eastern Gobi Steppe
3.2. Environmental Factors Contributing to Soil Loss
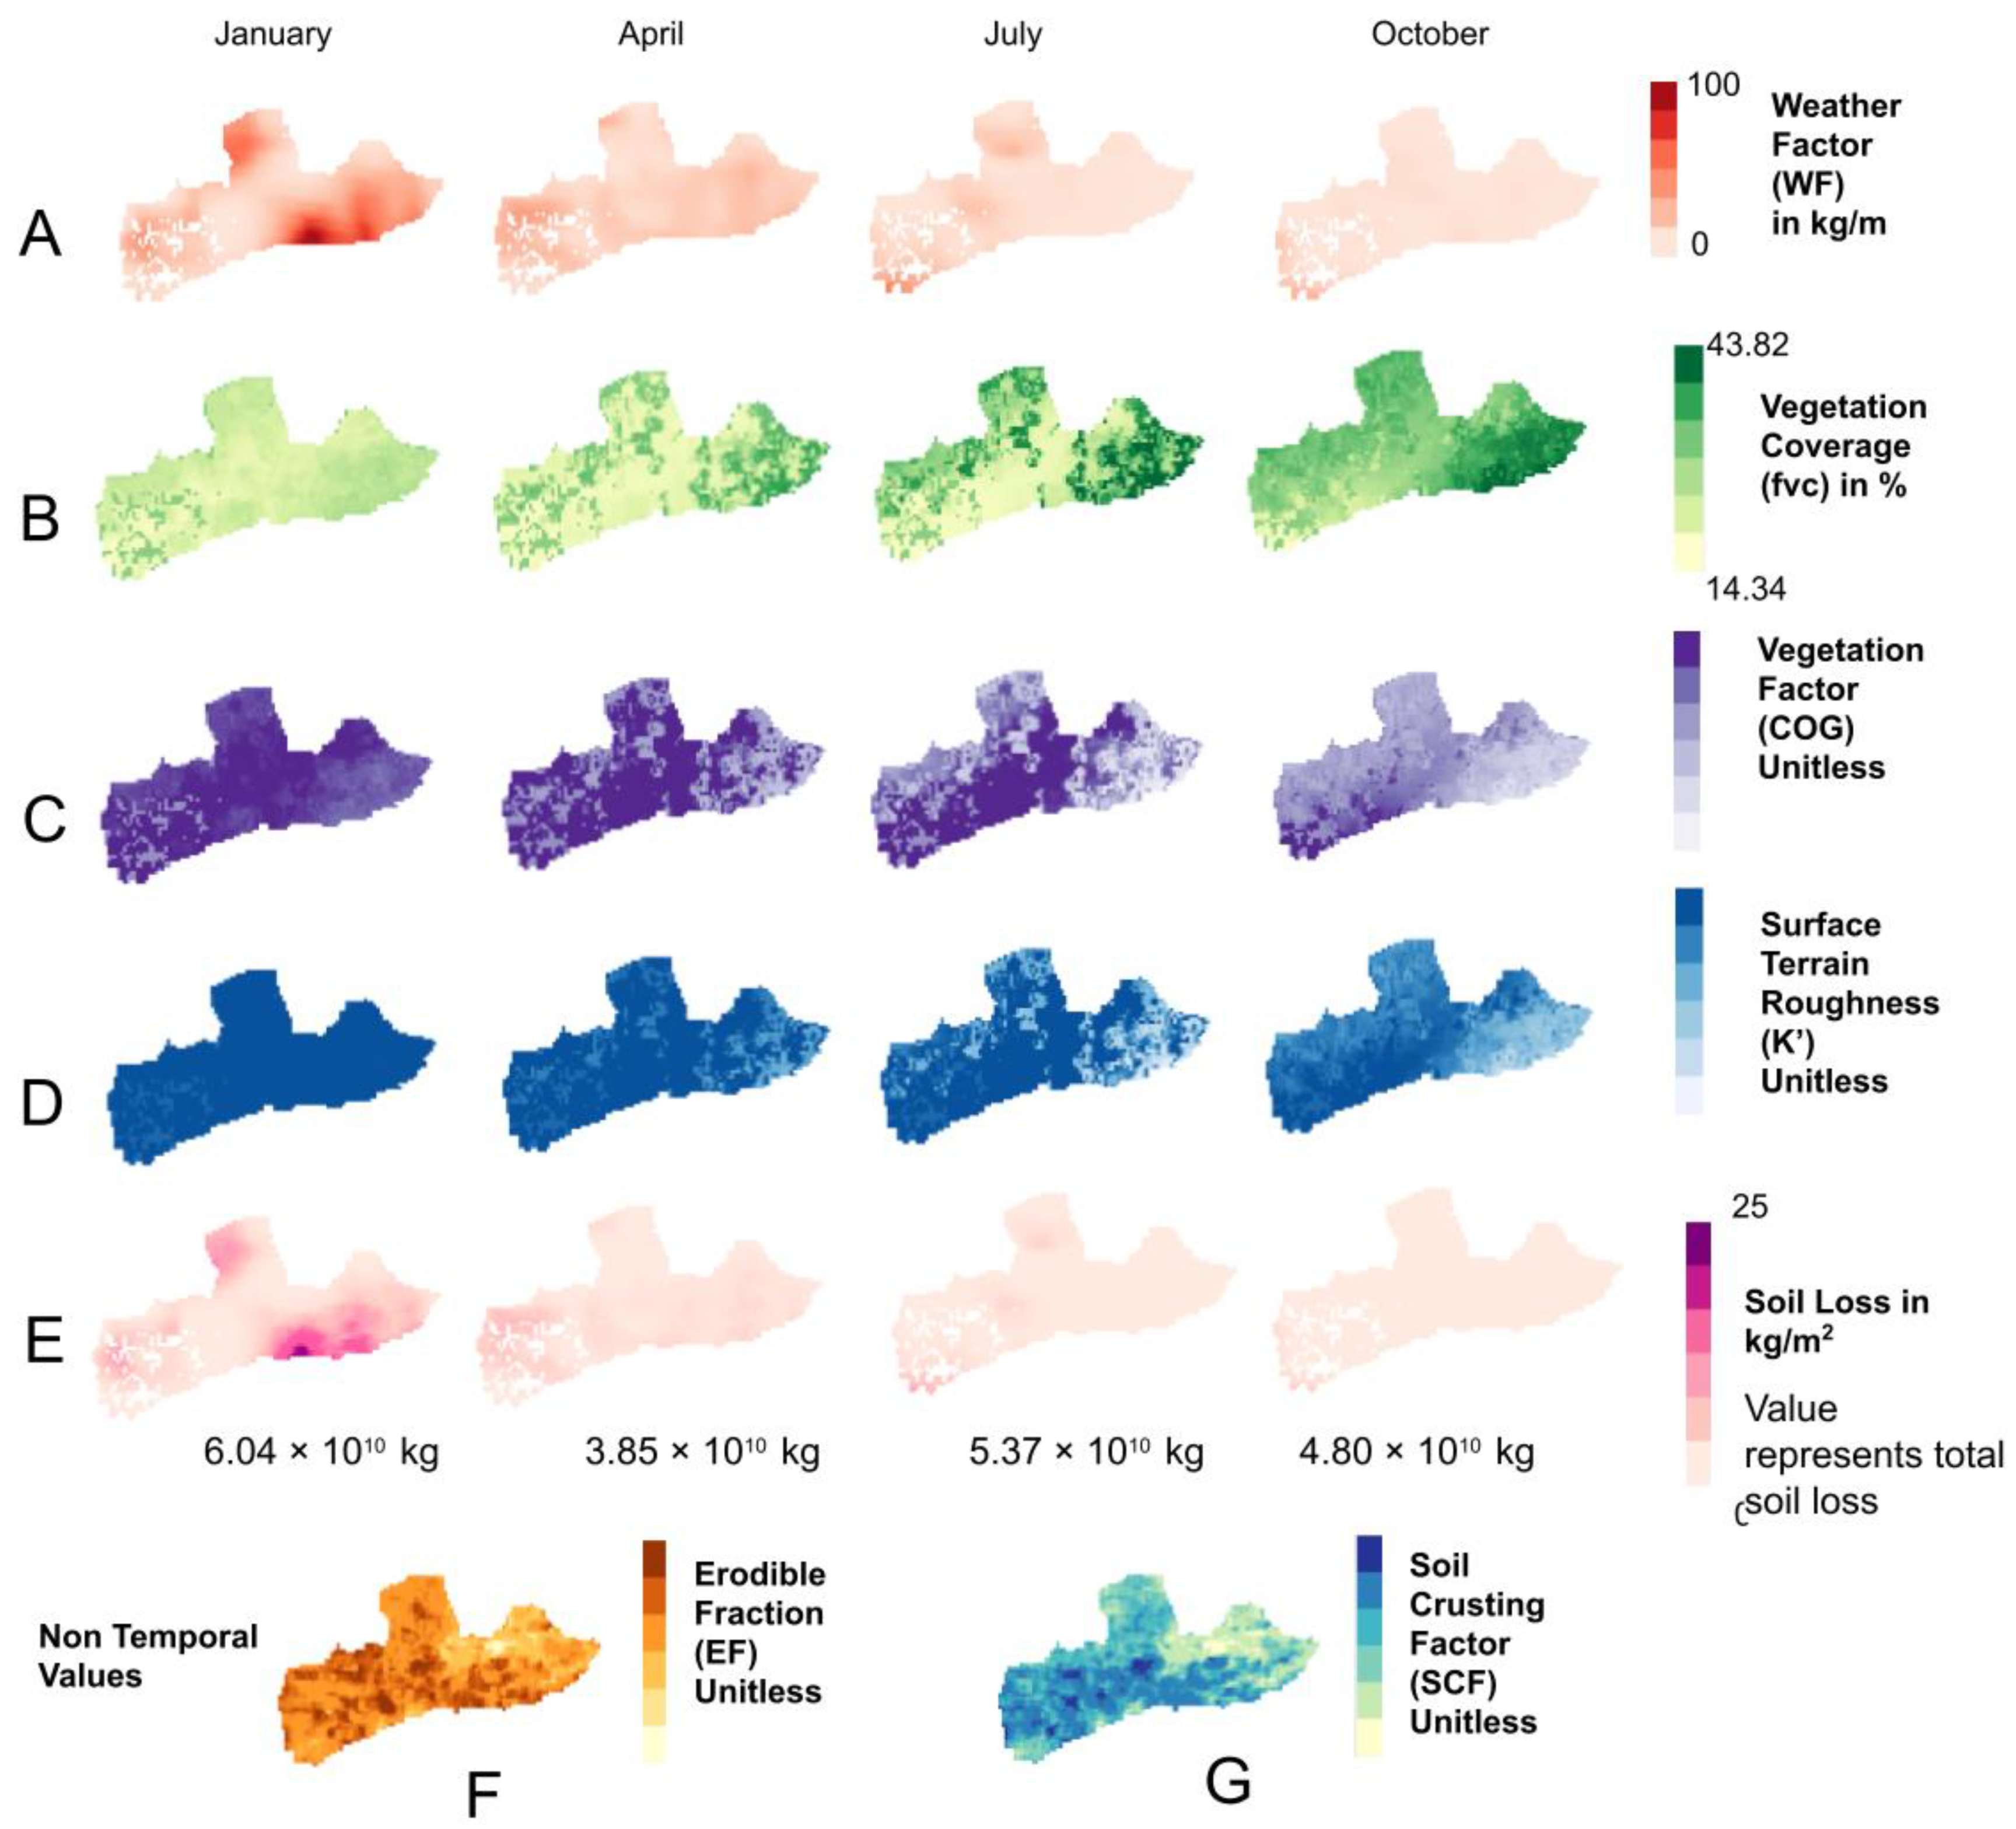
3.2.1. Impact of Five Primary RWEQ Factors
3.2.2. Sensitivity of Soil Loss
3.3. Impact of Vegetation Coverage
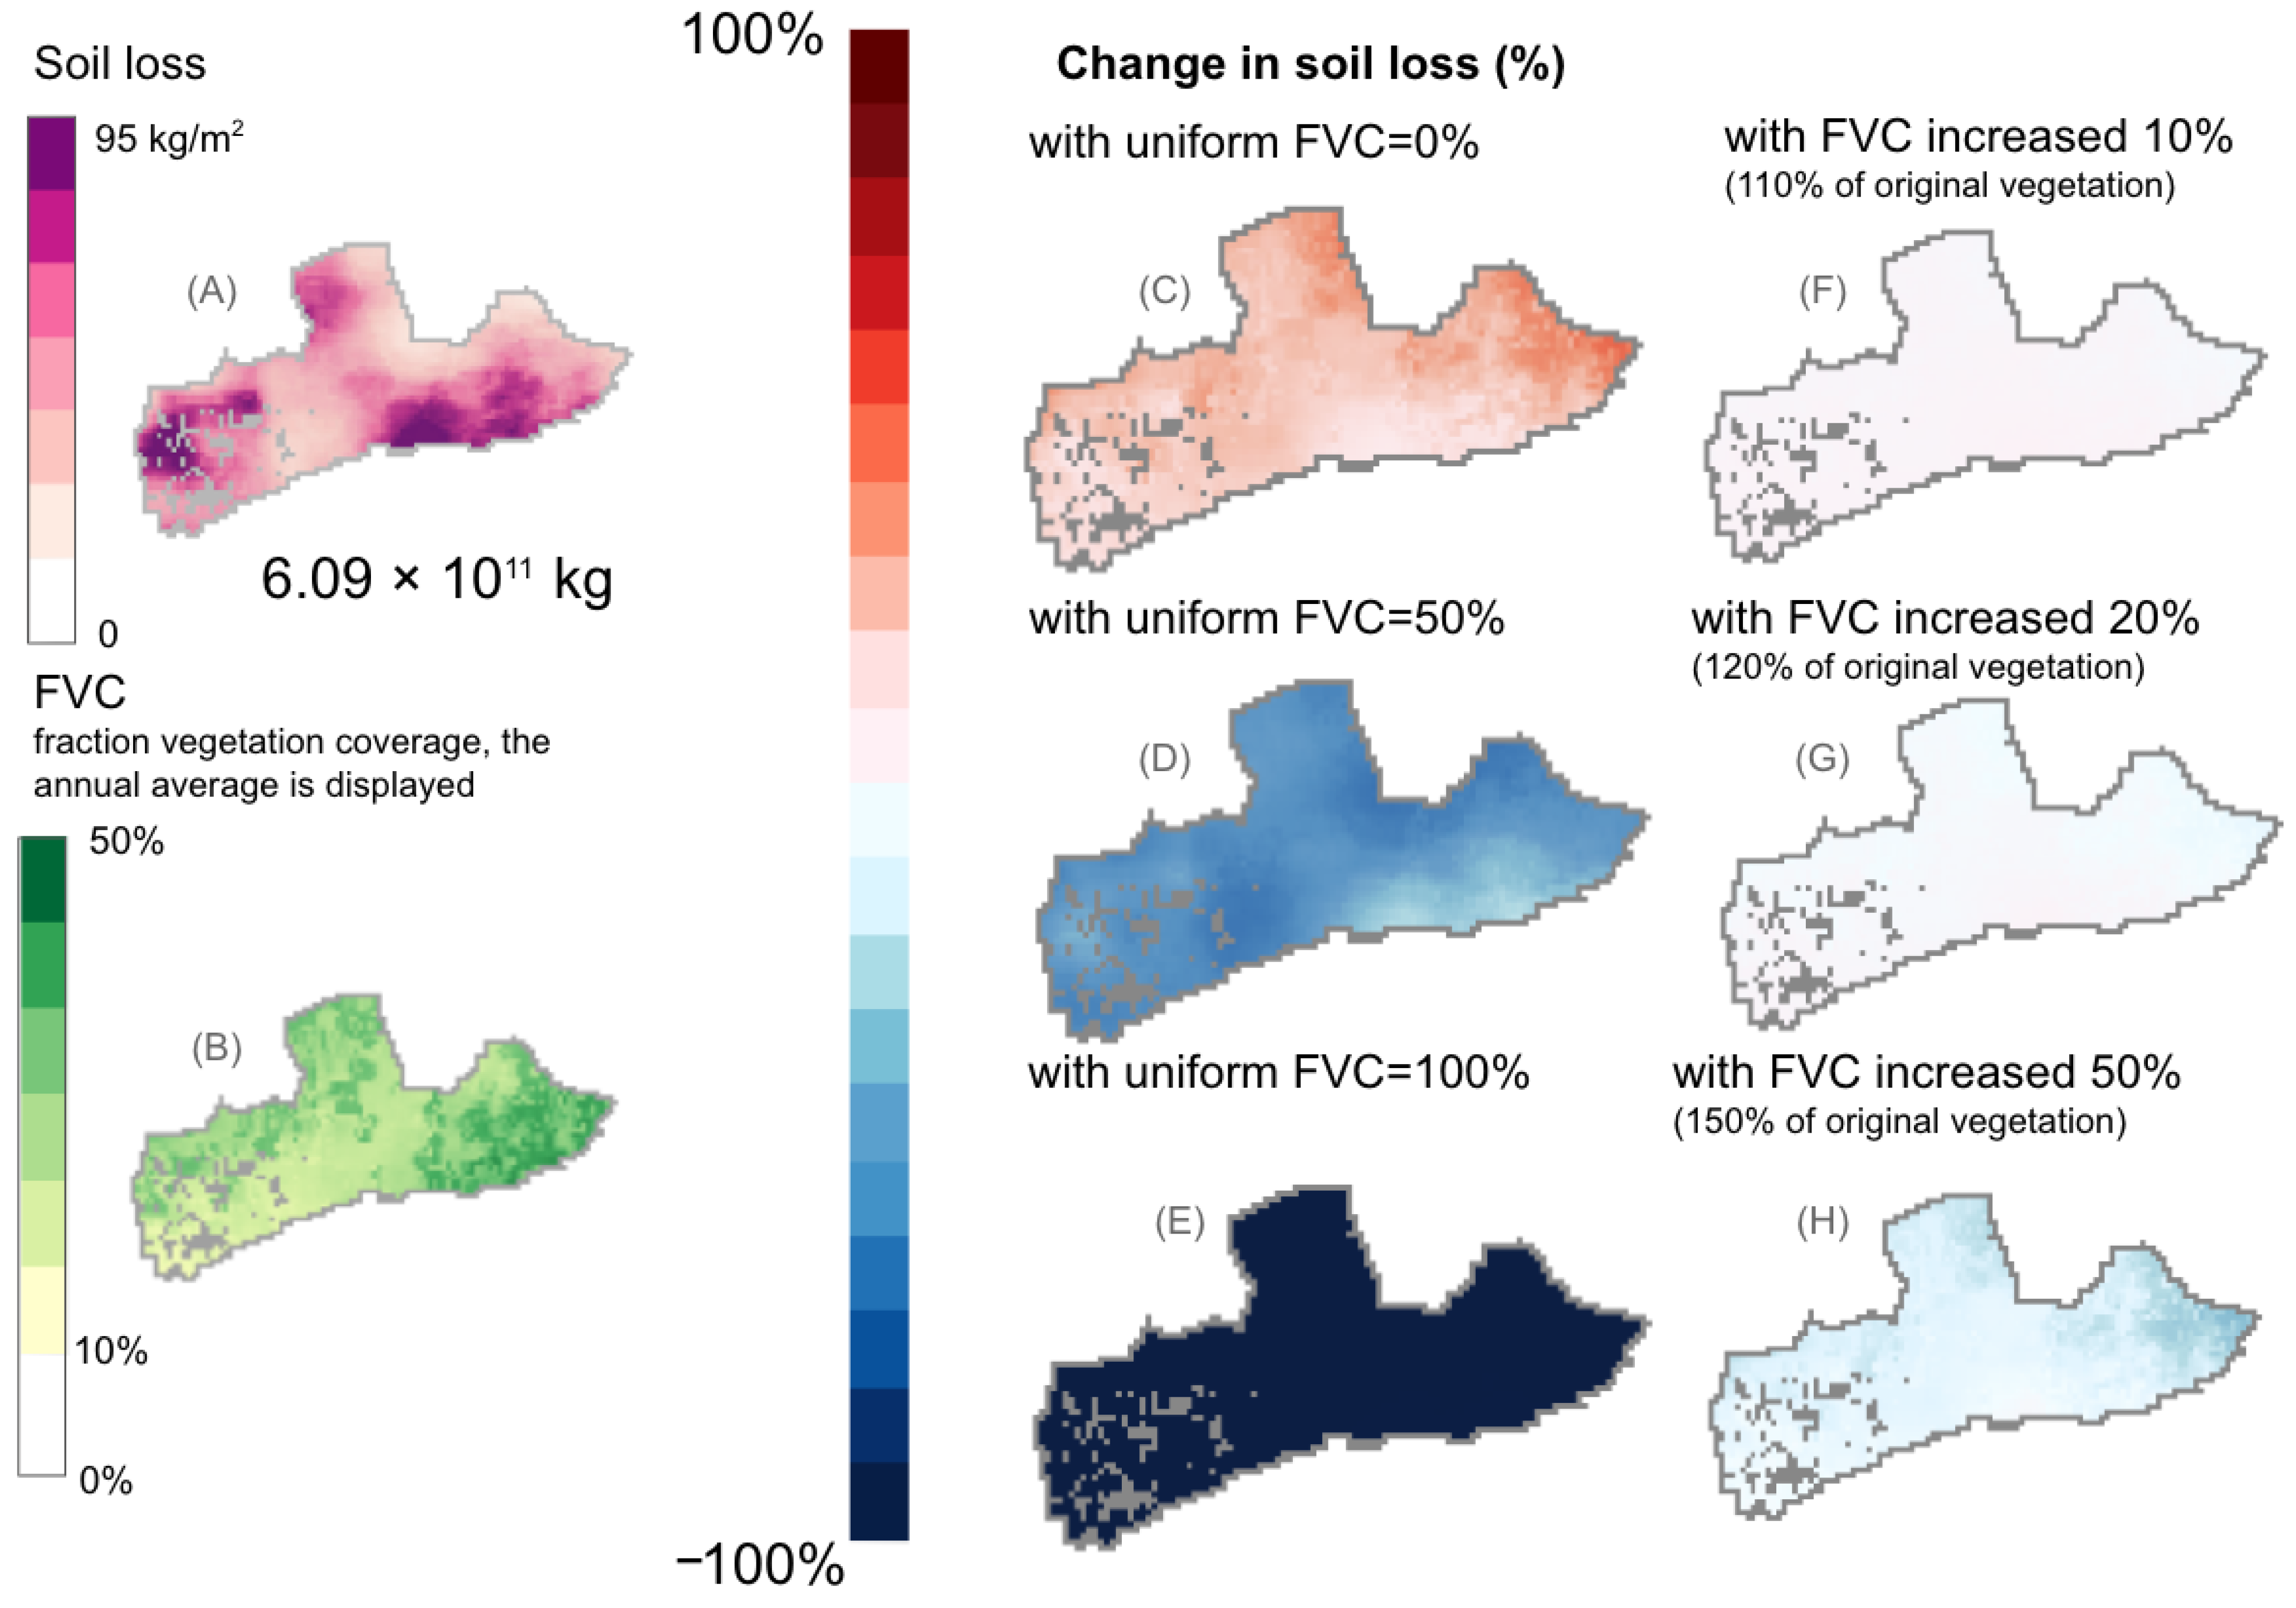
3.3.1. Effect of Vegetation Coverage on Soil Loss
3.3.2. Vegetation Coverage Management
4. Conclusions
Supplementary Materials
Author Contributions
Funding
Institutional Review Board Statement
Informed Consent Statement
Data Availability Statement
Acknowledgments
Conflicts of Interest
Software Availability
References
- Zhibao, D.; Xunming, W.; Lianyou, L. Wind erosion in arid and semiarid China: An overview. J. Soil Water Conserv. 2000, 55, 439–444. [Google Scholar]
- Duniway, M.C.; Pfennigwerth, A.A.; Fick, S.E.; Nauman, T.W.; Belnap, J.; Barger, N.N. Wind erosion and dust from US drylands: A review of causes, consequences, and solutions in a changing world. Ecosphere 2019, 10, e02650. [Google Scholar] [CrossRef]
- Zhao, H.-L.; Yi, X.-Y.; Zhou, R.-L.; Zhao, X.-Y.; Zhang, T.-H.; Drake, S. Wind erosion and sand accumulation effects on soil properties in Horqin Sandy Farmland, Inner Mongolia. CATENA 2006, 65, 71–79. [Google Scholar] [CrossRef]
- Li, H.; Gao, H.; Feng, X.; Wang, X.; Du, B. Contribution of farmland wind erosion to sand storms in northern China. In Remote Sensing and Modeling of Ecosystems for Sustainability II; International Society for Optics and Photonics: Bellingham, WA, USA, 2005; Volume 5884, p. 58840L. [Google Scholar]
- Joshi, J.R. Quantifying the impact of cropland wind erosion on air quality: A high-resolution modeling case study of an Arizona dust storm. Atmos. Environ. 2021, 263, 118658. [Google Scholar] [CrossRef]
- Lackóová, L.; Pokrývková, J.; Dufková, J.K.; Policht-Latawiec, A.; Michałowska, K.; Dąbrowska, J. Long-term impact of wind erosion on the particle size distribution of soils in the eastern part of the European Union. Entropy 2021, 23, 935. [Google Scholar] [CrossRef] [PubMed]
- Saxton, K.; Chandler, D.; Schillinger, W. Wind erosion and air quality research in the northwest US Columbia Plateau: Organization and progress. In Proceedings of the 10th International Soil Conservation Organization Meeting, West Lafayette, IN, USA, 23–28 May 1999; pp. 766–770. [Google Scholar]
- Griffin, D.W. Atmospheric movement of microorganisms in clouds of desert dust and implications for human health. Clin. Microbiol. Rev. 2007, 20, 459–477. [Google Scholar] [CrossRef]
- Dou, X.; Ma, X.; Zhao, C.; Li, J.; Yan, Y.; Zhu, J. Risk assessment of soil erosion in Central Asia under global warming. CATENA 2022, 212, 106056. [Google Scholar] [CrossRef]
- Fu, B.; Liu, Y.; Lü, Y.; He, C.; Zeng, Y.; Wu, B. Assessing the soil erosion control service of ecosystems change in the Loess Plateau of China. Ecol. Complex. 2011, 8, 284–293. [Google Scholar] [CrossRef]
- Woodruff, N.P.; Siddoway, F.H. A wind erosion equation. Soil Sci. Soc. Am. J. 1965, 29, 602. [Google Scholar] [CrossRef]
- Fryrear, D.; Sutherland, P.; Davis, G.; Hardee, G.; Dollar, M. Wind erosion estimates with RWEQ and WEQ. In Proceedings of the 10th International Soil Conservation Organization Meeting, West Lafayette, IN, USA, 24–29 May 1999. [Google Scholar]
- Hu, Y.; Liu, J.; Zhuang, D.; Yang, F. Study on the relationship between land-use dynamics and wind erosion dynamics in Inner Mongolia during late 1990s. Prog. Geogr. 2003, 22, 541–550. [Google Scholar]
- Qi, Y.; Liu, J.; Shi, H.; Zhuang, D.; Hu, Y. Estimation of wind erosion rates of Mongolian Plateau by using 137Cs tracing technique. Ann. Wars. Univ. Life Sci. SGGW. Land Reclam. 2010, 42, 197–208. [Google Scholar] [CrossRef]
- Jiang, L.; Xiao, Y.; Zheng, H.; Ouyang, Z. Spatio-temporal variation of wind erosion in Inner Mongolia of China between 2001 and 2010. Chin. Geogr. Sci. 2016, 26, 155–164. [Google Scholar] [CrossRef]
- Zhang, H.; Fan, J.; Cao, W.; Harris, W.; Li, Y.; Chi, W.; Wang, S. Response of wind erosion dynamics to climate change and human activity in Inner Mongolia, China during 1990 to 2015. Sci. Total Environ. 2018, 639, 1038–1050. [Google Scholar] [CrossRef]
- Fulajtár, E.; Mabit, L.; Renschler, C.S.; Zhi, Y.A.L. (Eds.) Use of ¹³⁷Cs for Soil Erosion Assessment; Food and Agriculture Organization of the United Nations: Rome, Italy; International Atomic Energy Agency: Vienna, Austria, 2017. [Google Scholar]
- Shi, H.; Gao, Q.; Qi, Y.; Liu, J.; Hu, Y. Wind erosion hazard assessment of the Mongolian Plateau using FCM and GIS techniques. Environ. Earth Sci. 2009, 61, 689–697. [Google Scholar] [CrossRef]
- Dai, Y.; Tian, L.; Zhu, P.; Dong, Z.; Zhang, R. Dynamic aeolian erosion evaluation and ecological service assessment in Inner Mongolia, northern China. Geoderma 2022, 406, 115518. [Google Scholar] [CrossRef]
- Lyu, X.; Li, X.; Wang, H.; Gong, J.; Li, S.; Dou, H.; Dang, D. Soil wind erosion evaluation and sustainable management of typical steppe in Inner Mongolia, China. J. Environ. Manag. 2021, 277, 111488. [Google Scholar] [CrossRef]
- Counties Benefit from Beijing-Tianjin Sandstorm Source Control Project. China Global Television Network News. 27 September 2020. Available online: https://news.cgtn.com/news/2020-09-27/Counties-benefit-from-Beijing-Tianjin-sandstorm-source-control-project-U7wvmur4Zy/index.html (accessed on 9 November 2021).
- Martin, E.; Mattison, E.; Taylor, K.; Cripps, I.; Lima, M.; Maney, C. Eastern Gobi Desert Steppe. 2022. Available online: https://www.oneearth.org/ecoregions/eastern-gobi-desert-steppe/ (accessed on 14 June 2022).
- Magsar, U.; Baasansuren, E.; Tovuudorj, M.-E.; Shijirbaatar, O.; Chinbaatar, Z.; Lkhagvadorj, K.; Kwon, O. Medicinal plant diversity in the southern and eastern Gobi Desert region, Mongolia. J. Ecol. Environ. 2018, 42, 4. [Google Scholar] [CrossRef]
- Visser, S.M.; Sterk, G.; Karssenberg, D. Wind erosion modelling in a Sahelian environment. Environ. Model. Softw. 2005, 20, 69–84. [Google Scholar] [CrossRef]
- Jarrah, M.; Mayel, S.; Tatarko, J.; Funk, R.; Kuka, K. A review of wind erosion models: Data requirements, processes, and validity. CATENA 2020, 187, 104388. [Google Scholar] [CrossRef]
- Stetler, L.; Saxton, K. Analysis of Wind Data Used for Predicting Soil Erosion. 1997. Available online: https://infosys.ars.usda.gov/WindErosion/symposium/index.htm (accessed on 21 August 2020).
- Samani, Z.A.; Pessarakli, M. Estimating potential crop evapotranspiration with minimum data in Arizona. Trans. ASAE 1986, 29, 0522–0524. [Google Scholar] [CrossRef]
- Saleh, A. Soil roughness measurement: Chain method. J. Soil Water Conserv. 1993, 48, 527–529. [Google Scholar]
- Dong, Z.; Chen, W.; Li, Z.; Yang, Z. The laboratory study on the role of vegetation in soil erosion by wind. J. Soil Eros. Soil Water Conserv. 1996, 2, 1–8. (In Chinese) [Google Scholar]
- Borrelli, P.; Lugato, E.; Montanarella, L.; Panagos, P. A new assessment of soil loss due to wind erosion in European agricultural soils using a quantitative spatially distributed modelling approach. Land Degrad. Dev. 2016, 28, 335–344. [Google Scholar] [CrossRef]
- United States Geological Survey. EarthExplorer. Available online: https://earthexplorer.usgs.gov (accessed on 20 August 2020).
- Muñoz Sabater, J. ERA5-Land Hourly Data from 1950 to Present. Copernicus Climate Change Service (C3S) Climate Data Store (CDS). 2019. Available online: https://cds.climate.copernicus.eu/cdsapp#!/dataset/reanalysis-era5-land?tab=form (accessed on 20 September 2020).
- Fick, S.E.; Hijmans, R.J. WorldClim 2: New 1 km spatial resolution climate surfaces for global land areas. Int. J. Climatol. 2017, 37, 4302–4315. [Google Scholar] [CrossRef]
- Penman, H.L. Natural evaporation from open water, bare soil and grass. Proc. R. Soc. London. Ser. A Math. Phys. Sci. 1948, 193, 120–145. [Google Scholar]
- Amicus Travel. Gobi Desert Climate: Average Monthly Temperature and Weather. 2 January 2020. Available online: https://www.amicusmongolia.com/climate-average-monthly-temperature-weather-gobi-desert-mongolia.html (accessed on 1 September 2020).
- Hengl, T.; Mendes de Jesus, J.; Heuvelink, G.B.; Ruiperez Gonzalez, M.; Kilibarda, M.; Blagotić, A.; Shangguan, W.; Wright, M.N.; Geng, X.; Bauer-Marschallinger, B.; et al. SoilGrids250m: Global gridded soil information based on machine learning. PLoS ONE 2017, 12, e0169748. [Google Scholar] [CrossRef] [PubMed]
- Kowal, V.; Ahlborn, J.; Jamsranjav, C.; Avirmed, O.; Chaplin-Kramer, R. Modeling Integrated impacts of climate change and grazing on Mongolia’s rangelands. Land 2021, 10, 397. [Google Scholar] [CrossRef]
- Ahlborn, J.; von Wehrden, H.; Lang, B.; Römermann, C.; Oyunbileg, M.; Oyuntsetseg, B.; Wesche, K. Climate—Grazing interactions in Mongolian rangelands: Effects of grazing change along a large-scale environmental gradient. J. Arid Environ. 2020, 173, 104043. [Google Scholar] [CrossRef]
- Du Plessis, M.; Van Huyssteen, C. Soil: The Producer’s Most Important Asset Part 5: Physical Properties of Soil. Grain SA Home. 2019. Available online: https://www.grainsa.co.za/soil-the-producers-most-important-asset--part-5-physical-properties-of-soil?print=1#:~:text=Bulk%20density&text=It%20is%20usually%20expressed%20as,1%20300%20kg%2Fm3 (accessed on 14 June 2022).
- Purdue University. Soil Erosion by Wind. Available online: https://www.agry.purdue.edu/soils_judging/new_manual/ch6-wind.html (accessed on 21 September 2020).
- Zhang, N.; Zhang, Q.; Li, Y.; Zeng, M.; Li, W.; Chang, C.; Xu, Y.; Huang, C. Effect of groundcovers on reducing soil erosion and non-point source pollution in citrus orchards on red soil under frequent heavy rainfall. Sustainability 2020, 12, 1146. [Google Scholar] [CrossRef]
- Zha, J.; Wu, J.; Zhao, D.; Fan, W. Future projections of the near-surface wind speed over eastern China based on CMIP5 datasets. Clim. Dyn. 2020, 54, 2361–2385. [Google Scholar] [CrossRef]


| Category | Dataset | Source | Temporal Range (Year) | Unit | Original Resolution | Format |
|---|---|---|---|---|---|---|
| Elevation | Elevation Data (DEM) | SRTM | 2000 | m | 0.05985 degrees2 per pixel | GeoTIF |
| Climate | Monthly Average Temperature | Worldclim current conditions | 1970–2000 | °C | 0.00833 degrees2 per pixel | GeoTIF |
| Monthly Total Precipitation | Worldclim current conditions | 1970–2000 | mm | 0.00833 degrees2 per pixel | GeoTIF | |
| Monthly Solar Radiation | Rangeland Production Model Output | 2014–2015 | MJ/m2 | 0.00324 degrees2 per pixel | GeoTIF | |
| Monthly Snow Cover | Rangeland Production Model Output | 2014–2015 | % (probability) | 0.05003 degrees2 per pixel | GeoTIF | |
| Monthly Number of Rain Days | Amicus Travel | 2020 | day | 0.05985 degrees2 per pixel | GeoTIF | |
| Daily Wind Speed | Copernicus Climate Data Store | 1981–2019 | m/s | 0.00833 degrees2 per pixel | GeoTIF | |
| Soil | Sand Ratio | ISRIC Soil Grids | 2014–2016 | % | 0.00208 degrees2 per pixel | GeoTIF |
| Silt Ratio | ISRIC Soil Grids | 2014–2016 | % | 0.00208 degrees2 per pixel | GeoTIF | |
| Clay Ratio | ISRIC Soil Grids | 2014–2016 | % | 0.00208 degrees2 per pixel | GeoTIF | |
| Organic Matter Ratio | Rangeland Production Model Output | 2014–2016 | % | 0.00324 degrees2 per pixel | GeoTIF | |
| Vegetation | Monthly Fraction of Vegetation Coverage | Rangeland Production Model Output | 2014–2016 | % | 0.05003 degrees2 per pixel | GeoTIF |
| Variable | Affected Soil Loss Factors | Global Average of Variable | Global Range {Min–Max} | Maximum Spatial Range {Min–Max} | Maximum Seasonal Range {Min–Max} | SL Sum (%) Difference with Variable = 50% of Actual Value | SL Sum (%) Difference with Variable = 150% of Actual Value | SL Sum (%) Diff When Variable = Min of Global Range Uniformly | SL Sum (%) Diff When Variable = Max of Global Range |
|---|---|---|---|---|---|---|---|---|---|
| Wind_speed (m/s) | WF | 1.2 | 0–13 | 0.7–17 | NA | −100 | 309 | −100 | 322 |
| Temp (° C) | WF | −0.13 | −24–20 | 5.8–7.4 | 33–40 | −3.06 | 2.70 | 52.5 | −9.43 |
| Precip (mm) | WF | 8.8 | 0–47 | 2–28 | 19–46 | 2.61 | −1.92 | 5.60 | −2.91 |
| Precip days | WF | 0.75 | 0–3 | NA | 0–3 | 2.61 | −1.92 | 5.60 | −17.7 |
| Solar_rad (MJ/m2) | WF | 667 | 260–1050 | 0.58–42 | 748–789 | −2.79 | 1.69 | −3.17 | 0.73 |
| Sand (ratio) | EF | 0.43 | 0.32–0.50 | 0.19–0.19 | NA | −16.6 | 15.5 | −8.70 | 4.66 |
| Silt (ratio) | EF | 0.39 | 0.32–0.48 | 0.16–0.16 | NA | −7.52 | 7.30 | −2.68 | 3.39 |
| Clay (ratio) | EF, SCF | 0.18 | 0.14–0.25 | 0.11–0.11 | NA | 75.0 | −46.1 | 27.2 | −42.2 |
| SOM (%) | EF, SCF | 2.7 | 2.3–3.2 | 0.88–0.88 | NA | 11.6 | −13.4 | 3.56 | −4.65 |
| fvc (%) | COG, K’ | 25 | 14–49 | 13–34 | 0–30 | 10.3 | −17.4 | 8.59 | −50.3 |
| WF (kg/m) | 25 | 0–520 | 22–510 | 15–516 | −52.5 | 43.4 | NA 1 | NA 1 | |
| EF | 0.43 | 0.39–0.45 | 0.05–0.05 | 0.00–0.00 | |||||
| SCF | 0.18 | 0.10–0.25 | 0.15–0.15 | 0.00–0.00 | |||||
| K’ | 0.79 | 0.48–0.86 | 0.07–0.37 | 0.00–0.35 | |||||
| COG | 0.89 | 0.79–0.94 | 0.06–0.14 | 0.00–0.12 |
| Area | Erosion Level as Defined by Zhang [16] (t/km2) | Annual Wind Erosion, as Calculated in This Study (t/km2) |
|---|---|---|
| Total Soil Loss/Total Area | Very Severe (8000–15,000) | 8800 |
| Quadrant I (North East) | Moderate (2500–5000)– Destructive (>15,000) | 2600–63,000 |
| Quadrant II (North West) | Very Severe (8000–15,000)–Destructive (>15,000) | 8900–69,000 |
| Quadrant III (South West) | Very Severe (8000–15,000)–Destructive (>15,000) | 8200–93,000 |
| Quadrant IV (South East) | Destructive (>15,000)–Destructive (>15,000) | 21,000–95,000 |
Publisher’s Note: MDPI stays neutral with regard to jurisdictional claims in published maps and institutional affiliations. |
© 2022 by the authors. Licensee MDPI, Basel, Switzerland. This article is an open access article distributed under the terms and conditions of the Creative Commons Attribution (CC BY) license (https://creativecommons.org/licenses/by/4.0/).
Share and Cite
Talukdar, I.N.; Kowal, V.A.; Huang, B.; Weil, C. Vegetation Drastically Reduces Wind Erosion: An Implementation of the RWEQ in the Mongolian Gobi Steppe. Land 2022, 11, 1204. https://doi.org/10.3390/land11081204
Talukdar IN, Kowal VA, Huang B, Weil C. Vegetation Drastically Reduces Wind Erosion: An Implementation of the RWEQ in the Mongolian Gobi Steppe. Land. 2022; 11(8):1204. https://doi.org/10.3390/land11081204
Chicago/Turabian StyleTalukdar, Isita Nandana, Virginia Anne Kowal, Binbin Huang, and Charlotte Weil. 2022. "Vegetation Drastically Reduces Wind Erosion: An Implementation of the RWEQ in the Mongolian Gobi Steppe" Land 11, no. 8: 1204. https://doi.org/10.3390/land11081204
APA StyleTalukdar, I. N., Kowal, V. A., Huang, B., & Weil, C. (2022). Vegetation Drastically Reduces Wind Erosion: An Implementation of the RWEQ in the Mongolian Gobi Steppe. Land, 11(8), 1204. https://doi.org/10.3390/land11081204