Article

Land Misallocation and Carbon Emissions: Evidence from China

School of Economics, Nanjing Audit University, Nanjing 211815, China
*
Author to whom correspondence should be addressed.
Land 2022, 11(8), 1189; https://doi.org/10.3390/land11081189
Submission received: 22 June 2022 / Revised: 21 July 2022 / Accepted: 27 July 2022 / Published: 29 July 2022
(This article belongs to the Special Issue The Eco-Environmental Effects of Urban Land Use)

Abstract

:
Based on the land market transaction data and city-level carbon emission data of 282 prefecture-level cities from 2005 to 2018 in China Land Market Network, this paper discusses the effect of land resource misallocation on carbon emissions and its influencing mechanisms. The research finds that, the local government’s strategy of “seek development with the land” has made a large amount of urban construction land being allocated to the industrial field, leading to the price of industrial land to be underestimated and obvious land resource misallocation. The land resource misallocation has significantly increased the level of urban carbon emissions through mechanisms such as hindering the upgrading of industrial structure, restraining technological innovation and weakening the effect of economic agglomeration. Moreover, the results are still robust after replacing the core variable indicators, considering extreme values and controlling endogeneity. Additionally, further study finds that land resource misallocation not only evidently aggravates the city’s own release of carbon emissions, but also has a remarkable spatial spillover effect on adjacent cities. Meanwhile, except for small cities, the misallocation of land resources in Type-I large cities and above, Type-II large cities and Medium-sized cities noticeably exacerbates urban carbon emissions, and the effect increases with the upgrading of city size. Regionally, the land misallocation on carbon emissions has significantly increased the carbon emissions in the eastern and central regions but has no significant impact on the carbon emissions in the western region. Finally, the conclusion of this paper will have important practical significance for further promoting the standardization of China’s land market and realizing the green and high-quality development of the urban economy.

1. Introduction

“Low-carbon life, green development” is the common pursuit of all countries in the world, and it is also an important goal of China’s development in the new era. The resolution raised in the Sixth Plenary Session of the 19th Central Committee of the Communist Party of China made an essential statement on economic green development, emphasizing the importance of green development in future economic development. It means that accelerating the green transformation of the economy has become a key part of promoting high-quality economic development in China. However, due to industrial development plays a vital role in boosting economic growth rapidly, under the incentive of economic growth competition and fiscal revenue maximization, local governments tend to preferentially allocate a large amount of urban construction land to the industrial field by relying on their monopoly and dominance on land supply, so as to stimulate regional economy growth and increase fiscal revenue through the methods of “attracting capital from the land” and “inducing capital to generate tax”. Although this development strategy of “seek development with the land” can improve the economic performance and fiscal revenue of local governments in the short term and enables local government officials to obtain more opportunities for promotion, it has led to excessive investment and homogeneous development of industries in various regions. This situation will further aggravate energy consumption, extensive utilization of resources and carbon dioxide emissions, and in turn have adverse effects on urban environmental quality. According to World Bank statistics, in 2005, China’s carbon emissions surpassed that of the United States and become the world’s largest carbon emitter. In 2016, China’s carbon emissions accounted for 29% of the world’s total. In 2019, China’s total carbon emissions directly doubled from 5.407 billion tons in 2005. These figures indicate that land resource misallocation has become a crucial factor in determining China’s carbon emission level. Accordingly, in order to facilitate the rational allocation of land resources in China, realize the transformation of economic development mode and high-quality development of economy, it is of great theoretical and practical significance to deeply understand the mechanism of the land resource misallocation’s impact on urban carbon emissions.
Regarding the generation mechanism behind carbon emissions, the existing literature mainly focuses on economic growth (Mi et al., 2017) [1], industrial structure (Wei and Zhang, 2020; Xiao et al., 2021) [2,3], technological level (Okushima et al., 2012; Zhao et al., 2021) [4,5], energy structure transformation (Lin and Li, 2015; Andersson and Karpestam, 2013; Yin et al., 2021) [6,7,8], urbanization and industrial layout (Zhang and Chen., 2021; Zhang and Xu, 2017) [9,10], traffic congestion (Hachem et al., 2021; Xie et al., 2019) [11,12], domestic and foreign trade (Zhang and Hewings, 2014; Dou et al., 2021; Song et al., 2021) [13,14,15], energy utilization (Zhang, 2009; Qu et al., 2017) [16,17], fiscal decentralization (Yang et al., 2021; Du and Sun, 2021; Shan et al., 2021) [18,19,20], environmental regulation (Safi et al., 2021) [21] and other aspects to carry out discussions on the driving factors, spatial characteristics and influencing mechanism of carbon emissions. However, few of studies have deeply analyzed the mechanisms and determinants of carbon emissions from the perspective of factor allocation that affects economic operation. Since the reform and market opening up, in order to scientifically define the relationship between the government and the market, China has gradually implemented a series of market-oriented reform measures for promoting the market to play a decisive role in resource allocation. However, the effects of these market-oriented reform measures are typically concentrated in the final product market, and the market-oriented reform of the factor market is still relatively lagging behind, which inevitably leads to price distortions in the factor market, serious resource misallocation and loss of economic efficiency (Tan, 2015; Atkinson and Cornwell, 1994; Hsieh and Klenow, 2009) [22,23,24]. Especially in the land factor market, the government, as the sole supplier of the primary land market, basically monopolizes the right of land development and supply, and has a decisive dominance over the mode, structure and quantity of land resource allocation (Zhang and Yu, 2011) [25]. On the one hand, the excessive intervention of the local government in the land market weakens the role function of the market in the allocation of land resources, and exacerbates the price distortion of land factors and the misallocation of resources. On the other hand, the misallocation of land resources will further affect the development mode of the economic activities which land carries (Mc Millan et al., 1989; Li and Luo, 2017) [26,27], and then works on environmental quality. However, there are few literatures that directly detect the influencing mechanism of carbon emissions from the perspective of land resource allocation. Even if a few scholars have paid attention to the impact of land element allocation of resources and environment (Zhang and Xu, 2017) [10], they only concentrate on the impact of land scale expansion in the process of urbanization, and does not conduct in-depth and systematic investigations on whether land resources are misallocated and the impact mechanism of land resource misallocation on carbon emissions. Hence, based on the analysis and summary of the impact mechanism of land resource misallocation on carbon emissions, with the hope of providing useful reference for the government to effectively optimize the land resource allocation and reduce carbon emissions, and finally helping to reach the goal of carbon peak, carbon neutrality and high-quality development of green economy as soon as possible, this paper intends to take the panel data of 282 prefecture-level cities in China from 2005 to 2018 as a sample and constructs an econometric model to comprehensively explore how land resource misallocation specifically affects carbon emissions.
Compared with the existing literature, the contributions of this study are following. First, this paper empirically tests the influence mechanism of land misallocation on urban carbon emissions in depth, which provides a new angle for understanding the underlying causes of carbon emissions from the perspective of resource allocation in factor markets. Second, this paper analyzes the theoretical mechanism of land resource misallocation affecting carbon emissions from three aspects: industrial structure upgrading, technological progress and agglomeration effect, which provides a new theoretical framework for understanding the causes of carbon emissions from the perspective of land resource allocation. Third, this paper applies web crawler technology to collect the actual transaction data of commercial land, residential land and industrial land covering 282 prefecture-level cities nationwide in China Land Market Network from 2005 to 2018, and uses marginal output method to calculate the misallocation index of industrial land combined with the production function, so as to directly estimate the current misallocation degree of construction land in each city. Fourth, this paper not only examines the spatial spillover effect of land resource misallocation on carbon emissions, but also analyzes the differential impacts of land resource misallocation on carbon emissions from the perspective of heterogeneity in different cities and regions, which is helpful to grasp the deep mechanism of carbon emission pollution in land resource allocation. The rest of this paper is arranged as follows. Section 2 is the analysis of the influence mechanism and the theoretical hypothesis. Section 3 is the model and data. Section 4 is results and discussion. Section 5 is drawing conclusion.

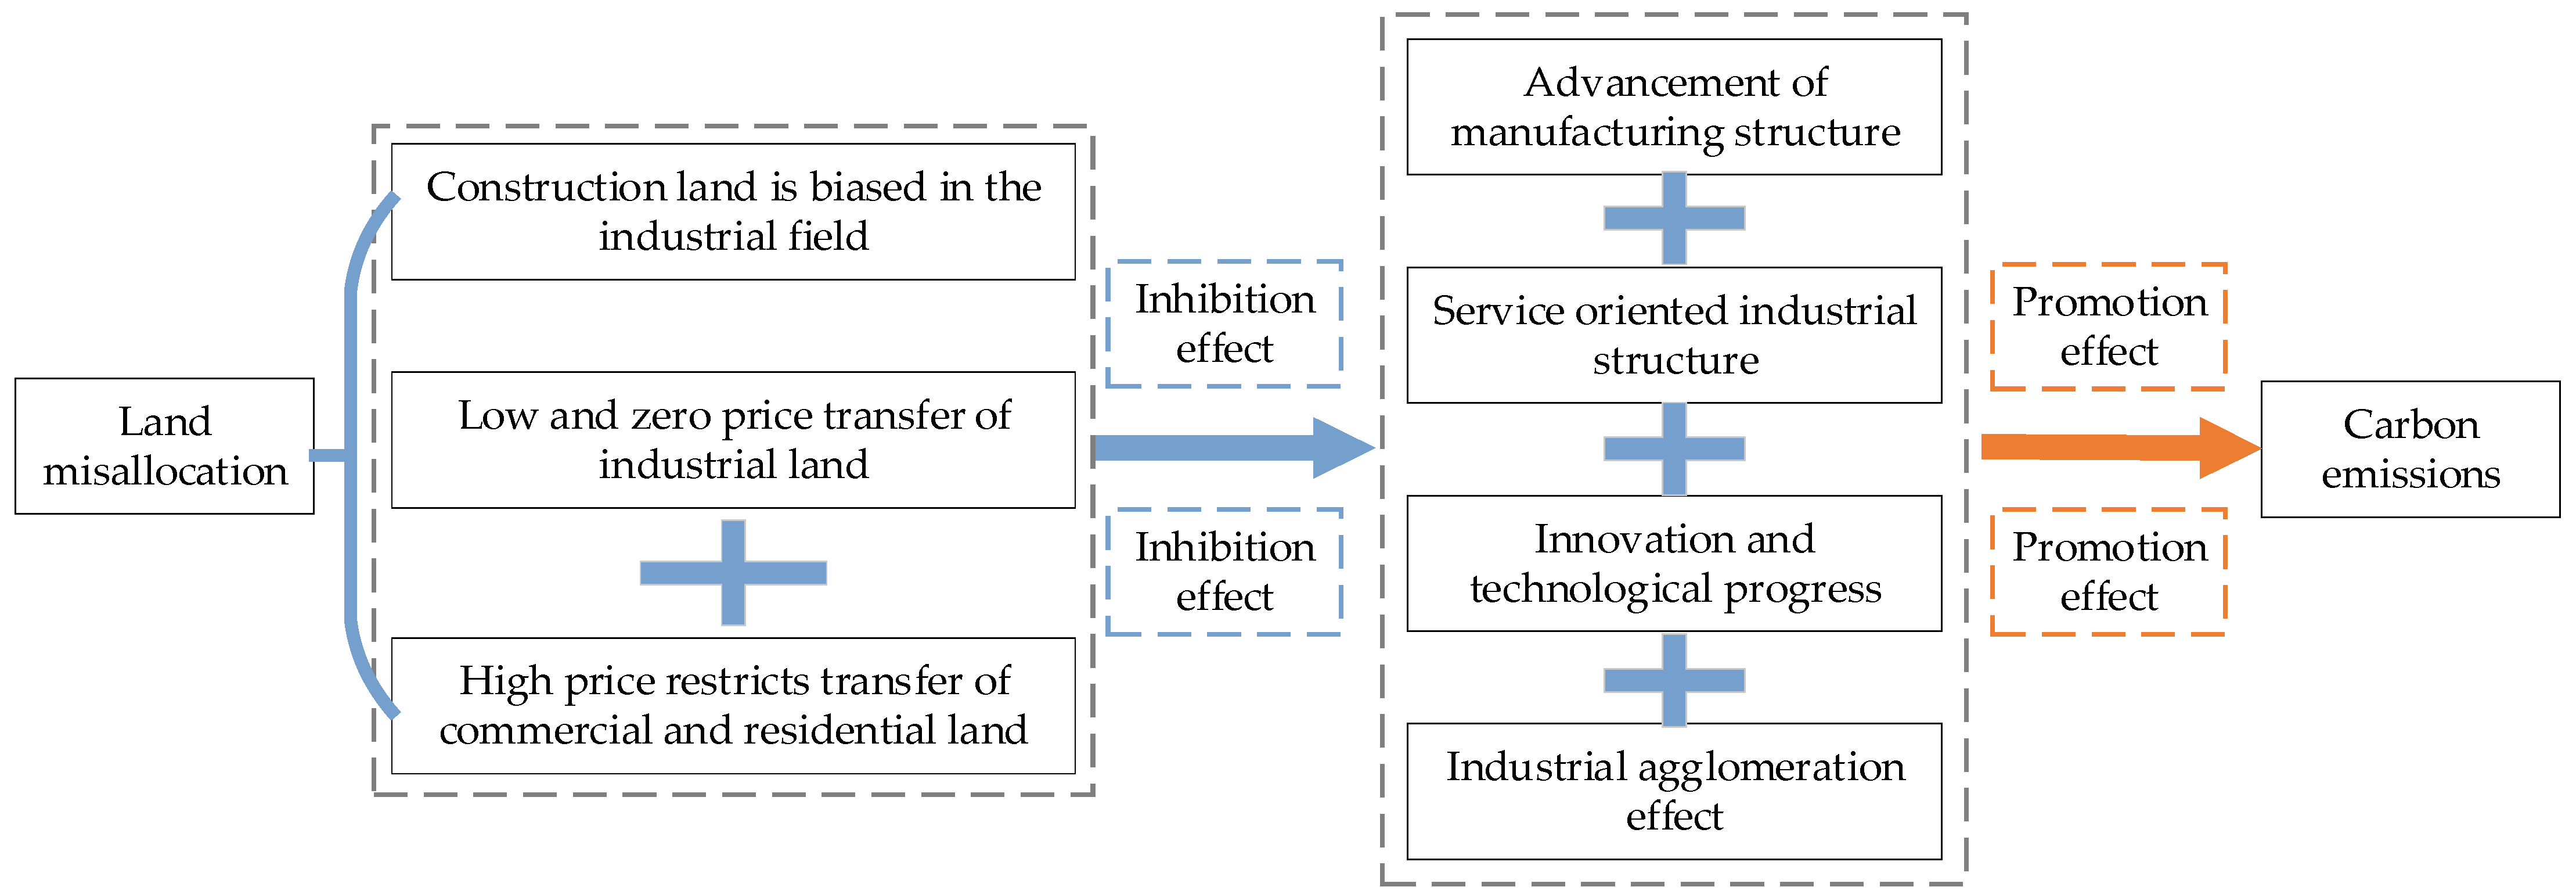
2. Influence Mechanism and Theoretical Hypothesis

2.1. Land Resource Misallocation Affects Carbon Emissions by Hindering the Upgrading of the Industrial Structure

In addition to incomplete factor markets and defects in the property rights system, fiscal decentralization and excessive government intervention are also critical reasons for the misallocation of land resources in China (Restuccia and Rogerson, 2008; Huang and Du, 2017) [28,29]. Since the reform of the tax-sharing system in 1994, the central government has sharply decreased the local financial power, but the expenditure of local governments is not much different from before and even increase relatively, which causes local governments’ financial burden becoming increasingly heavy. Under the performance appraisal system based on fiscal and tax maximization and reginal economic growth, capital-intensive industrial industries that can tremendously promote GDP growth in the short term have become the top priority for local governments to drive regional economic growth (Tan and Zheng, 2012; Wang et al., 2021) [30,31]. The local government expands the scale of land acquisition and supply through the establishment of new urban areas, various industrial parks and development zones to attract industrial investment at low or zero land prices. Consequently, urban construction land mainly flows into productive infrastructure construction and industrial fields that match the industry, which leads to the excessive development of capital-intensive industries and heavy industries, aggravates energy consumption and distorts resource allocation, and brings about detrimental effects on the low-carbon transformation and development of the urban economy. At the same time, driven by the competitive pressure of economic growth and the motivation of tax maximization, in order to gain advantages in attracting investment, local governments have strong incentive to invest in capital-intensive infrastructure construction fields, and give priority to the development of capital-intensive industries or heavy industries (Chen and Yao, 2011; Liu et al., 2021) [32,33]. As the most fundamental and critical economic resource in local development, land has become an important guarantee for local governments to gain a competitive advantage in attracting investment. Owing to the monopoly and control rights in the primary land market, local governments are scrambling to make use of industrial land concessions, infrastructure construction subsidies and other means to reduce the cost of land for investment companies, and launching fierce competition in the process of attracting investment and obtaining external industrial capital, thus causing serious distortion of land market price and resource misallocation (Restuccia and Rogerson, 2008; Ulph, 2000; Fredriksson et al., 2003) [28,34,35]. Although capital-intensive and heavy industries can bring about fast economic growth in the short term, they are often featured with low productivity, high pollution, high emissions and high energy consumption. Therefore, excessive transfer of industrial land will not only generate extensive and inefficient use of industrial land, but also increase the emission of pollutants such as smoke and carbon dioxide in the atmosphere, thus enhancing the level of urban carbon emissions. In the meantime, the government-biased industrial land allocation model endogenous to fiscal decentralization and political tournament, will act on corporate location decisions (Clark and Hunter, 1992; Dustmann and Okatenko, 2014) [36,37], and accelerate industrial enterprises to cluster in cities, thereby reinforcing the rigidity of the industrial structure dominated by capital-intensive industries and hindering the upgrading of the urban industrial structure (Hanson and Slaughter, 1999) [38]. In essence, the over-assignment of industrial land is exactly the misallocation of land resources. According to the theory of inputs misallocation across firms (Hsieh and Klenow, 2009) [24], when the land is excessively sold to industrial land, the combination of land factor input will deviate from the optimal choice, which will cause the actual output of the land to be lower than the effective output, that is, the output efficiency of land factors is lost in the land resource misallocation. Wang et al. (2021) [31] found that low-priced industrial land supply can lead to excessive development of the secondary industry in cities, strengthen the rigidity of the urban industrial structure dominated by low-value-added manufacturing, and curb the industrial structure from climbing to high-end development. Although the land finance model of selling commercial and residential land at a high price is conducive to fostering the development of the real estate market and increasing the fiscal revenue of local governments, the high cost of land use will further restrain the development of the service industry. Hence, this land price distortion is not beneficial to the upgrading of the industrial structure. Not only that, as a means for local governments to compete for economic development, the biased allocation of land resources in the industrial fields of various regions will also lead to industrial development in a way of violating the advantages of each region’s resource endowments, resulting in repeated investment in similar industries, low-level similarity in structure and low efficiency of land use. Accordingly, this land supply strategy solidifies the industrial structure dominated by capital-intensive manufacturing or industry in various regions (Du and Peiser, 2014, Cai et al., 2009; Qu and Tan, 2010) [39,40,41], thereby causing waste of resources and allocation of factors distortion, inhibiting the advanced process of manufacturing and intensifying carbon emissions in various regions.
In addition, it is generally accepted that the modern service industry has the characteristics of high technology content, significant economies of scale, rapid productivity improvement, low energy consumption and low pollution (Duan et al., 2016; Liu et al., 2017) [42,43]. The growth of modern service industry not only has the function of reducing environmental pollution and improving environmental quality, but also can helpfully form synergistic agglomeration and linkage development with the manufacturing industry, generating significant economies of scale and technology spillover effects (Gaulier et al., 2007; Ke et al., 2014) [44,45], thereby improving knowledge and technology content, extending the industrial value chain and other channels to help manufacturing industry save the cost, optimize the structure, strengthen the feedback effect of the modern service industry on the manufacturing industry (Preissl, 2007; Francois and Hoekman, 2010; Goe, 2002) [46,47,48], and achieve green development. To sum up, promoting the development of modern service industry and raising the proportion of modern service industry in the economic structure has important practical significance for reducing carbon emissions and improving air quality. However, with the continuous expansion of urban space, local governments usually allocate 40–50% of the acquired construction land to the industrial sector at low or zero land prices, and only sell 20–30% of the construction land at high prices for commercial service development and housing construction (Zhang and Xu, 2017) [10]. Since the total amount of land resources is limited, if a large amount of land is allocated to infrastructure and industrial fields, it means that the land reserved for modern service industries, especially productive services, is fairly restricted and expensive (Chen and Kung, 2016) [49]. In this case, it not only directly leads to insufficient development of the modern service industry, but also increases the production and operating costs of the modern service industry, which is unfavorable to the full development and agglomeration of the modern service industry. Not only that, under the land allocation strategy of “seek development with the land”, local governments are both beneficiaries and users of land fiscal revenue. Local governments prefer to use land revenue for productive infrastructure construction that can accelerate industrial development (Zhong et al., 2019; Huang and Chan, 2018) [50,51], especially manufacturing-related projects, while there is little or no capital to support the modern service industry, thus leading to the excessive development of capital-intensive industries and heavy industries, and the development of the modern service industry lags behind. As a result, the biased allocation of urban land resources in infrastructure construction and industrial development will delay the service-oriented process of industrial structure, and thus reduce the level of urban carbon emission control.

2.2. Land Resource Misallocation Affects Carbon Emissions by Inhibiting Green Innovation and Technological Progress

Technological progress and innovation can validly alleviate energy consumption and carbon emission pollution, which are the determinants of promoting carbon emission control and environmental quality improvement (Braun and Wield, 1994; Gu et al., 2019) [52,53]. In particular, land is a vital tool for local governments to seek development in response to huge financial pressures and competition for inter-regional economic growth, and its preferential allocation in the industrial field can affect carbon emissions by acting on technological progress and corporate innovation. The behavior that local governments compete to cut down the price of industrial land and expand the scale of industrial land transfer to attract investment is quite frequent. On the one hand, it will lead to a large number of low-efficiency enterprises entering the jurisdiction to invest due to low land prices, thereby decreasing the total factor productivity and innovation capabilities of the overall industrial enterprises in the city. On the other hand, it is not conducive to low-carbon technology research and development (R&D), promotion and application of technology, and thus have a negative impact on carbon emission control. Holmstrom and Milgrom (1991) [54] pointed out that GDP-oriented assessment mechanism will promote local governments to use their administrative power to divert various resources such as land, to industries that are only in favor of economic growth. The industries that can rapidly stimulate economic growth in the short term are often capital-intensive industries with low efficiency but large investment scale, so these industries are mostly listed as the key investment targets by development zones and industrial parks. Under the pressure of economic growth competition and political promotion, the phenomenon of local governments attracting investment at low prices is still serious. Extensive use of land resources may not only lead to the rapid development of industries with high-emission and high-pollution, but also give rise to low-quality repetitive construction of some industries, thus making companies underpowered to technological innovation (Gao et al., 2021; Wu et al., 2014) [55,56]. At the same time, because local governments pay more attention to the scale of short-term investment rather than the quality of long-term investment when selling industrial land, a large number of low-efficiency enterprises invest in scarce industrial land, forming some industries such as low-end production capacity with backward technology, low technology content and bleak development prospects, which is harmful to the overall improvement of urban R&D capabilities and the continuous improvement of technological progress. Therefore, it is not only unable to further control and reduce carbon emissions through technological progress, but also aggravates carbon emissions by inhibiting technological progress. Research represented by Restuccia and Santaeulalia-Llopis (2017) [57], and Adamopoulos et al. (2022) [58] both showed that land resource misallocation has a significant inhibitory effect on the improvement of technological innovation capabilities. The elevation of innovation level not only comes from the increase of R&D investment, but also is inseparable from the improvement of factor resource utilization efficiency in the innovation process (Jefferson et al., 2006) [59]. In the case of improper allocation of land resources, it is difficult for land resources to flow from low-productivity enterprises to high-productivity enterprises. When the cost of low-productivity enterprises is too low, enterprises will be limited by the current production efficiency and technical level, and have troubles in further encouraging the progress of green technology and innovative development (Zhang et al., 2019) [60]. Acemoglu et al. (2016) [61] argued that the misallocation of land resources actually provides economic conditions for local governments to implement the fiscal expenditure bias of “emphasizing production over innovation”. Innovation has the characteristics of positive externality, large investment and long cycle, as result of which, the improvement of urban innovation capability cannot be separated from the support of local government financial expenditure. However, under the influence of land resources misallocation, the government uses more land fiscal revenue to support the construction of industrial infrastructure and infrastructure projects for the sake of their political performance, rather than increasing education or human capital inputs that are beneficial to the improvement of regional innovation capabilities. It disguisedly squeezes out the expenditure of government innovation funds, resulting in insufficient improvement of urban innovation capabilities, which exerts adverse impacts on R&D and innovation of low-carbon technologies. Hence, in the above analysis, if local governments ignore technological progress and long-term sustainable economic growth in the competition for land investment, and introduce a large number of enterprises featured with high-energy-consumption and high-emission low production efficiency, insufficient technical content and backward clean production technology, then the level of carbon emissions may increase.

2.3. Land Resource Misallocation Affects Carbon Emissions by Reducing the Effect of Economic Agglomeration

The theory of agglomeration economics argues that the main goal and driving force of industrial agglomeration is the sharing of technological spillovers in a collaborative innovation environment (Marshall, 1961, Gleaser et al., 1992) [62,63]. Moreover, the industrial agglomeration emphasized by the agglomeration economic theory should be market-oriented, that is, under the condition of no excessive intervention of administrative forces, enterprises spontaneously choose the optimal location agglomeration according to the principle of market-led efficiency. Such industrial agglomeration pays more attention to the internal correlation among enterprises, the matching of corporate behavior and local comparative advantages, so that it can effectively stimulate the economies of scale and technology spillover effects of agglomeration, thereby improving the level of production and the technology of carbon emission reduction (Lu and Feng, 2014; Krugman, 1998; Han et al., 2018; Hong et al., 2020) [64,65,66,67]. However, local governments compete to cut down the price of industrial land and expand the scale of industrial land transfer by means of the bottom-line competitive strategy to attract investment. The behavior is actually through excessive intervention in the land factor market to implement land rent concessions and disguised subsidies for investment enterprises, thereby greatly reducing the production cost and investment risk of enterprises within the jurisdiction. So that a large number of foreign companies continue to massively gather in the jurisdiction for obtaining “land concessions” rather than market efficiency. Due to not following the laws of the market, although the “clustering” agglomeration of enterprises induced by local governments through preferential land policies can boost prompt economic growth and tax revenue in the short term, it may pose greater challenges. For instance, it is probably harder to generate technological spillover effects and economies of scale effects, so that lowering the carbon emission reduction effects of industrial agglomeration and further increasing carbon emissions. Driven by economic performance appraisal and financial pressure, local government officials prefer to use biased land policies to intervene in industrial agglomeration, resulting in price distortions of the land factor market, low-level repetitive construction of industrial investment, and hindering factor flow and effective resource agglomeration, thereby causing extensive economic development (Brakman et al., 2002; Liu et al., 2019) [68,69]. According to the pollution refuge theory (Schwarze, 1996) [70] and the race-to-the-bottom-line hypothesis (Esty and Dua, 1997) [71], the influx of a large number of low-end manufacturing enterprises will generate “crowded” industrial agglomeration, which will further hasten energy consumption and carbon emissions. Wilson (1999) [72] pointed out a kind of regional competition strategy with the characteristics of “race to the bottom”, which aims to attract liquidity factors to the jurisdiction by providing preferential conditions at the cost of tolerating environmental damage. The “race to the bottom” subsidy conducted by local governments that is designed to attract foreign investment enterprises by lowering land prices and other forms can have two impacts on the industrial agglomeration effect. Firstly, this “race to the bottom” competition will bring about excessive economic agglomeration and even overcrowding agglomeration, which will accelerate the consumption of resources and energy, and deteriorate the carbon emission control environment (Ren et al., 2003; Verhoef and Nijkamp, 2002) [73,74]. Secondly, enterprises will be more concerned about obtaining “policy rent” when choosing the location of agglomeration, while ignoring the correlation between enterprises in the agglomeration area. This situation will further weaken the agglomeration effect (Shi and Shen, 2013) [75], and worsen the conditions of enterprises making full use of economies of scale and technology spillover to reduce carbon emissions. Simultaneously, it can be seen that under the motivation of growth competition and financial maximization, when local governments attract investment by reducing the price of industrial land and expanding the scale of industrial land transfer, they pay more attention to the amount and investment scale of enterprises in the jurisdictions, instead ignoring the matching between corporate investment behavior and local comparative advantages, the correlation and coordinated development between enterprises, thus impairing the agglomeration effect in the process of industrial agglomeration and aggravating carbon emissions.
In summary, under the guidance of the strategy of “land for development”, local governments have the motivation to allocate a large amount of urban construction land to the industrial sector, resulting in land price distortion and resource misallocation, which may further exacerbate urban carbon pollution by hindering the upgrading of manufacturing structure, the service of industrial structure, the progress of urban green innovation technology and manufacturing agglomeration. As is shown in Figure 1, the theoretical analysis framework diagram clearly presents the impact mechanism of land resource misallocation on urban carbon emissions. Therefore, this paper proposes the following three hypotheses on the impact mechanism of land resource misallocation on urban carbon emissions.
Hypothesis 1.
The biased allocation of urban land resources in the industrial field will lead to excessive development and homogeneity of capital-intensive industries in various regions, hinder the process of advanced manufacturing structure and service-oriented industrial structure, and thereby exacerbate urban carbon emissions.
Hypothesis 2.
The biased allocation of land resources in the industrial field will exacerbate carbon emissions by inhibiting urban innovation and technological progress.
Hypothesis 3.
The biased allocation of urban land resources in the industrial field will adversely affect carbon emission governance by weakening the agglomeration effect of industrial agglomeration.

3. Model and Data

3.1. Model Settings

According to the theoretical mechanism, the equation quantifying the impact of land resource misallocation on CO2 emissions can be expressed as follows:
ln P i t = α 0 + β 1 ln G i t + β k k X i t k + ε i t
In which, P represents the CO2 emissions of city i in the period of t, G represents land resource misallocation, k is the number of control variables, X represents other control variables affecting urban CO2 emissions, and ε i t is a stochastic error term. The existing literature suggests that other variables affecting urban CO2 emissions also include industry size (L), energy consumption (Energy), foreign direct investment (Fdi), environmental regulation (λ), urbanization (Urban), urban sprawl (Ru) and traffic conditions (Trf), of which, energy consumption is associated with CO2 emissions the most directly. Using Spatial Dubin Model (SDM), Wu et al. (2021) [76] revealed that CO2 emissions may bring about resource curse, and energy-dependent industries and CO2 emissions are positively correlated. In the aspect of foreign direct investment, based on a panel data of 30 provinces in China, Song et al. (2021) [15] found that FDI can both promote and curb CO2 emissions, and the combined effect is that FDI has promoted CO2 emissions. Wang et al. (2021) [77] explored the impact of urbanization on CO2 emissions, arguing that urbanization will reduce CO2 emissions. Furthermore, the study reveals that urbanization can affect CO2 emissions through energy efficiency, economic growth and industrial agglomeration, which sheds light on the green, sustainable, and low-carbon development. Nevertheless, overpopulation and traffic congestion as a result of urbanization will certainly drive CO2 emissions. Based on the “population-economy-environment” study, Liu et al. (2020) [78] found that urban population, economy and vehicles can indirectly drive CO2 emissions. Zhang and Xu (2017) [10] contend that the disorderly urban sprawl and the ensuing changes in land use and coverage not only eroded the green space of cities, undermining landscape and compromising ecosystem services, but also increased energy and resource consumption and CO2 emissions. Thus, urban sprawl is an also major factor affecting CO2 emissions. Based on the above analysis, this paper further controls the above variables in the equation, and comes up with the measurement model as follows:
ln P i t = α 0 + β 1 ln G i t + β 2 ln L i t + β 3 ln E n e r g y i t + β 4 ln F d i i t + β 5 ln λ i t + β 6 ln U r b a n i t + β 7 ln R u i t + β 8 ln T r f i t + ε i t
In which, β1~β8 are the coefficients of the impact of various control variables on urban CO2 emissions.

3.2. Variables, Indicators and Data Source

This paper uses the panel data of 282 prefecture-level cities nationwide from 2005 to 2018. To ensure the integrity and availability of panel data, more than 10 cities with serious data missing such as Laiwu, Lhasa, Sansha, Haidong, Chaohu, Longnan and Zhongwei have been deleted. The data mainly come from the China City Statistical Yearbook, China Land and Resources Statistical Yearbook, China Urban Construction Statistical Yearbook, and China Population and Employment Statistics Yearbook from 2006 to 2019. Due to the lack of city-level price indexes, this paper adjusts the city data with price indexes at the provincial level which are collected from the China Statistical Yearbook. The definition and measurement methods of relevant variables and indexes are explained as follows.
(1) Urban CO2 emissions (P). GHG Protocol divides greenhouse gas emissions into three types. The first type is the direct emissions from fossil fuel combustion in the manufacturing and industrial production of enterprises, including emissions from stationary combustion, mobile combustion, chemical or production processes, or fugitive emissions. The second is the indirect emissions generated by the power purchased by enterprises, including the emissions from steam generation, heating, air-conditioning, etc. The third is the indirect emissions other than the second type, including emissions generated from upstream and downstream of a company’s supply chain or value chain, such as the extraction, production and transportation of raw materials, and consumers’ use of products and services, etc. The first type is direct emissions while the second and third type are indirect emissions. At present, no CO2 emission data has been directly published by statistical agencies in China. The existing list of CO2 emissions suggests that a majority of emissions in China belong to the first type, namely, direct emissions from enterprises (Guan et al., 2021; Shan et al., 2018/2020) [79,80,81]. Referring to the approach of Chen et al. (2020a) [82], this paper measures urban CO2 emissions data based on three satellite datasets, e.g., two nighttime light datasets, which are the DN values of DMSP/OLS1 and NPP/VIIRS2, and terrestrial carbon sequestration data provided by MODIS NPP3. Vegetation has a significant ability to isolate and reduce CO2 emissions, so the carbon sequestration of terrestrial vegetation should be further deducted when calculating CO2, and the calculation method of terrestrial carbon sequestration value in this paper is the same as that adopted by Chen et al. (2020) [83]. Since only provincial-level energy balance sheets are available, and energy consumption data of cities is lacking, this paper unifies the image scale of DMSP/OLS and NPP/VIIRS with the PSO-BP approach, and obtains the scale of nighttime light data and simulates the matching relationship related to CO2 emissions, so as to measure urban CO2 emissions using the sum of DN values as a proxy. In addition, given the geographic heterogeneity of some data, this paper obtains the coordinates of cities with minimum bounding rectangle (MBR), and obtains the area of cities using Arc map 10.5, and finally obtains the CO2 emissions4 of 282 cities by taking DN values, homogeneous dummy variables, and the sum of years as input parameters, central coordinates (latitude X and longitude Y) and area of city (A) as supplementary input parameters, and provincial-level CO2 emissions as output parameters, using weighted average method (Meng et al., 2014; Su et al., 2014; Yang et al., 2020) [84,85,86].
The provincial-level CO2 emission data in the above analysis is estimated based on the CO2 emissions of 30 provinces in China (excluding Tibet, Hong Kong, Macao, and Taiwan) from 2005 to 2018 with the method proposed in the Intergovernmental Panel on Climate Change (IPCC). Specifically, the consumption of various fuels is converted into the unified unit joules, and multiply by the CO2 emissions factor of various fuels to obtain the actual CO2 emissions of various fuels, and then calculate the actual carbon dioxide emissions of China’s provinces. The equation is as follows:
C E t = i = 1 30 C D i r e c t , i t = i = 1 30 j = 1 17 ( E i j t × L C V i j t × C C i j t × C O F i j t × 44 12 )
where, i represents the province and j refers to the way of energy use. C E t is the total CO2 emissions of the province (unit: million ton); E i j t refers to the consumption of energy j of each province, which are collected from the Energy Balance Sheet (Physical Quantity) in the China Energy Statistical Yearbook over the years. The physical quantity of energy is converted according to the Conversion Factors from Physical Units to Coal Equivalent annexed to the China Energy Statistical Yearbook. L C V i j t is the lower heating value of energy j, or the calorific value of a unit of fossil fuel in combustion, which are collected from the average lower heating value of energies in China in Appendix IV of the China Energy Statistical Yearbook; C C i j t represents the carbon content in energy j, which is the coefficient of CO2 emissions specified in IPCC (2006) [87]; C O F i j t is the carbon oxidation factor of energy j, or the oxidation rate of a fossil fuel. CO2 contains 1 carbon atom and 2 oxygen atoms and has a molecular weight of 44 (C-12, O-16), in another word, the combustion of 1 ton of carbon in oxygen will produce 44/12 tons of CO2. Hence, C C i j t × COF ij t × 44 12 is the CO2 emissions per unit of net heating value of energy j, The 17 types of fossil fuels consumed by provinces in China include raw coal, clean coal, other washed coals, briquette, gangue, coke, coke oven gas, blast furnace gas, converter gas, other gases, other coking products, crude oil, gasoline, kerosene, diesel fuel, fuel oil, naphtha, lubricating oil, paraffin, mineral spirits, asphalt, petroleum coke, other petroleum products, liquefied petroleum gas, refinery gas and natural gas.
(2) Land resource misallocation (G). Due to limited data, most of the existing studies exploring land resource misallocation use the ratio of the assigned land by agreement to the total assigned land, and the ratio of supplied land for industry, mining and storage to the total assigned state-owned construction land to reflect the intensity of land resource misallocation (Li and Luo, 2017; Li et al., 2016) [27,88]. However, such ratios actually emphasize more on the different ways of assignment or the different structures of land, and fail to accurately reflect the essence of misallocation. Misallocation is, in essence, the deviation from the optimal value, which, if merely reflected by ratios, may result in spurious relationship in the empirical analysis, due to the control of land by agreement or industrial and mining land. To obtain the “optimal value” and the deviation, referring to the method proposed by Hsieh and Klenow (2009) [24], this paper measured land resource misallocation with marginal product. Classical microeconomic theory holds that factors can achieve the optimal allocation in a totally competitive market, at which point, the marginal product will be consistent with marginal costs and factor prices. In a fully competitive market, the marginal product of land can be represented by the optimal price when land resources are optimally allocated, and the deviation of the actual price from such optimal price can directly reflect the intensity of land market distortion and land resource misallocation. This paper uses Cobb–Douglas production function to measure the marginal product of land as follows:
ln Y ¯ i t = k ρ i , k U i t k + η i , 1 ln L ¯ i t + η i , 2 ln K ¯ i t + η i , 3 ln S i t + ξ i t
where, U i t reflects the technological progress of a city, and is represented by the percentage of employees in information technology, computer services and software industries, and scientific research and technical services in the total employees; Y ¯ i t is the value added of industry in a city, and is represented by the total output of the secondary industry; L ¯ i t is the labor in the industrial sector, which is represented the urban employees in the secondary industry. K ¯ i t refers to the capital stock in the industrial sector, which is calculated using the annual fixed asset investment of a city with the equation K ¯ i t = ( 1 ψ ) K ¯ i , t 1 + I t / w i , t , where ψ is the annual depreciation rate which is assumed as 5%, It is fixed asset investment, and ωi,t is the cumulative capital price of each city. Referring to the practice of Ke and Feser (2010) [89], this paper estimated the capital stock in the industrial sector with the current assets and net fixed assets of large industrial enterprises in each city. S is the area of industrial land of each city which is collected from the China Urban Construction Statistical Yearbook. η1~η3 are elasticity coefficients, and returns to scale are assumed to be constant, η i , 1 + η i , 2 + η i , 3 = 1 ; ξ i t is a stochastic error term. By transforming Equation (4), we obtained the following equation which can measure the elasticity coefficients of various factors:
ln Y ¯ i t L ¯ i t = ρ i U i t + η i , 2 ln K ¯ i t L ¯ i t + η i , 3 ln S i t L ¯ i t + ξ i t
By estimating Equation (5) using fixed effects model, the estimated value of η i , 1 , η i , 2 , η i , 3 can be obtained, which are η ^ i , 1 , η ^ i , 2 , η ^ i , 3 , respectively. Thus, we can further calculate the marginal output of the industrial land of each city as follows:
M P S = η ^ i , 3 Y ¯ S
where M P S is the marginal output of industrial land. r represents the price of industrial land. The ratio of the marginal output of industrial land to the price is:
G = M P S r
in which, if G is equal to 1, it means there is no misallocation of industrial land; if G is greater than 1, it means the due value of industrial land is greater than its actual price, or the land is underpriced, and the land resource is negatively misallocated. If G is less than 1, the due value of industrial land is less than its actual price, or the land is overpriced, and the land resource is positively misallocated. τ s represents the intensity of land resource misallocation, then:
G = M P S r = 1 + τ s
where τ s can measure the intensity of misallocation. If τ s is equal to 0, there is no misallocation, otherwise, there exists misallocation. Take the logarithm of Equation (8) ln G = ln ( 1 + τ s ) τ s , the estimation result of lnG reflects the impact of land resource misallocation.
The calculation of r is complicated. Since the published data does not reveal the complete price information of different types of land in prefecture-level and above cities, this paper uses web crawling to collect all the transaction data of commercial land, residential land and industrial land of 282 prefecture-level cities of China from 1 June 2005 to 31 December 2018 from the website of the Ministry of Land and Resources. These data detail relevant information of each land transaction, including the supply object, location and area of land, transaction price, land supply method, land use, etc. In August 2006, China’s State Council promulgated the “Notice of the State Council on issues related to strengthening land regulation”, which stipulates that the transfer of industrial land must adopt market-oriented methods such as bidding, auction and listing. More importantly, “the code for the transfer of state-owned land use rights by bidding, auction and listing (Trial)” issued by the Ministry of land and resources on 31 May 2006, clearly requires the land authorities of the municipal and county governments to publish the transfer plan of each state-owned land use right in advance on the China land market network online, and publish the transfer results of each land afterwards. Therefore, the land transaction data published on China land market website is complete and accurate. This paper adds up the area and price of assigned land which are supplied through tender, auction and listing, and obtained the average price (10,000 yuan/km2)5 of commercial land, residential land and industrial land after calculating the ratio of transaction price to the total area of assigned land. At last, this paper obtains the land resource misallocation of 282 prefecture-level cities with the annual price of industrial land through Equation (8).
(3) Other variables. Referring to the method proposed by Han and Ke (2013) [90], this paper calculated the foreign direct investment (Fdi) using perpetual inventory method, the fixed price takes the price of 2003 as benchmark and the depreciation rate is assumed as 5%. This paper uses the ratio of non-agricultural population to total population in a city to represent its urbanization level (Urban). Since the data of non-agricultural population is updated only to 2010 in the China City Statistical Yearbook, the data of the following years are made up according to that of the China Population and Employment Statistics Yearbook. Urban sprawl (Ru) is represented by the ratio of built-up area to the construction land, which is directly collected from the China City Statistical Yearbook. The population of the secondary sector can be measured using the labor in the industrial sector (L), which, to a large extent, reflects the development status of industry in the cities. Environmental regulation (λ) reflects a city’s emphasis on environmental pollution control, and is represented by the frequency of the word “environment” in the policy documents and work reports of the prefecture-level municipal government. In general, the higher the frequency, the more attention the local government pays to environmental pollution, the stronger the environmental regulation, and the greater the pressure faced by enterprises. The calculation of energy consumption (Energy) is complicated as well. Currently, the available statistics of energy mainly include natural gas, liquefied petroleum gas, and electricity, etc. As the China City Statistical Yearbook does not publish data on the consumption of industrial natural gas and liquefied petroleum gas, in order to minimize the loss of samples, this paper uses the total electricity consumption (10,000 kWh), the total supply of natural gas (10,000 m3) and liquefied petroleum gas (ton) of the whole society in the Yearbook to calculate the energy consumption of the whole society. The said consumption is converted into standard coal according to the “Conversion Factors from Physical Units to Coal Equivalent”6. At last, the standard coal consumption converted from natural gas, liquefied petroleum gas and electricity are added up. Traffic conditions (Trf) measured by road area per capita (m2/person) is directly collected from the China City Statistical Yearbook, which, to some extent, reflects the potential traffic pressure faced by the city and the possibility of traffic congestion. Table 1 shows the values of CO2 emissions, land resource misallocation and other variables in prefecture-level cities in China.

4. Results and Discussion

4.1. Benchmark Regression and Analysis

In order to test the impact of land resource misallocation on urban CO2 emissions, this paper tests the measurement model with appropriate estimation method in the first place. As the Hausman test rejects the null hypothesis of the random effects (RE) model at the 1% level, the fixed-effects (FE) model proves to be more appropriate for the panel data in this paper. Under the controlled fixed effects of city and year, this paper estimated the measurement model with cluster-robust standard errors at the city level. While using fixed effects model, this paper also conducts estimation using mixed effects model (OLS). The results of benchmark regression are shown in Table 2. Columns (1) and (3) shows the results of the OLS model and the fixed effects model, respectively, when no control variable is introduced. The results suggest that in both models, the coefficient of land resource misallocation (G) is significant at the 1% level, which preliminarily verifies the hypothesis that land resource misallocation exacerbates urban CO2 emissions pollution. Land resource misallocation as a result of the strategies of local government such as the supply of industrial land on a large scale at low prices, restricting the supply of high-priced residential land, significantly increases urban CO2 emissions by hindering the improvement of manufacturing structure and industrial structure, stifling technological innovation, and weakening the agglomeration effect. Columns (2) and (4) shows the estimation results after introducing control variables, which shows that the coefficient of land resource misallocation in the mixed effects model is positive, but insignificant, while in the fixed effects model, the coefficient of land resource misallocation is still significantly positive at the 1% level, and the degree of fitting has improved, suggesting that the fixed effect factors at the city level have obviously impacted CO2 emissions, and it is rational to control both the fixed effect of city and year. The result further confirms the conclusion that land resource misallocation can increase the level of urban CO2 emissions. For a long period of time, due to the local governments’ development model of making profit from land, urban construction land in many regions is widely used for industrial purposes at prices much lower than the market value or even at no price. A large number of low-efficiency industrial enterprises rushes into the city in order to obtain lease concessions rather than market efficiency, which hampers the improvement of green technology innovation and the agglomeration effect, and hinders the optimization of industrial structure for a long time, and exacerbated CO2 emissions. The elasticity coefficient of land resource misallocation on CO2 emissions is 0.0179, significantly positive at the 1% level, meaning that for every 10% increase in land resource misallocation, the CO2 emissions will increase by 0.179% on average. This requires that all regions should optimize the allocation of land resources, improve the assessment and competition mechanism of local governments, and correct the allocation bias of local governments in the treatment of CO2 emissions pollution, in order to lay a solid foundation for achieving low carbon, zero carbon and even negative carbon.
In terms of various control variables, the impact of labor in the industrial sector (lnL) is significantly positive, suggesting that the mode of driving industrial development through intensive use of labor in various regions has significantly exacerbated CO2 emissions pollution. The impact of energy consumption (lnEnergy) is also significantly positive, suggesting that energy consumption is still an important source of CO2 emissions pollution; road density (lnTrf) is estimated to be significantly positive as well, suggesting that the density of the roads in most cities is too high, there has been obvious congestion, which has caused the increased CO2 emissions in the cities; foreign direct investment (lnFdi) has also significantly driven CO2 emissions, suggesting that foreign direct investment will, to some extent, aggravate CO2 emission pollution; the impact of environmental regulation (lnλ) is also significantly positive, indicating that while environmental regulation has strengthened environmental governance, it will also increase the cost of pollution control and treatment of enterprises, thereby reducing the investment in technological research and development, which hampered the improvement of green innovation of enterprises or cities; the impact of urbanization level (lnUrban) is significantly positive, meaning industrial development boosting urbanization will exacerbate urban CO2 emissions; yet urban sprawl (lnRu) does not have any evident impact on CO2 emissions, suggesting that urban sprawl in China has been improved, urban expansion becomes more intensive and integrated, thus does not significantly increase CO2 emissions.

4.2. Robustness Test

4.2.1. Substitution of Core Explanatory Variables

In order to test the reliability of the result and compare the robustness of the impact of different indicators on CO2 emissions, this paper substitutes some core explanatory variables to examine the robustness of the results. Since the data of assigned industrial land of the prefecture-level cities is not provided in the China Land and Resources Statistical Yearbook, and only the data of assigned land by agreement is available, most of the existing research regards “assignment by agreement” as a synonym for “industrial land” and “low-price assignment” (Yang et al., 2014) [91]. This paper carries out the robustness test by substituting the indicator in Equation (8) with the per capita area of assigned land by agreement (Rjxycr). The larger the area of assigned land by agreement, the higher the ratio of industrial land and development zone to the total land, the more intense the misallocation of land resources in the cities. Moreover, drawing on the experience of Xie (2020) [92], this paper further testes the robustness by substituting the indicators measured by marginal output method with the ratio of supplied land for industry, mining and storage to the total land assigned (Gk1) and ratio of per capita area of supplied land for industry, mining and storage (Rjgk). The purpose of using these substituting indicators is to probe into the impact of land resource misallocation on CO2 emissions from the perspective of the huge amount of industrial land assigned or supplied. As the data of land for industry, mining and storage is only available from 2009 in the China Land and Resources Statistical Yearbook, the sample in this paper is from the year 2009 to 2018. The robustness test results are as shown in Table 3.
Column (1) in Table 3 shows that after substituting the indicator of Equation (8) with the ratio of per capita land by agreement (Rjxycr), the impact of land resource misallocation on CO2 emissions is significantly positive at the 1% level, indicating that the more the assigned land by agreement per capita, the more severe the misallocation of land resources, significantly increasing CO2 emissions in the cities. After using the ratio of land for industry, mining and storage to the total land assigned (lnGk1) or the ratio of supplied land for industry, mining and storage (Rjgk) to reflect land resource misallocation, the coefficients of land resource misallocation in Column (2) and (3) are still significantly positive, which shows that the empirical results of this paper do not depend on the specific form of the variables, and the substitution of the core explanatory variables will not have a fundamental impact on the robustness of the estimated results. In general, after substituting the indicator of Equation (8) with indicators such as per capita area of assigned land by agreement, per capita area of supplied land for industry, mining and storage and the ratio of land for industry, mining and storage, the conclusion that land resource misallocation has exacerbated CO2 emissions still stands, yet the effect of the impact measured using marginal output method is more significant. Thus, the land resource misallocation indicators measured using marginal output method adopted by this paper has obvious advantages in defining the connotation of variables and the estimation of effect.

4.2.2. Analysis after Winsorization and Truncation of Outliers

To eliminate the effect of outliers, this paper further carries out regression analysis after winsorizing and truncating the outliers. Column 1 and Column 2 in Table 4 show the result of urban CO2 emissions (P) at the 1% level after winsorization and truncation, respectively. Although the coefficient of land resource misallocation on urban CO2 emissions has changed, it is still significantly positive at the 0.01 level, which verifies the robustness of the result of benchmark regression, namely, land resource misallocation tremendously contributes to the increase in urban CO2 emissions.

4.2.3. Endogeneity Test

The endogeneity of the model in this paper mainly comes from two aspects. First, some variables may be missing. Although some core variables affecting CO2 emissions have been controlled in the model of this paper, there may exist some missing variables that not only affect CO2 emissions, but are also highly correlated with land misallocation indicators, causing endogeneity and biased estimations in the regression model. Second, there are reciprocal causal effects between some explanatory variables and explained variables. For example, land resource misallocation has impacted CO2 emissions in cities, yet the increased CO2 emissions will also have an impact on the local government’s environmental performance assessment, which in turn will affect the local government’s allocation of land resources in promoting economic development. To overcome the endogeneity and better estimate the impact of land resource misallocation, this paper uses the following two variables as instrumental variables to carry out two-stage least-squares (2SLS) test. The first instrumental variable is the interaction term between average slope and elevation of cities (Ygcpd). The reason for choosing this instrumental variable is that the geographic features such as terrain, slope and elevation are closely related to land use, but will not have a direct impact on CO2 emissions. Specifically, the elevation and slope of cities will directly affect the location selection of industrial parks, development zones and construction zones. Cities with higher elevation and greater slope will be less likely to be chosen for construction of industrial zones, and less land will be assigned for industrial purpose. Even if the industrial land is assigned at a low price or even no price, enterprises will not choose to invest and build factories in the area with high elevation and steep slope due to the consideration of development, construction, and transportation cost and risks of natural disasters. Natural and geographic factors such as elevation and terrain slope are strictly exogenous to the operation of economic system, and will not directly affect CO2 emissions, which meets the requirements of selecting instrumental variables. The second instrumental variable is the total supplied land for industry, mining and storage (Gk2). Drawing on the research by Xie (2020) [92] who studied the impact of land resource misallocation on the innovation capability of cities, this paper selects total supplied land for industry, mining and storage as an instrumental variable, since under the current land supply policy in China, the total land supplied of each city is strictly controlled and planned by the central and provincial governments. For a single city, the total supplied land for industry, mining and storage is exogenous, in addition, the total land supplied is closely related to the structure of land supply, thus meeting the requirements of instrumental variable. Table 5 shows the first-stage and second-stage results using the interaction term between average slope and elevation, and the total supplied land for industry, mining and storage as instrumental variable, respectively.
The 2SLS result in Table 5 shows that the interaction term between average slope and elevation (lnYgcpd) and the total area of supplied land for industry, mining and storage (lnGk2) are highly correlated with land resource misallocation (G) at the 1% level, where the statistic value of Wald F is 11.767, which is greater than the critical value 10.00 of Stock-Yogo weak ID test at the 10% level, there is no weak instrumental variable. In addition, the Sargan test result also accepts the null hypothesis that the instrumental variables are effective, thus, the instrumental variables selected in this paper are rational. The second-stage result in Column (2) also suggests that the misallocation of land resources with the basis toward industrial land has significantly increased CO2 emissions in the cities. To sum up, the estimation results after the controlling the endogeneity of explanatory variables are basically consistent with Table 2, which further verifies the robustness and reliability of the result of benchmark regression.

4.3. Mechanism Test

The theoretical analysis of this paper reveals that land resource misallocation will tremendously increase CO2 emissions by hindering industrial structure advancement and servitization of industrial structure, inhibiting technological innovation, and weakening the economic effect of industrial agglomeration. Thus, referring to the mediating effect test proposed by Hayes (2018) [93], this paper set up a mediation model to test these mechanisms. This paper uses manufacturing complexity (Gdh) of cities at prefecture level and above to measure industrial structure advancement, and uses the proportion of the tertiary industry in gross regional output (Tir) to measure servitization of industrial structure, and the number of green patent applications (Lsfmzl) and the number of green utility model applications (Lssyzl) to reflect green technology innovation of cities, and location quotient to reflect industrial agglomeration (Agg). Taking these variables as mediating variables, this paper sets up the mediation model to examine the impact mechanisms of land resource misallocation on CO2 emissions. Specifically, based on the approach of Zhou et al. (2016) [94], this paper used manufacturing complexity to reflect the industrial structure advancement of the cities. The paper calculated technological complexity of the manufacturing industry by averaging the technological complexity of HS 6-digit level products, and taking the proportion of each industry in the total manufacturing output as the weight, and finally obtained the city’s manufacturing complexity7 with the weight. The calculation of manufacturing complexity needs the data of industrial enterprises in China, and only the data up to 2013 are available in the database, this paper uses the sample from 2005–2013 for the mediating effect test. The proportion of the tertiary industry in gross regional output used to measure the servitization of industrial structure and the number of employees in the manufacturing sector used to measure location quotient come from the China City Statistical Yearbook over the years. The number of green patent applications and the number of green utility model applications are mainly collected and collated from the China National Intellectual Property Administration and Google Patent in accordance with the patent classification criteria published by the World Intellectual Property Office. As the use and application of green patent is zero in some cities, this paper takes the logarithm after adding 1 to the value. The mediation model is as follows:
ln P i t = Δ + θ 0 ln G i t + ϕ ν ν = 1 ϖ Z v , i t + ξ i t
T i t = Θ + θ ¯ 0 ln G i t + ϕ ν ν = 1 ϖ Z v , i t + ζ
ln P i t = Δ ¯ + θ ¯ ¯ 0 ln G i t + φ T i t + ϕ ν ν = 1 ϖ Z v , i t + ξ i t
where, Θ and Δ ¯ are constant terms, T represents various mediating variables, including servitization of industrial structure (Tir), industrial structure advancement (Gdh), industrial agglomeration (Agg), and the number of green patent applications (Lsfmzl) and the number of green utility model applications (Lssyzl) which can reflect green technology innovation of cities. Z is a control variable; ϖ is the number of control variables; ξ and ζ are random errors. Firstly, the paper measures the result of Equation (9) to test whether the impact of land resource misallocation on CO2 emissions is significantly negative, if yes, it will be treated as a mediating effect, if no, it will be treated as a suppression effect. Secondly, the paper carries out regression analysis with Equations (10) and (11) to examine whether both the impact coefficient θ ¯ 0 of land resource misallocation on mediating variable T in Equation (10) and the coefficient φ in Equation (11) are significant. If both coefficients are significant, the indirect effect is significant; if at least one coefficient is insignificant, Bootstrap will be used to verify the null hypothesis θ ¯ 0 φ = 0 , if the null hypothesis is rejected, the indirect effect is significant, otherwise, the indirect effect is insignificant. Thirdly, the significance of coefficient ( θ ¯ ¯ 0 ) is tested after various mechanism variables are introduced in Equation (11). If θ ¯ ¯ 0 is insignificant, there is only mediating effect and no direct effect; If θ ¯ ¯ 0 is significant, the direct effect is significant, where the fourth test must be carried out. Fourthly, we need to compare the sign of the product of θ ¯ 0 , φ and the sign of θ ¯ ¯ 0 , if the signs are the same, then there is partial mediating effect; if different, the effect is suppressor effect. The test results are as shown in Table 6 and Table 7.
The estimation results of Equation (9) in Table 6 show that the coefficient of land resource misallocation is significantly positive at the 0.01 level, indicating that the land resource misallocation caused by the biased allocation of urban construction land toward the industrial land has significantly driven CO2 emissions. When the mediating variable is servitization of industrial structure (lnTir), in Equation (10), the inhibitory effect of land resource misallocation on servitization of industrial structure is insignificant, and in Equation (11), servitization of industrial structure has a significant inhibitory effect on CO2 emissions at the 5% level. The Bootstrap method further reveals that, the test result rejects the null hypothesis θ ¯ 0 φ = 0 at the 5% level. Therefore, the indirect effect of land resource misallocation by hindering servitization of industrial structure is significant. In Equation (11), the impact of land resource misallocation on CO2 emissions is significantly positive at the 0.01 level, and the sign of the product term of θ ¯ 0 φ and θ ¯ ¯ 0 are the same, meaning there exists partial mediating effect, which verifies the mechanism that land resource misallocation exacerbated CO2 emissions by hindering servitization of industrial structure of the cities. When the mediating variable is industrial structure advancement (lnGdh), the coefficient of the impact in Equation (10) is significantly negative, indicating land resource misallocation has significantly hindered industrial structure advancement, and the impact coefficient of industrial structure advancement on CO2 emissions in Equation (11) is significantly negative, suggesting that industrial structure advancement can reduce CO2 emissions. Thus, land resource misallocation has a significant indirect impact on CO2 emissions by hampering industrial structure advancement. The impact coefficient of land resource misallocation on CO2 emissions in Equation (11) is significantly negative, indicating land resource misallocation has a direct effect on CO2 emissions. Furthermore, the sign of θ ¯ 0 φ and θ ¯ ¯ 0 are the same, suggesting that industrial structure advancement has a mediating effect in the impact of land resource misallocation. When the mediating variable is industrial agglomeration (lnAgg), the estimated parameter of land resource misallocation in Equation (10) is significantly negative at the 0.01 level, and the estimated parameter of industrial agglomeration in Equation (11) is significantly negative, indicating that land resource misallocation has a significant indirect effect on increasing CO2 emissions by hindering industrial agglomeration. In Equation (11), the parameter of land resource misallocation is significantly negative, suggesting that the direct effect of land resource misallocation on CO2 emissions is still significant. In addition, the sign of θ ¯ 0 φ and θ ¯ ¯ 0 are the same and are significant, suggesting there exists partial mediating effect, in another word, the biased allocation of land resources toward industrial purpose has compromised the industrial agglomeration effect, thus increasing CO2 emissions enormously.
Table 7 shows that when the mediating variable is the number of green patent applications (lnLsfmzl), the estimated parameter of land resource misallocation in Equation (10) is negative but insignificant, and the number of green patent applications in Equation (11) is significantly negative. By further using Bootstrap method, we found that the product term θ ¯ 0 φ is significant and not zero, suggesting land resource misallocation has a significant indirect effect on CO2 emissions by hindering green technology innovation of the cities. The impact of land resource misallocation on CO2 emissions in Equation (11) is positive, and the sign of θ ¯ 0 φ and θ ¯ ¯ 0 are the same, suggesting there exists partial mediating effect, i.e., green technology innovation has a significant mediating effect on the impact of land resource misallocation on exacerbating CO2 emissions, which verified the mechanism that land resource misallocation exacerbates CO2 emissions by inhibiting technological innovation. When the mediating variable is green utility model applications (lnLssyzl), the estimated parameter of land resource misallocation in Equation (10) is significantly positive, and the number of green patent applications in Equation (11) is significantly positive, indicating that there exists an indirect effect in the impact of land resource misallocation on CO2 emissions by affecting green technology innovation. The coefficient of the impact of land resource misallocation in Equation (11) is significantly positive, and the sign of product term θ ¯ 0 φ and θ ¯ ¯ 0 are the same, meaning green technology innovation, represented by green utility model applications, has a significant mediating effect in the impact of land resource misallocation on CO2 emissions.
It is not hard to tell from the above results that although various mediating variables have different mediating effects, they all have partial mediating effects on the impact of land resource allocation on CO2 emissions, which sufficiently verifies the mechanism that the biased allocation of land resources toward industrial sector has exacerbated CO2 emissions by cementing the rigidity of the industrial-based economic structure in various regions, hindering the upgrading of the industrial structure, inhibiting the improvement of innovation capabilities, and reducing the effect of economic agglomeration.

4.4. Further Analysis

4.4.1. Spatial Spillover Effect Test

In addition to affecting CO2 emissions of the city itself where land resources are misallocated, land resource misallocation may have significant spatial spillover effect as well. As an important environmental issue, CO2 emissions have obvious external features. Such external feature of CO2 emissions determines that aside from local impact, surrounding areas will also be affected by the spatial spillover effect of CO2 emissions. In addition, as a means of competition amongst local governments for economic development and fiscal revenue, land resource misallocation also brings about strategic interaction featured by competition and imitation. This feature leads to the continuous spread of the impact of land resource misallocation in space through the strategic interactions among local governments, resulting in a spatial spillover effect. Under the centralized political and decentralized economic system of China, in pursuit of revenue growth or promotion, competitions for GDP, social welfare, infrastructure investment, FDI, and talents are prevalent among local governments. In order to attract new domestic and foreign enterprises and create more jobs, local governments have resorted to various preferential policies such as low or zero land prices, lowering the quality of investment and environmental access and emission standards to attract investment, resulting in fierce competitions in industrial land assignment. Such strategic interaction not only leads to the booming of capital-intensive industries and heavy industries in various regions, but also causes industrial homogeneity and the distortions in resource allocation in various regions, which intensifies the competition of CO2 emissions among cities, and magnifies the spillover effect. To this end, this paper draws on the practice of Han et al. (2018) [66], and uses SDM to explore the spatial spillover effect of land resource misallocation on CO2 emissions by setting up a geographic distance weights matrix between cities, which can be expressed as W d = 1 / d i j , where dij is the distance between cities calculated using latitude and longitude data, and i ≠ j. Referring to the test adopted by Elhorst (2014) [95], this paper examined the spatial model with Lagrange multiplier (LM) and likelihood ratio (LR), and discovered that the SDM with spatio-temporal fixed effects is the optimal model. Since SDM contains many spatial interaction terms of explained variables, the estimation results of the explanatory variables cannot represent the marginal impact on CO2 emissions. It is necessary to further estimate the direct and indirect effects of land resource misallocation and other explanatory variables in SDM on CO2 emissions by using partial differential method based on the SDM. Direct effects can reflect the impact of explanatory variables such as land resource misallocation on the city’s CO2 emissions, including the spatial feedback effect, e.g., changes in the city’s factors will affect the CO2 emissions of adjacent cities, which in turn affects the city’s CO2 emissions, so on and so forth. Indirect effects represent the spatial impact of variables such as land resource misallocation in adjacent cities on the city’s CO2 emissions, or vice versa, reflecting the spatial spillover effect. The estimation results of the direct effect and spatial spillover effect of land resource misallocation on CO2 emissions are as shown in Table 8.
Table 8 shows that, land resource misallocation (lnG) not only significantly increases CO2 emissions of the city, but also significantly increases CO2 emissions of adjacent cities. For a long period of time, due to the local governments’ development model of making profit from land, urban construction land in many regions is widely used for industrial purposes at prices much lower than the market value or even at no price. A large number of low-efficiency industrial enterprises rushes into the city in order to obtain lease concessions rather than market efficiency, which hampers the technology innovation and stifles the agglomeration effect, and hinders the optimization of industrial structure, increases energy consumption and exacerbated CO2 emissions. The diffusion characteristic of CO2 emissions and the strategic interactions among local governments in the growth competition continuously pass the impact of land resource misallocation on CO2 emissions, resulting in a significant spatial spillover effect in a larger scope. Therefore, in the process of optimizing land resource allocation and strengthening the control of CO2 emissions, all regions should make overall plans and push forward with concerted efforts, improve the assessment and competition mechanism between local governments, and rectify the deviation of misallocation by local governments, and achieve joint control and regulation among regions.

4.4.2. Heterogeneity Analysis Based on Different City Levels

Due to the different levels and patterns of economic development, the modes and efficiencies of land resource allocation of cities at different levels vary a lot as well. In order to further explore the impact of land resource misallocation on CO2 emissions in cities of different sizes, this paper categorizes 282 sample cities across China according to their population of permanent residents. Specifically, according to the Notice of the State Council on Adjusting the Standards for Categorizing City Sizes released on November 21, 2014, cities in China are divided into four categories, namely, Type-I large cities and above cities (population over 3 million), Type-II large cities (population 1~3 million), medium-sized cities (population 0.5 million~1 million) and small cities (population less than 0.5 million). The purpose of classifying Type-I large cities and megacities into one category is that there are only few such cities in China and they basically serve the same functions in the development of city clusters or a certain region as central cities. The heterogeneous impacts of land resource misallocation on CO2 emissions in cities at different levels are as shown in Table 9.
Table 9 shows that the impacts of land resource misallocation on CO2 emissions are heterogeneous for cities at different levels. Generally speaking, cities of different sizes and levels are in fierce competition for growth driven by the pursuit of promotion and revenue, which lead to cities’ adoption of various land policies to attract investment and gain growth advantages, resulting in different impacts of land resource misallocation on CO2 emissions. The estimated parameters of Type-I large cities and above cities, Type-II large cities and medium-sized cities land resource misallocation are significantly positive at the 1%, 5% and 10% level, respectively, and the coefficients of land resource misallocation decrease progressively. While the coefficients of land resource misallocation of small cities have not passed the significance test, indicating that the smaller the city size, the weaker the impact of land resource misallocation. Furthermore, land resource misallocation significantly increases the CO2 emissions of medium-sized cities and above cities but has no significant impact on the CO2 emissions of small cities. Compared with small cities, medium-sized and above cities have more large-scale development zones and new districts, the biased allocation of construction land at low prices in these areas will inevitably result in more serious land resource misallocation and efficiency losses, thus, more likely to see increased CO2 emissions. On one hand, medium-sized cities and II-type large cities are the bonds connecting large cities and small cities in the urban system. Their agglomeration effect and attractiveness to enterprise investment are far less than Type-I large cities and above cities, yet much greater than small cities, thus becoming important carriers for the transfer of manufacturing industry and the development of industry. Local governments take advantage of the abundant construction land of medium-sized cities and Type-II large cities to provide preferential land policies for the transfer of manufacturing industries, thereby increasing CO2 emissions in the cities. On the other hand, under the possible bottom-up imitation mechanism of land allocation behaviors in which the cities at lower levels will imitate those at higher levels, the former will refer to the preferential land policies adopted by the latter in order to attract business investment, stimulate industrial development and economic growth, leading to the exacerbation of land resource misallocation and CO2 emissions of medium-sized cities and cities at above levels. Meanwhile, due to the limited market size and low agglomeration effect of small cities, it is difficult for small cities to undertake large-scale manufacturing transfer even with more favorable land policies. Therefore, the impact of land resource in small cities is not significant.

4.4.3. Heterogeneity Analysis Based on Different Regions

In China, different regional land allocation and carbon emissions will face different constraints, we further divided the samples of 282 cities across the country into three aspects: the East, the middle and the west, and analyzed the regional heterogeneity of the impact of land resource misallocation on carbon emissions in this section. The estimated results are shown in Table 10.
Table 10 shows that, the coefficients of land resource misallocation on carbon emissions in the eastern and central regions are significantly positive, but the impact on the western region is not significant. This shows that the biased allocation of land resources in the industrial field has significantly increased the carbon emissions in the eastern and central regions, but has no significant impact on the carbon emissions in the western region. Compared with the western region, the eastern and central regions of China have more development zones and industrial parks, and the degree and quantity of biased allocation of urban construction land in the industrial field are more obvious, which has a more significant role in promoting carbon emissions. However, the level of economic development in the western region is relatively backward, and the degree and quantity of biased allocation of urban construction land in the industrial field are low, so the impact on carbon emissions is not obvious.

4.5. Policy Suggestions

In conclusion, this paper comes up with the policy suggestions as follows. First, land supply behaviors of local governments are the fundamental cause of land resource misallocation, and political promotion and fiscal revenue are the main drivers for local governments’ allocation of land for industrial use in the process of economic growth. Therefore, on one hand, it is necessary to strengthen and improve the performance evaluation system of local governments, increase the proportion of multiple evaluation indicators that can reflect the quality of economic development, such as environmental quality, upgrade of growth drivers, and structural adjustment, and change the existing GDP-oriented performance evaluation system, so as to guide the government to value the quality of urban development and long-term economic development, and reverse the policy and tendency of local governments where land resources are over-allocated for industrial use in order to promote short-term economic growth. On the other hand, it is necessary to push the tax-sharing reform, so that local governments can obtain the fiscal revenue that matches their powers, and change the situation that local governments supply industrial land at a low price due to over-reliance on revenue from land by appropriately easing the financial pressure of local governments.
Second, further advance the market-based allocation of land factors, invigorate land factor market, break the monopoly of local governments in land supply, and enable the market to play a fundamental role in the allocation of land resources. Give full play to the synergy effect led by the market and guided by the government, so that urban construction land can be optimally allocated among different industrial types and purposes according to the principle of efficiency, and all types of land can obtain due benefits in economic development, and land prices can return to a reasonable range.
Third, the conclusion shows that land resource misallocation will not only aggravate the CO2 emissions of the city, but also tremendously increase CO2 emissions of surrounding cities, such spatial spillover effect may be subject to the spatial diffusion characteristics of CO2 emissions, or the strategic interaction of local governments in terms of land use due to growth competition. Hence, in order to effectively control and treat CO2 emissions and substantially promote environmental and air quality, all regions need to make efforts on the following two fronts: on the one hand, strive to build a productive interaction and cooperation mechanism among the regions, and strengthen the joint prevention and control of CO2 emissions; on the other hand, reduce the low-quality homogeneous competition in land investment, follow the laws of industrial development and market principles, scientifically identify and fully tap local comparative advantages, and introduce industries that best fit local conditions and development stages by creating a sound business environment, encourage regions to develop competitiveness with heterogenous structures, distinct characteristics, close ties, and economies of scale, thus, alleviating the spatial misallocation of land resources, blocking the transmission of land resource misallocation in various regions due to the imitation and demonstration effect, and reducing the diffusion scale and intensity of CO2 emissions.
Fourth, Due to the different effects of land resource misallocation on different types of cities, differentiated optimal allocation methods and CO2 emissions control strategies should be adopted for different types of cities. For Type-I large cities and above cities, since land resource misallocation has the strongest impact on CO2 emissions, correcting land resource misallocation and promoting effective and rational allocation of construction land according to market principles may contribute to the overall reduction of CO2 emissions. Focus on the market-oriented reform of land factors in these cities, and strengthen the government’s guidance and supervision on the use of construction land, and promptly rectify all land allocation behaviors that are not compliant with market efficiency, so that construction land can be effectively and fully utilized under market leadership and government guidance. For Type-II large cities, land resource misallocation has significantly increased CO2 emissions, and they are the important bonds between Type-I large cities and above cities on one hand, and medium-sized cities and small cities on the other, Therefore, while advancing the marketization of urban construction land assignment, it is also necessary to further strengthen their economic ties with Type-I large cities and above cities, medium-sized cities and small cities, and maximize the scale economy effect and technology spillover effect in the process of urban agglomeration, give full play to the structural upgrading, technological innovation and agglomeration economy brought about by the market-oriented allocation among cities of different scales and levels, thereby promoting the transformation of economic development patterns, strengthening CO2 emissions control, and reducing CO2 emissions pollution. Medium-sized cities, as important carriers for undertaking the transfer of manufacturing and developing the industry, shall reverse the tendency of developing manufacturing industries by relying excessively heavily on preferential land policies, and further explore the comparative advantages and agglomeration advantages of the cities while increasing the proportion of land supply that complies with market rules, undertake and develop manufacturing industries according to local advantages, realize structural adjustment, magnify agglomeration effect, thereby reducing the impact of land resource misallocation on CO2 emissions. For small cities, due to their limited market size and insufficient infrastructure, they do not enjoy advantages in undertaking large-scale projects and manufacturing, thus, the impact of land resource misallocation on CO2 emissions is not obvious, which means there may be no obvious misallocation in small cities. Such cities should strive to cultivate and develop specialized industries with their comparative advantages, and rationally allocate land according to the needs of the specialized industries so as to realize the productive interaction and coordinated development of industrial development and land supply.

5. Conclusions

Stimulated by financial profit and political promotion, local governments use their monopoly on the land market to attract investment through favorable land prices, and allocate a considerable amount of construction land to industrial purposes, which, although propels the rapid local economic growth and increases fiscal revenue in the short term, has brought enormous pressure on the ecological environment. This paper collects land market transaction data using web crawling and calculates land resource misallocation indicators of prefecture-level cities using the marginal output method based on production function, and obtains the CO2 emissions of prefecture-level cities based on the nighttime light data and terrestrial primary productivity provided by satellite images, and further explores the impacts and mechanisms of land resource misallocation on CO2 emissions with the panel data of prefecture-level cities. To sum up, the results show that, firstly, the biased allocation of urban construction land toward industrial use severely underprices the industrial land, which leads to the misallocation in which the due price of urban construction land should be higher than the actual price. Secondly, land resource misallocation has significantly increased urban CO2 emissions. This conclusion still stands after substituting measurement indicators and taking into account the issues of outliers and endogeneity. Thirdly, land resource misallocation has increased CO2 emissions through mechanisms such as cementing the rigidity of the industrial-based economic structure, hindering the upgrading of the industrial structure, inhibiting green innovation capabilities of the cities and reducing the effect of economic agglomeration, etc. Fourthly, the impact of land resource misallocation on CO2 emissions has spatial spillover effect, namely, land resource misallocation does not only exacerbate the CO2 emissions of the city, but also increases the CO2 emissions of its adjacent cities. Finally, the impacts of land resource misallocation on different cities are heterogeneous. Driven by the pursuit of promotion and fiscal revenue, cities at different levels and regions have seen distinct heterogeneous impacts of land resource misallocation on CO2 emissions. Land resource misallocation has significantly increased CO2 emissions in Type-I large cities and above cities, Type-II large cities and medium-sized cities, and the larger the size of city, the greater the impact. Yet, land resource misallocation does not have an obvious impact on small cities. Regionally, the land misallocation on carbon emissions has significantly increased the carbon emissions in the eastern and central regions but has no significant impact on the carbon emissions in the western region.

Author Contributions

Conceptualization, F.H.; methodology, F.H. and M.H.; formal analysis, writing—original draft preparation, F.H. and M.H.; data curation, F.H.; writing—review and editing, F.H. and M.H.; supervision, F.H.; project administration, F.H.; funding acquisition, F.H. All authors have read and agreed to the published version of the manuscript.

Funding

This research was funded by the National Natural Science Foundation of China (72073071).

Institutional Review Board Statement

Not applicable.

Informed Consent Statement

Not applicable.

Data Availability Statement

Publicly available datasets were analyzed in this study. And the land transaction data that support the findings of this study are available from the China Land Market Network (https://www.landchina.com/#/ accessed on 17 June 2022).

Conflicts of Interest

The authors declare no conflict of interest.

Notes

1
National Centers for Environmental Information https://ngdc.noaa.gov/eog/download.html (accessed on 17 June 2022).
2
National Centers for Environmental Information https://ngdc.noaa.gov/eog/download.html (2006) (accessed on 17 June 2022).
3
Running, S. et al. MOD17A3 MODIS/Terra Net Primary Production Yearly L4 Global 1km SIN Grid V055. NASA EOSDIS Land Processes DAAC https://lpdaac.usgs.gov/products/mod17a3v055/ (2011) (accessed on 17 June 2022).
4
All results in this paper are generated using MATLAB (R2017b) and Arc GIS (10.5).
5
The transaction land area used to calculate the price of industrial land r is different from the area of industrial land S in Equation (4), where, S is the stock of industrial land, used to measure the marginal output of industrial land, which serves for the same purpose as the capital stock in the product function. while the area of transacted land obtained using crawler is the flow, which is used to measure the actual transaction price of land in each city.
6
The factors for converting natural gas, liquefied petroleum gas and electricity into standard coal are1.3300kg standard coal/m3, 1.7143kg standard coal/kg, and 0.1229kg standard coal/kWh, respectively.
7
Manufacturing complexity at the city level: G dh i t = ln ( m O u t p u t m i t m O u t p u t m i t × p r o d y m t ) , where p r o d y k , t is the technological complexity of industry m in the year t, which is the simple average of the technological complexity of HS 6-digit level products of the industry m in the year t; O u t p u t m i t is the total industrial output value of the manufacturing industry m of city i in year t. The technological complexity of HS 6-digit level product k in the year t is prody k , t = n ( Export n k , t / Export n , t ) × Y n , t n ( Export n k , t / Export n , t ) , where, Export n k , t / Export n , t is the proportion of exports of product k of country n to the country’s total exports in the year t, Y n , t refers to the GDP of country in the year t.

References

  1. Mi, Z.; Wei, Y.M.; Wang, B.; Meng, J.; Liu, Z.; Shan, Y.; Liu, J.; Guan, D. Socioeconomic impact assessment of China’s CO2 emissions peak prior to 2030. J. Clean. Prod. 2017, 142, 2227–2236. [Google Scholar] [CrossRef] [Green Version]
  2. Wei, W.; Zhang, M. The non-linear impact of industrial structure on CO2 emissions in China. Appl. Econ. Lett. 2020, 27, 576–579. [Google Scholar] [CrossRef]
  3. Xiao, H.; Zhou, Y.; Zhang, N.; Wang, D.; Shan, Y.; Ren, J. CO2 emission reduction potential in China from combined effects of structural adjustment of economy and efficiency improvement. Resour. Conserv. Recycl. 2021, 174, 105760. [Google Scholar] [CrossRef]
  4. Okushima, S.; Tamura, M. What causes the change in energy demand in the economy?: The role of technological change. Energy Econ. 2010, 32, S41–S46. [Google Scholar] [CrossRef] [Green Version]
  5. Zhao, M.; Sun, T.; Feng, Q. Capital allocation efficiency, technological innovation and vehicle carbon emissions: Evidence from a panel threshold model of Chinese new energy vehicles enterprises. Sci. Total Environ. 2021, 784, 147104. [Google Scholar] [CrossRef]
  6. Lin, B.; Li, J. Transformation of China’s energy structure under the constraints of environmental governance: An analysis based on coal and carbon dioxide peaks. China Soc. Sci. 2015, 9, 84–107. [Google Scholar]
  7. Andersson, F.N.; Karpestam, P. CO2 emissions and economic activity: Short-and long-run economic determinants of scale, energy intensity and carbon intensity. Energy Policy 2013, 61, 1285–1294. [Google Scholar] [CrossRef]
  8. Yin, J.; Ding, Q.; Fan, X. Direct and indirect contributions of energy consumption structure to carbon emission intensity. Int. J. Energy Sect. Manag. 2021, 15, 665–677. [Google Scholar] [CrossRef]
  9. Zhang, C.; Chen, P. Industrialization, urbanization, and carbon emission efficiency of Yangtze River Economic Belt—empirical analysis based on stochastic frontier model. Environ. Sci. Pollut. Res. 2021, 28, 66914–66929. [Google Scholar] [CrossRef]
  10. Zhang, W.; Xu, H. Effects of land urbanization and land finance on carbon emissions: A panel data analysis for Chinese provinces. Land Use Policy 2017, 63, 493–500. [Google Scholar] [CrossRef] [Green Version]
  11. Hachem, M.; Saleh, N.; Bensefa-Colas, L.; Momas, I. Determinants of ultrafine particles, black carbon, nitrogen dioxide, and carbon monoxide concentrations inside vehicles in the Paris area: PUF-TAXI study. Indoor Air 2021, 31, 848–859. [Google Scholar] [CrossRef]
  12. Xie, R.; Wei, D.; Han, F.; Lu, Y.; Fang, J.; Liu, Y.; Wang, J. The effect of traffic density on smog pollution: Evidence from Chinese cities. J. Technol. Forecast. Soc. Chang. 2019, 144, 421–427. [Google Scholar] [CrossRef]
  13. Zhang, Z.; Hewings, G.J. The effects of direct trade within China on regional and national CO2 emissions. Energy Econ. 2014, 46, 161–175. [Google Scholar] [CrossRef]
  14. Dou, Y.; Zhao, J.; Malik, M.N.; Dong, K. Assessing the impact of trade openness on CO2 emissions: Evidence from China-Japan-ROK FTA countries. J. Environ. Manag. 2021, 296, 113241. [Google Scholar] [CrossRef]
  15. Song, W.; Mao, H.; Han, X. The two-sided effects of foreign direct investment on carbon emissions performance in China. Sci. Total Environ. 2021, 791, 148331. [Google Scholar] [CrossRef] [PubMed]
  16. Zhang, Y. Structural decomposition analysis of sources of decarbonizing economic development in China; 1992–2006. Ecol. Econ. 2009, 68, 2399–2405. [Google Scholar] [CrossRef]
  17. Qu, S.; Liang, S.; Xu, M. CO2 emissions embodied in interprovincial electricity transmissions in China. Environ. Sci. Technol. 2017, 51, 10893–10902. [Google Scholar] [CrossRef]
  18. Yang, Y.; Yang, X.; Tang, D. Environmental regulations, Chinese-style fiscal decentralization, and carbon emissions: From the perspective of moderating effect. Stoch. Environ. Res. Risk Assess. 2021, 35, 1985–1998. [Google Scholar] [CrossRef]
  19. Du, J.; Sun, Y. The nonlinear impact of fiscal decentralization on carbon emissions: From the perspective of biased technological progress. Environ. Sci. Pollut. Res. 2021, 28, 29890–29899. [Google Scholar] [CrossRef] [PubMed]
  20. Shan, S.; Ahmad, M.; Tan, Z.; Adebayo, T.S.; Li, R.Y.M.; Kirikkaleli, D. The role of energy prices and non-linear fiscal decentralization in limiting carbon emissions: Tracking environmental sustainability. Energy 2021, 234, 121243. [Google Scholar] [CrossRef]
  21. Safi, A.; Chen, Y.; Wahab, S.; Zheng, L.; Rjoub, H. Does environmental taxes achieve the carbon neutrality target of G7 economies? Evaluating the importance of environmental R&D. J. Environ. Manag. 2021, 293, 112908. [Google Scholar] [CrossRef]
  22. Tan, H. The Spatial Agglomeration of Producer Services and Manufacturing Industry: A Study Based on Trade Costs. World Econ. 2015, 38, 171–192. [Google Scholar]
  23. Atkinson, S.E.; Cornwell, C. Parametric estimation of technical and allocative inefficiency with panel data. Int. Econ. Rev. 1994, 35, 231–243. [Google Scholar] [CrossRef]
  24. Hsieh, C.T.; Klenow, P.J. Misallocation and manufacturing TFP in China and India. Q. J. Econ. 2009, 124, 1403–1448. [Google Scholar] [CrossRef] [Green Version]
  25. Zhang, J.; Yu, X. Path Analysis of the Impact of Land Resource Allocation System and Supply Mode on Real Estate Market. China Soft Sci. 2011, 5, 29–36. [Google Scholar] [CrossRef]
  26. McMillan, J.; Whalley, J.; Zhu, L. The impact of China’s economic reforms on agricultural productivity growth. J. Political Econ. 1989, 97, 781–807. [Google Scholar] [CrossRef]
  27. Li, Y.; Luo, H. Is the mismatch of land resources hindering the upgrading of industrial structure? Empirical Evidence from 35 Large and Medium Cities in China. Financ. Econ. Res. 2017, 9, 110–121. [Google Scholar] [CrossRef]
  28. Restuccia, D.; Rogerson, R. Policy distortions and aggregate productivity with heterogeneous establishments. Rev. Econ. Dyn. 2008, 11, 707–720. [Google Scholar] [CrossRef]
  29. Huang, Z.; Du, X. Government intervention and land misallocation: Evidence from China. Cities 2017, 60, 323–332. [Google Scholar] [CrossRef]
  30. Tan, H.; Zheng, J. The mystery of coexistence of rapid economic growth and lag of service industry in China–based on the perspective of sector TFP. China Ind. Econ. 2012, 9, 5–17. [Google Scholar] [CrossRef]
  31. Wang, D.; Ren, C.; Zhou, T. Understanding the impact of land finance on industrial structure change in China: Insights from a spatial econometric analysis. Land Use Policy 2021, 103, 105323. [Google Scholar] [CrossRef]
  32. Chen, B.; Yao, Y. The cursed virtue: Government infrastructural investment and household consumption in Chinese provinces. Oxf. Bull. Econ. Stat. 2011, 73, 856–877. [Google Scholar] [CrossRef]
  33. Liu, J.; Jiang, Z.; Chen, W. Land misallocation and urban air quality in China. Environ. Sci. Pollut. Res. 2021, 28, 58387–58404. [Google Scholar] [CrossRef] [PubMed]
  34. Ulph, A. Harmonization and optimal environmental policy in a federal system with asymmetric information. J. Environ. Econ. Manag. 2000, 39, 224–241. [Google Scholar] [CrossRef]
  35. Fredriksson, P.G.; List, J.A.; Millimet, D.L. Bureaucratic corruption, environmental policy and inbound US FDI: Theory and evidence. J. Public Econ. 2003, 87, 1407–1430. [Google Scholar] [CrossRef] [Green Version]
  36. Clark, D.E.; Hunter, W.J. The impact of economic opportunity, amenities and fiscal factors on age-specific migration rates. J. Reg. Sci. 1992, 32, 349–365. [Google Scholar] [CrossRef]
  37. Dustmann, C.; Okatenko, A. Out-migration, wealth constraints, and the quality of local amenities. J. Dev. Econ. 2014, 110, 52–63. [Google Scholar] [CrossRef] [Green Version]
  38. Hanson, G.H.; Slaughter, M.J. The Rybczynski Theorem, Factor-Price Equalization, and Immigration: Evidence from US States; NBER Working Paper No. 7074; National Bureau of Economic Research: Cambridge, England, 1999; Available online: https://www.nber.org/papers/w7074 (accessed on 17 June 2022).
  39. Du, J.; Peiser, R.B. Land supply, pricing and local governments’ land hoarding in China. Reg. Sci. Urban. Econ. 2014, 48, 180–189. [Google Scholar] [CrossRef]
  40. Cai, F.; Wang, M.; Qu, Y. China’s Industrial Reconfiguration and Labor Mobility Trends. China Ind. Econ. 2009, 8, 5–16. [Google Scholar] [CrossRef]
  41. Qu, F.; Tan, R. Sustainable Governance of Non-Agricultural Land in China, 1st ed.; Science Press: Beijing, China, 2010; pp. 4–13. [Google Scholar]
  42. Duan, W.; Liu, D.; Pi, Y. The Formation Mechanism of Modern Service Industry Agglomeration: Theoretical and Empirical Analysis from a Spatial Perspective. World Econ. 2016, 3, 144–165. [Google Scholar]
  43. Liu, Y.; Xia, J.; Li, Y. Producer Service Industry Agglomeration and Manufacturing Upgrade. China Ind. Econ. 2017, 7, 24–42. [Google Scholar] [CrossRef]
  44. Gaulier, G.; Lemoine, F.; Ünal-Kesenci, D. China’s integration in East Asia: Production sharing, FDI & high-tech trade. Econ. Chang. Restruct. 2007, 40, 27–63. [Google Scholar] [CrossRef]
  45. Ke, S.; He, M.; Yuan, C. Synergy and co-agglomeration of producer services and manufacturing: A panel data analysis of Chinese cities. Reg. Stud. 2014, 48, 1829–1841. [Google Scholar] [CrossRef]
  46. Preissl, B. The German Service Gap Or: Re-Organising The Manufacturing—Services Puzzle. Metroeconomica 2007, 58, 457–478. [Google Scholar] [CrossRef]
  47. Francois, J.; Hoekman, B. Services trade and policy. J. Econ. Lit. 2010, 48, 642–692. [Google Scholar] [CrossRef] [Green Version]
  48. Goe, W.R. Factors associated with the development of nonmetropolitan growth nodes in producer services industries, 1980–1990. Rural. Sociol. 2002, 67, 416–441. [Google Scholar] [CrossRef]
  49. Chen, T.; Kung, J.S. Do land revenue windfalls create a political resource curse? Evidence from China. J. Dev. Econ. 2016, 123, 86–106. [Google Scholar] [CrossRef]
  50. Zhong, T.; Zhang, X.; Huang, X.; Liu, F. Blessing or curse? Impact of land finance on rural public infrastructure development. Land Use Policy 2019, 85, 130–141. [Google Scholar] [CrossRef]
  51. Huang, D.; Chan, R.C. On ‘Land Finance’ in urban China: Theory and practice. Habitat Int. 2018, 75, 96–104. [Google Scholar] [CrossRef]
  52. Braun, E.; Wield, D. Regulation as a means for the social control of technology. Technol. Anal. Strateg. Manag. 1994, 6, 259–272. [Google Scholar] [CrossRef]
  53. Gu, W.; Zhao, X.; Yan, X.; Wang, C.; Li, Q. Energy technological progress, energy consumption, and CO2 emissions: Empirical evidence from China. J. Clean. Prod. 2019, 236, 117666. [Google Scholar] [CrossRef]
  54. Holmstrom, B.; Milgrom, P. Multitask principal-agent analyses: Incentive contracts, asset ownership, and job design. J. Law Econ. Organ. 1991, 7, 24–52. [Google Scholar] [CrossRef] [Green Version]
  55. Gao, X.; Wang, S.; Ahmad, F.; Chandio, A.A.; Ahmad, M.; Xue, D. The nexus between misallocation of land resources and green technological innovation: A novel investigation of Chinese cities. Clean Technol. Environ. Policy 2021, 23, 2101–2115. [Google Scholar] [CrossRef]
  56. Wu, Y.; Zhang, X.; Skitmore, M.; Song, Y.; Hui, E.C. Industrial land price and its impact on urban growth: A Chinese case study. Land Use Policy 2014, 36, 199–209. [Google Scholar] [CrossRef] [Green Version]
  57. Restuccia, D.; Santaeulalia-Llopis, R. Land Misallocation and Productivity; NBER working paper, No.w23128; National Bureau of Economic Research: Cambridge, England, 2017; Available online: https://papers.ssrn.com/sol3/papers.cfm?abstract_id=2912101 (accessed on 17 June 2022).
  58. Adamopoulos, T.; Brandt, L.; Leight, J.; Restuccia, D. Misallocation, selection, and productivity: A quantitative analysis with panel data from china. Econometrica 2022, 90, 1261–1282. [Google Scholar] [CrossRef]
  59. Jefferson, G.H.; Huamao, B.; Xiaojing, G.; Xiaoyun, Y. R&D performance in Chinese industry. Econ. Innov. New Technol. 2006, 15, 345–366. [Google Scholar] [CrossRef]
  60. Zhang, J.; Zhang, D.; Huang, L.; Wen, H.; Zhao, G.; Zhan, D. Spatial distribution and influential factors of industrial land productivity in China’s rapid urbanization. J. Clean. Prod. 2019, 234, 1287–1295. [Google Scholar] [CrossRef]
  61. Acemoglu, D.; Moscona, J.; Robinson, J.A. State capacity and American technology: Evidence from the nineteenth century. Am. Econ. Rev. 2016, 106, 61–67. [Google Scholar] [CrossRef] [Green Version]
  62. Marshall, A. Principles of Economics: An Introductory Volume, 8th ed.; Palgrave Macmillan: London, UK, 1961; p. 731. [Google Scholar]
  63. Glaeser, E.L.; Kallal, H.D.; Scheinkman, J.A.; Shleifer, A. Growth in cities. J. Political Econ. 1992, 100, 1126–1152. [Google Scholar] [CrossRef]
  64. Lu, M.; Feng, H. Agglomeration and Emission Reduction: An Empirical Study on the Impact of Urban Size Disparity on Industrial Pollution Intensity. World Econ. 2014, 7, 86–114. [Google Scholar]
  65. Krugman, P. Space: The final frontier. J. Econ. Perspect. 1998, 12, 161–174. [Google Scholar] [CrossRef]
  66. Han, F.; Xie, R.; Fang, J.; Liu, Y. The effects of urban agglomeration economies on carbon emissions: Evidence from Chinese cities. J. Clean. Prod. 2018, 172, 1096–1110. [Google Scholar] [CrossRef]
  67. Hong, Y.; Lyu, X.; Chen, Y.; Li, W. Industrial agglomeration externalities, local governments’ competition and environmental pollution: Evidence from Chinese prefecture-level cities. J. Clean. Prod. 2020, 277, 123455. [Google Scholar] [CrossRef]
  68. Brakman, S.; Garretsen, H.; Van Marrewijk, C. Locational Competition and Agglomeration: The Role of Government Spending; CESifo Working Paper No. 775; Center for Economic Studies and Ifo Institute: Munich, Germany, 2002; Available online: https://ssrn.com/abstract=346301 (accessed on 17 June 2022).
  69. Liu, S.; Zhu, Y.; Wang, W.; Pei, Y.; Du, K. The environmental pollution effects of industrial agglomeration: A spatial econometric analysis based on Chinese city data. Int. J. Agric. Environ. Inf. Syst. 2019, 10, 14–29. [Google Scholar] [CrossRef] [Green Version]
  70. Schwarze, R. The role of common law in environmental policy: Comment. Public Choice 1996, 89, 201–205. [Google Scholar] [CrossRef]
  71. Esty, D.C.; Dua, A. Sustaining the Asia Pacific Miracle: Environmental Protection and Economic Integration; Peterson Institute for International Economics No. 37; Peterson Institute Press: Washington, DC, USA, 1997; Available online: https://ideas.repec.org/b/iie/ppress/37.html (accessed on 17 June 2022).
  72. Wilson, J.D. Theories of tax competition. Natl. Tax J. 1999, 52, 269–304. [Google Scholar] [CrossRef]
  73. Ren, W.; Zhong, Y.; Meligrana, J.; Anderson, B.; Watt, W.E.; Chen, J.; Leung, H.L. Urbanization, land use, and water quality in Shanghai: 1947–1996. Environ. Int. 2003, 29, 649–659. [Google Scholar] [CrossRef]
  74. Verhoef, E.T.; Nijkamp, P. Externalities in urban sustainability: Environmental versus localization-type agglomeration externalities in a general spatial equilibrium model of a single-sector monocentric industrial city. Ecol. Econ. 2002, 40, 157–179. [Google Scholar] [CrossRef] [Green Version]
  75. Shi, B.; Shen, K.R. The government intervention, the economic agglomeration and the energy efficiency. Manag. World 2013, 10, 6–18. [Google Scholar] [CrossRef]
  76. Wu, L.; Sun, L.; Qi, P.; Ren, X.; Sun, X. Energy endowment, industrial structure upgrading, and CO2 emissions in China: Revisiting resource curse in the context of carbon emissions. Resour. Policy 2021, 74, 102329. [Google Scholar] [CrossRef]
  77. Wang, W.Z.; Liu, L.C.; Liao, H.; Wei, Y.M. Impacts of urbanization on carbon emissions: An empirical analysis from OECD countries. Energy Policy 2021, 151, 112171. [Google Scholar] [CrossRef]
  78. Liu, C.; Wang, X.; Lai, F.; Huang, Y. Empirical study on carbon emission measurement and influencing factors of urban traffic based on “Population-Economy-Environment”. IOP Conf. Ser. Earth Environ. Sci. 2020, 601, 012049. [Google Scholar] [CrossRef]
  79. Guan, Y.; Shan, Y.; Huang, Q.; Chen, H.; Wang, D.; Hubacek, K. Assessment to China’s recent emission pattern shifts. Earth’s Future. 2021, 9, e2021EF002241. [Google Scholar] [CrossRef]
  80. Shan, Y.; Guan, D.; Zheng, H.; Ou, J.; Li, Y.; Meng, J.; Zhang, Q. China CO2 emission accounts 1997–2015. Sci. Data 2018, 5, 1–14. [Google Scholar] [CrossRef] [PubMed] [Green Version]
  81. Shan, Y.; Huang, Q.; Guan, D.; Hubacek, K. China CO2 emission accounts 2016–2017. Sci. Data 2020, 7, 1–9. [Google Scholar] [CrossRef] [Green Version]
  82. Chen, J.; Gao, M.; Cheng, S.; Hou, W.; Song, M.; Liu, X.; Shan, Y. County-level CO2 emissions and sequestration in China during 1997–2017. Sci. Data 2020, 7, 1–12. [Google Scholar] [CrossRef]
  83. Chen, J.; Fan, W.; Li, D.; Liu, X.; Song, M. Driving factors of global carbon footprint pressure: Based on vegetation carbon sequestration. Appl. Energy 2020, 267, 114914. [Google Scholar] [CrossRef]
  84. Meng, L.; Graus, W.; Worrell, E.; Huang, B. Estimating CO2 (carbon dioxide) emissions at urban scales by DMSP/OLS (Defense Meteorological Satellite Program’s Operational Linescan System) nighttime light imagery: Methodological challenges and a case study for China. Energy 2014, 71, 468–478. [Google Scholar] [CrossRef]
  85. Su, Y.; Chen, X.; Li, Y.; Liao, J.; Ye, Y.; Zhang, H.; Kuang, Y. China’s 19-year city-level carbon emissions of energy consumptions, driving forces and regionalized mitigation guidelines. Renew. Sustain. Energy Rev. 2014, 35, 231–243. [Google Scholar] [CrossRef]
  86. Yang, D.; Luan, W.; Qiao, L.; Pratama, M. Modeling and spatio-temporal analysis of city-level carbon emissions based on nighttime light satellite imagery. Appl. Energy 2020, 268, 114696. [Google Scholar] [CrossRef]
  87. IPCC. Summary for policymakers. In Climate Change: The Physical Science Basis; IPCC: Geneva, Switzerland, 2007. [Google Scholar]
  88. Li, L.; Huang, P.; Ma, G. Land Resource Misallocation and Productivity Differences of Chinese Industrial Enterprises. Manag. World 2016, 8, 86–96. [Google Scholar] [CrossRef]
  89. Ke, S.; Feser, E. Count on the growth pole strategy for regional economic growth? Spread–backwash effects in Greater Central China. Reg. Stud. 2010, 44, 1131–1147. [Google Scholar] [CrossRef]
  90. Han, F.; Ke, S. Spatial Externalities, Comparative Advantages and Manufacturing Agglomeration. Quant. Econ. Technol. Econ. Res. 2013, 1, 22–38. [Google Scholar] [CrossRef]
  91. Yang, Q.; Zhuo, P.; Yang, J. Industrial Land Transfer and Quality Bottom Line Competition of Investment: An Empirical Study Based on Panel Data of China’s Prefectural Cities from 2007 to 2011. Manag. World 2014, 11, 24–34. [Google Scholar] [CrossRef]
  92. Xie, D. Misallocation of Land Resources and Urban Innovation Ability: An Empirical Study Based on Chinese Urban Panel Data. Econ. J. 2020, 7, 86–112. [Google Scholar] [CrossRef]
  93. Hayes, A.F. Partial, conditional, and moderated moderated mediation: Quantification, inference, and interpretation. Commun. Monogr. 2018, 85, 4–40. [Google Scholar] [CrossRef]
  94. Zhou, M.; Lu, Y.; Fu, D.H. Trade Liberalization and China’s Industrial Upgrade: Facts and Mechanisms. World Econ. 2016, 10, 78–102. [Google Scholar]
  95. Elhorst, J.P. Matlab software for spatial panels. Int. Reg. Sci. Rev. 2014, 37, 389–405. [Google Scholar] [CrossRef] [Green Version]
Figure 1. Mechanism of land resource misallocation on urban carbon emissions.
Land 11 01189 g001
Table 1. Descriptive statistics of land resource misallocation, carbon emissions and other variables in prefecture level cities in China.
VariableMeanStd. Dev.MinimumMaximum
P (Carbon emission, 10,000 tons)2701.8142387.78172.33423,071.172
G (Misallocation degree of land resources)0.89029.9475−0.97261619.0260
L (Labor force in industrial sector, 10,000 people)15.81327.870.0000297.59
Ru (Ratio of built-up area to construction land area)1.0961.8310.1710105.344
λ (Proportion of environmental word frequency)0.0510.0270.00000.253
Fdi (Foreign direct investment stock, 10,000 yuan)2,734,581.311,483,0990.0000345,300,000
Urban (Urbanization rate)0.3530.2390.0381
Energy (Energy consumption, 10,000 tons of standard coal)149.811303.4980.7264034.828
Trf (Road traffic density, m2/person)11.54210.0880.31348.656
Table 2. Baseline regression results.
Variable(1)(2)(3)(4)
OLSOLSFEFE
lnG0.2207 ***0.00620.0607 ***0.0179 ***
(8.39)(0.33)(7.28)(3.39)
lnL 0.3760 *** 0.0746 ***
(35.13) (10.68)
lnEnergy 0.0686 *** 0.1634 ***
(8.39) (26.67)
lnTrf 0.2982 *** 0.1671 ***
(18.63) (21.19)
lnFdi 0.0182 *** 0.0398 ***
(5.34) (16.01)
lnλ 0.0145 0.0351 ***
(0.84) (6.93)
lnUrban −0.3464 *** 0.1049 ***
(−22.14) (6.72)
lnRu −0.0096 0.0051
(−0.30) (0.50)
_cons7.6801 ***5.2797 ***7.6206 ***6.1420 ***
(486.86)(62.16)(1628.72)(131.34)
Ctiy FEYesYesYesYes
Year FEYesYesYesYes
N3948394839483948
R20.01750.52330.01420.5876
F70.3975510.235652.9610612.5457
Note: T-values calculated using the robust standard error of city-level clustering are in parentheses. All regressions control for city and year fixed effects. *** represents statistical significance at the 1% levels.
Table 3. Robustness test of replacement land resource mismatch index.
Variable(1)(2)(5)
Rjxycr0.0017 ***
(12.56)
lnGk1 0.0095 **
(2.25)
Rjgk 0.0001 *
(1.65)
lnL0.0766 ***0.0616 ***0.0619 ***
(11.22)(10.87)(10.92)
lnEnergy0.1561 ***0.0681 ***0.0678 ***
(25.88)(12.44)(12.39)
lnTrf0.1576 ***0.0833 ***0.0831 ***
(20.29)(12.48)(12.44)
lnFdi0.0382 ***0.0252 ***0.0253 ***
(15.64)(8.81)(8.87)
lnλ0.0423 ***−0.0110 **−0.0111 **
(8.46)(−2.18)(−2.19)
lnUrban0.1189 ***0.0511 ***0.0497 ***
(7.75)(4.20)(4.09)
lnRu0.00710.0161 *0.0170 **
(0.72)(1.92)(2.03)
_cons6.2044 ***6.8045 ***6.7946 ***
(135.18)(146.01)(146.31)
Ctiy FEYesYesYes
Year FEYesYesYes
N394828202820
R20.57140.31400.3134
F656.9408140.4780140.0547
Note: T-values calculated using the robust standard error of city-level clustering are in parentheses. *, **, and *** represent statistical significance at the 10%, 5%, and 1% levels, respectively.
Table 4. Results after winsorization and truncation of outliers.
Variable(1) Truncated on Both Sides 1%(2) Tail Contraction on Both Sides 1%
lnG0.0219 ***0.0202 ***
(4.23)(3.92)
lnL0.0670 ***0.0695 ***
(9.72)(10.20)
lnEnergy0.1629 ***0.1631 ***
(26.74)(27.30)
lnTrf0.1660 ***0.1657 ***
(21.23)(21.54)
lnFdi0.0376 ***0.0385 ***
(15.21)(15.86)
lnλ0.0339 ***0.0346 ***
(6.76)(6.99)
lnUrban0.1111 ***0.1075 ***
(7.23)(7.06)
lnRu0.01140.0099
(1.13)(1.00)
_cons6.1972 ***6.1753 ***
(133.90)(135.40)
Ctiy FEYesYes
Year FEYesYes
N37283948
R20.58900.5933
F603.6165627.2193
Note: T-values calculated using the robust standard error of city-level clustering are in parentheses. *** represents statistical significance at the 1% levels.
Table 5. Land resource misallocation and carbon emissions: two stage least square method (2SLS).
VariableFirst Stage RegressionSecond Stage Regression
lnGlnP
lnG 1.0525 ***
(4.77)
lnYgcpd31.0513 ***
(3.88)
lnGk20.0401 ***
(3.48)
lnL0.03330.0105
(1.44)(0.39)
lnEnergy0.0237−0.0007
(0.95)(−0.02)
lnTrf−0.04400.0850 ***
(−1.51)(2.95)
lnFdi0.00530.0038
(0.43)(0.29)
lnλ−0.03130.0181
(−1.52)(0.80)
lnUrban−0.06010.0436
(−1.14)(0.83)
lnRu0.0255−0.0194
(0.75)(−0.53)
_cons−473.7348 ***
(−3.89)
Sargen-test 0.331
[0.5652]
Wald F statistic 11.767
Ctiy FEYesYes
Year FEYesYes
N28202820
R20.0220−11.8303
Note: *** represent statistical significance at the 1% levels. In the first stage regression, the value in parentheses is t; in the second stage regression, the value in parentheses is Z, and in square brackets is the adjoint probability of the corresponding statistics.
Table 6. Mediation effects test of land misallocation on carbon emissions I.
Mediation VariableServitization of Industrial Structure (Tir)Industrial Structure Advancement (Gdh)Industrial Agglomeration (Agg)
Type of the EquationEquation (9)Equation (10)Equation (11_Equation (10Equation (11)Equation (10)Equation (11)
lnG0.0179 ***−0.00340.0178 ***−0.0437 **0.0329 **−0.0496 ***0.0130 **
(3.39)(−0.62)(3.36)(−2.51)(2.12)(−3.08)(2.52)
lnTir −0.0393 **
(−2.41)
lnGdh −0.0249 ***
(−6.57)
lnAgg −0.1199 ***
(−21.98)
lnL0.0746 ***−0.0368 ***0.0731 ***−0.0258 **0.0724 ***0.4241 ***0.1258 ***
(10.68)(−5.05)(10.44)(−2.13)(9.02)(20.69)(18.09)
lnEnergy0.1634 ***0.0640 ***0.1659 ***0.0835 ***0.1286 ***−0.3550 ***0.1207 ***
(26.67)(10.03)(26.71)(5.59)(11.32)(−19.78)(19.91)
lnTrf0.1671 ***0.0385 ***0.1686 ***0.0597 ***0.0657 ***−0.3538 ***0.1247 ***
(21.19)(4.69)(21.33)(4.79)(4.10)(−15.32)(16.33)
lnFdi0.0398 ***0.0363 ***0.0413 ***0.0352 *0.0545 **−0.0777 ***0.0305 ***
(16.01)(14.01)(16.14)(1.74)(2.35)(−10.67)(12.87)
lnλ0.0351 ***0.00470.0353 ***0.0289 **0.0193 *−0.0570 ***0.0283 ***
(6.93)(0.89)(6.97)(2.34)(1.72)(−3.84)(5.95)
lnUrban0.1049 ***0.0639 ***0.1075 ***0.0241 ***0.0490−0.7104 **0.0196
(6.72)(3.93)(6.87)(6.07)(1.02)(−15.53)(1.29)
lnRu0.00510.00720.00540.0160 *0.0113 *−0.01360.0033
(0.50)(0.68)(0.53)(1.76)(1.83)(−0.46)(0.34)
_cons6.1420 ***−1.5072 ***6.0827 ***−1.0802 ***5.7047 ***2.4867 ***6.4408 ***
(31.34)(−30.93)(51.13)(−33.04)(26.66)(18.16)(40.46)
Sobel test −0.0083 *
(−1.80)
0.0259 ***
(4.96)
0.0079 *
(1.749)
Ctiy FEYesYesYesYesYesYesYes
Year FEYesYesYesYesYesYesYes
N3948394839482538253839483948
R20.58760.16750.58830.29610.44790.37800.6383
Note: ***, ** and * indicate significant at the level of 1%, 5% and 10%, respectively. Except for the Z value in Sobel test, the values in other parentheses are t values.
Table 7. Mediation effects test of land misallocation on carbon emissions II.
VariableThe Number of Green Patent Applications (Lsfmzl)The Number of Green Utility Model Applications (Lssyzl)
Type of the EquationEquation (10)Equation (11)Equation (10)Equation (11)
lnG0.04140.0147 ***0.0922 ***0.0093 **
(1.46)(3.06)(3.65)(1.97)
lnLsfmzl 0.0768 ***
(26.54)
lnLssyzl 0.0929 ***
(29.08)
lnL0.3878 ***0.0448 ***0.2763 ***0.0489 ***
(10.34)(6.93)(8.27)(7.74)
lnEnergy0.8975 ***0.0945 ***0.8865 ***0.0810 ***
(27.28)(15.34)(30.25)(13.12)
lnTrf0.9047 ***0.0976 ***0.8482 ***0.0883 ***
(21.36)(12.77)(22.48)(11.67)
lnFdi0.1645 ***0.0272 ***0.1940 ***0.0218 ***
(12.31)(11.74)(16.30)(9.42)
lnλ0.1332 ***0.0249 ***0.1588 ***0.0204 ***
(4.90)(5.37)(6.55)(4.46)
lnUrban1.3477 ***0.00141.3364 ***−0.0192
(16.07)(0.10)(17.88)(−1.31)
lnRu0.0891−0.00170.04700.0008
(1.63)(−0.19)(0.97)(0.08)
_cons−3.0347 ***6.3751 ***−2.6853 ***6.3915 ***
(−12.09)(146.54)(−12.01)(149.44)
Sobel test0.0274 ***
(4.461)
0.0368 ***
(5.679)
Ctiy FEYesYesYesYes
Year FEYesYesYesYes
N3948394839483948
R20.59850.65780.64450.6690
Note: *** and ** indicate significant at the level of 1% and 5%, respectively. Except for the Z value in Sobel test, the values in other parentheses are t values.
Table 8. Estimation results of direct and indirect effects of land misallocation on urban carbon emissions.
VariableDirect EffectsIndirect EffectsTotal Effects
Coefficientt ValueCoefficientt ValueCoefficientt Value
lnG0.0395 ***2.870.0957 **2.380.1352 ***2.69
lnL0.1542 **2.41−0.0534 ***−2.640.1008 **2.49
lnEnergy0.0954 ***3.720.0707 *1.850.1661 **2.55
lnTrf0.0211 *1.910.00751.080.02860.96
lnFdi0.0225 **2.130.0371 *1.680.0596 *1.83
lnλ−0.0136 *−1.860.00890.680.00471.09
lnUrban−0.0681 ***−4.92−0.1253 ***−3.85−0.1934 ***−4.11
lnRu0.05391.580.0385 *1.790.09241.19
Note: *, **, and *** represent statistical significance at the 10%, 5%, and 1% levels, respectively.
Table 9. Heterogeneity test results based on cities of different levels.
Variable(1) Type-I Large and above Cities(2) Type-II Large Cities(3) Medium-Sized Cities(4) Small Cities
lnG0.0647 ***0.0221 **0.0146 *0.0045
(3.31)(2.45)(1.80)(0.33)
lnL0.0380 *0.0423 ***0.0957 ***0.0798 ***
(1.76)(4.06)(7.38)(4.44)
lnEnergy0.1158 ***0.2135 ***0.1288 ***0.1559 ***
(5.71)(19.80)(13.01)(10.52)
lnTrf0.1592 ***0.1092 ***0.1597 ***0.2033 ***
(4.98)(7.87)(13.30)(9.32)
lnFdi0.1484 ***0.0680 ***0.0555 ***0.0290 ***
(7.48)(10.25)(10.23)(7.77)
lnλ0.02290.0354 ***0.0333 ***0.0154
(1.59)(4.65)(4.06)(1.01)
lnUrban−0.02080.0537 **0.0956 ***0.1765 ***
(−0.38)(2.12)(4.14)(2.96)
lnRu0.00320.0230−0.01150.0321
(0.13)(1.38)(−0.69)(1.17)
_cons5.2914 ***5.7177 ***5.9460 ***6.1655 ***
(17.16)(58.70)(76.33)(43.92)
Ctiy FEYesYesYesYes
Year FEYesYesYesYes
N29415961470588
R20.67370.62320.57890.5803
F65.3040287.3865220.619084.3424
Note: *, **, and *** represent statistical significance at the 10%, 5%, and 1% levels, respectively.
Table 10. Heterogeneity test results based on different regions.
VariableThe Eastern RegionThe Central RegionThe Western Region
lnG0.0379 ***0.0226 **0.0087
(4.58)(2.37)(1.23)
lnL0.0355 *0.0692 ***0.0815 **
(1.90)(2.98)(2.52)
lnEnergy0.1308 ***0.1743 ***0.0857 ***
(5.59)(15.17)(4.33)
lnTrf0.0704 ***0.0553 ***0.0703 ***
(7.93)(5.55)(8.65)
lnFdi0.1524 ***0.0680 ***0.0570 ***
(8.98)(6.16)(3.17)
lnλ0.03420.0459 ***0.0427 *
(1.41)(5.85)(1.76)
lnUrban−0.0607 *−0.02430.0631 **
(−1.68)(0.91)(2.07)
lnRu0.02030.01820.0166
(1.04)(1.61)(1.44)
_cons2.3017 ***2.4759 ***4.7006 ***
(13.69)(9.74)(7.55)
Ctiy FEYesYesYes
Year FEYesYesYes
N140014001148
R20.70860.62950.5916
Note: *, **, and *** represent statistical significance at the 10%, 5%, and 1% levels, respectively.
Publisher’s Note: MDPI stays neutral with regard to jurisdictional claims in published maps and institutional affiliations.

