
Analyzing Resilience in the Greater Yellowstone Ecosystem after the 1988 Wildfire in the Western U.S. Using Remote Sensing and Soil Database


Abstract
:1. Introduction
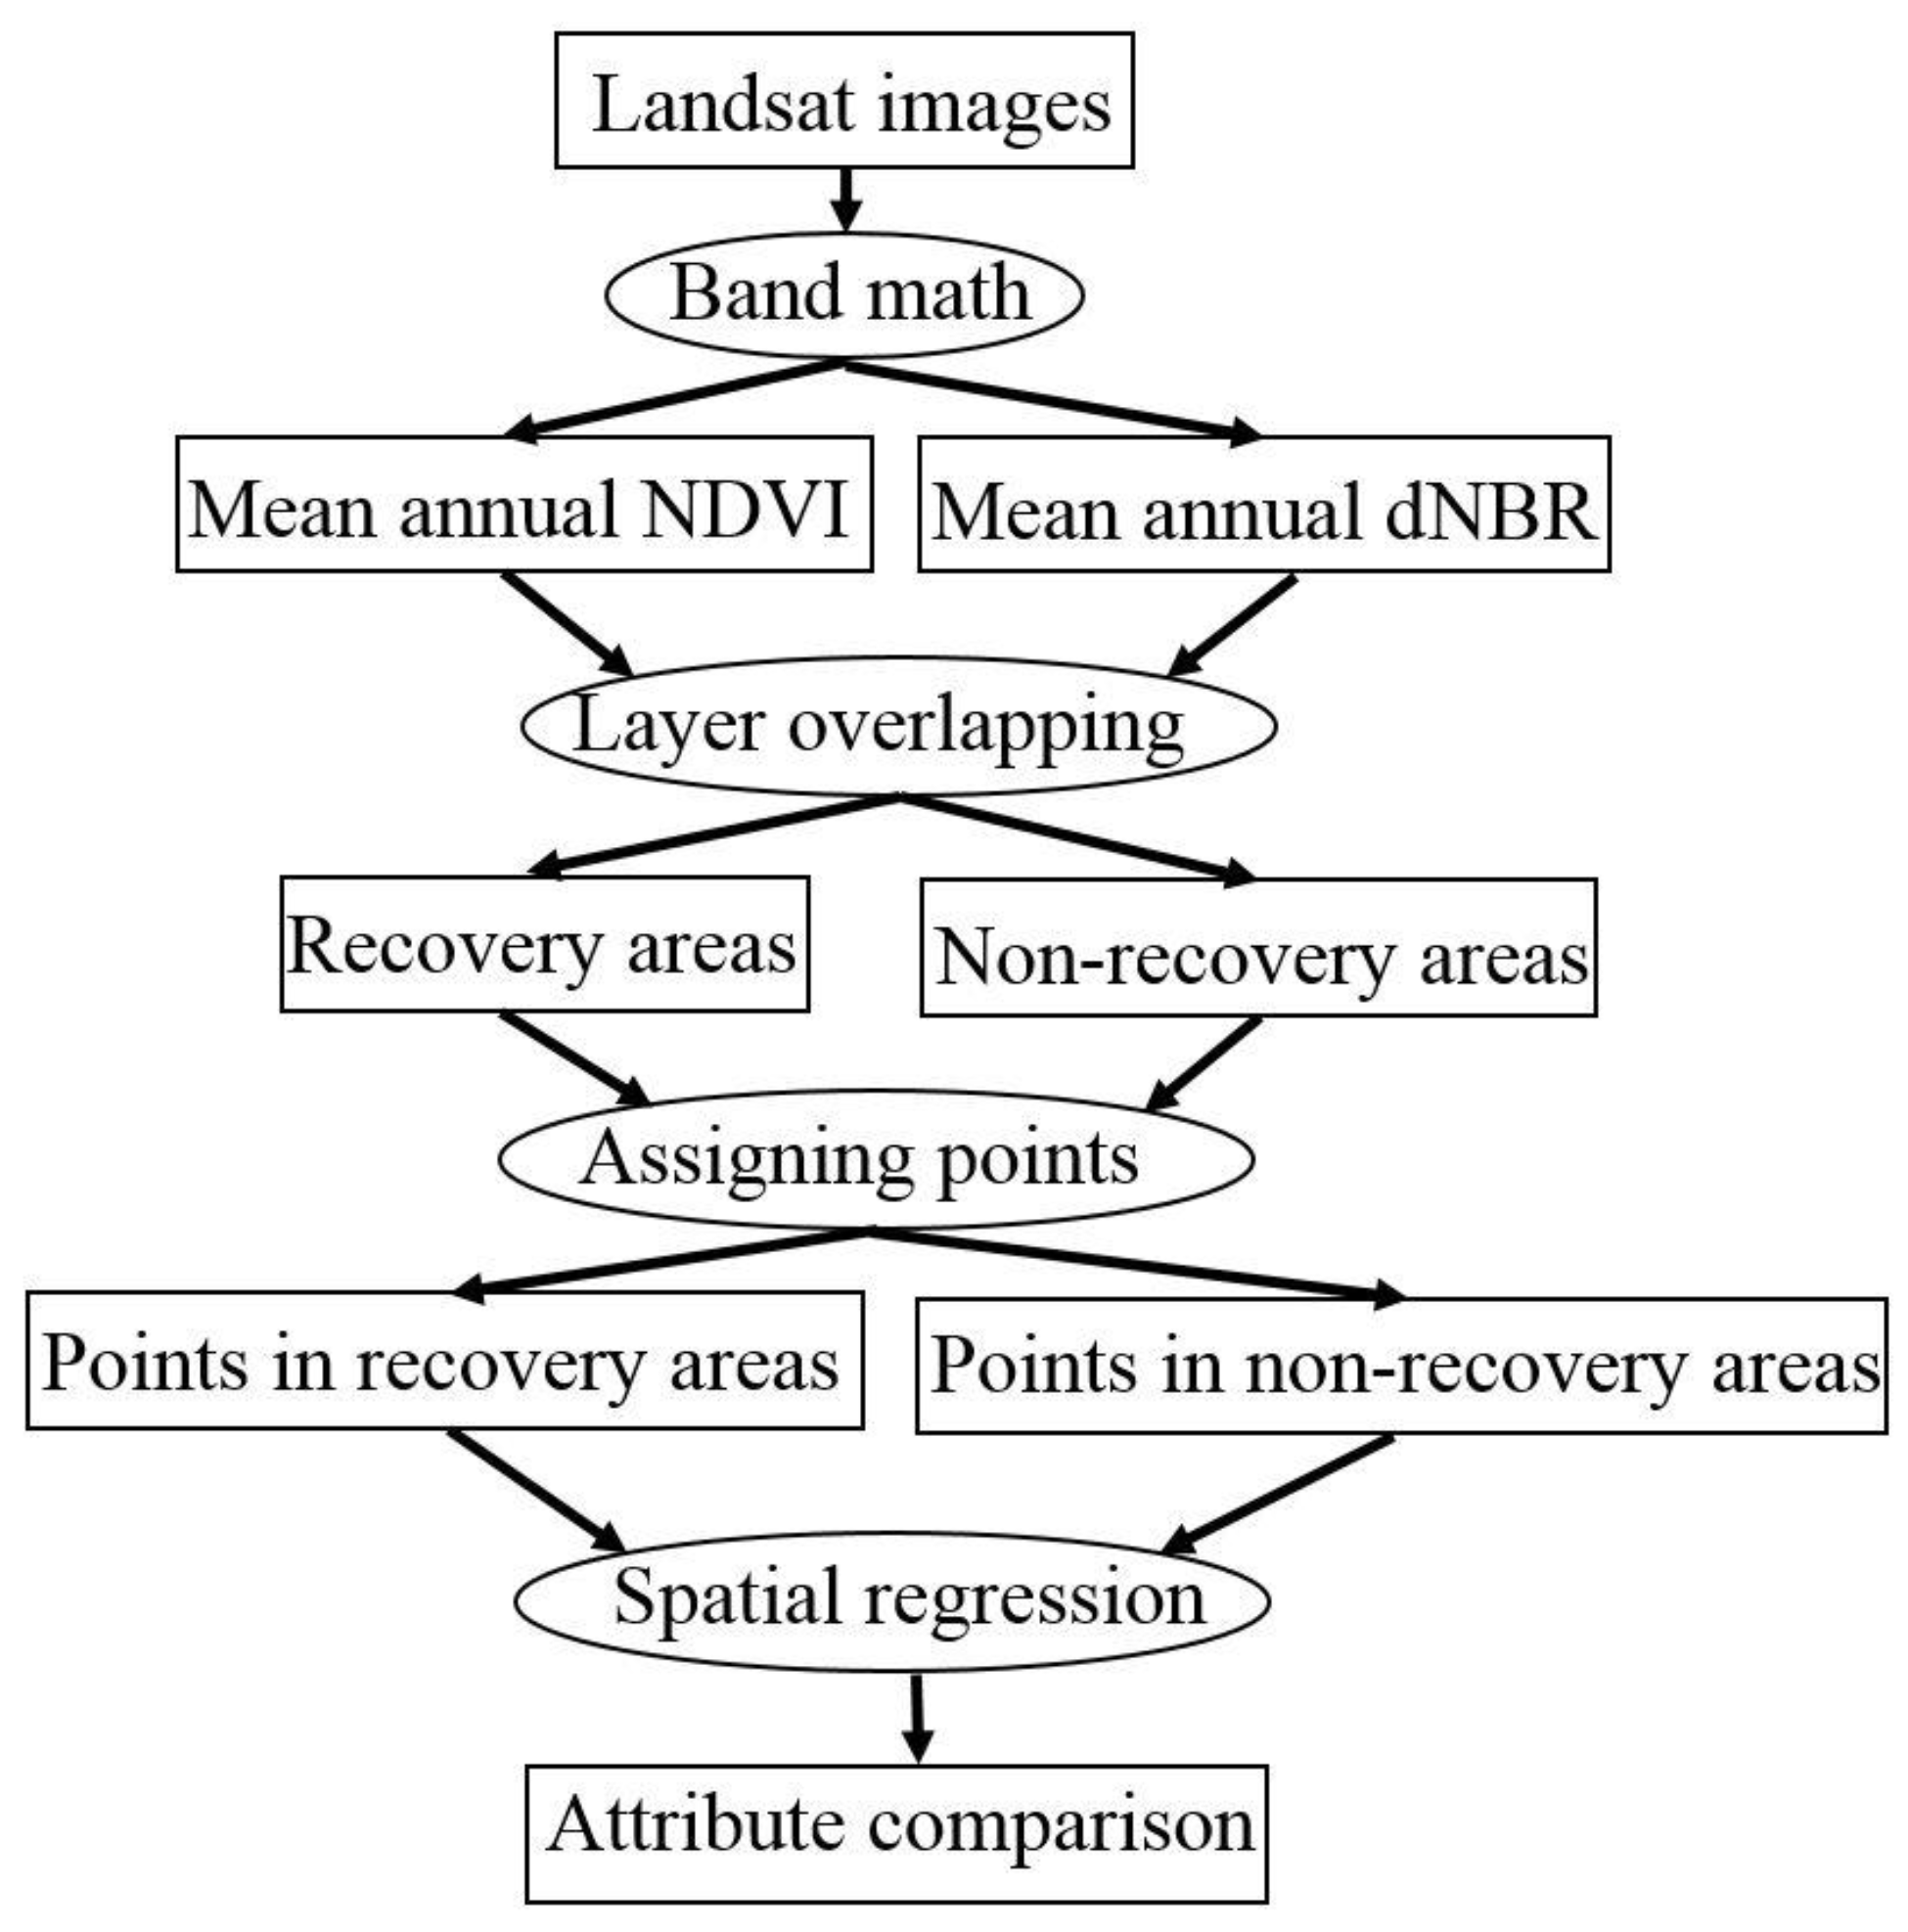
2. Materials and Methods
2.1. Site Description
2.2. Data Collection
2.3. Calculating dNBR and Their Thresholds
2.4. The Extraction of Non-Recovery Areas
2.5. Statistical Analysis
3. Results
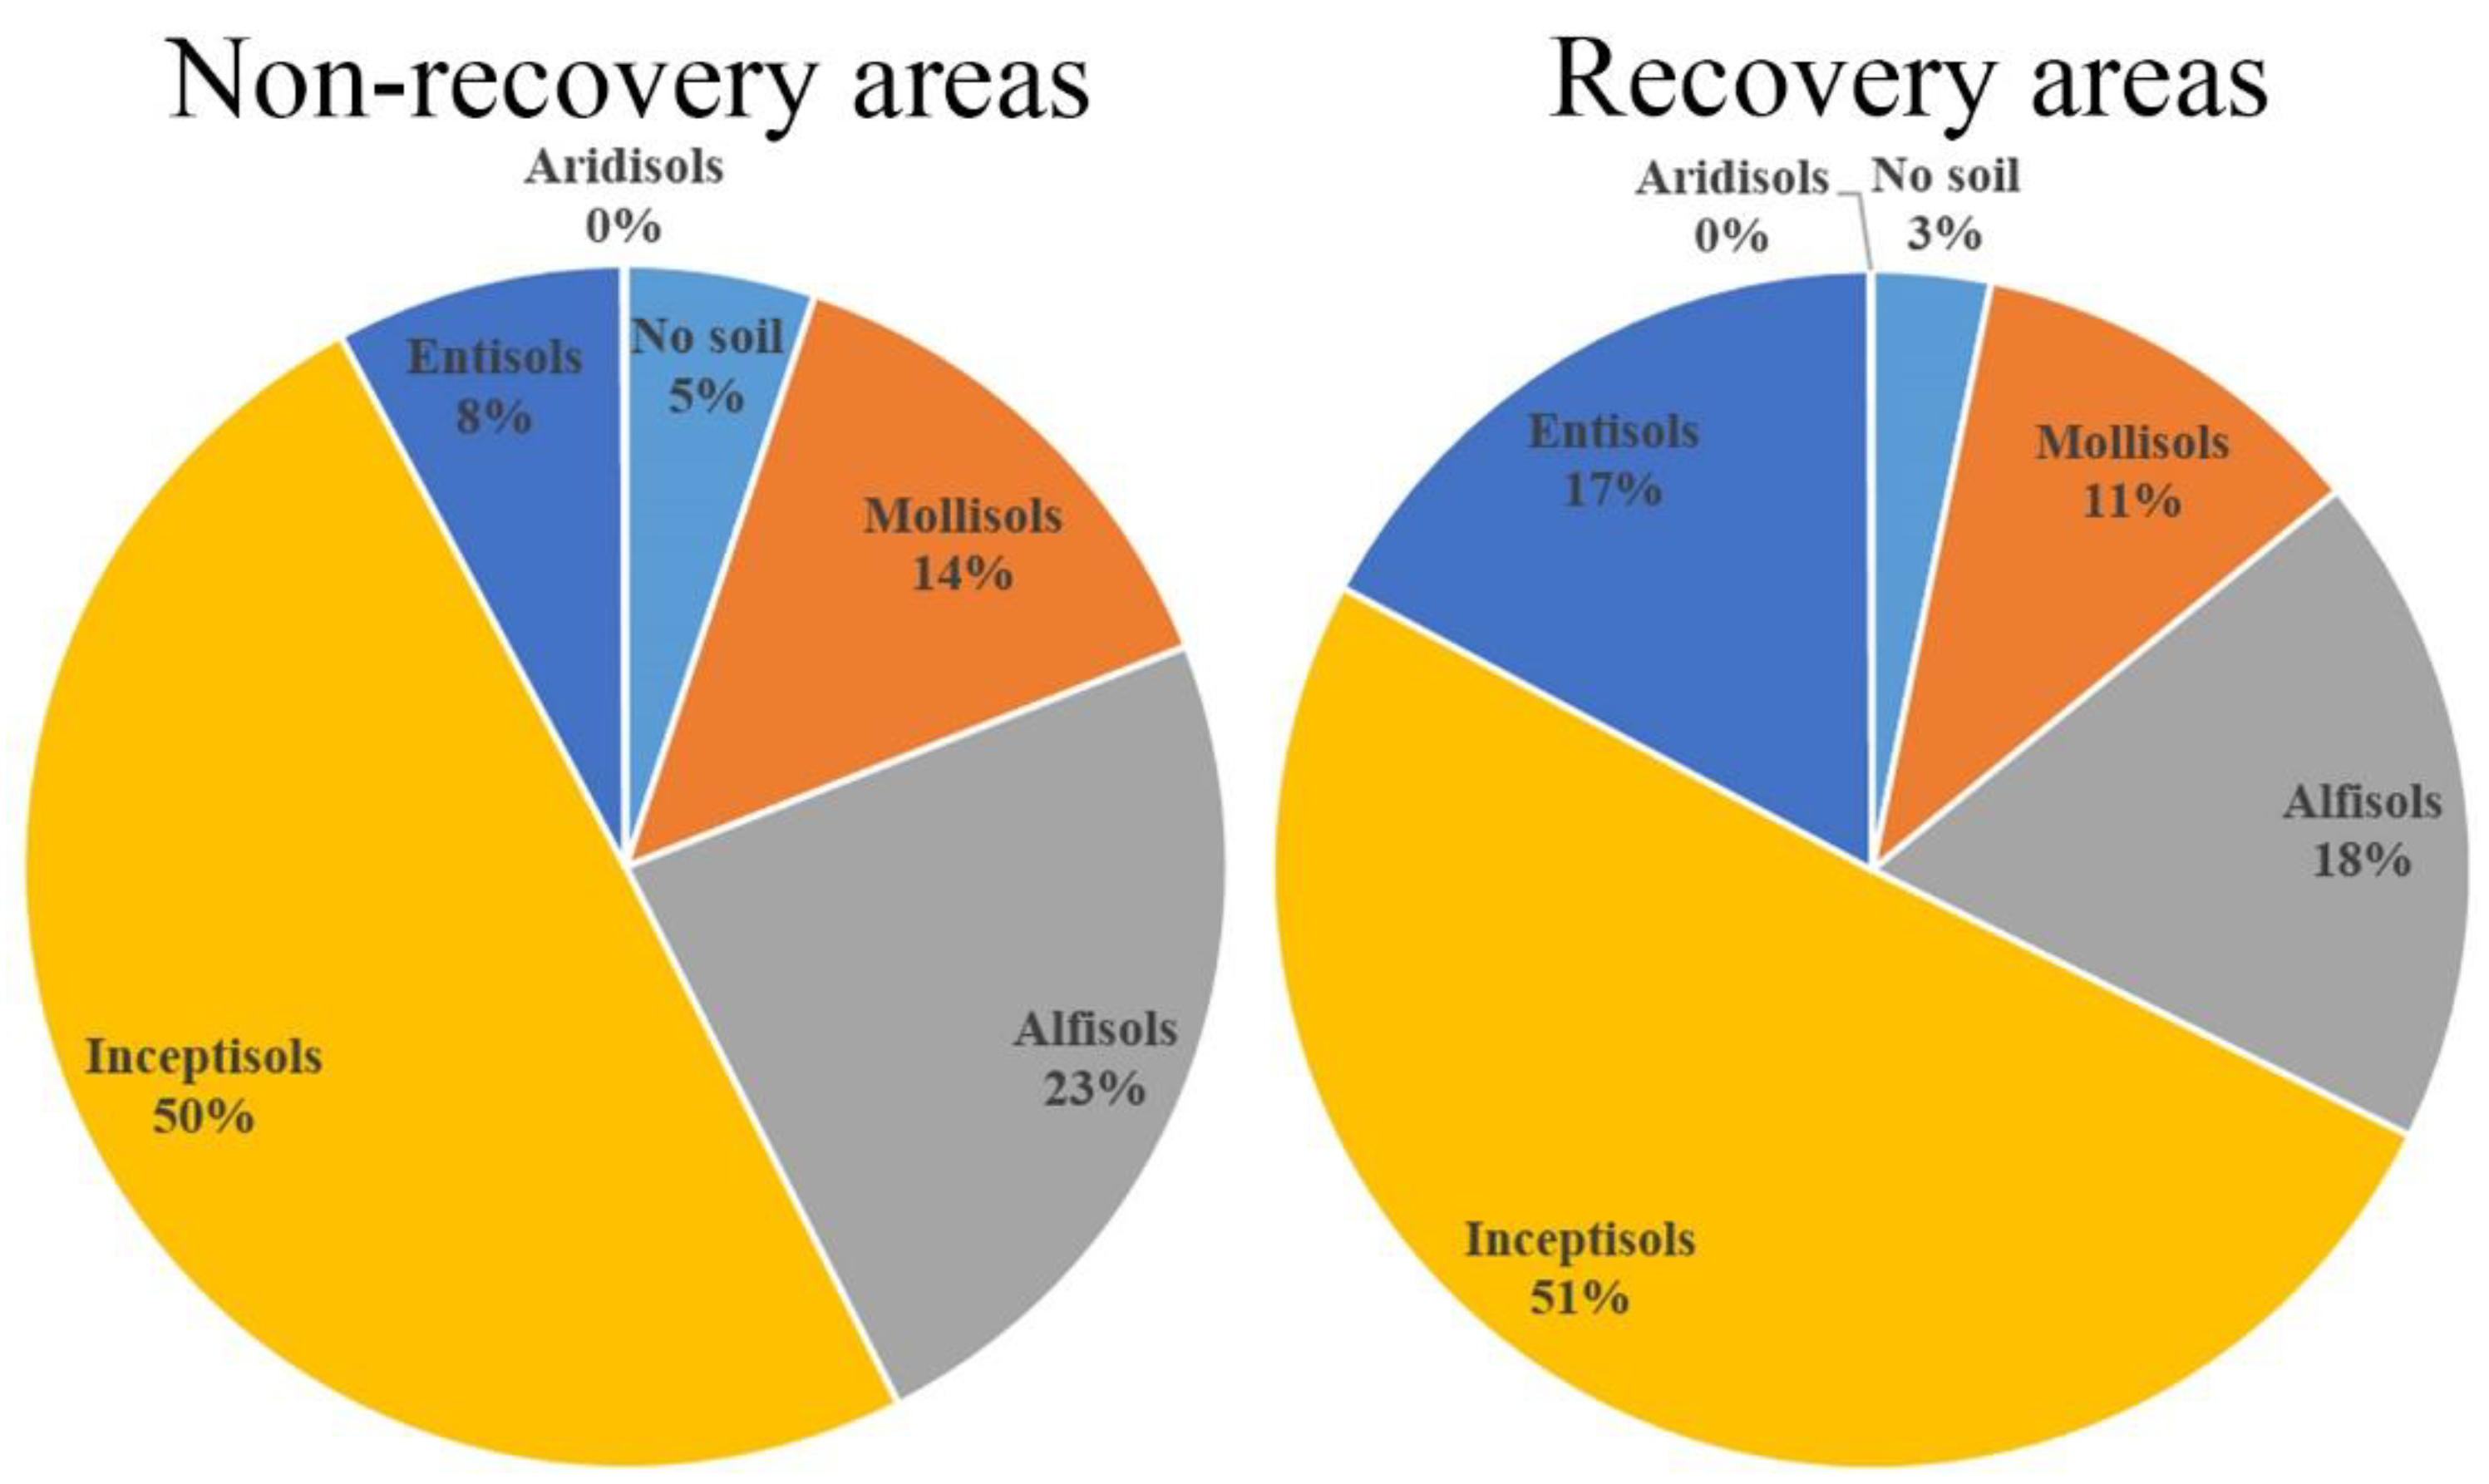
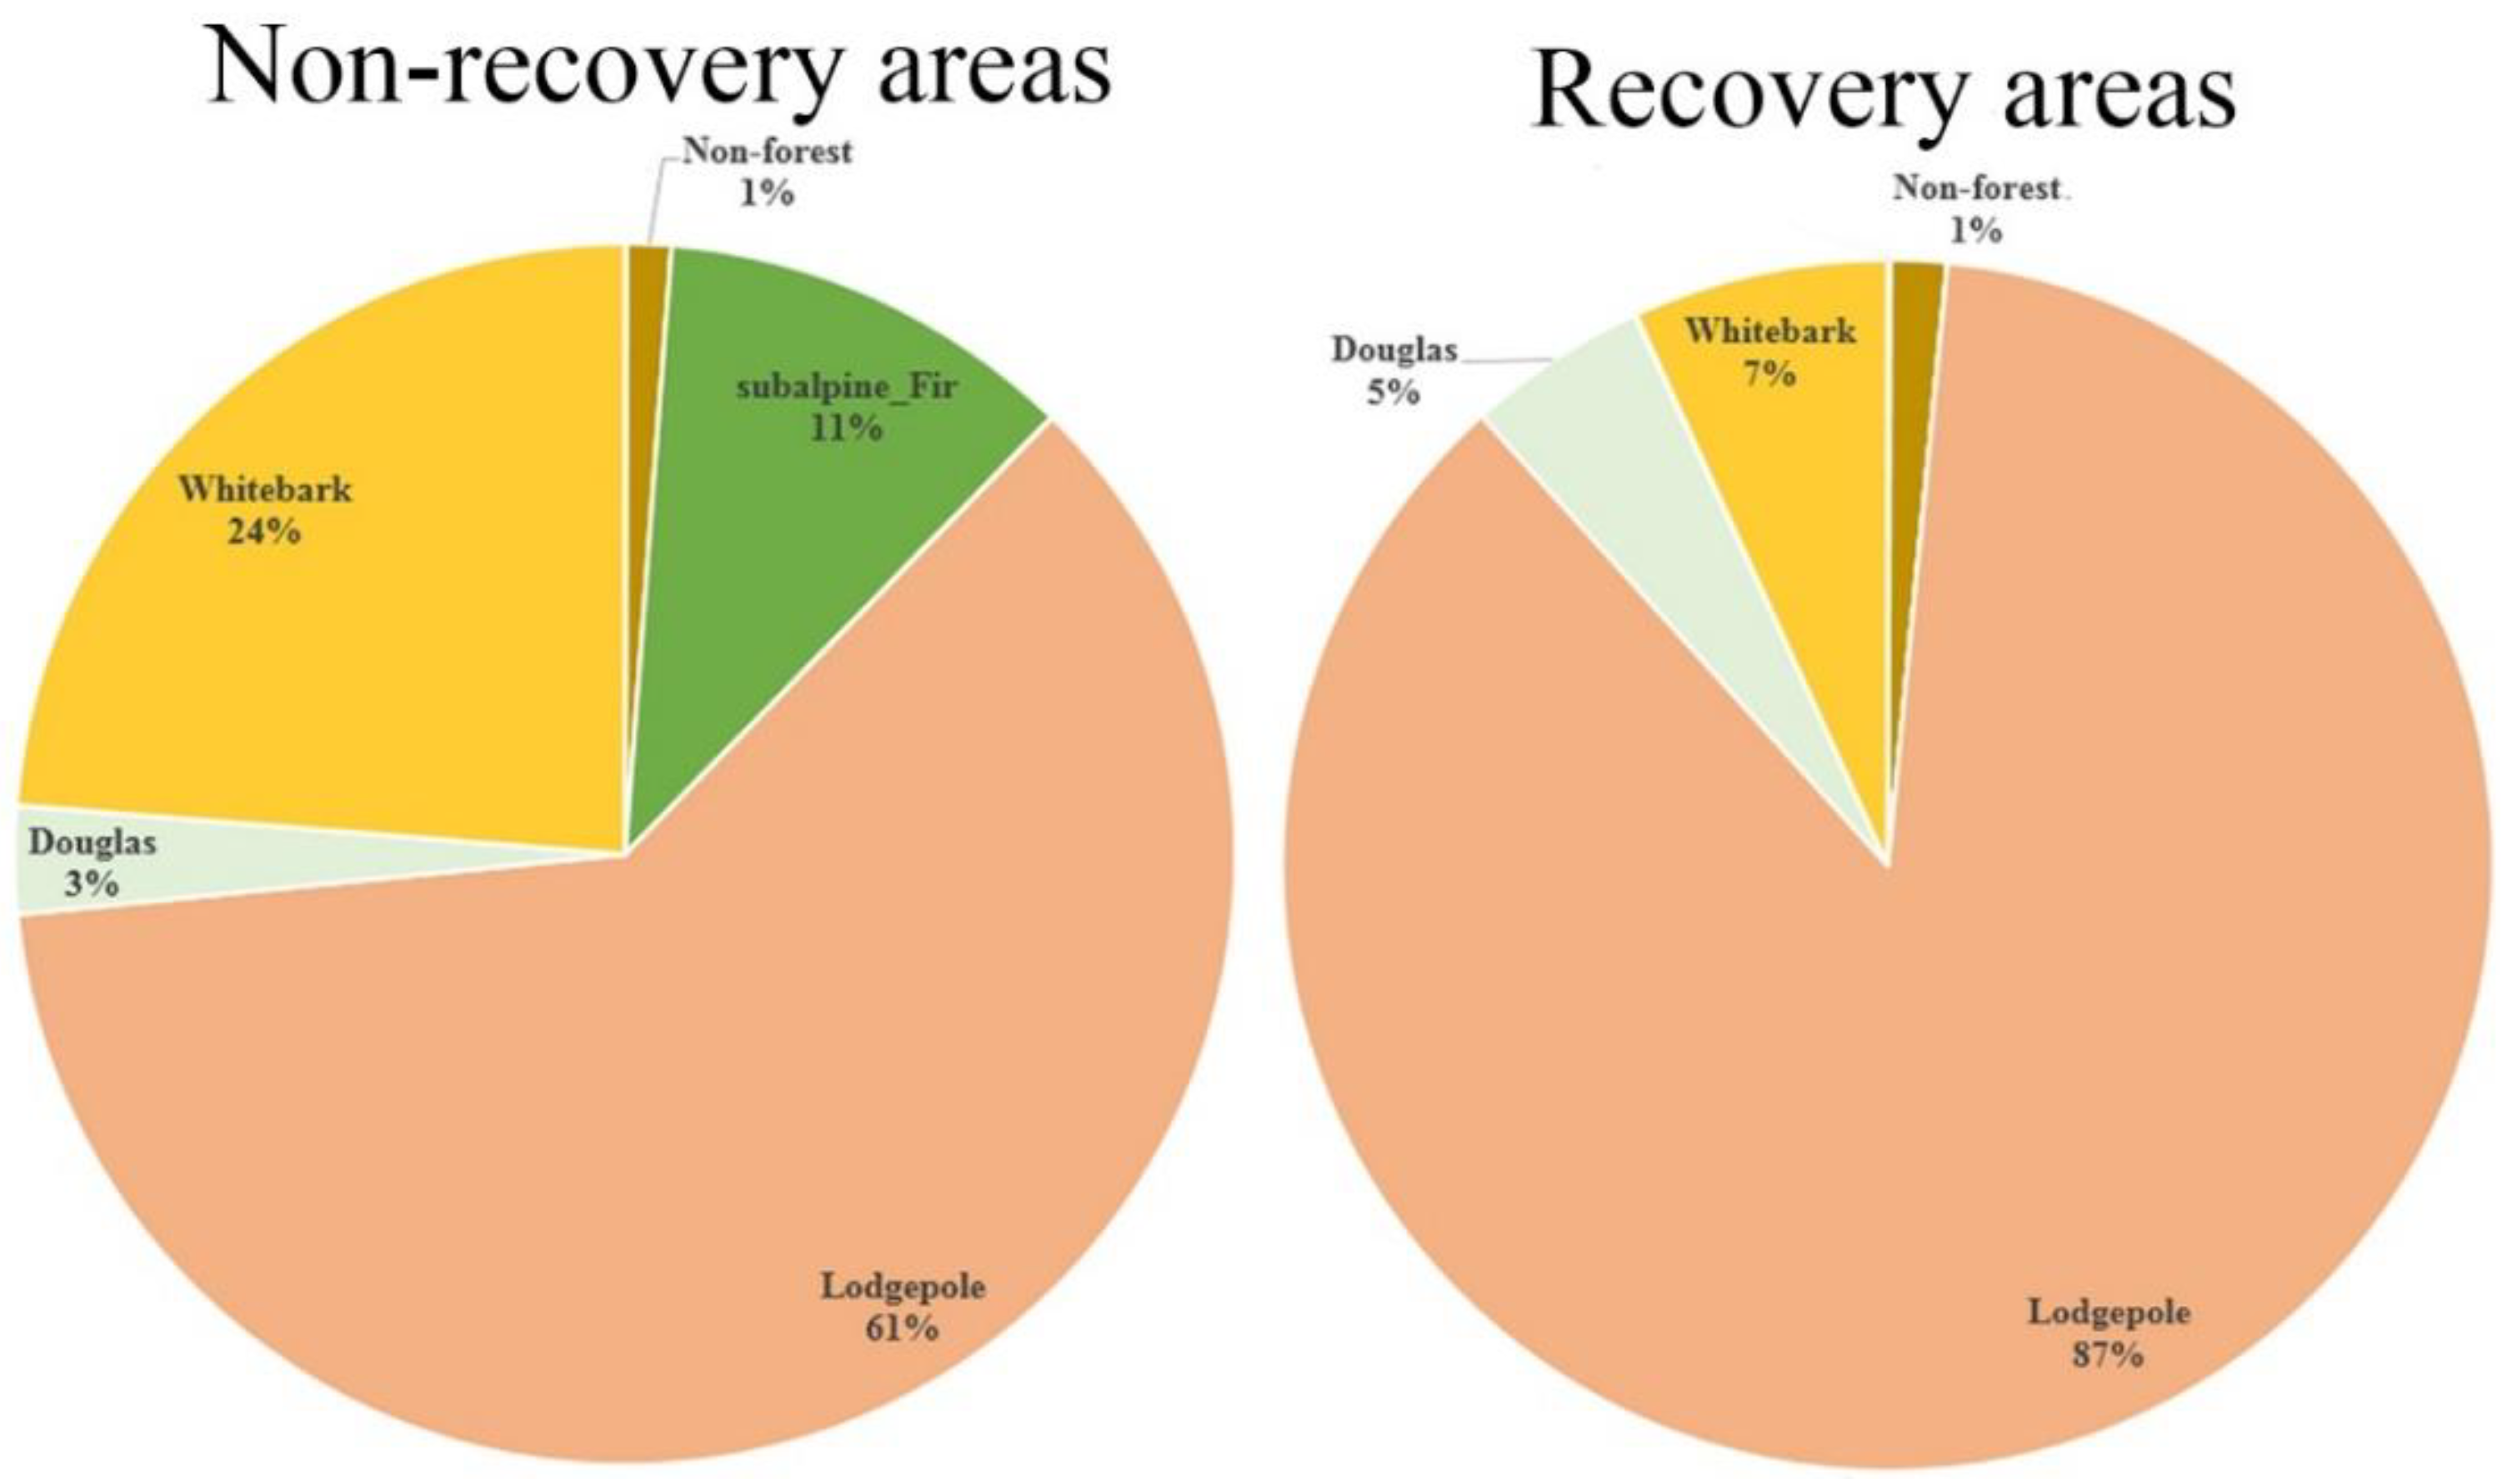
3.1. The Spatial Distribution of Non-Recovery Areas
3.2. The Differences between Non-Recovery Areas and Recovery Areas
4. Discussion
4.1. Effects of Pre-Fire Drivers on Recovery and Non-Recovery Areas
4.2. Effects of Post-Fire Characteristics on the Recovery Areas and Non-Recovery Areas
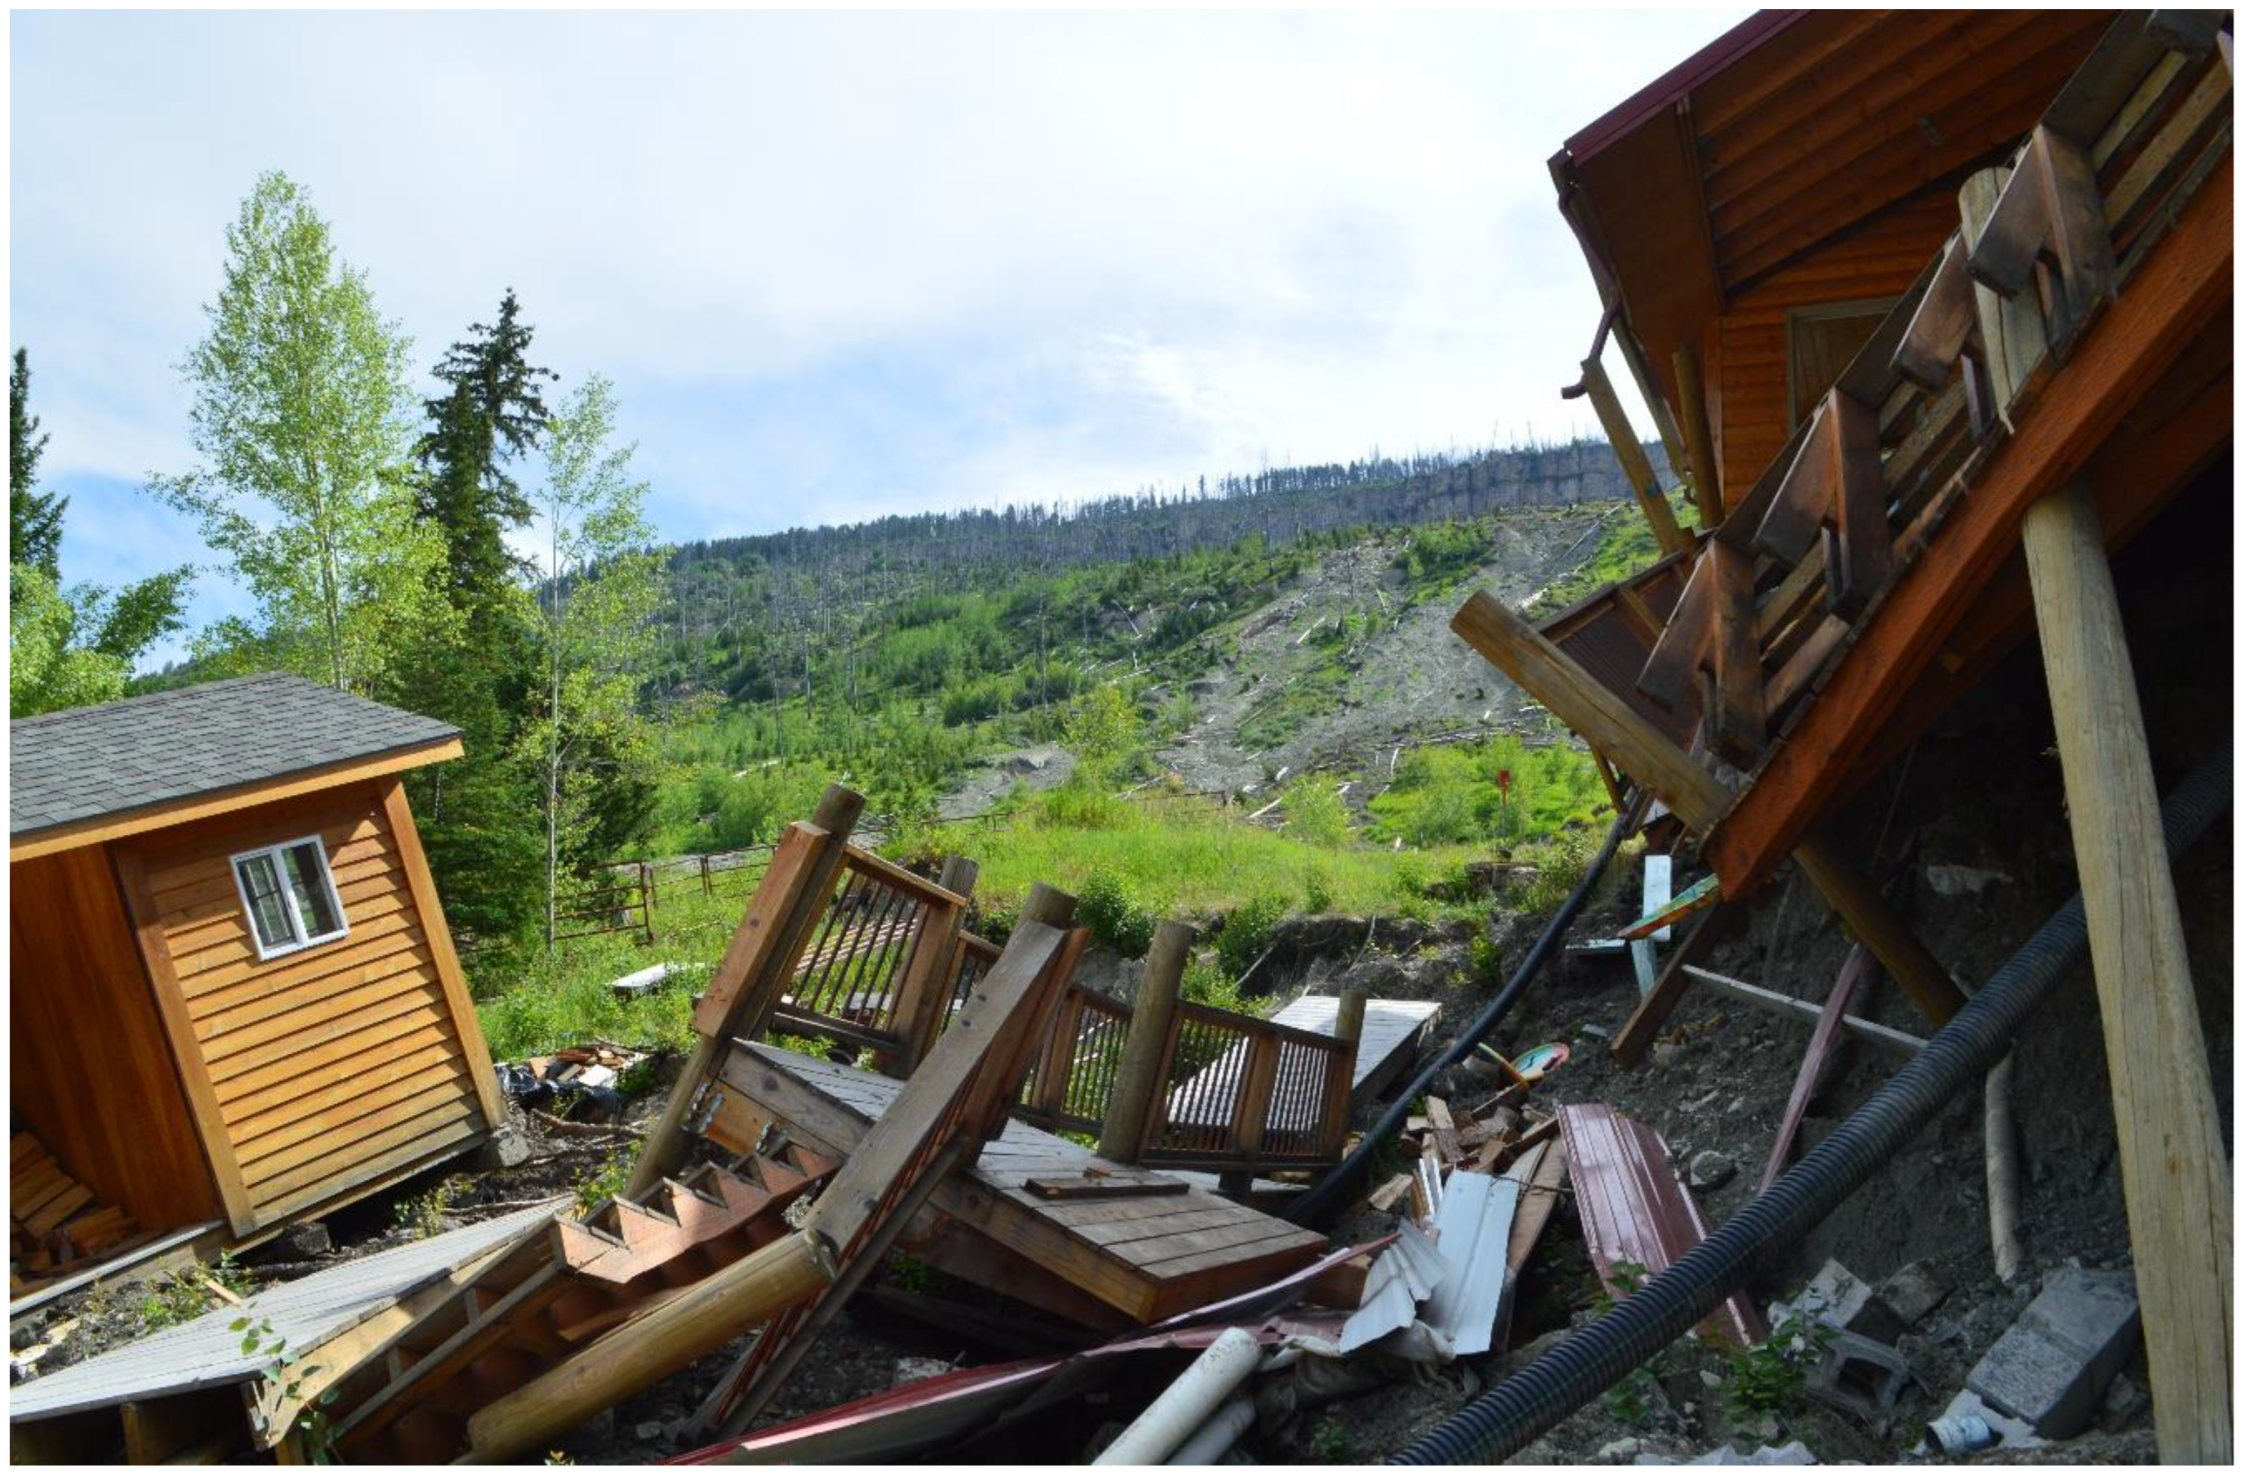
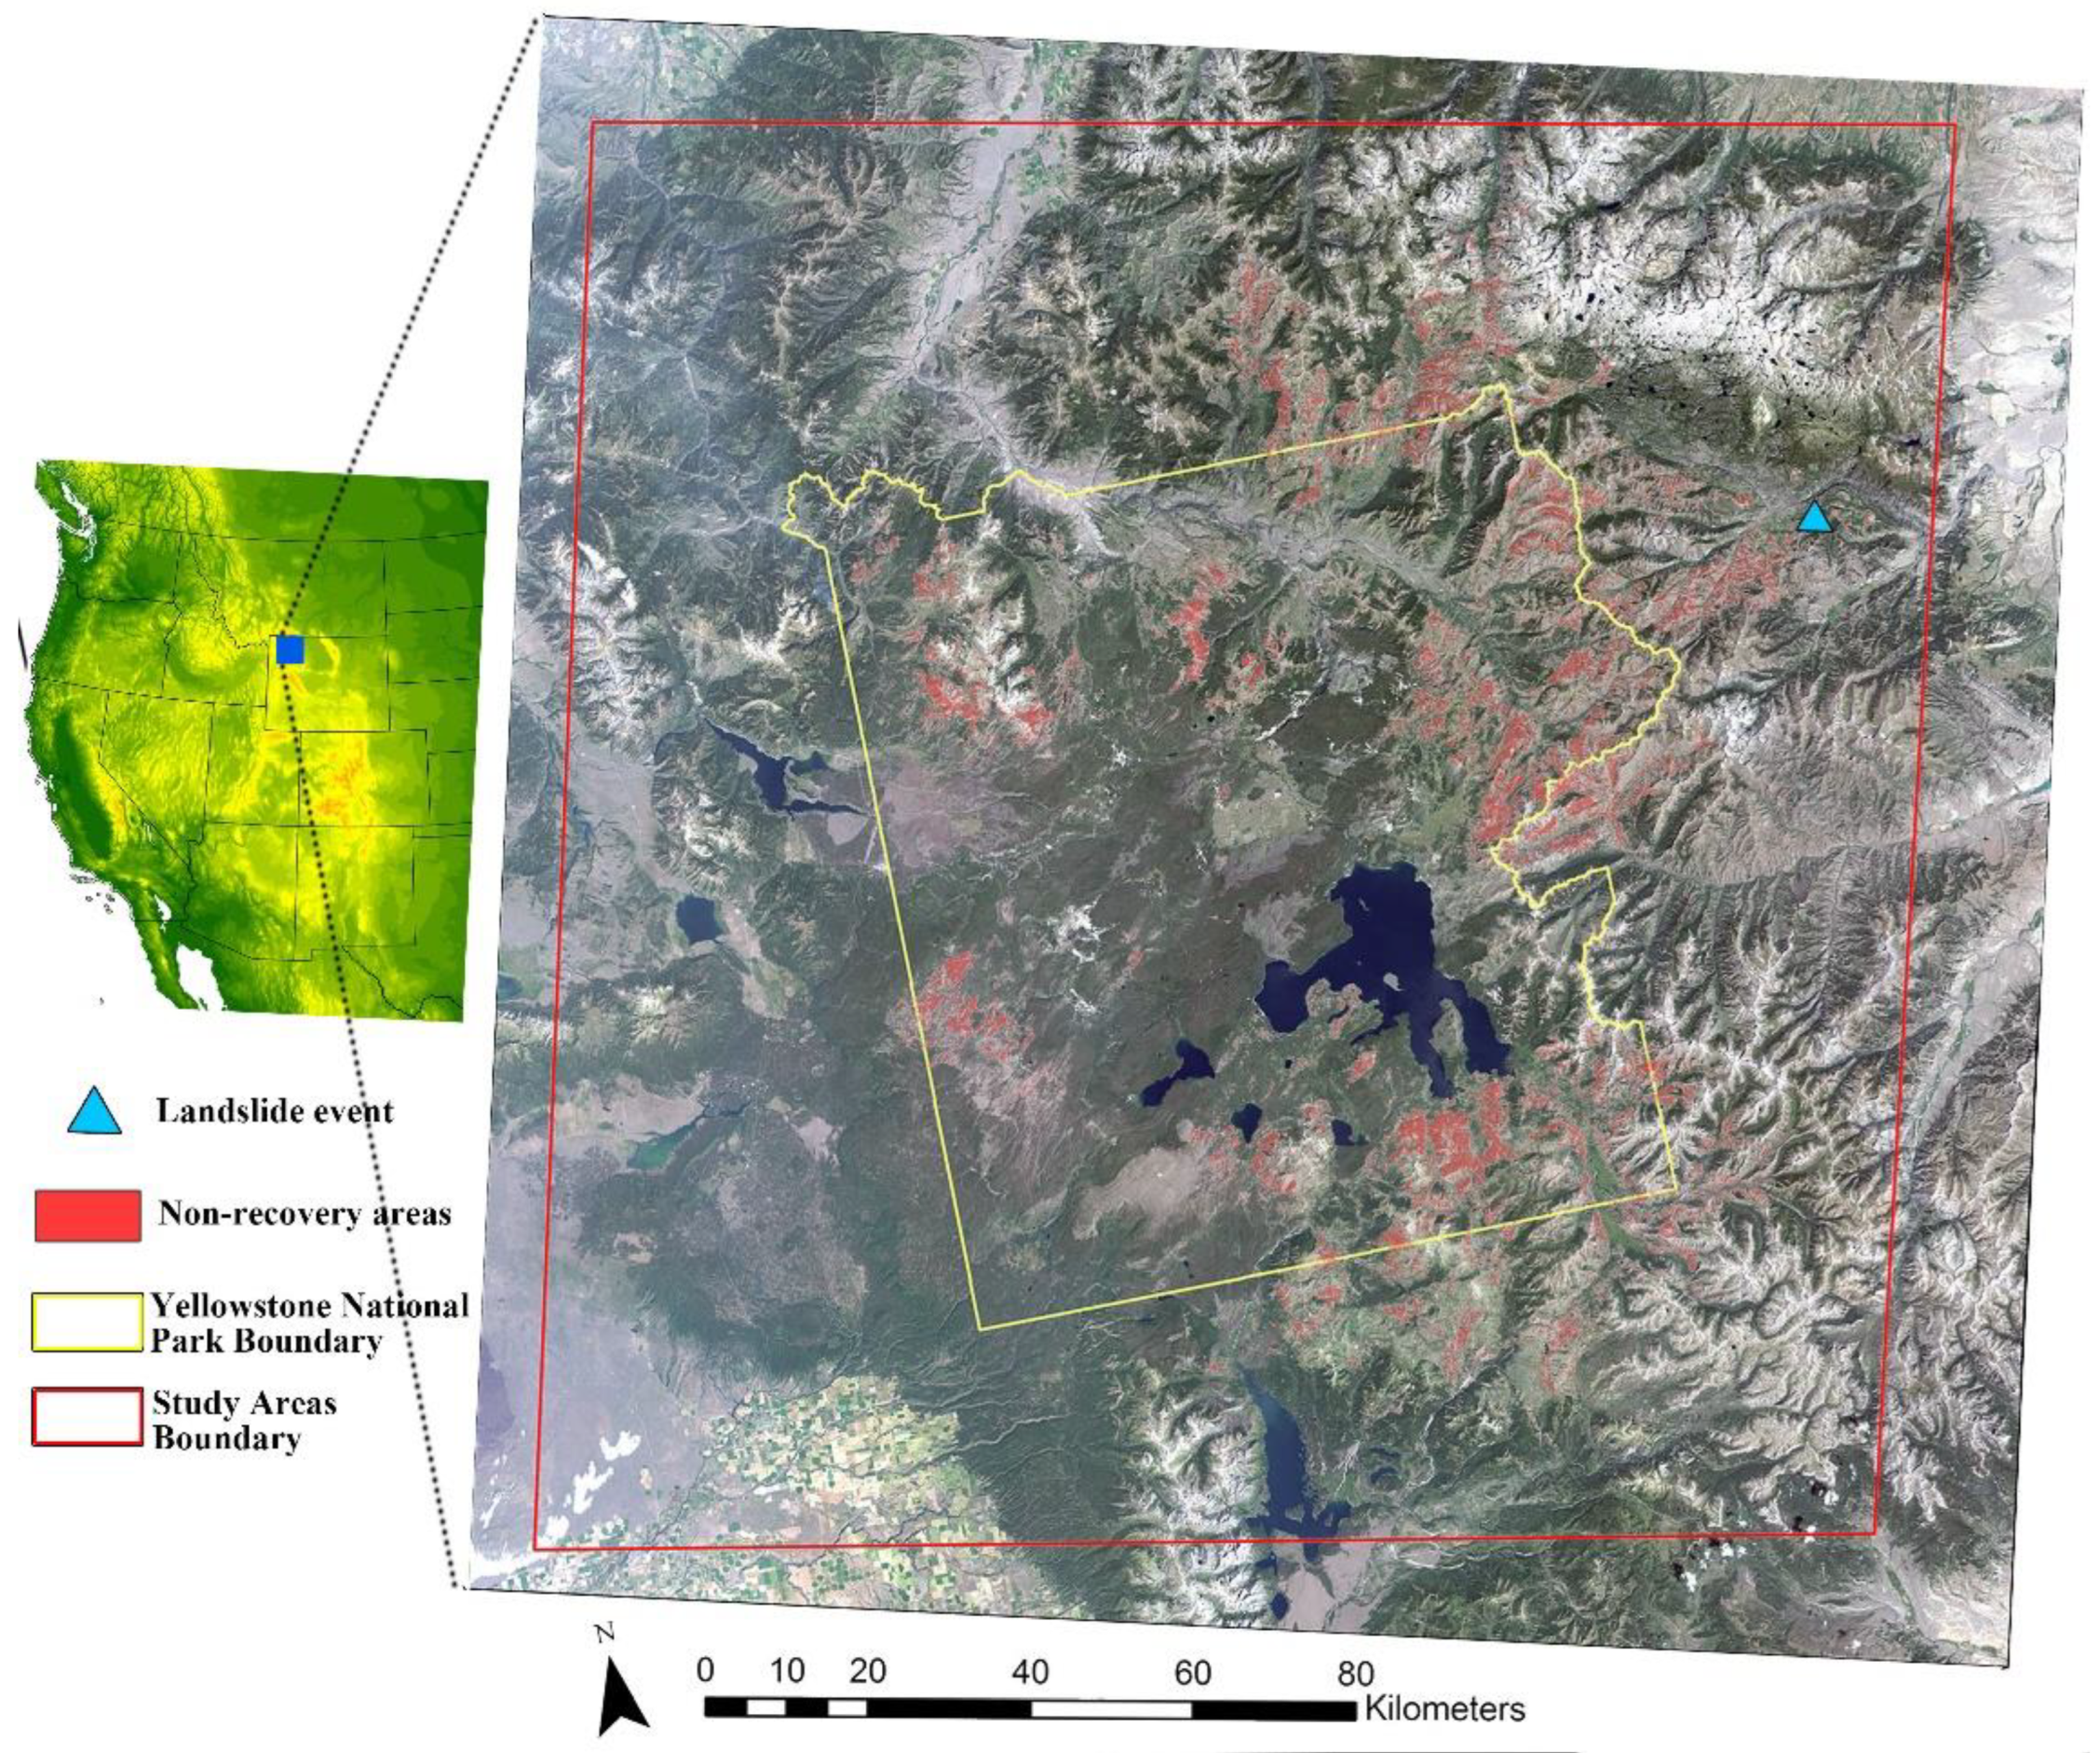
4.3. Personal Observation on Non-Recovery Areas
4.4. Future Work
5. Conclusions
Author Contributions
Funding
Institutional Review Board Statement
Informed Consent Statement
Data Availability Statement
Conflicts of Interest
References
- White, P.S.; Jentsch, A. The Search for Generality in Studies of Disturbance and Ecosystem Dynamics. Prog. Bot. 2001, 62, 399–450. [Google Scholar] [CrossRef]
- Motta, R.; Nola, P. Growth trends and dynamics in sub-alpine forest stands in the Varaita Valley (Piedmont, Italy) and their relationships with human activities and global change. J. Veg. Sci. 2001, 12, 219–230. [Google Scholar] [CrossRef]
- Trumbore, S.; Brando, P.; Hartmann, H. Forest health and global change. Science 2015, 349, 814–818. [Google Scholar] [CrossRef] [Green Version]
- Schebeck, M.; Hansen, E.M.; Schopf, A.; Ragland, G.J.; Stauffer, C.; Bentz, B.J. Diapause and overwintering of two spruce bark beetle species. Physiol. Èntomol. 2017, 42, 200–210. [Google Scholar] [CrossRef] [Green Version]
- Franklin, A.B.; Anderson, D.R.; Gutiérrez, R.J.; Burnham, K.P. Climate, habitat quality, and fitness in northern spotted owl populations in northwestern California. Ecol. Monogr. 2000, 70, 539–590. [Google Scholar] [CrossRef]
- Johnstone, J.F.; Allen, C.D.; Franklin, J.F.; Frelich, L.E.; Harvey, B.J.; Higuera, P.; Mack, M.C.; Meentemeyer, R.K.; Metz, M.R.; Perry, G.L.; et al. Changing disturbance regimes, ecological memory, and forest resilience. Front. Ecol. Environ. 2016, 14, 369–378. [Google Scholar] [CrossRef]
- Flannigan, M.D.; Amiro, B.D.; Logan, K.A.; Stocks, B.J.; Wotton, B.M. Forest Fires and Climate Change in the 21ST Century. Mitig. Adapt. Strat. Glob. Chang. 2006, 11, 847–859. [Google Scholar] [CrossRef]
- Seidl, R.; Thom, D.; Kautz, M.; Martin-Benito, D.; Peltoniemi, M.; Vacchiano, G.; Wild, J.; Ascoli, D.; Petr, M.; Honkaniemi, J.; et al. Forest disturbances under climate change. Nat. Clim. Chang. 2017, 7, 395–402. [Google Scholar] [CrossRef] [PubMed] [Green Version]
- Meyer, G.A.; Wells, S.G.; Balling, R.C., Jr.; Jull, A.J.T. Response of alluvial systems to fire and climate change in Yellowstone National Park. Nature 1992, 357, 147–150. [Google Scholar] [CrossRef]
- Christensen, N.L.; Agee, J.K.; Brussard, P.F.; Hughes, J.; Knight, D.H.; Minshall, G.W.; Peek, J.M.; Pyne, S.J.; Swanson, F.J.; Thomas, J.W.; et al. Interpreting the Yellowstone Fires of 1988. BioScience 1989, 39, 678–685. [Google Scholar] [CrossRef]
- Turner, M.G.; Romme, W.H.; Gardner, R.H. Prefire heterogeneity, fire severity, and early postfire plant reestablishment in subalpine forests of Yellowstone National Park, Wyoming. Int. J. Wildland Fire 1999, 9, 21–36. [Google Scholar] [CrossRef] [Green Version]
- Romme, W.H.; Whitby, T.G.; Tinker, D.B.; Turner, M.G. Deterministic and stochastic processes lead to divergence in plant communities 25 years after the 1988 Yellowstone fires. Ecol. Monogr. 2016, 86, 327–351. [Google Scholar] [CrossRef]
- Anderson, J.E.; Romme, W.H. Initial floristics in lodgepole pine (Pinus contorta) forests following the 1988 Yellow-stone fires. Int. J. Wildland Fire 1991, 1, 119–124. [Google Scholar] [CrossRef]
- Turner, M.G.; Romme, W.H.; Reed, R.A.; Tuskan, G. Post-fire aspen seedling recruitment across the Yellowstone (USA) Landscape. Landsc. Ecol. 2003, 18, 127–140. [Google Scholar] [CrossRef]
- Tomback, D.F.; Anderies, A.J.; Carsey, K.S.; Powell, M.L.; Mellmann-Brown, S. Delayed seed germination in whitebark pine and regeneration patterns following the Yellowstone fires. Ecology 2001, 82, 2587–2600. [Google Scholar] [CrossRef]
- Santoro, A.; Venturi, M.; Piras, F.; Fiore, B.; Corrieri, F.; Agnoletti, M. Forest Area Changes in Cinque Terre National Park in the Last 80 Years. Consequences on Landslides and Forest Fire Risks. Land 2021, 10, 293. [Google Scholar] [CrossRef]
- U.S. Climate Data. Climate Yellowstone National Park—Wyoming. 2020. Available online: https://www.usclimatedata.com/climate/yellowstone-national-park/wyoming/united-states/uswy0292 (accessed on 18 May 2022).
- Romme, W.H.; DesPain, D.G. Historical Perspective on the Yellowstone Fires of 1988. BioScience 1989, 39, 695–699. [Google Scholar] [CrossRef]
- Minshall, G.W.; Robinson, C.T.; Lawrence, D.E. Postfire responses of lotic ecosystems in Yellowstone National Park, U.S.A. Can. J. Fish. Aquat. Sci. 1997, 54, 2509–2525. [Google Scholar] [CrossRef]
- Turner, M.G.; Romme, W.H.; Tinker, D.B. Surprises and lessons from the 1988 Yellowstone fires. Front. Ecol. Environ. 2003, 1, 351–358. [Google Scholar] [CrossRef]
- Ramsey, R.D. STATSGO Derived Soil Order in 11 Western States in USA. Data Basin. Utah State University. 2020. Available online: https://databasin.org/datasets/02f98e65b51e4cf48e4659a2adec1d9a/ (accessed on 18 May 2022). Data Basin Utah State University..
- Wyshnytzky, C.; Service, N.R.C.; Sieber, T. Natural Resources Conservation Service Programs & Examples Utah Projects. Map Products for Precipitation. U.S. Department of Agriculture. 2020. Available online: https://wwwdoi.wccorg/10.nrcs.usd1130/a.gov/gibs/p2020recipm-346423.html (accessed on 14 May 2022).
- National Park Service. Pre 1988 Cover Types of Yellowstone National Park. U.S. Department of the Interior. 2020. Available online: https://irma.nps.gov/Datastore/Reference/Profile/1045508 (accessed on 14 May 2022).
- Ramcharan, A.; Hengl, T.; Nauman, T.; Brungard, C.; Waltman, S.; Wills, S.; Thompson, J. Soil Property and Class Maps of the Conterminous United States at 100-Meter Spatial Resolution. Soil Sci. Soc. Am. J. 2018, 82, 186–201. [Google Scholar] [CrossRef] [Green Version]
- U.S. Forest Service. Fire Growth Maps for the 1988 Greater Yellowstone Area Fire. U.S. Department of Agriculture. 1994. Available online: https://www.fs.fed.us/rm/pubs_int/int_gtr304.pdf (accessed on 14 May 2022).
- Key, C.H.; Benson, N.C. Landscape assessment (LA). In FIREMON: Fire Effects Monitoring and Inventory System; US Department of Agriculture, Forest Service, Rocky Mountain Research: Fort Collins, CO, USA, 2006; pp. 1–55. Available online: https://www.fs.usda.gov/treesearch/pubs/24066 (accessed on 14 May 2022).
- Epting, J.; Verbyla, D.; Sorbel, B. Evaluation of remotely sensed indices for assessing burn severity in interior Alaska using Landsat TM and ETM+. Remote Sens. Environ. 2005, 96, 328–339. [Google Scholar] [CrossRef]
- IBM Corp. IBM SPSS Statistics for Windows, Version 28.0; IBM Corp: Armonk, NY, USA, 2021. [Google Scholar]
- O’Brien, R.M. A Caution Regarding Rules of Thumb for Variance Inflation Factors. Qual. Quant. 2007, 41, 673–690. [Google Scholar] [CrossRef]
- Peterson, G. Contagious Disturbance, Ecological Memory, and the Emergence of Landscape Pattern. Ecosystems 2002, 5, 329–338. [Google Scholar] [CrossRef]
- Turner, M.G.; Hargrove, W.W.; Gardner, R.H.; Romme, W.H. Effects of fire on landscape heterogeneity in Yellowstone National Park, Wyoming. J. Veg. Sci. 1994, 5, 731–742. [Google Scholar] [CrossRef] [Green Version]
- Stefanidis, S.; Alexandridis, V.; Ghosal, K. Assessment of Water-Induced Soil Erosion as a Threat to Natura 2000 Protected Areas in Crete Island, Greece. Sustainability 2022, 14, 2738. [Google Scholar] [CrossRef]
- Orgiazzi, A.; Panagos, P. Soil biodiversity and soil erosion: It is time to get married. Glob. Ecol. Biogeogr. 2018, 27, 1155–1167. [Google Scholar] [CrossRef]
- Abella, S.R.; Denton, C.W.; Steinke, R.W.; Brewer, D.G. Soil development in vegetation patches of Pinus ponderosa forests: Interface with restoration thinning and carbon storage. For. Ecol. Manag. 2013, 310, 632–642. [Google Scholar] [CrossRef]
- Bengtsson, J.; Angelstam, P.; Elmqvist, T.; Emanuelsson, U.; Folke, C.; Ihse, M.; Moberg, F.; Nyström, M. Reserves, resilience and dynamic landscapes. AMBIO A J. Hum. Environ. 2003, 32, 389–396. [Google Scholar] [CrossRef] [PubMed]
- U.S. Forest Service. Fire Resistance and Rengenration Characteristics of Northern Rockies Tree Species; U.S. Department of Agriculture: Washington, DC, USA, 2018. Available online: https://www.fs.fed.us/database/feis/pdfs/other/FireResistRegen.pdf (accessed on 14 May 2022).
- Brye, K.R. Soil physiochemical changes following 12 years of annual burning in a humid–subtropical tallgrass prairie: A hypothesis. Acta Oecologica 2006, 30, 407–413. [Google Scholar] [CrossRef]
- Úbeda, X.; Lorca, M.; Outeiro, L.R.; Bernia, S.; Castellnou, M. Effects of prescribed fire on soil quality in Mediterranean grassland (Prades Mountains, north-east Spain). Int. J. Wildland Fire 2005, 14, 379–384. [Google Scholar] [CrossRef]
- Williston, H.L.; Lafayette, R.A.; U.S. Forest Service Division of States and Private Forestry Southeastern Area. Species suitability and pH of soils in southern forests. For. Manag. Bull. 1978, 1978, 4. [Google Scholar] [CrossRef]
- Chen, C.R.; Condron, L.M.; Davis, M.R.; Sherlock, R.R. Effects of afforestation on phosphorus dynamics and biological properties in a New Zealand grassland soil. Plant Soil 2000, 220, 151–163. [Google Scholar] [CrossRef]
- Knight, H. Loss of nitrogen from the forest floor by burning. For. Chron. 1966, 42, 149–152. [Google Scholar] [CrossRef] [Green Version]
- Mroz, G.D.; Jurgensen, M.F.; Harvey, A.E.; Larsen, M.J. Effects of Fire on Nitrogen in Forest Floor Horizons. Soil Sci. Soc. Am. J. 1980, 44, 395–400. [Google Scholar] [CrossRef]
- Foster, D.R.; Knight, D.H.; Franklin, J.F. Landscape Patterns and Legacies Resulting from Large, Infrequent Forest Disturbances. Ecosystems 1998, 1, 497–510. [Google Scholar] [CrossRef]
- Drever, C.R.; Peterson, G.; Messier, C.; Bergeron, Y.; Flannigan, M. Can forest management based on natural disturbances maintain ecological resilience? Can. J. For. Res. 2006, 36, 2285–2299. [Google Scholar] [CrossRef] [Green Version]
- Nathan, R.; Katul, G.G.; Horn, H.S.; Thomas, S.M.; Oren, R.; Avissar, R.; Pacala, S.W.; Levin, S.A. Mechanisms of long-distance dispersal of seeds by wind. Nat. Int. Wkly. J. Sci. 2002, 418, 409–413. [Google Scholar] [CrossRef] [PubMed]


| General Factors | Specific Factors | Collected Data |
|---|---|---|
| Pre-fire drivers | Climate | t_mean, prec_a |
| Topographic | DEM, slope | |
| Biotic factors | pre-fire NDVI, pre-fire tree species | |
| Stable soil properties | soil order | |
| Post-fire characteristics | Changeable soil properties | percent_sand, percent_silt, Mg, OC, TN, pH, EC, BD |
| Severity Level | dNBR | Land Type |
|---|---|---|
| Unburned and Regrowth | –0.3000–0.1934 | Unburned |
| Moderate severity | 0.1935–0.4704 | Burned |
| High Severity | 0.4705–1.3500 |
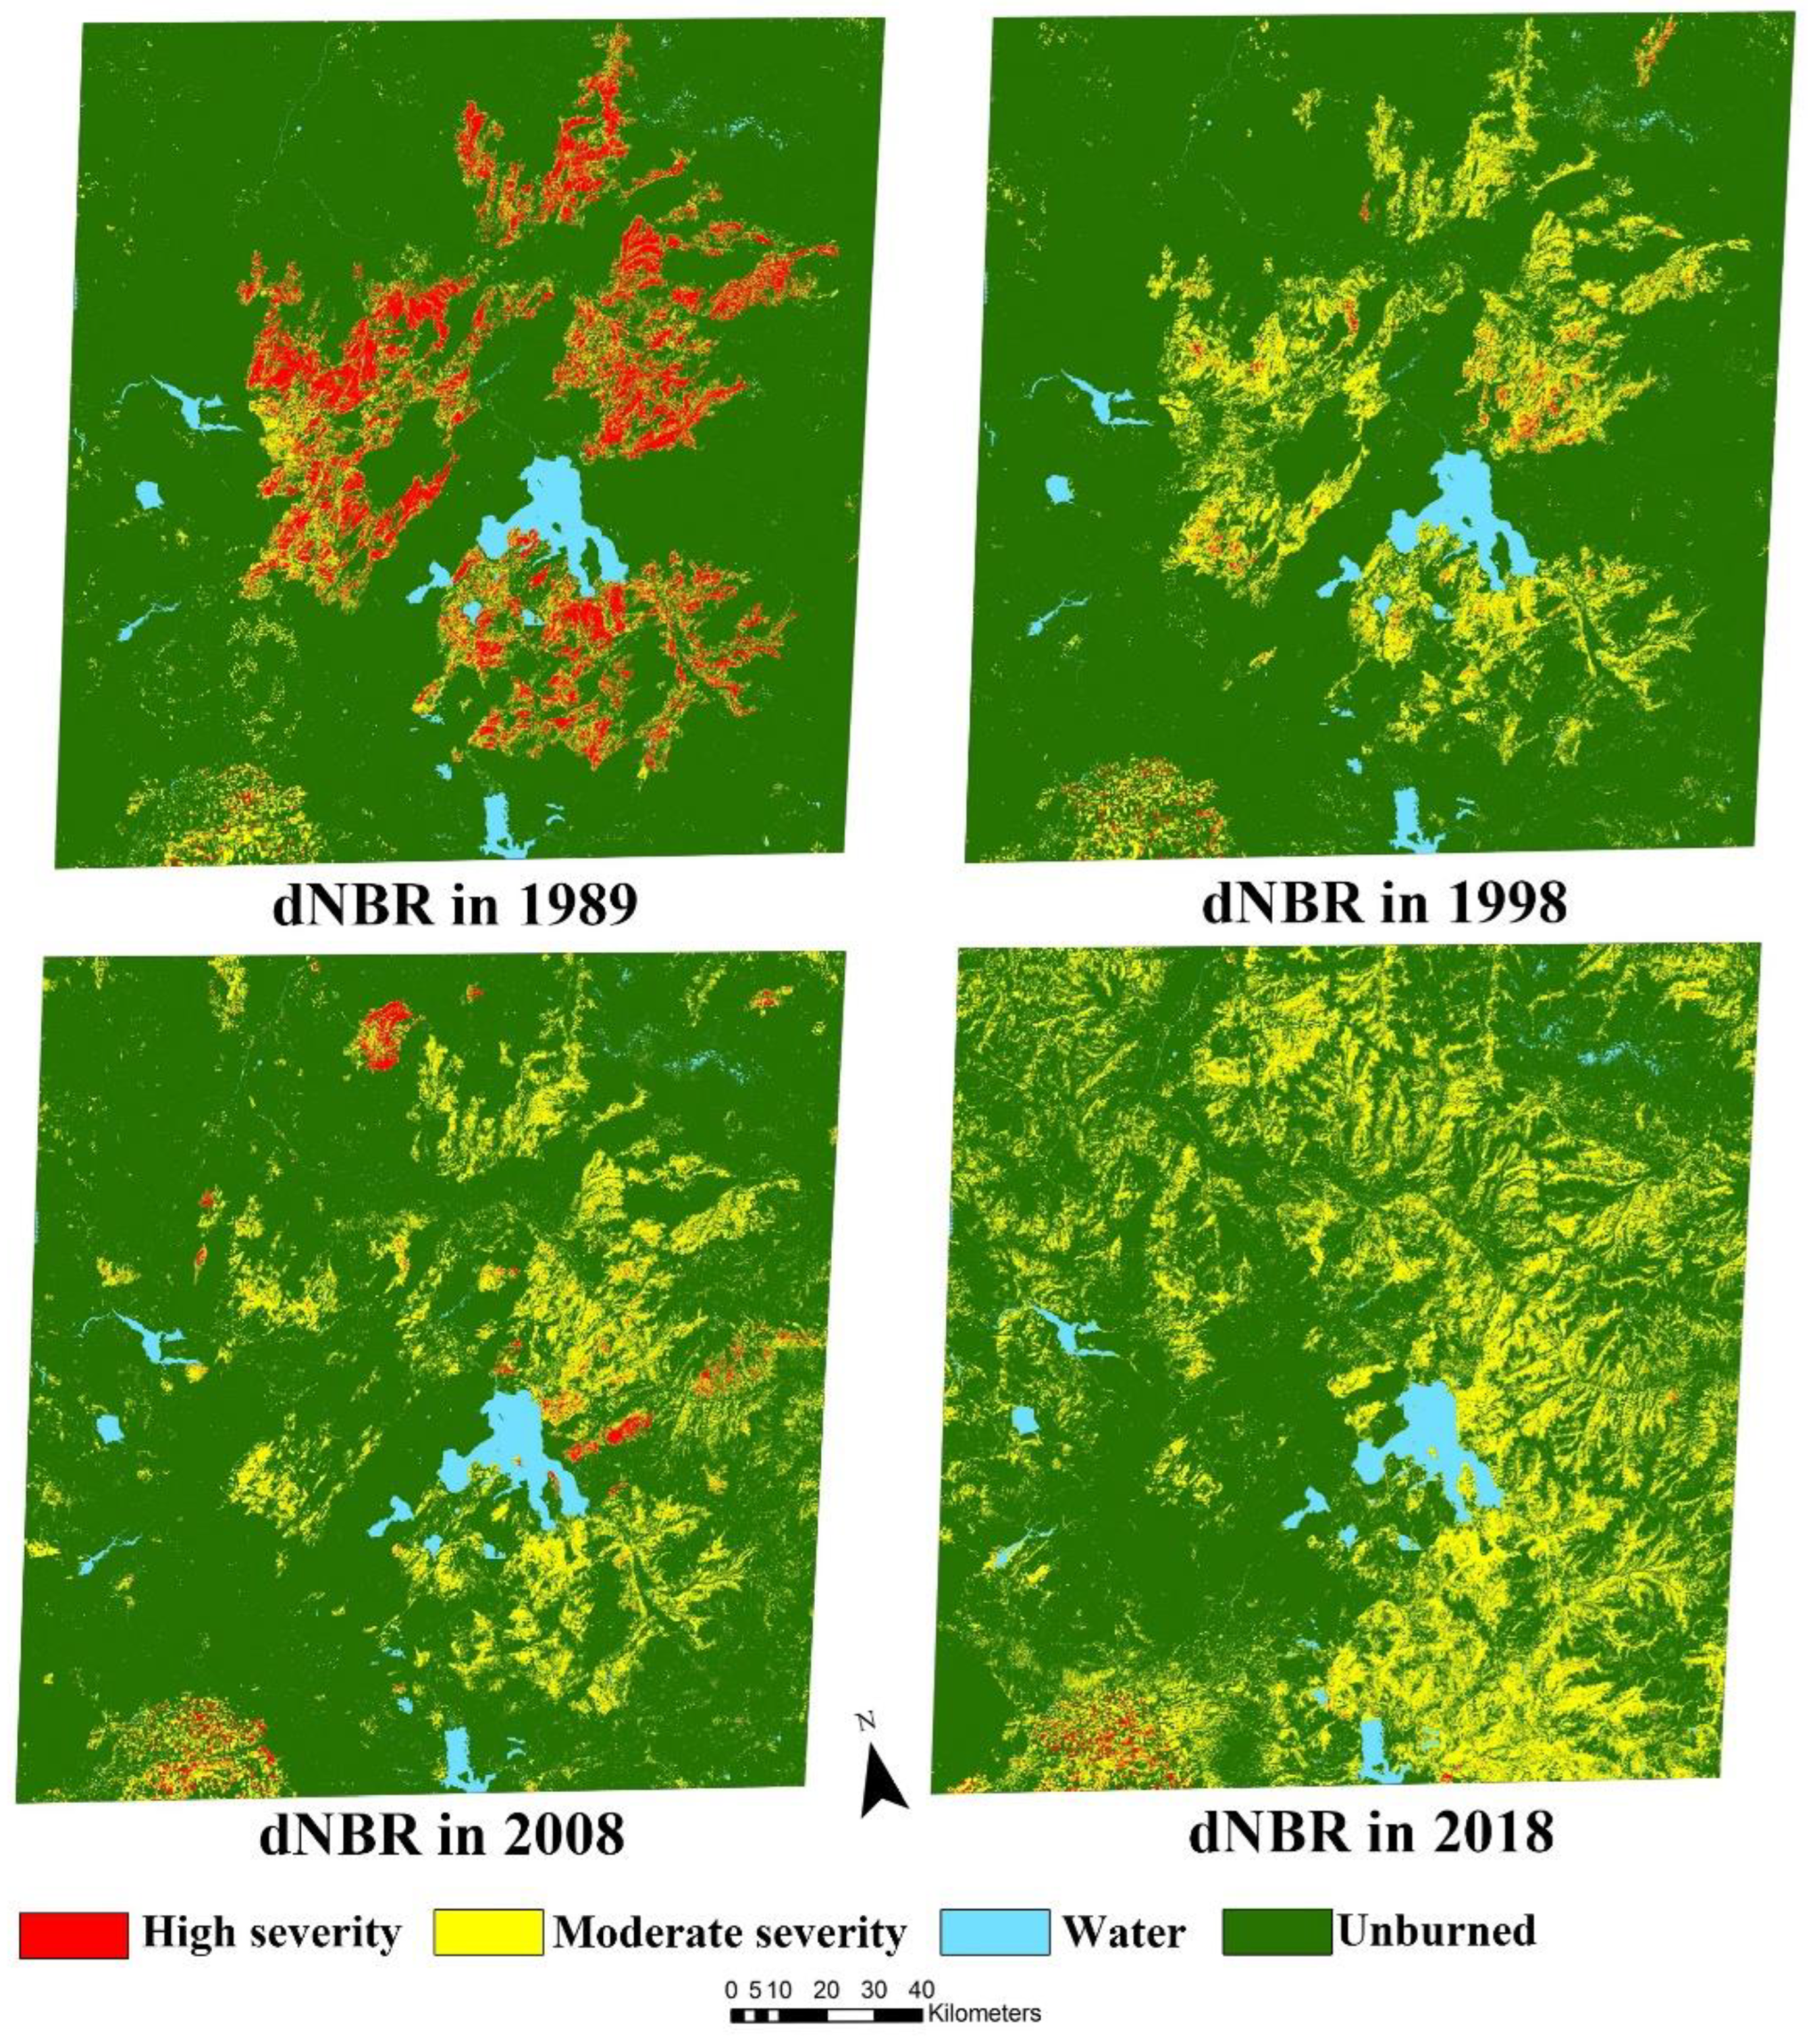
| Burn Severity | 1989 | 1998 | 2008 | 2018 |
|---|---|---|---|---|
| High severity | 2185.83 | 204.43 | 304.59 | 120.07 |
| Moderate severity | 2108.85 | 3125.45 | 3513.36 | 7316.63 |
| Unburned or regrowth | 25,030.72 | 25,690.72 | 25,504.85 | 21,930.45 |
| No data | 102.04 | 406.83 | 104.63 | 60.28 |
| Elevation | Slope | Mean_Pre | Sand | pH | K | Organic Carbon | N | |
|---|---|---|---|---|---|---|---|---|
| Aspen | 2103.32 | 10.06 | 22.71 | 40.83 | 6.36 | 168.04 | 188.52 | 76.69 |
| Douglas | 2213.18 | 19.15 | 22.63 | 44.33 | 6.22 | 179.72 | 217.86 | 67.63 |
| Lodgepole | 2422.60 | 8.03 | 33.33 | 43.70 | 5.72 | 176.71 | 218.42 | 61.13 |
| Subalpine | 2524.73 | 10.24 | 38.88 | 40.65 | 5.66 | 176.17 | 202.39 | 61.08 |
| Whitebark | 2740.67 | 16.99 | 37.82 | 44.53 | 5.72 | 171.20 | 189.94 | 60.65 |
| Recovery | Non-Recovery | |||||
|---|---|---|---|---|---|---|
| Coefficient | p | VIF | Coefficient | p | VIF | |
| constant | 954.58 | <0.01 | - | 618.94 | <0.01 | - |
| elevation | –0.15 | <0.01 | 4.73 | –0.10 | <0.01 | 3.74 |
| pre_NDVI | 0.40 | <0.01 | 1.08 | 0.45 | <0.01 | 1.07 |
| soil organic | 0.27 | <0.01 | 1.44 | –0.10 | <0.01 | 1.20 |
| annual precipitation | –2.73 | <0.01 | 2.07 | –0.66 | <0.01 | 2.40 |
| pH | –3.31 | <0.01 | 1.98 | –1.46 | <0.01 | 1.96 |
| t_max | –5.91 | <0.01 | 4.72 | –1.82 | 0.00 | 3.38 |
| total of nitrogen | –0.28 | <0.01 | 1.07 | –0.09 | <0.01 | 1.213 |
| K | –0.19 | <0.01 | 1.17 | –0.41 | <0.01 | 1.13 |
| t_min | 2.81 | <0.01 | 1.35 | - | <0.01 | - |
| sand | –0.53 | <0.01 | 1.33 | - | <0.01 | - |
| slope | –0.35 | <0.01 | 1.21 | –0.46 | <0.01 | 1.21 |
| silt | - | - | - | 0.50 | <0.01 | 1.15 |
| bulk density | - | - | - | –0.03 | <0.01 | 1.62 |
| Mg | - | - | - | 0.00 | 0.01 | 1.38 |
| Recovery | Non-Recovery | |||||
|---|---|---|---|---|---|---|
| TEST | MI/DF | Value | Prob | MI/DF | Value | Prob |
| Moran’s I (error) | 0.00 | 5.31 | <0.01 | 0.02 | 29.05 | <0.01 |
| Lagrange Multiplier (lag) | 1.00 | 2.63 | 0.11 | 1.00 | 59.97 | <0.01 |
| Robust LM (lag) | 1.00 | 9.59 | <0.01 | 1.00 | 3.29 | 0.07 |
| Lagrange Multiplier (error) | 1.00 | 15.90 | <0.01 | 1.00 | 346.89 | <0.01 |
| Robust LM (error) | 1.00 | 22.85 | <0.01 | 1.00 | 290.21 | <0.01 |
| Recovery | Non-Recovery | |||||
|---|---|---|---|---|---|---|
| Coefficience | p | Average | Coefficience | p | Average | |
| Constant | 731.89 | <0.01 | - | 910.37 | <0.01 | - |
| Elevation | –0.07 | <0.01 | 2440.50 | –0.17 | <0.01 | 2568.38 |
| Pre_NDVI | 0.31 | <0.01 | 0.37 | 0.77 | <0.01 | 0.38 |
| Soil organic | 0.05 | <0.01 | 196.95 | –0.34 | <0.01 | 165.61 |
| Annual precipitation | –3.72 | <0.01 | 33.57 | –1.22 | <0.01 | 34.32 |
| pH | –5.45 | <0.01 | 5.84 | –11.36 | <0.01 | 5.94 |
| Total of nitrogen | –0.63 | <0.01 | 63.50 | 0.34 | <0.01 | 60.97 |
| K | –0.24 | <0.01 | 172.47 | –0.66 | <0.01 | 171.96 |
| t_min | 5.02 | <0.01 | 22.60 | - | - | 22.54 |
| sand | –1.68 | <0.01 | 44.21 | - | - | 46.56 |
| slope | –0.56 | <0.01 | 11.26 | 1.81 | <0.01 | 13.99 |
| Spatial effect | –4.05 | <0.01 | - | –34.07 | <0.01 | - |
| Silt | - | - | 41.5 | 3.07 | <0.01 | 39.07 |
| Bulk density | - | - | 715.92 | 0.19 | <0.01 | 750.03 |
| Mg | - | - | 8443.10 | 0.01 | <0.01 | 10,435.46 |
| Pearson Chi-Square | df | Asymp. Sig. (2-Sided) | |
|---|---|---|---|
| Soil order | 2694.67 | 5 | <0.01 |
| Tree species | 6201.16 | 7 | <0.01 |
Publisher’s Note: MDPI stays neutral with regard to jurisdictional claims in published maps and institutional affiliations. |
© 2022 by the authors. Licensee MDPI, Basel, Switzerland. This article is an open access article distributed under the terms and conditions of the Creative Commons Attribution (CC BY) license (https://creativecommons.org/licenses/by/4.0/).
Share and Cite
Li, H.; Speer, J.H.; Thapa, I. Analyzing Resilience in the Greater Yellowstone Ecosystem after the 1988 Wildfire in the Western U.S. Using Remote Sensing and Soil Database. Land 2022, 11, 1172. https://doi.org/10.3390/land11081172
Li H, Speer JH, Thapa I. Analyzing Resilience in the Greater Yellowstone Ecosystem after the 1988 Wildfire in the Western U.S. Using Remote Sensing and Soil Database. Land. 2022; 11(8):1172. https://doi.org/10.3390/land11081172
Chicago/Turabian StyleLi, Hang, James H. Speer, and Ichchha Thapa. 2022. "Analyzing Resilience in the Greater Yellowstone Ecosystem after the 1988 Wildfire in the Western U.S. Using Remote Sensing and Soil Database" Land 11, no. 8: 1172. https://doi.org/10.3390/land11081172
APA StyleLi, H., Speer, J. H., & Thapa, I. (2022). Analyzing Resilience in the Greater Yellowstone Ecosystem after the 1988 Wildfire in the Western U.S. Using Remote Sensing and Soil Database. Land, 11(8), 1172. https://doi.org/10.3390/land11081172