Abstract
Urban expansion occurs in horizontal and vertical directions, but the construction process of a traditional planar ecological network (EN) ignores the ecological protection of the vertical space. Birds, as representative species in urbanized areas, are important for expanding the vertical analysis dimension of ENs. In this study, urban parks with good habitat quality were extracted as ecological sources from the perspective of birds. Then, 2D and 3D ecological resistance surfaces were constructed on the basis of the perspective of influencing bird migration, and planar and 3D ecological corridors were extracted and compared for analysis. Finally, accessibility analysis was performed to identify the parks in the study area that need priority protection. Results show that building height is an important factor affecting bird migration, and the introduction of 3D resistance surfaces into EN construction is important for adapting to the trend of vertical urban expansion. The combination of accessibility and EN analyses can help identify ecological spaces having the dual role of “species conservation” and “human well-being enhancement.” This study can provide a reference for refining the service species of ENs, exploring the vertical dimension of ENs, and improving the health of urban ecosystems and the rationality of urban planning.
1. Introduction
Cities play a central role in economic activities and social development in human civilization. On a global scale, urbanization occurs in a chaotic and almost uncontrollable manner [1]. Furthermore, the resulting population concentration places enormous pressure on ecosystems in and around cities, causing a series of ecological and environmental problems, such as climate change [2], vegetation loss [3], soil erosion [4], and habitat fragmentation [5]. The ecological network (EN) has been regarded as one of the important ways to alleviate the contradiction between economic development and ecological protection [6]. It is considered to be a sustainable landscape pattern that couples spatial patterns and ecological processes [7]. The construction of an EN can determine the priority areas of ecological services and sustainable development [8]. However, most current studies on ENs focus generally on nature and rarely on specific species. In fact, different species, due to their distinct habits, preferences, and social needs, reflect considerable differences in the construction methods and results of ENs, and even begin to show differences in urban spatial dimensions. Therefore, the study of ENs should concentrate more on targeting and specific analysis in accordance with different species and the existence of different ecological problems to construct diverse ENs.
A typical EN is composed of various landscape elements, such as sources, corridors, buffer zones, and ecological reconstruction areas [9]. After more than 20 years of development, the method of construction of ENs is stable, and mainly carried out via the logical paradigm of “source identification–corridor extraction–pattern construction.” The identification of ecological sources is mainly based on direct identification or evaluation index models [10], such as those of ecological stability [11] and landscape connectivity [12], as the source of species habitat and diffusion. Ecological corridors were originally designed to enhance the connectivity between natural habitats [13], generally referring to linear or strip elements having a certain width. Common construction methods include the minimum cumulative resistance (MCR) model [14], circuit theory [15], and individual-based modeling [10]. After the above landscape elements are identified, they are superimposed and connected to obtain the final EN. Nevertheless, various species differ in their habits, such that diverse factors should be considered in ecological source site selection. For example, such factors as dry season precipitation, altitude, and mean annual temperature are the main factors affecting the habitat suitability of snow leopards in the Everest National Nature Reserve [16], and habitat selection of moose in northeast China is mainly influenced by temperature, snow depth, and vegetation [17]. In addition to source area, distinct species also differ in the extraction of ecological corridors. Ecological corridors can be divided into river corridors [18], forest corridors [19], and wetland corridors [20]. The suitable corridor types for different wildlife vary, and the corridor width has diverse requirements. Furthermore, the structures and functions of natural landscape corridors based on biology and cultural landscape corridors based on humans are relatively different. Therefore, in constructing ENs, adopting the construction principles and methods in accordance with local conditions is helpful for different species to play a highly effective role.
Due to the shortage in land resources as a result of the urbanization process, urban expansion continues to develop from horizontal to vertical [21]. For example, due to 3D urban transportation and high-rise buildings, the urban spatial form changes dramatically. However, the traditional 2D landscape pattern analysis ignores the difference in urban vertical patterns [22]; thus, it is inadequate to describe the complex structure of a city. As a seasonal migratory animal in 3D space, birds can transport nutrients, energy, and other organisms between different locations to establish transportation and nutrition interaction in the entire ecosystem [23]. For birds, the altitude of vertical landscapes also affects their diversity and richness [24]. The bird diversity index can be used as an indicator to evaluate the health level of urban ecosystems to a certain extent. Nonetheless, given the strong sensitivity of birds to environmental changes, urbanization has caused significant interference to birds [25] and even directly changed the migration behavior of some bird communities [26]. Therefore, the construction of ENs from the perspective of birds is vital in expanding the vertical analysis dimension of ENs.
In areas experiencing rapid urbanization, those with better habitat quality are usually distributed around parks. The distribution of parks, environmental quality, and service provision are often considered the key factors of ecological source areas when constructing ENs to retain the original urban biodiversity and weaken the impact of urbanization on the ecosystem [27]. Parks are an integral part of the complex urban ecosystem [28]. In addition to providing ecological services, such as landscaping, air purification, and noise reduction [29], parks also increase social interaction and residents’ well-being, such as in terms of physical and mental health [30]. From the perspective of biological conservation, a park is an important habitat refuge [31]. Therefore, parks were further extracted as ecological source sites suitable for bird habitat on the basis of evaluation results, such as those relating to habitat quality.
In this study, the Fifth Ring Road of Beijing was taken as the research area. As the city’s commercial and financial center and transportation hub, the study area has witnessed rapid urban expansion and population gathering in cities in the past decades, posing a great threat to ecological security [32]. Implementing the dual concepts of environmental protection and economic growth to achieve the city’s green development remains a major challenge. In this paper, we propose expanding the EN construction dimension to a 3D space from the perspective of birds and introducing a 3D urban EN construction framework. The research objectives are as follows: (1) to identify ENs suitable for the survival and migration of birds as a target species; (2) to construct a 3D ecological resistance surface by considering the building height factor; and (3) to explore bird flight corridors. The proposed 3D EN is also compared with the 2D EN to demonstrate the necessity of expanding the EN dimension. This study can refine the service species of the EN and explore the vertical dimension of the EN to provide a reference for improving the health and ecological integrity of urban ecosystems.
2. Method
2.1. Study Area
The area inside Beijing’s Fifth Ring Road is a typical high-density built-up area with a high population density. It mainly includes Chaoyang, Haidian, Dongcheng, Xicheng, Fengtai, and Shijingshan, covering 667.04 km2. Large parks inside consist of the Summer Palace, Old Summer Palace, Chaoyang Park, and Olympic Forest Park. Rivers, lakes, and other water bodies include the Kunyu River, Hucheng River, Tonghui River, and Yuyuantan. According to data released by the Beijing Municipal Bureau of Landscape and Greening, 503 species of wild birds, including 27 under first-class national protection and 89 under second-class protection, have been recorded in Beijing. Furthermore, the World Bird Database documented 24 threatened bird species in Beijing. Given that Beijing is the center of the city’s economic and social construction, the Fifth Ring Road region is developing rapidly. Achieving regional ecological stability while developing rapidly and efficiently has become one of the key concerns of the region (Figure 1).
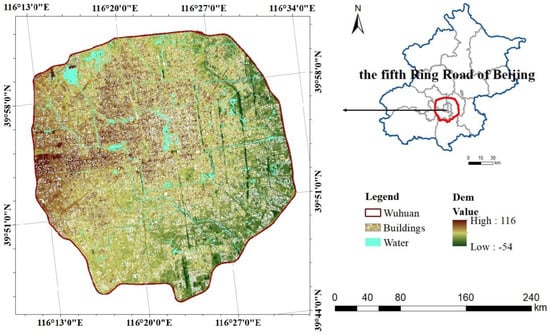
Figure 1.
Study area.
2.2. Data Source
The data sources of this paper are described in Table 1.

Table 1.
Data description.
2.3. Methodological Framework
The construction framework of the EN proposed in this study is shown in Figure 2 in accordance with the logic of “source identification–resistance surface construction–corridor extraction.” The specific construction steps were as follows: (1) Ecological source identification: Factors, such as park area, water availability, normalized difference vegetation index (NDVI), building density, and habitat quality patches from the InVEST model, were used to identify suitable habitats for birds as source sites. (2) Resistance surface construction: On the basis of the bird perspective, different resistance values were assigned to land use types, roads, and water systems in accordance with types. Then, the single factor resistance surface was integrated into the comprehensive resistance surface using the mosaic tool in ArcGIS 10.8. On this basis, the building height factor was then considered to build a 3D ecological resistance surface. (3) Corridor extraction: The MCR model was adopted. The cost distance and path tool of ArcGIS were used to preliminarily extract the corridor. Then, the gravity model was used to identify important ecological corridors. Finally, the Analytic Hierarchy Process (AHP) method [33] was used to evaluate and grade the importance of source sites and corridors. The ecological elements with higher importance were selected as the key objects for future planning.
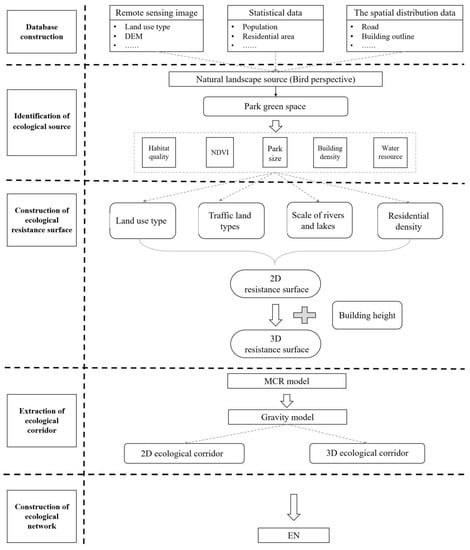
Figure 2.
Methodological framework.
2.4. Ecological Source Identification
This study regarded all parks in the five rings as the analysis object on the basis of the perspective of birds. First, the InVEST model was used to screen parks having good habitat quality, considering that bird species diversity has a significant positive correlation with park area [34] and NDVI [35], and that building scale is a serious impediment to bird migration [36,37]. Furthermore, the protected birds in Beijing have a trend of near-water distribution [38], and 24 threatened birds also show high bird abundance in water habitats [39]. Therefore, these factors were used as positive and negative influencing factors to screen parks further.
In this study, the habitat quality module of the InVEST model was used to evaluate habitat quality. Roads, railways, buildings, and unused land were regarded as threat sources. Habitat quality maps were drawn by setting the relative impacts of threat sources, the relative sensitivity of habitat types to threat sources, and the distance between habitat units and threat sources.
- ①
- : Effects of threat source on grid in habitat :where represents the distance between grids and , and denotes the maximum action distance of threat source .
- ①
- : Total threat level of grid in habitat type :where represents all the grids on the r threat grid graph, denotes a set of grids on the threat grid graph, signifies the weight of threat source , represents the level at which grid is close, and denotes the sensitivity of each habitat type to threat source .
- ①
- : Habitat quality of grid in habitat type :where and are proportional constants, and is the habitat suitability of habitat type j.
This study is based on previous studies [40,41,42], with the parameters presented in Table 2 and Table 3.
Table 2.
Threat factor weight and influence scope.
Table 3.
Habitat value and threat sensitivity of different land use types.
2.5. Ecological Corridor Extraction
2.5.1. Construction of Resistance Surface
The resistance coefficient reflects the difficulty of moving species from one ecological source to the next target ecological source [43]. In this study, natural and man-made interference factors were considered in the selection of 2D resistance factors on the basis of previous studies and the general situation of the research area [44,45]. The specific coefficients are shown in Table 4. Given that the five-ring region of Beijing is located in a plain area, the elevation and slope change within the study area are small. Thus, the two factors are not considered resistance factors. Because the distribution of traffic land can have a certain influence on the migration behavior of birds, the resistance factors, such as main roads, highways, and railroads, were selected to refine the resistance surface in this study. Moreover, human activities cause some interference to birds [36]. For example, increased human activity can lead to climate change, which negatively affects bird species and populations [46]. Therefore, in this study, the density of residential areas was also regarded as a resistance factor and the index was divided into five levels in accordance with the natural breakpoint method.
Table 4.
Resistance factor types and values.
On the basis of the construction of a 2D drag surface, in this study it was considered that the artificial structure of buildings will significantly impact bird flight [47] and even directly increase the probability of bird death [48]. According to statistics, buildings below 20 m have minimal effect on bird flight [44], whereas buildings above 100 m will form a considerable barrier [49]. Therefore, the indicators were graded with the actual building heights in the study area, and were used as important components of the 3D resistance surface.
2.5.2. MCR
Knaapen proposed the MCR model [50], and its operation was based on the cost path and cost distance tool of ArcGIS spatial analysis [51]. It can comprehensively consider factors such as environment, terrain, slope, and human disturbance, and calculate the cost of different landscape types between source and target [52] to simulate the path with the slightest cumulative resistance in species migration [45]. The formula is as follows:
where represents the value that spreads from source to a point, is the spatial distance between the target source and other sources , and denotes the diffusion resistance coefficient of source .
2.5.3. Gravity Model
After identifying all potential ecological corridors, to avoid redundancy, in this study, the gravity model was introduced to quantify the effectiveness and importance of potential ecological corridors to determine the most critical ecological corridors [53]. The formula is as follows:
where represents the strength of the connection between sources and , represents the weight value, denotes the standard resistance value of the potential corridor between sources and , signifies the highest of all potential corridors, is the cumulative resistance value of the corridor between sources and , represents a source area, and denotes a source resistance value.
2.6. Evaluation of the Importance of 3D EN
Based on the construction of a three-dimensional ecological network, the index system was constructed based on AHP hierarchical analysis in terms of three aspects: landscape pattern, ecological service function, and social service function, and scored by experts [54]. The comprehensive score of each ecological source and corridor was calculated according to the weight and score criteria, and the ecological source and corridor with higher comprehensive score were selected as the key objects for future planning practice.
The specific evaluation indicators are shown in Table 5.
Table 5.
Ecological network importance evaluation index.
3. Results
3.1. Identification of Ecological Source
The distribution of habitat quality, building height, rivers and lakes, and NDVI in the study area is shown in Figure 3. After superimposed analysis, 11 ecological source sites were screened, with an area of approximately 16.25 km2, accounting for approximately 2.44% of the total area of the study area (Figure 4). The source sites in the southwest of the study area are less distributed, whereas those in the other directions are more evenly distributed.
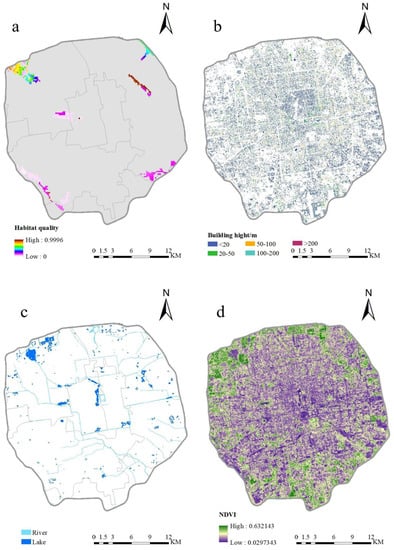
Figure 3.
Spatial pattern of ecological source evaluation index in the study area. Note: (a): habitat quality, (b): building height, (c): water, (d): NDVI.
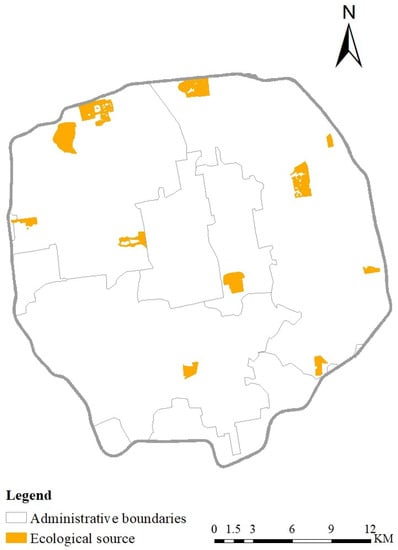
Figure 4.
Ecological source.
3.2. Ecological Corridor Extraction
3.2.1. Two-Dimensional Ecological Resistance Surfaces and Corridors
The final resistance surface is shown in Figure 5a. The resistance value increases in a circular pattern from the outside to the inside, and the central part of the study area has a larger resistance value due to the higher density of residential communities. The results of ecological corridor extraction are shown in Figure 5b. Fifteen ecological corridors are extracted, with fewer corridors in the southwest, of which the longest corridor is 23.08 km and the shortest corridor is 0.67 km.
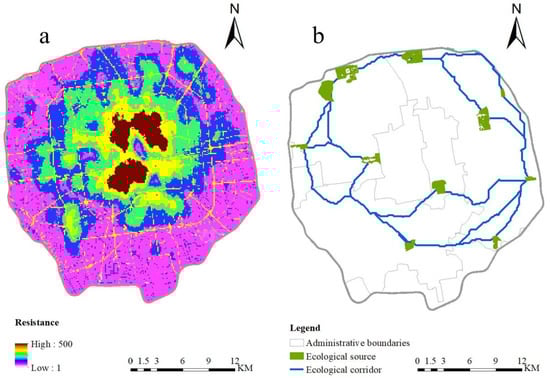
Figure 5.
Two-dimensional EN. Note: (a) 2D resistance surface; (b) ecological corridor.
3.2.2. 3D Ecological Resistance Surfaces and Corridors
The ecological resistance surface is shown in Figure 6a. Compared with the 2D resistance surface, the 3D resistance surface has more high-value areas in the entire study area due to the building height factor, but the overall distribution is similar to that of the 2D resistance surface. The results of ecological corridor extraction are shown in Figure 6b. Sixteen important ecological corridors exist in the study area, of which the longest corridor is 22.52 km and the shortest corridor is 0.68 km. The density of residential communities and building heights in the central area hinder the flight behavior of birds and reduce the connectivity of the entire EN. Compared with the 2D ecological corridors, the 3D corridors avoid highly built-up areas throughout the study area (Figure 6 and Figure 7) and are more realistic. Therefore, the building height factor should be considered when constructing ENs for bird species, to greatly benefit species conservation and improve the rationality of urban planning.
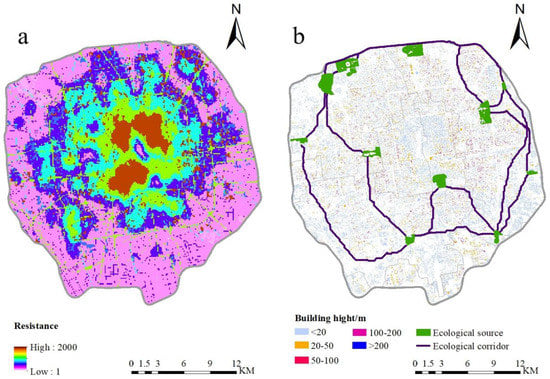
Figure 6.
Three-dimensional EN. Note: (a) 3D resistance surface; (b) ecological corridor.
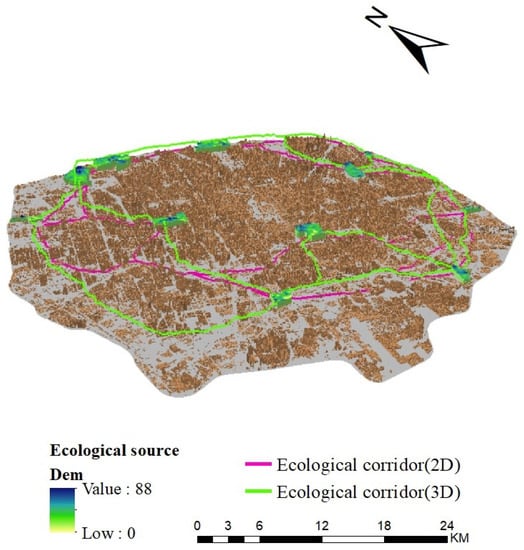
Figure 7.
Two- and three-dimensional ENs.
3.2.3. Evaluation of the Importance of 3D EN
The importance of ecological source areas and corridors is evaluated in Figure 8. in the central and northern parts of the study area, some ecological source areas have a high degree of importance due to their large size, the fact that they connect multiple corridors, and the fact that they are surrounded by dense population. The two corridors having greater lengths in the western and eastern parts of the study area have higher ecological importance and deserve attention. In future planning practice, the need to increase the installation of green roofs on buildings in the middle of the corridor should be considered [55], which would be more conducive to bird migration.
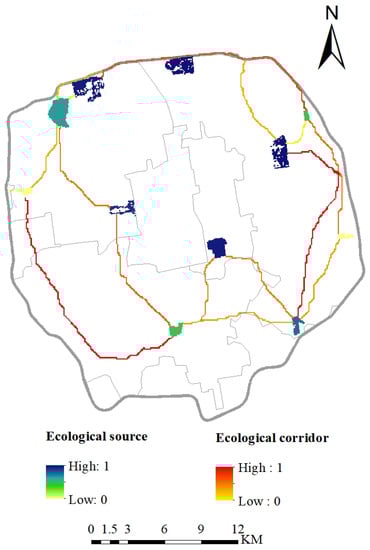
Figure 8.
Evaluation of the importance of 3D EN.
4. Discussion
4.1. Three-Dimensional EN
Rapid urbanization has caused social and environmental problems, but this does not mean that urban growth should be inhibited. These problems are due to the mode of urban growth rather than the city itself [56]. Therefore, people should pay considerable attention to how to regulate urban expansion behavior. In this context, an increasing number of regions inhibit the horizontal spread of cities by guiding vertical expansion [57], and urban growth has gradually become a dynamic 3D process, including horizontal and vertical expansion [58]. A city’s vertical development realizes the efficient use of land, requires less land to solve more human living and living problems, distributes more space, provides urban green space, and achieves the purpose of sustainable urban development. At the same time, an appropriate increase in the height of urban buildings reduces the impact of noise and provides an enhanced visual experience for human beings [59]. However, upward vertical expansion can also harm cities.
Sunlight and ventilation conditions decrease with the increase in building height [60], and the urban heat island effect increases with the growth in building height and density [61]. Furthermore, species migration is hindered. For example, the migratory process of birds, a representative species living in rapidly urbanized areas, is affected by the height of urban buildings because of their limited flight altitude. Similarly, the downward vertical expansion of cities cannot prevent damage to the natural ecological environment, which affects the quality of species habitats. The horizontal and vertical expansions of cities occur alternately [21]. The academic research on urban form, structure, characteristics, and other aspects also presents multidimensional features with the trend of urban development. For example, the analysis of urban landscape patterns breaks through the traditional plane angle by using the vertical information on the landscape to establish a 3D model to design the urban 3D landscape form [22]. Studying the impact of multidimensional urban morphology on temporal and spatial climate changes provides an adaptive strategy reference for alleviating the urban heat island effect and accelerating urban metabolism [62]. Faced with this trend, examination of species migration in urbanized areas also requires that the research perspective is upgraded to the spatial scope to more closely resemble the actual situation. Therefore, in this study, the representative species of birds that migrate in urban areas were selected, starting from their habitat preferences and living habits. The landscape resistance factor of building height was also introduced and a 3D urban EN was constructed. These features are of great significance to protect urban biodiversity and improve the rationality of urban planning.
4.2. Combining Accessibility Analysis with ENs
The starting point of EN construction is mostly the protection of species migration, considering that human beings are the masters of cities. Thus, constructing human-oriented spatial forms in the context of rapid urbanization is also not negligible. From the perspective of human beings, the construction of ENs is closely focused on providing cultural ecosystem services [63] and ensuring the rational layout of urban green infrastructure. Parks are an integral part of green infrastructure, regardless of whether they can provide convenient services for human beings and whether the value of providing services is directly related to the accessibility of residents to green space. In urban development, internal resources are prone to uneven social distribution to varying degrees, including the distribution of green space and other environmental resources [64]. Green space accessibility can satisfy the requirement of equal access to services in human spaces, and is one of the important evaluation indexes. The study of a city’s residents’ quality of life and city livability is of great significance [65]. Therefore, in this study, the accessibility of parks was evaluated on the basis of the construction of an EN of birds. The aim was to further synthesize the distribution of parks worthy of priority protection within cities in accordance with the dual perspectives of species conservation and human well-being enhancement, with a view to providing a reference for future urban green space planning.
4.2.1. Accessibility Analysis of Parks
Consideration of resource supply, population demand, and their interaction is necessary when evaluating the spatial accessibility of parks [66]. In this study, 2SFCA was introduced to calculate accessibility. Using this method, the serviceability of all parks in the study area was first calculated, and the accessibility of residential neighborhood points was then calculated and graded. The residential areas with high accessibility levels were screened out. Considering that the service radius of the residential park in the Urban Green Space Classification Standard is 0.5–1 km, a buffer zone of 1000 m was used for the residential area having a high accessibility level. Next, adjacent parks were inversely selected. Finally, the result was regarded as the ecological source of a cultural–ecological network.
2SFCA regards parks as the supply side and residential areas as the demand side, and evaluates the accessibility of parks on the basis of this perspective, which can be achieved in two steps.
The first step is to search for all demand points within the search radius of for each supply point and calculate the supply–demand ratio , namely, the service capacity of the parks.
In the formula, represents the supply scale of supply point , expressed by the park area. denotes the size of demand point , which is represented by the population. is the Gaussian function. signifies the distance between demand point and supply point .
The second step is to search for all supply points within the search radius of for each demand point and sum all supply and demand ratios to obtain the accessibility of point .
In the formula, represents the accessibility index of demand point ; the larger the value, the better the accessibility of location .
4.2.2. Analysis Results
Figure 9 shows the spatial pattern of park accessibility in the research area, divided into four levels: 500, 1000, 2000, and 5000 m. The area within 500 m of the nearest park is 138.13 km2, accounting for 20.71% of the total area. The service area within 500–1000 m of the park is 102.89 km2, accounting for 15.42% of the total area. The service area within 1000–2000 m of the park is 106.19 km2, accounting for 15.92% of the total area. The service area within 2000–5000 m of the park is 119.94 km2, accounting for 17.98% of the total area. In accordance with the results, the accessibility degree of 6770 residential communities in the study area was quantitatively analyzed and graded. The results decrease sequentially from I to III. A total of 568 grade I residential communities are mainly distributed in the middle and north of the study area. After the reverse selection of the parks having grade I accessible residential areas, 12 parks were finally obtained, covering an area of approximately 13.76 km2, accounting for 2.20% of the total research area, and being evenly distributed in the research area.
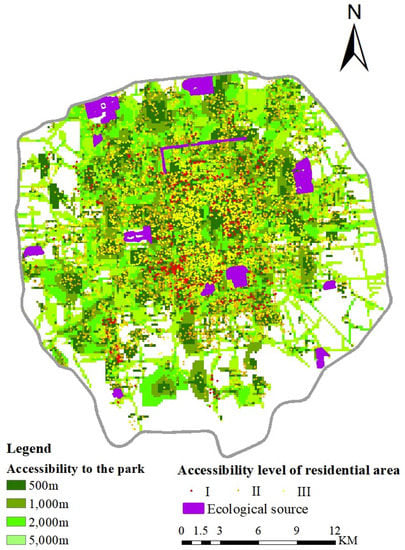
Figure 9.
Accessibility analysis results.
A comparative analysis of the ecological source sites for birds and the accessibility of high-value parks demonstrates that they overlap in an area accounting for 56.87% of the total (Figure 10). These are mainly distributed north of the study area, which mainly includes the Olympic Forest Park, Yuanming Park, Chaoyang Park, Tiantan Park, Yuyuantan Park, and Hongbo Park. These parks have beautiful ecological environments and few artificial buildings, and are highly valued in terms of habitat quality and humanistic aesthetics. Therefore, whether from the perspective of wildlife protection or human well-being improvement, the existence of these parks is of great significance, and they need critical protection in future urban planning and ecological restoration.
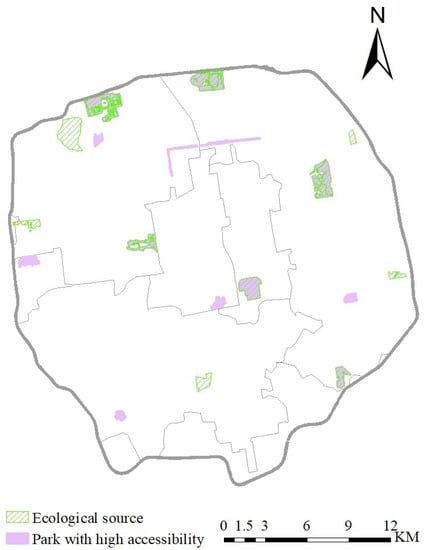
Figure 10.
Comparison of ecological sources and parks having high accessibility.
4.3. Limitations and Prospects
From the perspective of birds, this study ignored the differences between different species of birds. For example, from the point of view of the living environment, the habitat selection of water birds is more inclined to wetlands than that of land birds. Birds can be divided into grain-eating, insect-eating, omnivorous, and meat-eating birds. Grain-eating birds are common around cultivated land, whereas insect-eating birds are distributed around forest land. Furthermore, this study only considered the species diversity of birds while ignoring the number of birds when selecting habitats. Studies have shown a positive correlation between the number of birds and insects, and no significant relationship between road distance and green space area [67]. Therefore, in analyzing parks, the number and distribution of surrounding insects should also be considered.
On the basis of the flight altitude of birds, this study regarded the height of buildings as the main resistance factor of the 3D EN. The obstruction to the flight height of birds caused by the height of buildings, which limits the living environment of birds, was considered. This perspective is scientific and reasonable but not rigorous. In the actual situation, a particular gap is observed between different buildings. Further research is needed to determine whether birds can independently choose a path to navigate around buildings using these gaps, and thereby reduce the influence of building height on their flight behavior. Whether the glass mirrors of high-rise buildings in cities, which reflect strong light, affect the selection of birds’ autonomous flight trajectories should also be studied. Under such conditions, optimally coordinating the proportions of spacing and height between buildings still needs additional research.
Furthermore, human travel patterns and times are ignored when conducting accessibility analysis. The accuracy of the results will be further improved if the isochrones are drawn based on walking time and the availability of urban green spaces is then assessed [68].
In this study, we continued our previous research in constructing ecological networks using models having high recognition but lacking some innovations. Society is currently in a digital era, and machine learning and artificial intelligence have been widely used in various fields. Many more efficient and faster models have been applied to climate prediction and air pollution prediction [69,70]. The operation and application of these new models need to be further investigated in the future in order to better utilize high-technology tools to improve urban ecological environments.
5. Conclusions
As a result of rapid urbanization, cities gradually expand vertically, and the form and structure of cities change accordingly. The research dimension of urban ENs should also be expanded to a 3D direction in this context. At the same time, methods and models based on different species’ perspectives vary in pattern construction. Therefore, in this study, a framework was designed for the construction of an urban EN in planar and 3D perspectives for bird species to verify the rationality of the existence of a 3D EN. In this study, a total of 11 ecological source sites for bird species having an area of approximately 16.25 km2 were identified, and 15 and 16 important ecological corridors were identified on the basis of 2D and 3D resistance surfaces, respectively. Our results suggest that the construction of ENs for different species should be discussed in accordance with their habits. Furthermore, by expanding the research dimension to three dimensions, the construction of bird ENs more closely resembles reality. The framework we constructed is of great significance for protecting birds and improving the rationality of park layout, and can provide a reference for ecological protection and restoration in urban areas and for urban planning. It also has certain reference significance for realizing the sustainable development goals of the United Nations.
Author Contributions
Conceptualization, Y.Y.; methodology, Y.Y.; software, Y.Y.; validation, Y.Y., Y.Z. and Z.F.; formal analysis, Y.Y.; investigation, Y.Y.; resources, Y.Y.; data curation, Y.Y.; writing—original draft preparation, Y.Y.; writing—review and editing, Y.Y.; visualization, Y.Y.; supervision, K.W.; project administration, Z.F.; funding acquisition, Z.F. All authors have read and agreed to the published version of the manuscript.
Funding
This research was funded by the National Natural Science Foundation of China (No. 41901261), the Beijing Social Science Fund Project (No. 19GLC056) and the Fundamental Research Funds for the Central Universities of China (No. 35832020024).
Institutional Review Board Statement
Not applicable.
Informed Consent Statement
Not applicable.
Data Availability Statement
All data and materials are available upon request.
Acknowledgments
Thanks to all the co-authors for all their work on this article, and also to all the reviewers for their comments, which helped to improve the quality of this work.
Conflicts of Interest
The authors declare no conflict of interest.
References
- Choi, H.; Song, Y.; Kang, W.; Thorne, J.H.; Song, W.; Lee, D.K. LiDAR-derived three-dimensional ecological connectivity mapping for urban bird species. Landsc. Ecol. 2021, 36, 581–599. [Google Scholar] [CrossRef]
- Feng, Y.X.; Li, G.D. Interaction between urbanization and eco-environment in the Tibetan Plateau. J. Geogr. Sci. 2021, 31, 298–324. [Google Scholar] [CrossRef]
- Monalisa, P. Impact of urbanization on moth (Insecta: Lepidoptera: Heterocera) diversity across different urban landscapes of Delhi, India. Acta Ecol. Sin. 2021, 41, 204–209. [Google Scholar]
- Devraj, C.; Lalit, K. Land use change affects water erosion in the Nepal Himalayas. PLoS ONE 2020, 15, e0231692. [Google Scholar] [CrossRef]
- Liu, W.; Yu, D.D.; Yi, J.F.; Cao, Y.; Li, X.F.; Xu, H.G. Effects of spatial fragmentation on the elevational distribution of bird diversity in a mountain adjacent to urban areas. Ecol. Evol. 2022, 12, e9051. [Google Scholar] [CrossRef] [PubMed]
- Jin, X.X.; Wei, L.Y.; Wang, Y.; Lu, Y.Q. Construction of ecological security pattern based on the importance of ecosystem service functions and ecological sensitivity assessment: A case study in Fengxian County of Jiangsu Province, China. Environ. Dev. Sustain. 2020, 23, 563–590. [Google Scholar] [CrossRef]
- Jiang, H.; Peng, J.; Dong, J.; Zhang, Z.; Xu, Z.; Meersmans, J. Linking ecological background and demand to identify ecological security patterns across the Guangdong-Hong Kong-Macao Greater Bay Area in China. Landsc. Ecol. 2021, 36, 2135–2150. [Google Scholar] [CrossRef]
- Peng, J.; Yang, Y.; Liu, Y.X.; Hu, Y.N.; Du, Y.Y.; Meersmans, J.; Qiu, S.J. Linking ecosystem services and circuit theory to identify ecological security patterns. Sci. Total Environ. 2018, 644, 781–790. [Google Scholar] [CrossRef]
- Tillmann, J.E. Habitat Fragmentation and Ecological Networks in Europe. Oekom Verlag. 2005, 14, 119–123. [Google Scholar] [CrossRef]
- Xiao, S.; Wu, W.; Guo, J.; Ou, M.; Pueppke, S.G.; Ou, W.; Tao, Y. An evaluation framework for designing ecological security patterns and prioritizing ecological corridors: Application in Jiangsu Province, China. Landsc. Ecol. 2020, 35, 2517–2534. [Google Scholar] [CrossRef]
- Wang, C.; Yu, C.; Chen, T.; Feng, Z.; Hu, Y.; Wu, K. Can the establishment of ecological security patterns improve ecological protection? An example of Nanchang, China. Sci. Total Environ. 2020, 740, 140051. [Google Scholar] [CrossRef] [PubMed]
- Ma, B.B.; Chen, Z.A.; Wei, X.J.; Li, X.Q.; Zhang, L.T. Comparative ecological network pattern analysis: A case of Nanchang. Environ. Sci. Pollut. Res. 2022, 29, 37423–37434. [Google Scholar] [CrossRef] [PubMed]
- Di, Z.; Wei, S. Identifying Ecological Corridors and Networks in Mountainous Areas. Int. J. Environ. Res. Public Health 2021, 18, 4797. [Google Scholar] [CrossRef]
- Huang, L.; Wang, D.R.; He, C.L. Ecological security assessment and ecological pattern optimization for Lhasa city (Tibet) based on the minimum cumulative resistance model. Environ. Sci. Pollut. Res. 2022. [Google Scholar] [CrossRef] [PubMed]
- Zhai, T.L.; Huang, L.Y. Linking MSPA and Circuit Theory to Identify the Spatial Range of Ecological Networks and Its Priority Areas for Conservation and Restoration in Urban Agglomeration. Front. Ecol. Evol. 2022, 10, fevo.2022.828979. [Google Scholar] [CrossRef]
- Bai, D.F.; Chen, P.J.; Atzeni, L.; Cering, L.; Li, Q.; Shi, K. Assessment of habitat suitability of the snow leopard (Panthera uncia) in Qomolangma National Nature Reserve based on MaxEnt modeling. Zool. Res. 2018, 39, 373–386. [Google Scholar] [CrossRef]
- Dou, H.L.; Jiang, G.S.; Stott, P.; Piao, R.Z. Climate change impacts population dynamics and distribution shift of moose (Alces alces) in Heilongjiang Province of China. Ecol. Res. 2013, 28, 625–632. [Google Scholar] [CrossRef]
- Irene, G.; Marta, B.A.; Xavier, G.; Pere, V.C. Perception assessment of environmental factors related to leisure-time physical activity in an urban stream corridor. Leis. Stud. 2020, 39, 688–705. [Google Scholar] [CrossRef]
- Pang, X.; Mörtberg, U.; Sallnäs, O.; Trubins, R.; Nordström, E.M.; Böttcher, H. Habitat network assessment of forest bioenergy options using the landscape simulator LandSim—A case study of Kronoberg, southern Sweden. Ecol. Model. 2017, 345, 99–112. [Google Scholar] [CrossRef]
- Dai, C.; Guo, H.C.; Tan, Q.; Ren, W. Development of a constructed wetland network for mitigating nonpoint source pollution through a GIS-based watershed-scale inexact optimization approach. Ecol. Eng. 2016, 96, 94–108. [Google Scholar] [CrossRef]
- Zhang, W.X.; Li, W.D.; Zhang, C.R.; Ouimet, W.B. Detecting horizontal and vertical urban growth from medium resolution imagery and its relationships with major socioeconomic factors. Int. J. Remote Sens. 2017, 38, 3704–3734. [Google Scholar] [CrossRef]
- Chen, Z.; Xu, B. Enhancing urban landscape configurations by integrating 3D landscape pattern analysis with people’s landscape preferences. Environ. Earth Sci. 2016, 75, 1018. [Google Scholar] [CrossRef]
- Bauer, S.; Hoye, B.J. Migratory Animals Couple Biodiversity and Ecosystem Functioning Worldwide. Science 2014, 344, 1242552. [Google Scholar] [CrossRef] [PubMed]
- Flaspohler, D.J.; Giardina, C.P.; Asner, G.P.; Hart, P.; Price, J.; Lyons, C.K.A.; Castaneda, X. Long-term effects of fragmentation and fragment properties on bird species richness in Hawaiian forests. Biol. Conserv. 2009, 143, 280–288. [Google Scholar] [CrossRef]
- Sulaiman, S.; Mohamad, N.H.N.; Idilfitri, S. Contribution of Vegetation in Urban Parks as Habitat for Selective Bird Community. Procedia—Soc. Behav. Sci. 2013, 85, 267–281. [Google Scholar] [CrossRef]
- Marzluff, J.M. A decadal review of urban ornithology and a prospectus for the future. IBIS 2017, 159, 1–13. [Google Scholar] [CrossRef]
- Anjoulie, B.; Christoph, S. Urban wild food foraging locations: Understanding selection criteria to inform green space planning and management. Urban For. Urban Green. 2022, 73, 127596. [Google Scholar] [CrossRef]
- Li, Q.Z.; Thapa, S.; Hu, X.J.; Luo, Z.W.; Gibson, D.J. The Relationship between Urban Green Space and Urban Expansion Based on Gravity Methods. Sustainability 2022, 14, 5396. [Google Scholar] [CrossRef]
- Chiesura, A. The role of urban parks for the sustainable city. Landsc. Urban Plan. 2003, 68, 129–138. [Google Scholar] [CrossRef]
- Eisazadeh, N.; Faizi, M. The Impact of Urban Parks and Green Spaces on Citizens’ Health and Quality of Life. Int. J. Environ. Cult. Econ. Soc. Sustain. Annu. Rev. 2008, 4, 17–24. [Google Scholar]
- Nielsen, A.B.; Bosch, M.V.D.; Maruthaveeran, S.; Bosch, C.K.V.D. Species richness in urban parks and its drivers: A review of empirical evidence. Urban Ecosyst. 2014, 17, 305–327. [Google Scholar] [CrossRef]
- Zhang, Y.H.; Yin, P.Y.; Li, X.C.; Niu, J.G.; Wang, Y.X.; Cao, W.T.; Huang, J.X.; Chen, H.; Yao, X.C.; Yu, L.; et al. The divergent response of vegetation phenology to urbanization: A case study of Beijing city, China. Sci. Total Environ. 2022, 803, 150079. [Google Scholar] [CrossRef] [PubMed]
- Li, Z.M.; Fan, Z.X.; Shen, S.G. Urban Green Space Suitability Evaluation Based on the AHP-CV Combined Weight Method: A Case Study of Fuping County, China. Sustainability 2018, 10, 2656. [Google Scholar] [CrossRef]
- Yang, X.; Tan, X.; Chen, C.; Wang, Y. The influence of urban park characteristics on bird diversity in Nanjing, China. Avian Res. 2020, 11, 475–483. [Google Scholar] [CrossRef]
- Bar-Massada, A.; Wood, E.M.; Pidgeon, A.M.; Radeloff, V.C. Complex effects of scale on the relationships of landscape pattern versus avian species richness and community structure in a woodland savanna mosaic. Ecography 2012, 35, 393–411. [Google Scholar] [CrossRef]
- Hager, S.B.; Cosentino, B.J.; Aguilar-Gómez, M.A.; Anderson, M.L.; Bakermans, M.; Boves, T.J.; Brandes, D.; Butler, M.W.; Butler, E.M.; Cagle, N.L.; et al. Continent-wide analysis of how urbanization affects bird-window collision mortality in North America. Biol. Conserv. 2017, 212, 209–215. [Google Scholar] [CrossRef]
- Van Doren, B.M.; Willard, D.E.; Hennen, M.; Horton, K.G.; Stuber, E.F.; Sheldon, D.; Sivakumar, A.H.; Wang, J.; Farnsworth, A.; Winger, B.M. Drivers of fatal bird collisions in an urban center. Proc. Natl. Acad. Sci. USA 2021, 118, e2101666118. [Google Scholar] [CrossRef]
- Li, Y.; Yuan, L.; Shi, Y.; Zhang, Z.M.; Ji, J.W.; Zhou, X.W.; Bao, W.D. GIS analysis of the distribution dynamics of rare birds in Beijing. J. Beijing For. Univ. 2015, 37, 119–125. [Google Scholar] [CrossRef]
- Huang, Y.; Gu, Y.Y.; Li, X.S.; Wen, C. The identification and assessment of habitats of threatened birds in plain areas of Beijing. Landsc. Archit. 2019, 26, 32–36. [Google Scholar] [CrossRef]
- Tang, Y.; Gao, C.; Wu, X. Urban Ecological Corridor Network Construction: An Integration of the Least Cost Path Model and the InVEST Model. ISPRS Int. J. Geo-Inf. 2020, 9, 33. [Google Scholar] [CrossRef]
- Wu, J.S.; Li, X.C.; Luo, Y.H.; Zhang, D.N. Spatiotemporal effects of urban sprawl on habitat quality in the Pearl River Delta from 1990 to 2018. Sci. Rep. 2021, 11, 13981. [Google Scholar] [CrossRef] [PubMed]
- Zhang, P. Spatiotemporal Features of the Three-Dimensional Architectural Landscape in Qingdao, China. PLoS ONE 2017, 10, e0137853. [Google Scholar] [CrossRef] [PubMed]
- Guo, R.; Wu, T.; Liu, M.R.; Huang, M.S.; Stendardo, L.; Zhang, Y.T. The Construction and Optimization of Ecological Security Pattern in the Harbin-Changchun Urban Agglomeration, China. Int. J. Environ. Res. Public Health 2019, 16, 1190. [Google Scholar] [CrossRef] [PubMed]
- Liu, Z.; Huang, Q.; Tang, G. Identification of urban flight corridors for migratory birds in the coastal regions of Shenzhen city based on three-dimensional landscapes. Landsc. Ecol. 2020, 36, 2043–2057. [Google Scholar] [CrossRef]
- Ye, H.; Yang, Z.; Xu, X. Ecological Corridors Analysis Based on MSPA and MCR Model—A Case Study of the Tomur World Natural Heritage Region. Sustainability 2020, 12, 959. [Google Scholar] [CrossRef]
- Sun, C.Z.; Zhen, L.; Wang, C.; Yan, B.Y.; Cao, X.C.; Wu, R.Z. Impacts of ecological restoration and human activities on habitat of overwintering migratory birds in the wetland of Poyang Lake, Jiangxi Province, China. J. Mt. Sci. 2015, 12, 1302–1314. [Google Scholar] [CrossRef]
- Longcore, T.; Rich, C.; Mineau, P.; MacDonald, B.; Bert, D.G.; Sullivan, L.M.; Mutrie, E.; Gauthreaux, S.A.; Avery, M.L.; Crawford, R.L.; et al. Avian mortality at communication towers in the United States and Canada: Which species, how many, and where? Biol. Conserv. 2013, 158, 410–419. [Google Scholar] [CrossRef]
- Bowlin, M.S.; Enstrom, D.A.; Murphy, B.J.; Plaza, E.; Jurich, P.; Cochran, J. Unexplained altitude changes in a migrating thrush: Long-flight altitude data from radio-telemetry. Auk 2015, 132, 808–816. [Google Scholar] [CrossRef]
- Hager, S.B.; Cosentino, B.J.; McKay, K.J.; Monson, C.; Zuurdeeg, W.; Blevins, B. Window Area and Development Drive Spatial Variation in Bird-Window Collisions in an Urban Landscape. PLoS ONE 2013, 8, e53371. [Google Scholar] [CrossRef]
- Knaapen, J.P.; Scheffer, M.; Harms, B. Estimating habitat isolation in landscape planning. Landsc. Urban Plan. 1992, 23, 1–16. [Google Scholar] [CrossRef]
- Liu, C.; Jia, W.; Lu, S.; Lv, C.D. Construction and optimization of green space ecological networks in urban fringe areas: A case study with the urban fringe area of Tongzhou district in Beijing. J. Clean. Prod. 2020, 276, 124266. [Google Scholar] [CrossRef]
- Li, X.; Wang, M.; Liu, X.; Chen, Z.; Wei, X.; Che, W. MCR-Modified CA–Markov Model for the Simulation of Urban Expansion. Sustainability 2018, 10, 3116. [Google Scholar] [CrossRef]
- Miao, Z.; Pan, L.; Wang, Q.; Chen, P.; Yan, C.; Liu, L. Research on Urban Ecological Network Under the Threat of Road Networks—A Case Study of Wuhan. ISPRS Int. J. Geo-Inf. 2019, 8, 342. [Google Scholar] [CrossRef]
- Turgay, D. Determination of ecological networks for vegetation connectivity using GIS & AHP technique in the Mediterranean degraded karst ecosystems. Journal of Arid Environments. 2021, 188. [Google Scholar] [CrossRef]
- Wang, L.W.; Wang, H.; Wang, Y.C.; Che, Y.; Ge, Z.W.; Mao, L.F. The relationship between green roofs and urban biodiversity: A systematic review. Biodivers Conserv. 2022, 31, 1771–1796. [Google Scholar] [CrossRef]
- Cho, C.J. The Korean growth-management programs: Issues, problems and possible reforms. Land Use Policy 2002, 19, 13–27. [Google Scholar] [CrossRef]
- Galster, G.; Hanson, R.; Ratcliffe, M.R.; Wolman, H.; Coleman, S.; Freihage, J. Wrestling sprawl to the ground: Defining and measuring an elusive concept. Hous. Policy Debate 2001, 12, 681–717. [Google Scholar] [CrossRef]
- Shi, L.Y.; Shao, G.F.; Cui, S.H.; Li, X.Q.; Lin, T.; Yin, K.; Zhao, J.Z. Urban three-dimensional expansion and its driving forces-A case study of Shanghai, China. Chin. Geogr. Sci. 2009, 19, 291–298. [Google Scholar] [CrossRef]
- Munn, K.; Dragicevic, S. Spatial multi-criteria evaluation in 3D context: Suitability analysis of urban vertical development. Cartogr. Geogr. Inf. Sci. 2021, 48, 105–123. [Google Scholar] [CrossRef]
- He, S.J.; Wang, X.Y.; Dong, J.R.; Wei, B.C.; Duan, H.M.; Jiao, J.Z.; Xie, Y.W. Three-Dimensional Urban Expansion Analysis of Valley-Type Cities: A Case Study of Chengguan District, Lanzhou, China. Sustainability 2019, 11, 5663. [Google Scholar] [CrossRef]
- Li, C.L.; Xu, Y.Y.; Liu, M.; Hu, Y.M.; Huang, N.; Wu, W. Modeling the Impact of Urban Three-Dimensional Expansion on Atmospheric Environmental Conditions in an Old Industrial District: A Case Study in Shenyang, China. Pol. J. Environ. Stud. 2020, 29, 3171–3181. [Google Scholar] [CrossRef]
- Tian, Y.; Zhou, W.; Qian, Y.; Zheng, Z.; Yan, J. The effect of urban 2D and 3D morphology on air temperature in residential neighborhoods. Landsc. Ecol. 2019, 34, 1161–1178. [Google Scholar] [CrossRef]
- Cheng, X.; Damme, S.V.; Uyttenhove, P. A review of empirical studies of cultural ecosystem services in urban green infrastructure. J. Environ. Manag. 2021, 293, 112895. [Google Scholar] [CrossRef] [PubMed]
- Schüle, S.A.; Hilz, L.K.; Dreger, S.; Bolte, G. Social Inequalities in Environmental Resources of Green and Blue Spaces: A Review of Evidence in the WHO European Region. Int. J. Environ. Res. Public Health 2019, 16, 1216. [Google Scholar] [CrossRef]
- Hu, S.; Song, W.; Li, C.; Lu, J. A multi-mode Gaussian-based two-step floating catchment area method for measuring accessibility of urban parks. Cities 2020, 105, 102815. [Google Scholar] [CrossRef]
- Dai, D. Racial/ethnic and socioeconomic disparities in urban green space accessibility: Where to intervene? Landsc. Urban Plan. 2011, 102, 234–244. [Google Scholar] [CrossRef]
- Kim, J.; Chae, J.; Koo, T.H. Variation in bird diversity in relation to habitat size in the urban landscape of Seoul, South Korea. Acta Ornithol. 2007, 42, 39–44. [Google Scholar] [CrossRef][Green Version]
- Ronald, A.K.; Nándor, C.; Péter, S. Urban atlas population data in urban green space provision analyses through the case study of Szeged, Hungary. Urban For. Urban Green. 2021, 57, 126942. [Google Scholar] [CrossRef]
- Mohd, A.H. SMOTEDNN: A Novel Model for Air Pollution Forecasting and AQI Classification. Comput. Mater. Contin. 2022, 71, 1403–1425. [Google Scholar] [CrossRef]
- Mohd, A.H. CDLSTM: A Novel Model for Climate Change Forecasting. Comput. Mater. Contin. 2021, 71, 2363–2381. [Google Scholar] [CrossRef]
Publisher’s Note: MDPI stays neutral with regard to jurisdictional claims in published maps and institutional affiliations. |
© 2022 by the authors. Licensee MDPI, Basel, Switzerland. This article is an open access article distributed under the terms and conditions of the Creative Commons Attribution (CC BY) license (https://creativecommons.org/licenses/by/4.0/).