Article

Visibility Analysis to Enhance Landscape Protection: A Proposal of Planning Norms and Regulations for Slovakia

by
Daniele La Rosa
1,* and
Zita Izakovičová
2
1
Department of Civil Engineering and Architecture, University of Catania, 95123 Catania, Italy
2
Institute of Landscape Ecology of the Slovak Academy of Sciences, Štefánikova No. 3, P.O. Box 254, SK-814 99 Bratislava, Slovakia
*
Author to whom correspondence should be addressed.
Land 2022, 11(7), 977; https://doi.org/10.3390/land11070977
Submission received: 14 April 2022 / Revised: 13 June 2022 / Accepted: 22 June 2022 / Published: 26 June 2022
(This article belongs to the Special Issue Integrated Approach to Land Use Change Assessment)

Abstract

:
The visibility of a landscape is an important aspect of landscape protection planning because different rules or norms can be defined to regulate land-use and human activities depending on the degree of landscape visibility. Viewshed analyses are common GIS-based approaches to evaluate which parts of the landscape can be seen from certain points or by people located or moving in the landscape. In this work, the visibility of the entire landscape of the Slovak Republic is assessed from the network of major national roads. The results of the landscape visibility analysis are then used to propose appropriate planning norms and regulations to protect the identified visibility values and avoid potential visual obstructions from new buildings or infrastructure development. Particularly, the proposed norms indicate allowable changes to the landscape and the maximum height of new or existing buildings and other urban infrastructure. Maps of the spatial distribution of the proposed norms identify possible situations of consistency or conflict with potential urban development trends, to support landscape protection planning processes at the national level. On average, the most visible land-use/land-cover categories are glacial mountains relief, plane depressions, and wide alluvial plains, while the planning indications/prescriptions to protect landscape visibility have been proposed for irrigated land and forests. Thanks to the limited use of geographic datasets, the method ensures high transferability to other different geographic contexts, and allows to derive planning indications for large national contexts.

1. Introduction

The assessment of the physical features of a landscape is a relevant aspect of current applied landscape research aimed at landscape conservation [1]. Among the different types of landscape assessment, visual aspects or visual resonance have traditionally been important streams of research, focusing on concepts such as scenic beauty/quality and sometimes eased by 3D virtual landscape re-constructions to support the assessment [2,3]. Other approaches include the social value of landscape beauty, where different social subjects evaluate the landscape under personal experience and preference [4].
Visibility or viewshed analysis are tools common in many GIS software, that are applied in various fields. The main purpose of visibility tools is to identify portions of the landscape that can be visible by given points or linear features (i.e., roads or pathways), mainly depending on the terrain and other physical features (vegetation, buildings, and infrastructure) that affect how much landscape can be perceived [5]. A wide range of applications has been developed in the last 40 years, showing the popularity and high versatility of this type of tools, also thanks to the widespread use of GIS software and techniques. Examples include landscape assessment, management. and planning [6,7], archaeology studies and reconstructions [8], urban planning [9], forestry management [10], environmental impact assessment [11], and also military applications [12].
Visibility can be considered an important factor in evaluating the quality of a landscape. Its analysis depends on the perception and evaluation of the landscape by different social subjects, as different valuable landscape elements (i.e., monuments or natural formations) influence the emotional feelings of observers in various ways [13]. Mountain landscapes are particularly attractive as are valuable cultural and historical landscapes with traditional ways of management and open areas [14]. Places with higher visibility are much more visually exposed, so any changes or transformations will have a greater impact on the landscape character.
Because many human activities result in modifications of the landscape, visibility analysis can simulate the impacts of such transformations on how the landscape may be perceived by individuals. This is an important issue in areas where the effects of the transformations may be of concern to the residents or other social subjects who live in and enjoy the landscape. From a different perspective, visibility analysis can highlight the parts of the landscape that are the most visible from different places or linear features (roads, railways, trails). Physical transformations can thus change people’s perception of the landscape, and should be regulated by appropriate indications, norms, or prescriptions to protect the visual quality of the landscape. A pertinent example is the impact of plants for renewable energies (i.e., hydroelectric, wind, and solar energy) on the landscape, a field where complex social and cultural issues arise, with various economic and social implications that require interdisciplinary analysis to be better addressed [15]).
This study intends to assess the visibility of the landscape of the Slovak Republic from the main road network, with the main objective to go beyond the use of visibility analysis as a GIS-based tool for general landscape analysis to apply the technology for the direct derivation of planning indications and regulations for landscape protection. Specifically, the research aims to identify the landscape types with the highest visibility value and, as a result, to propose new norms and regulations for protecting and safeguarding the most visible and important landscape features. Because the research is based on a limited number of data and geographic layers, it can be easily transferred to other different and large geographical contexts, while providing useful planning indications that are spatially explicit.
Despite its small size compared to other European countries, Slovakia has a great diversity of landscape types, corresponding to the different abiotic and biotic conditions. The protection of individual landscape types is currently limited to rare and unique elements of the biota and is differentiated into five increasing levels of nature protection. The highest and strictest levels of protection (5th and 4th levels) include small-protected areas: nature reserves, national nature reserves, natural monuments, and national natural monuments and protected areas. National parks belong to level 3, while protected landscape areas belong to level 2. However, nature and landscape protection here focuses only on the protection of biota, and none of these areas have been declared to protect physical landscape structures. Strengthening the visible valuable landscape structures is therefore essential to increase the number of protected areas, especially after the increase of pressure from urban development that has been recorded throughout the country in the last 30 years [16,17].

2. Materials and Method

2.1. Landscape Types of Slovak Republic

The definition of landscape types was based on the natural units of the landscape and the main criterion for classification was the nature of the surface, such as the segmental and positional characteristics of the relief. For the Slovak Republic, the relief most significantly reflects the basic characteristics of the abiotic complex as well as the entire landscape-ecological complex. For this reason, its geographical distribution represents the basic reference for all other landscape features.
The design of the geomorphological maps of the Slovak Republic was prepared according to the classification of [18] and using the supplementary map of morphological-morphometric types of relief [19] and the digital relief model with a resolution 200 and 50 m [20].
The identification of landscape types used in this work follows a methodology developed in previous research [21]. The first step involved the creation of the basic spatial units—morphological-types of the landscape—which formed the basis for its further classification and evaluation. The second phase consisted of the reclassification of geomorphological units and morphological-morphometric relief types, which were defined by a digital relief model. In this way, it was possible to define the spatial-positional characteristics of the units within the area (lowlands, basin, furrow, mountains); the articulation of the relief, according to the morphological-morphometric relief types [19]; the digital relief model of the Slovak Republic [20]. Using this method 3 basic types of natural landscapes (lowland landscape, basin, and mountain landscape) and 18 subtypes (5 subtypes for lowlands, 3 subtypes for basin, and 10 subtypes for mountain landscape) were identified as mapped in Figure 1.

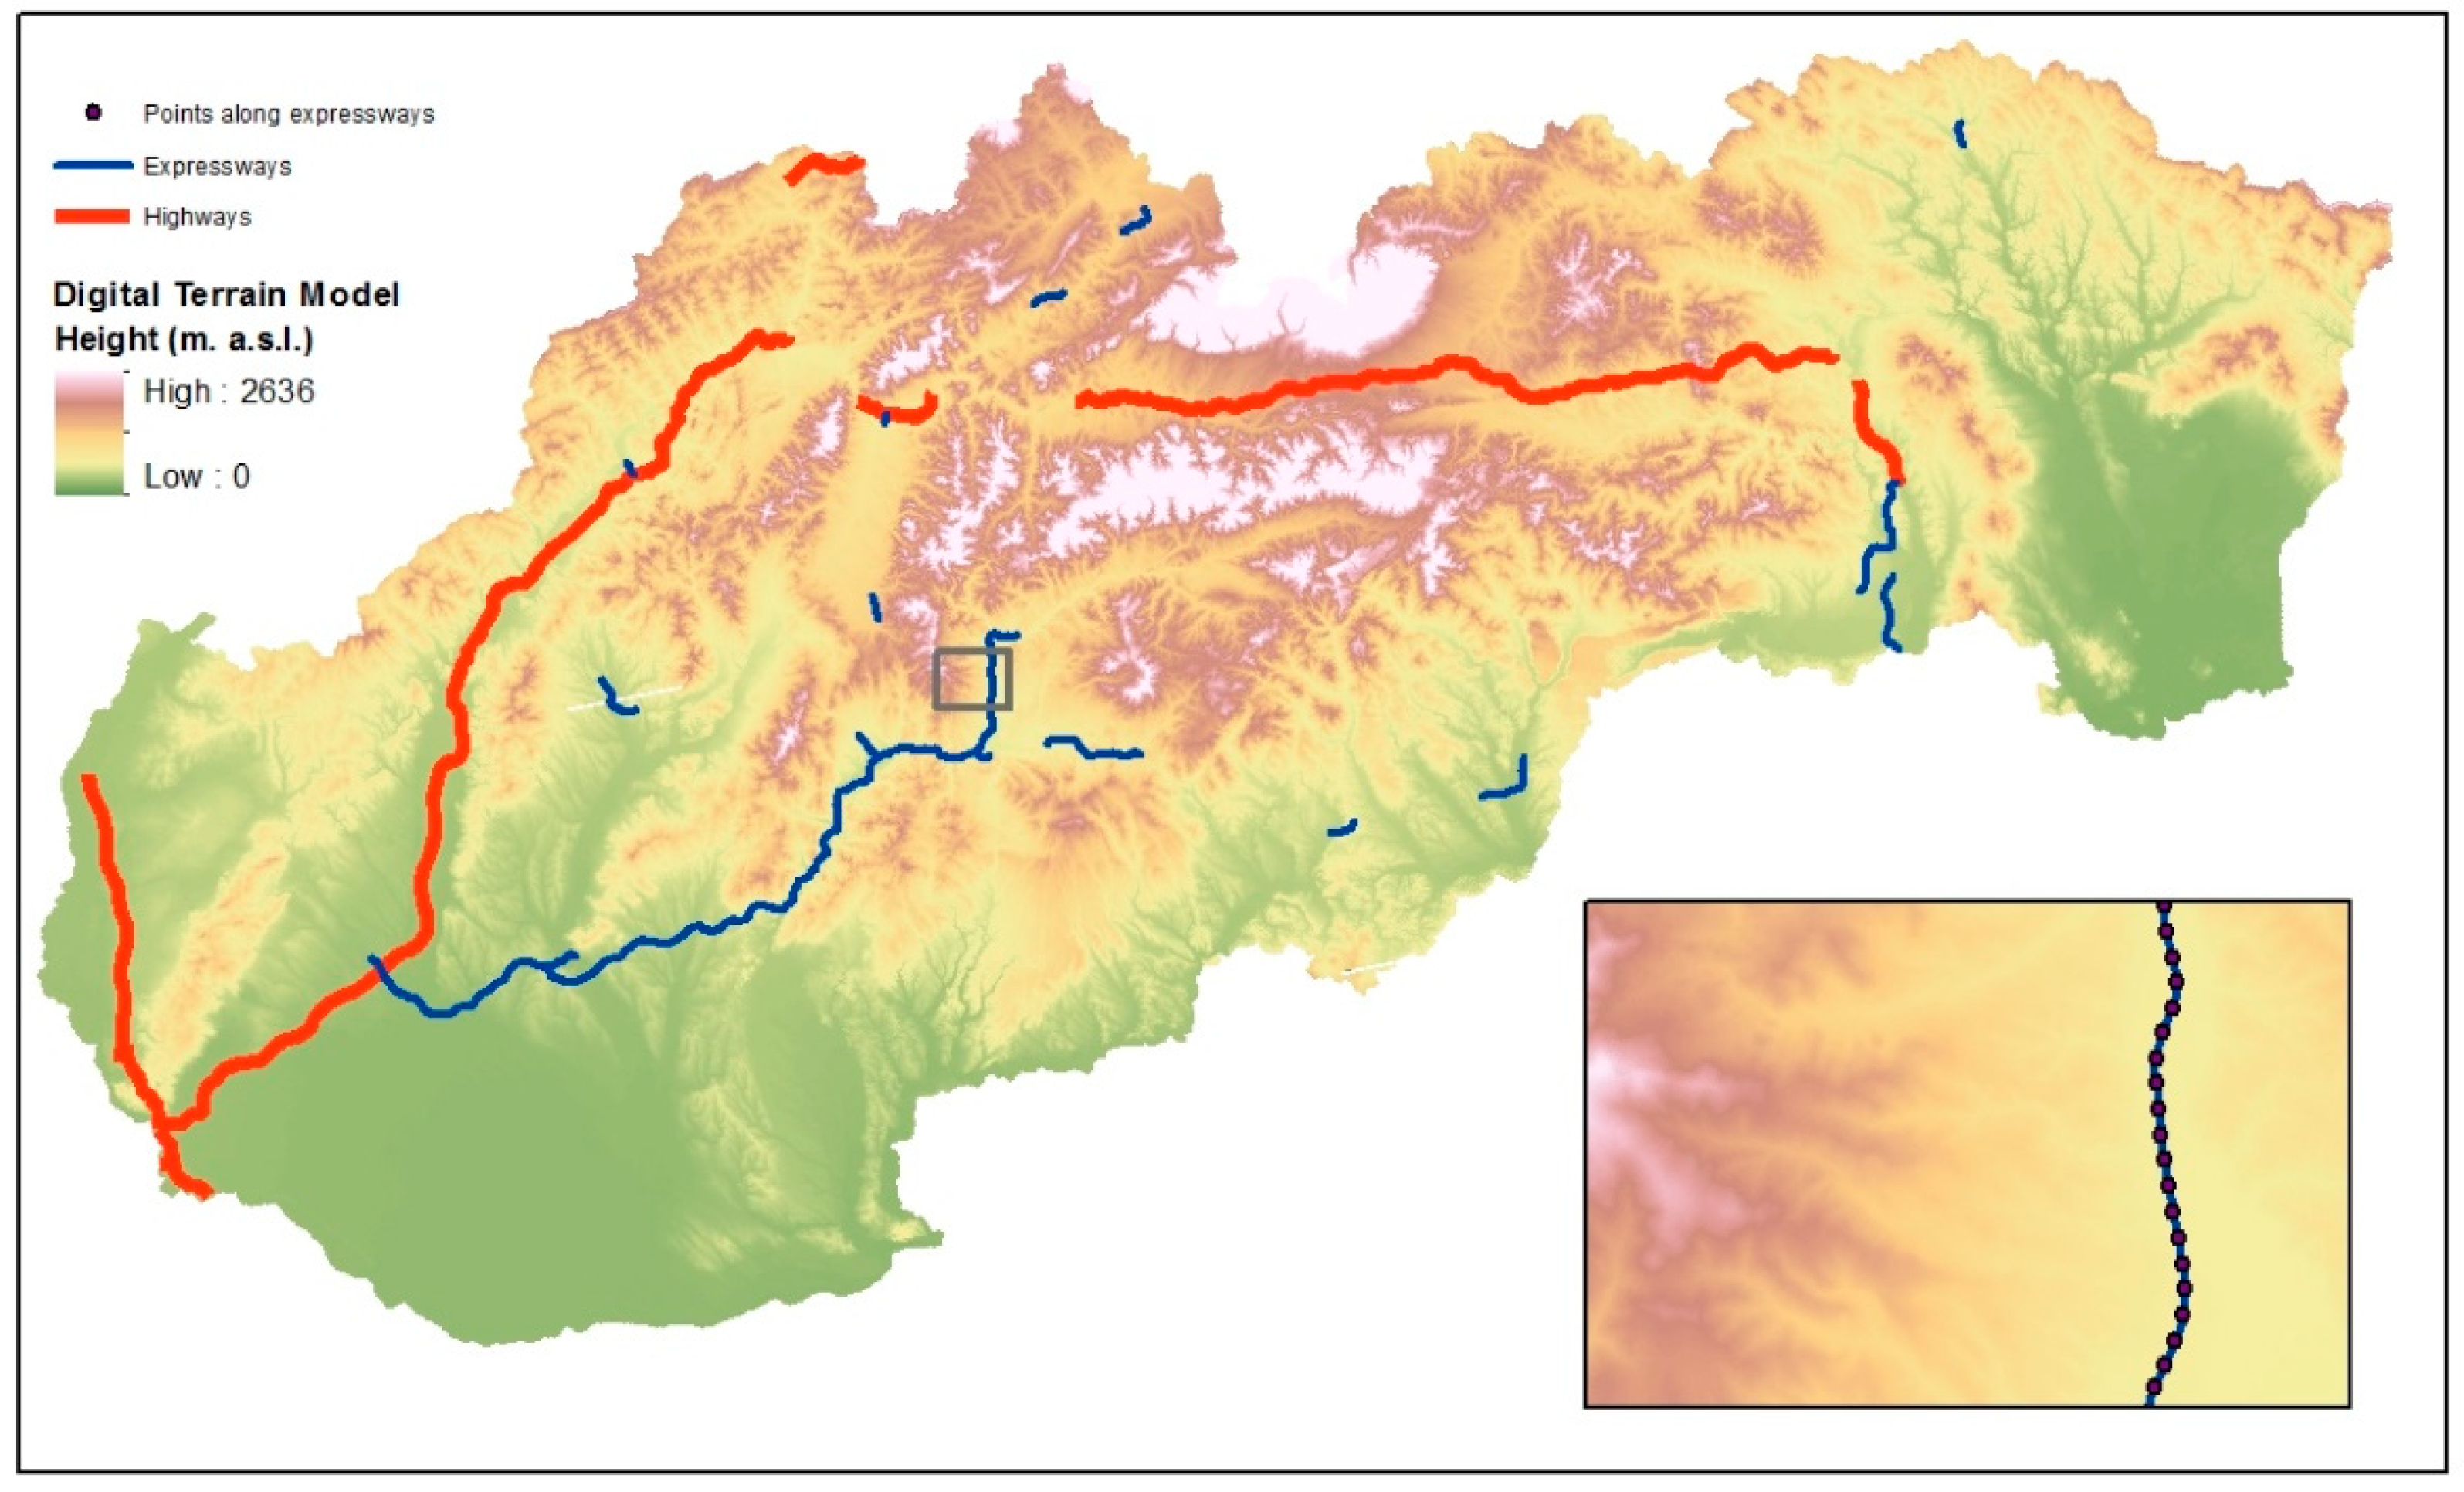
2.2. Data Availability

The following data were used for the visibility analysis performed in this work, all of which areas are available as vector layers. Roads were taken from the road network of Slovakia, and available from the National Road Administration [22]. The Digital Terrain Model with a resolution of 20 m was available from [20]. In order to speed up computation times in creating the viewshed for the whole country, the DTM was first resampled to 50 m, which results in more than 36,000,000 cells. This resolution represents a good compromise for an analysis aimed at evaluating the visibility of the entire Slovak Republic.
As mentioned above, the cumulative viewshed was derived from the major roads of Slovakia, namely highways and expressways (Figure 2). The road network was then converted into a point vector layer, with the points located every 400 m. This partitioning generated a total number of 1958 viewpoints, which allowed for a good point sampling of the entire road network, especially considering the national scope of this analysis.

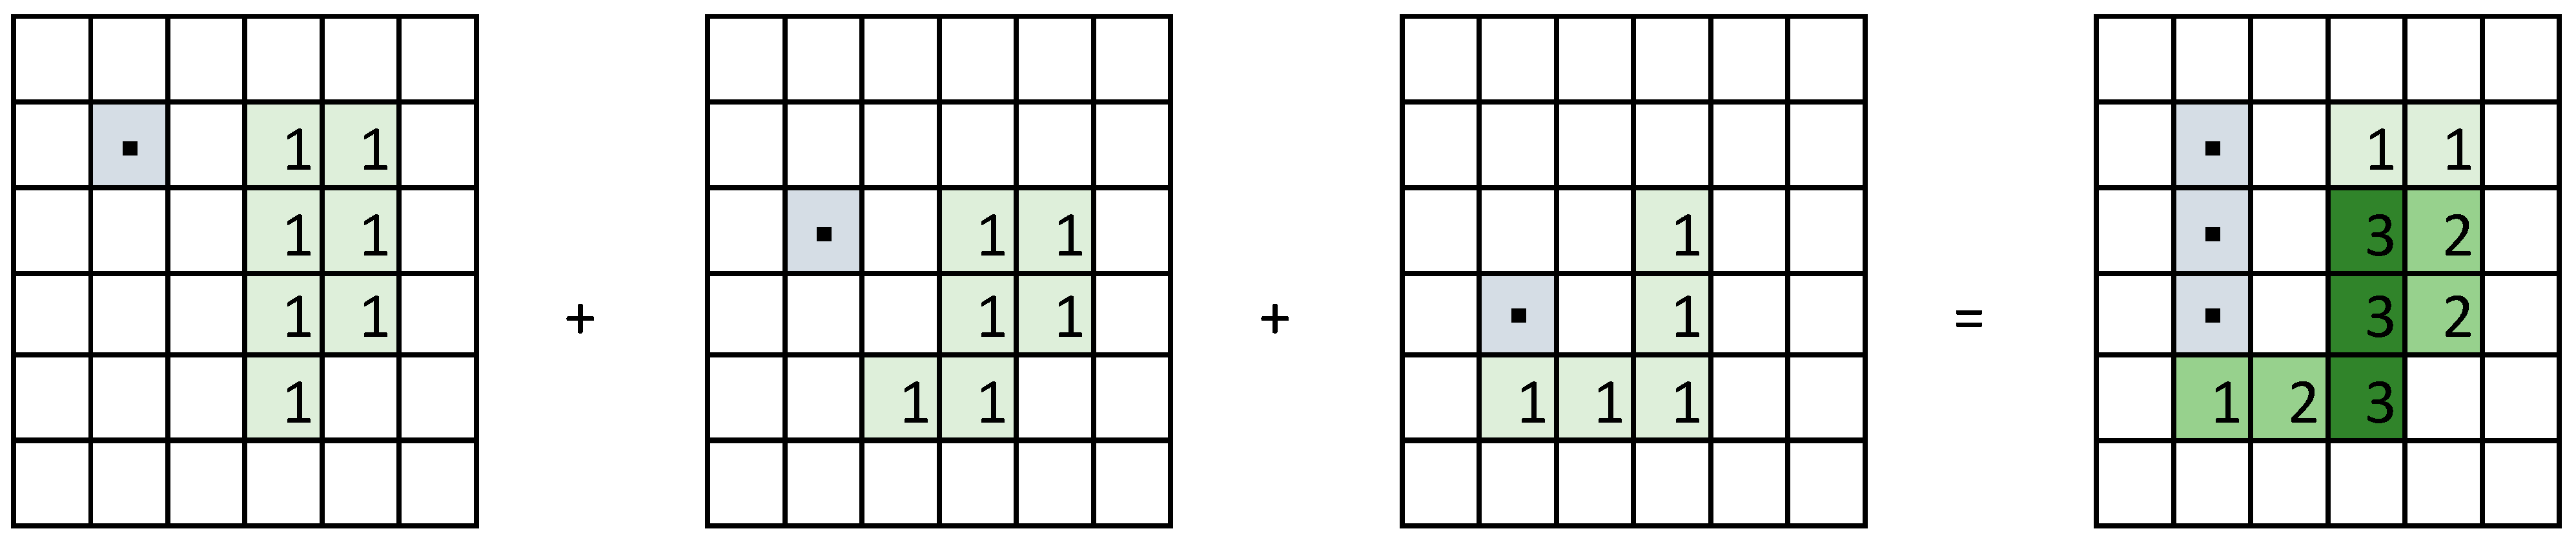
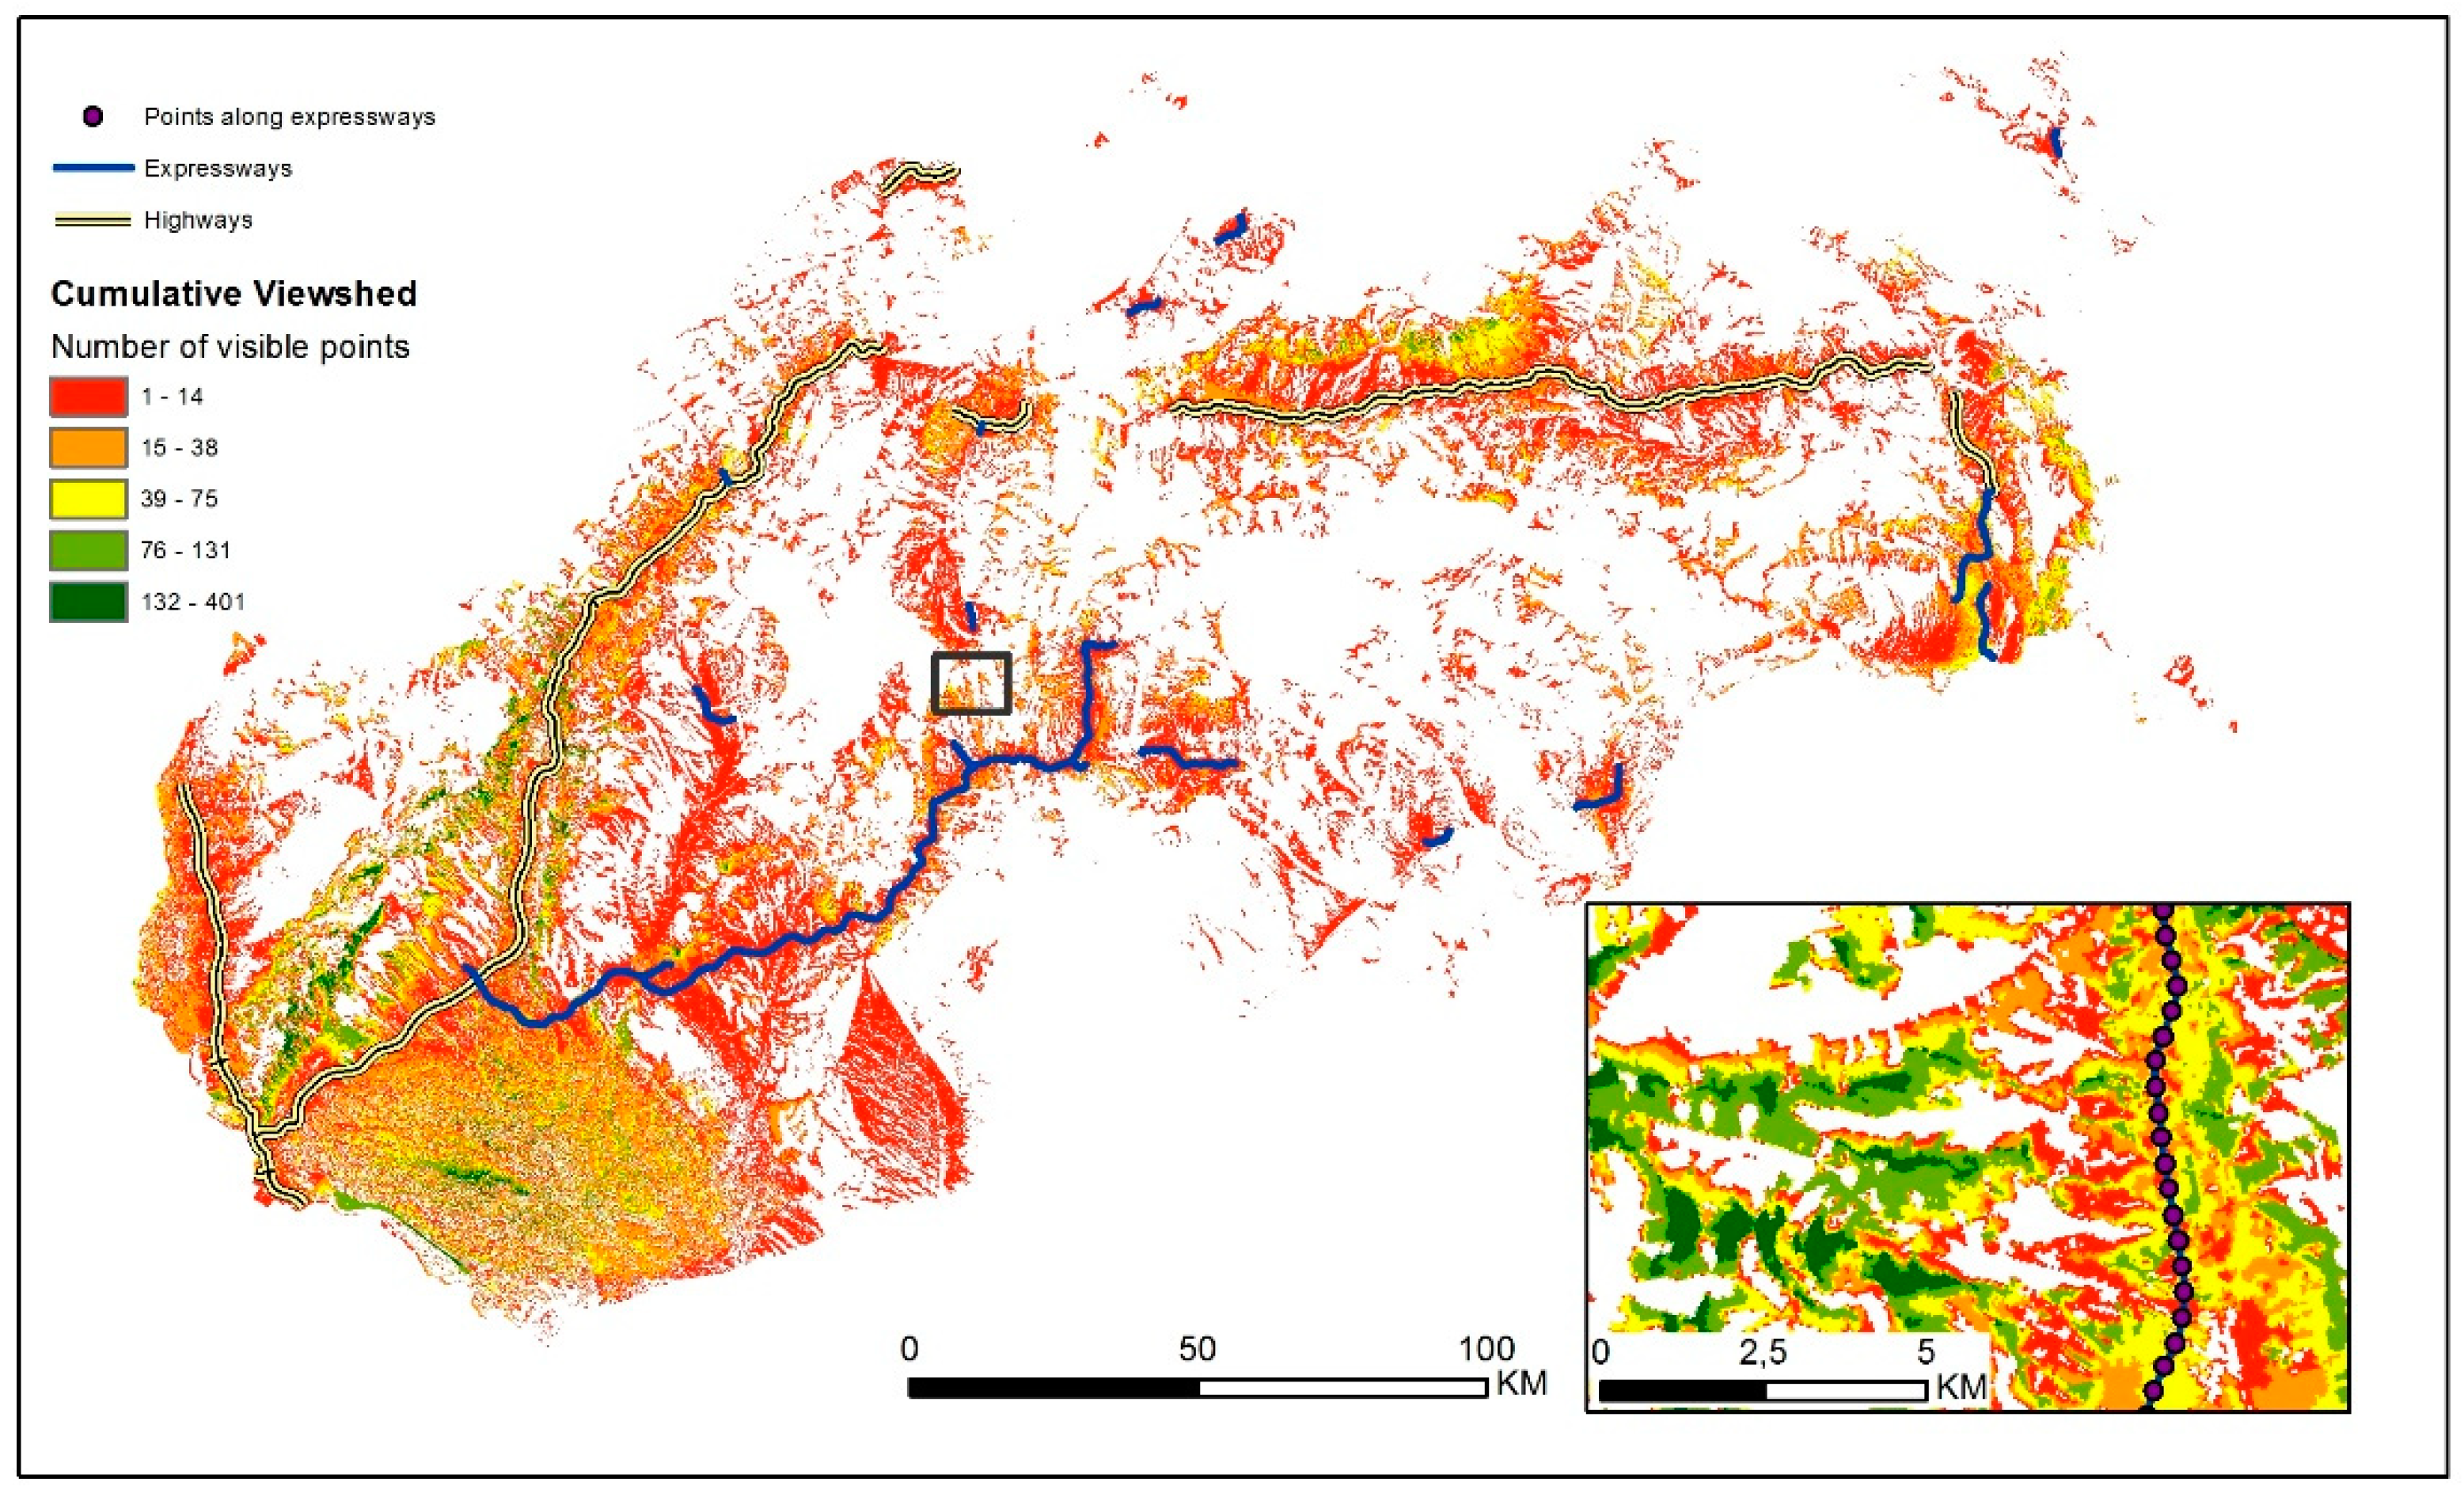
2.3. Viewshed Analysis

The concept of ‘viewshed’ was first defined by [23] by analogy with watersheds, as areas of a spatial environment that are directly visible from a certain location. Viewshed analysis thus computes visibility by creating Lines of Sight between an observation point and other points in the landscape, usually rasterized into a grid-based elevation surface or Digital Elevation Mode [24].
Viewsheds generated from more than a single viewpoint are called cumulative viewsheds, because one binary viewshed (1 visible, 0 not visible) is calculated for each given point, and all viewsheds are then overlaid with an arithmetic sum [8]. In this way, a single raster is created that accounts for the “visual magnitude” of the extent of the landscape that can be visible from the points of view under consideration [25]. In this method, each cell of the viewshed represents the number of times it is visible from all viewpoints in the study area. Cumulative Viewsheds are thus representations of the visible portion of the terrain derived by combining the results of visibility analysis from different viewpoints.
Figure 3 reports an example of the calculation procedure of a cumulative viewshed from 3 points of view.
The cumulative viewshed is calculated from the viewpoints located along the road network, using the function viewshed of ArcGIS Spatial Analyst. The main parameters used in the analysis are listed in Table 1 and simulate the characteristics of an observer in a car moving along a road.

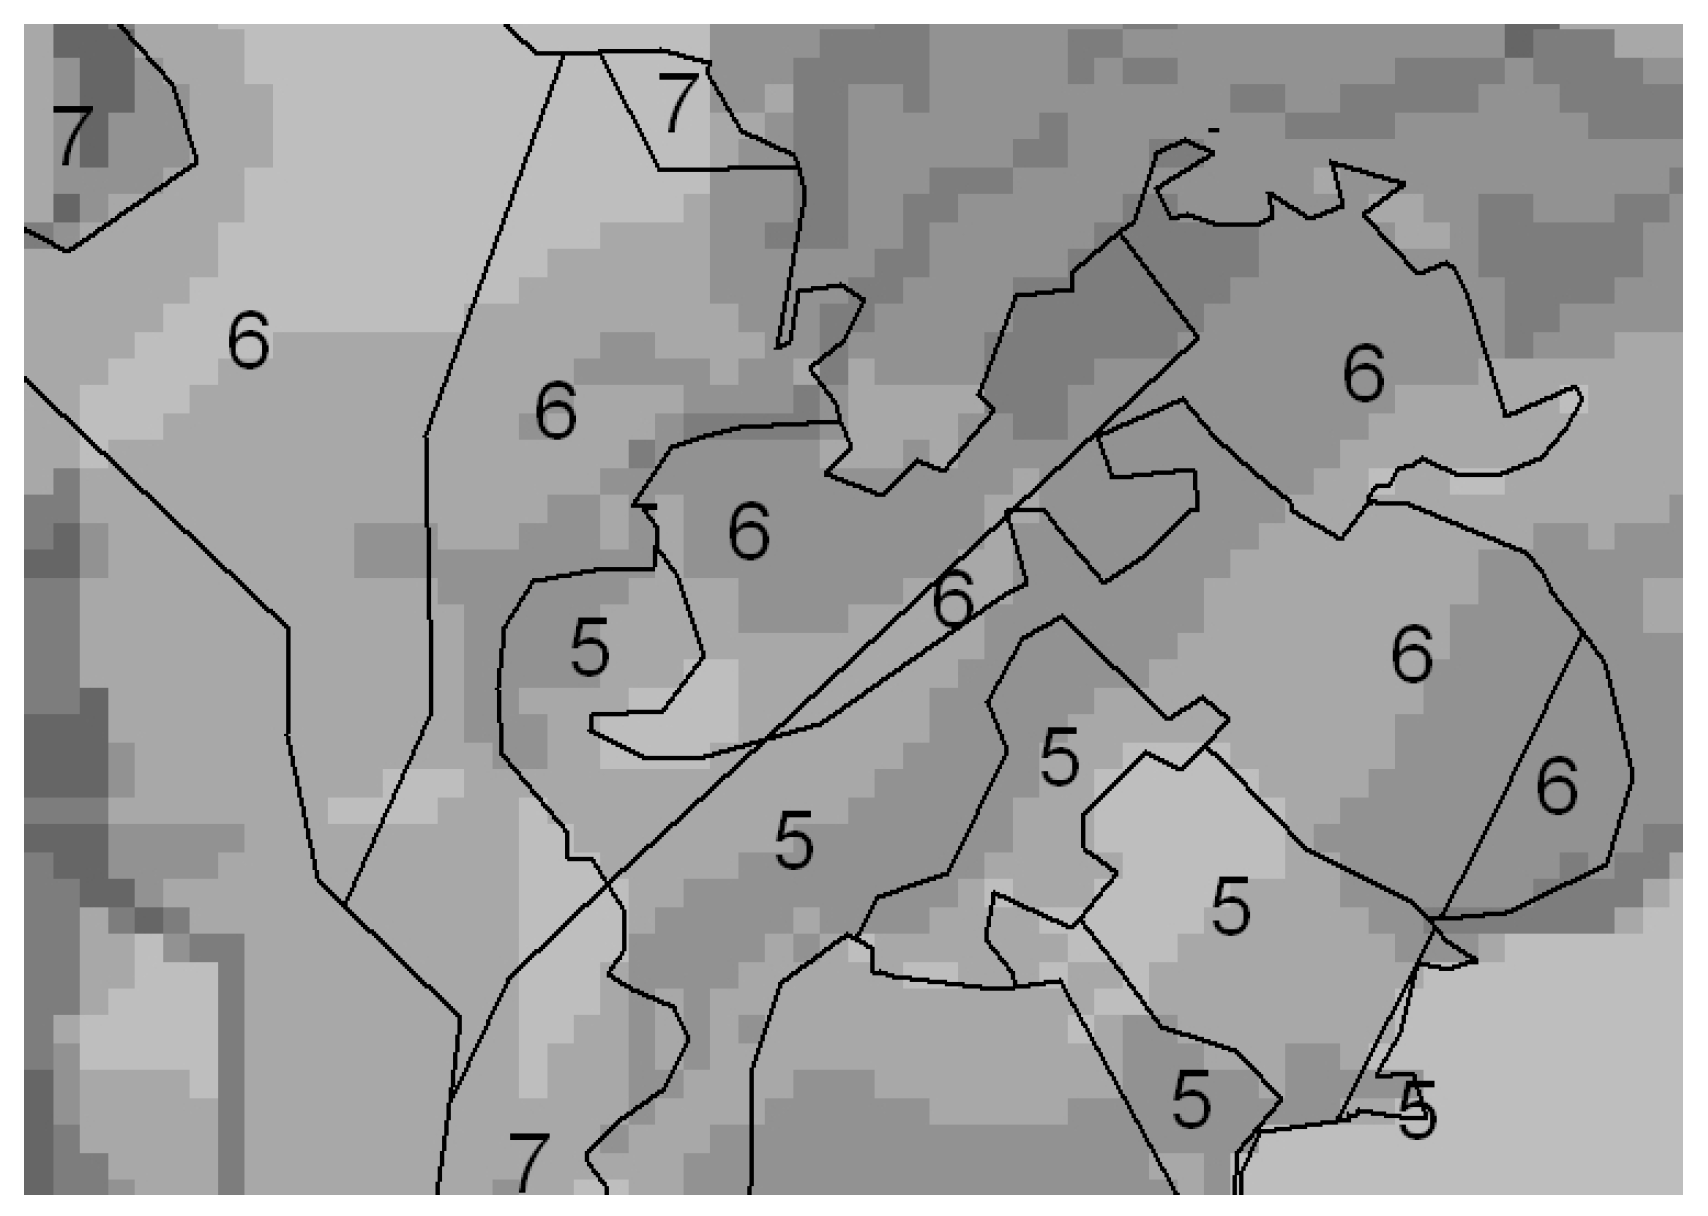
2.4. GIS Spatial Analysis

An important part of the procedure is the assessment of the visibility of real landscape features or landscape types (i.e., woods, open spaces, grass, archaeological areas, morphological complexes).
To this end, a zonal statistics function was used to characterize the different landscape types (available in vector format) with a visibility value obtained by the cumulative viewshed. The landscape categories used are those of the sub-type units (Figure 1). For each of these categories, a GIS Zonal Statistic function counts the number and values of pixels of the cumulative viewshed within each landscape unit and returns the following statistics: minimum, maximum, range, mean, standard deviation, sum, variety, majority, minority, and median. A graphical example of this procedure is shown in Figure 4, where each of the mapped geographical unit is labeled with the maximum score of the visibility raster.
Understanding the visibility of these features is important because areas with high visibility may have specific restrictions for transformations, so that planning indications can be implemented to protect or increase their visibility values.

2.5. Planning Norms to Safeguard/Protect Hotspots of High Visibility/High Value

Based on the assessment of the visibility value of the different landscape units, some possible norms for landscape protection and conservation can be proposed. Such norms can be designed according to a graded approach to landscape protection of the previously evaluated visibility value. Thus, landscape protection may include a differentiated set of norms aiming at preserving the existing highly valuable conditions as a result of interactions between natural and human components. This type of landscape protection is applicable when the existing landscape supports sustainable processes and patterns so that a protective strategy can be employed [26].
The following norms can be proposed:
Limitation of possible landscape transformations (urban development, infrastructure) in the landscape: only certain transformations that do not affect landscape visibility are allowed (LT).
LT1: no landscape transformations are allowed for landscape features with the highest visibility values (1st quartile);
LT2: only construction of rural buildings or maintenance of existing civil buildings (i.e., by bio-engineering methods) are allowed for landscape features with medium-high visibility values (2nd quartile);
LT3: limited height for new civil, commercial buildings, and light manufacturing (max 3 m) is required; economic or fiscal incentives for the use of bio-engineering techniques are encouraged for landscape features with medium-low visibility values (3 quartile);
Limitation of height in buildings and other facilities/constructions surrounding landscape with high visibility (H_Lim).
H_Lim1: limited height of new buildings or other constructions (maximum: 3 m) for areas within a 100 m buffer around landscape features with the highest visibility values;
H_Lim2: limited height of new buildings or other constructions (maximum: 6 m) for areas within buffer between 100 and 200 m of landscape features with the highest visibility values.
In the final step of the method, we also wanted to explore the relation between the current use of the land and the proposed planning norms, in order to identify possible limitations and constraints for their actual application and implementation in landscape planning processes, taking into account the current asset of land use and land cover. To this end, the following spatial analyses were performed. First, the values of cumulative viewshed raster were assigned to features of Land-use/Land Cover (LULC) of the level 3 of Corine Land Cover, using the zonal statistics GIS function. The LULC data were preferred over the landscape types used in the previous step of the analysis for their higher resolution (minimum mapping unit equal to 25 ha). For each LULC feature, visibility values were reclassified into 4 classes using a natural breaks algorithm. The average visibility value was considered. Finally, two buffers of 100 m and 200 m, respectively, were created from the LULC features with the highest visibility value, i.e., the features belonging to the first class of reclassified values.

3. Results

3.1. Viewshed Analysis

Figure 5 maps the cumulative viewshed resulting from the road network. A close relationship can be observed between the road density and the more visible landscape. On one hand, this can be seen as a straightforward result, but from the perspective of an observer moving along roads, a high density of roads means a high potential to observe and enjoy the landscape, while a low road density means a lower potential to enjoy the landscape. Consequently, the areas with high visibility (with maximum values) are located in the western parts of the country, near the Bratislava metropolitan area, where the road density is higher due to the presence of the Capital city and related infrastructure. High visibility values characterize also the northern landscapes (mountain landscape, basin uplands) and south east landscapes (mountain landscape, upland).

3.2. Spatial Statistics: Most Visible Landscape Types
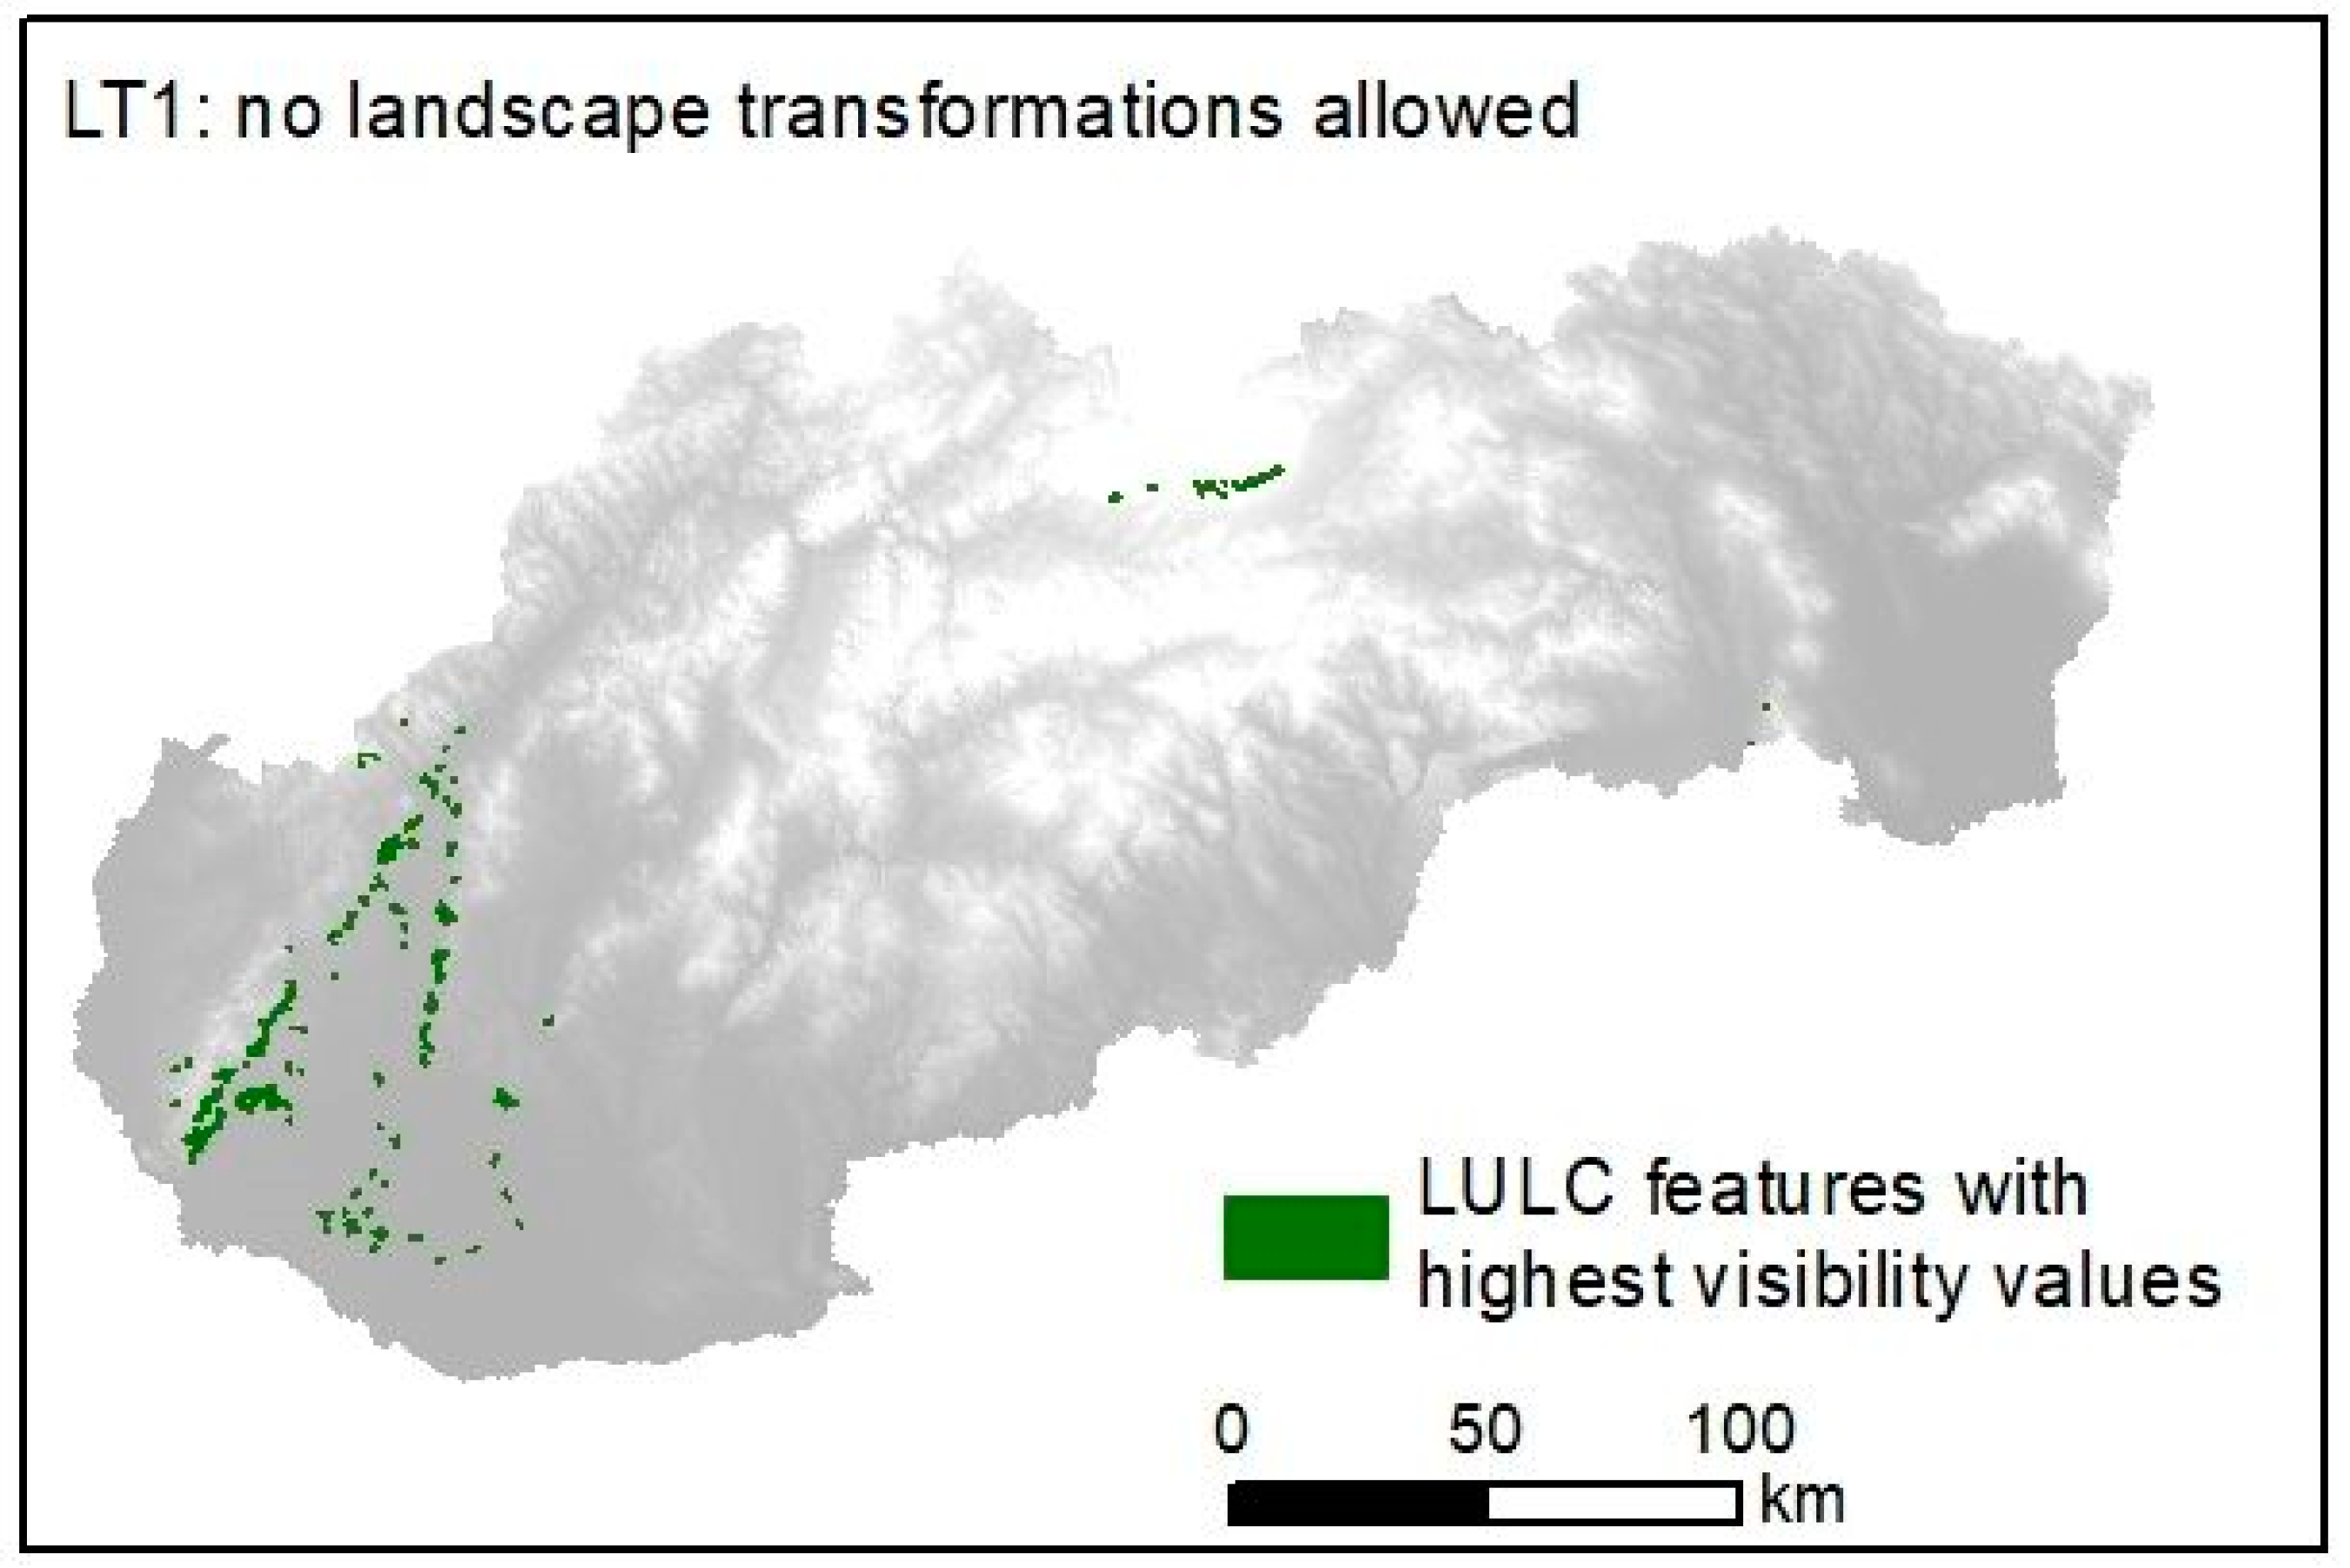
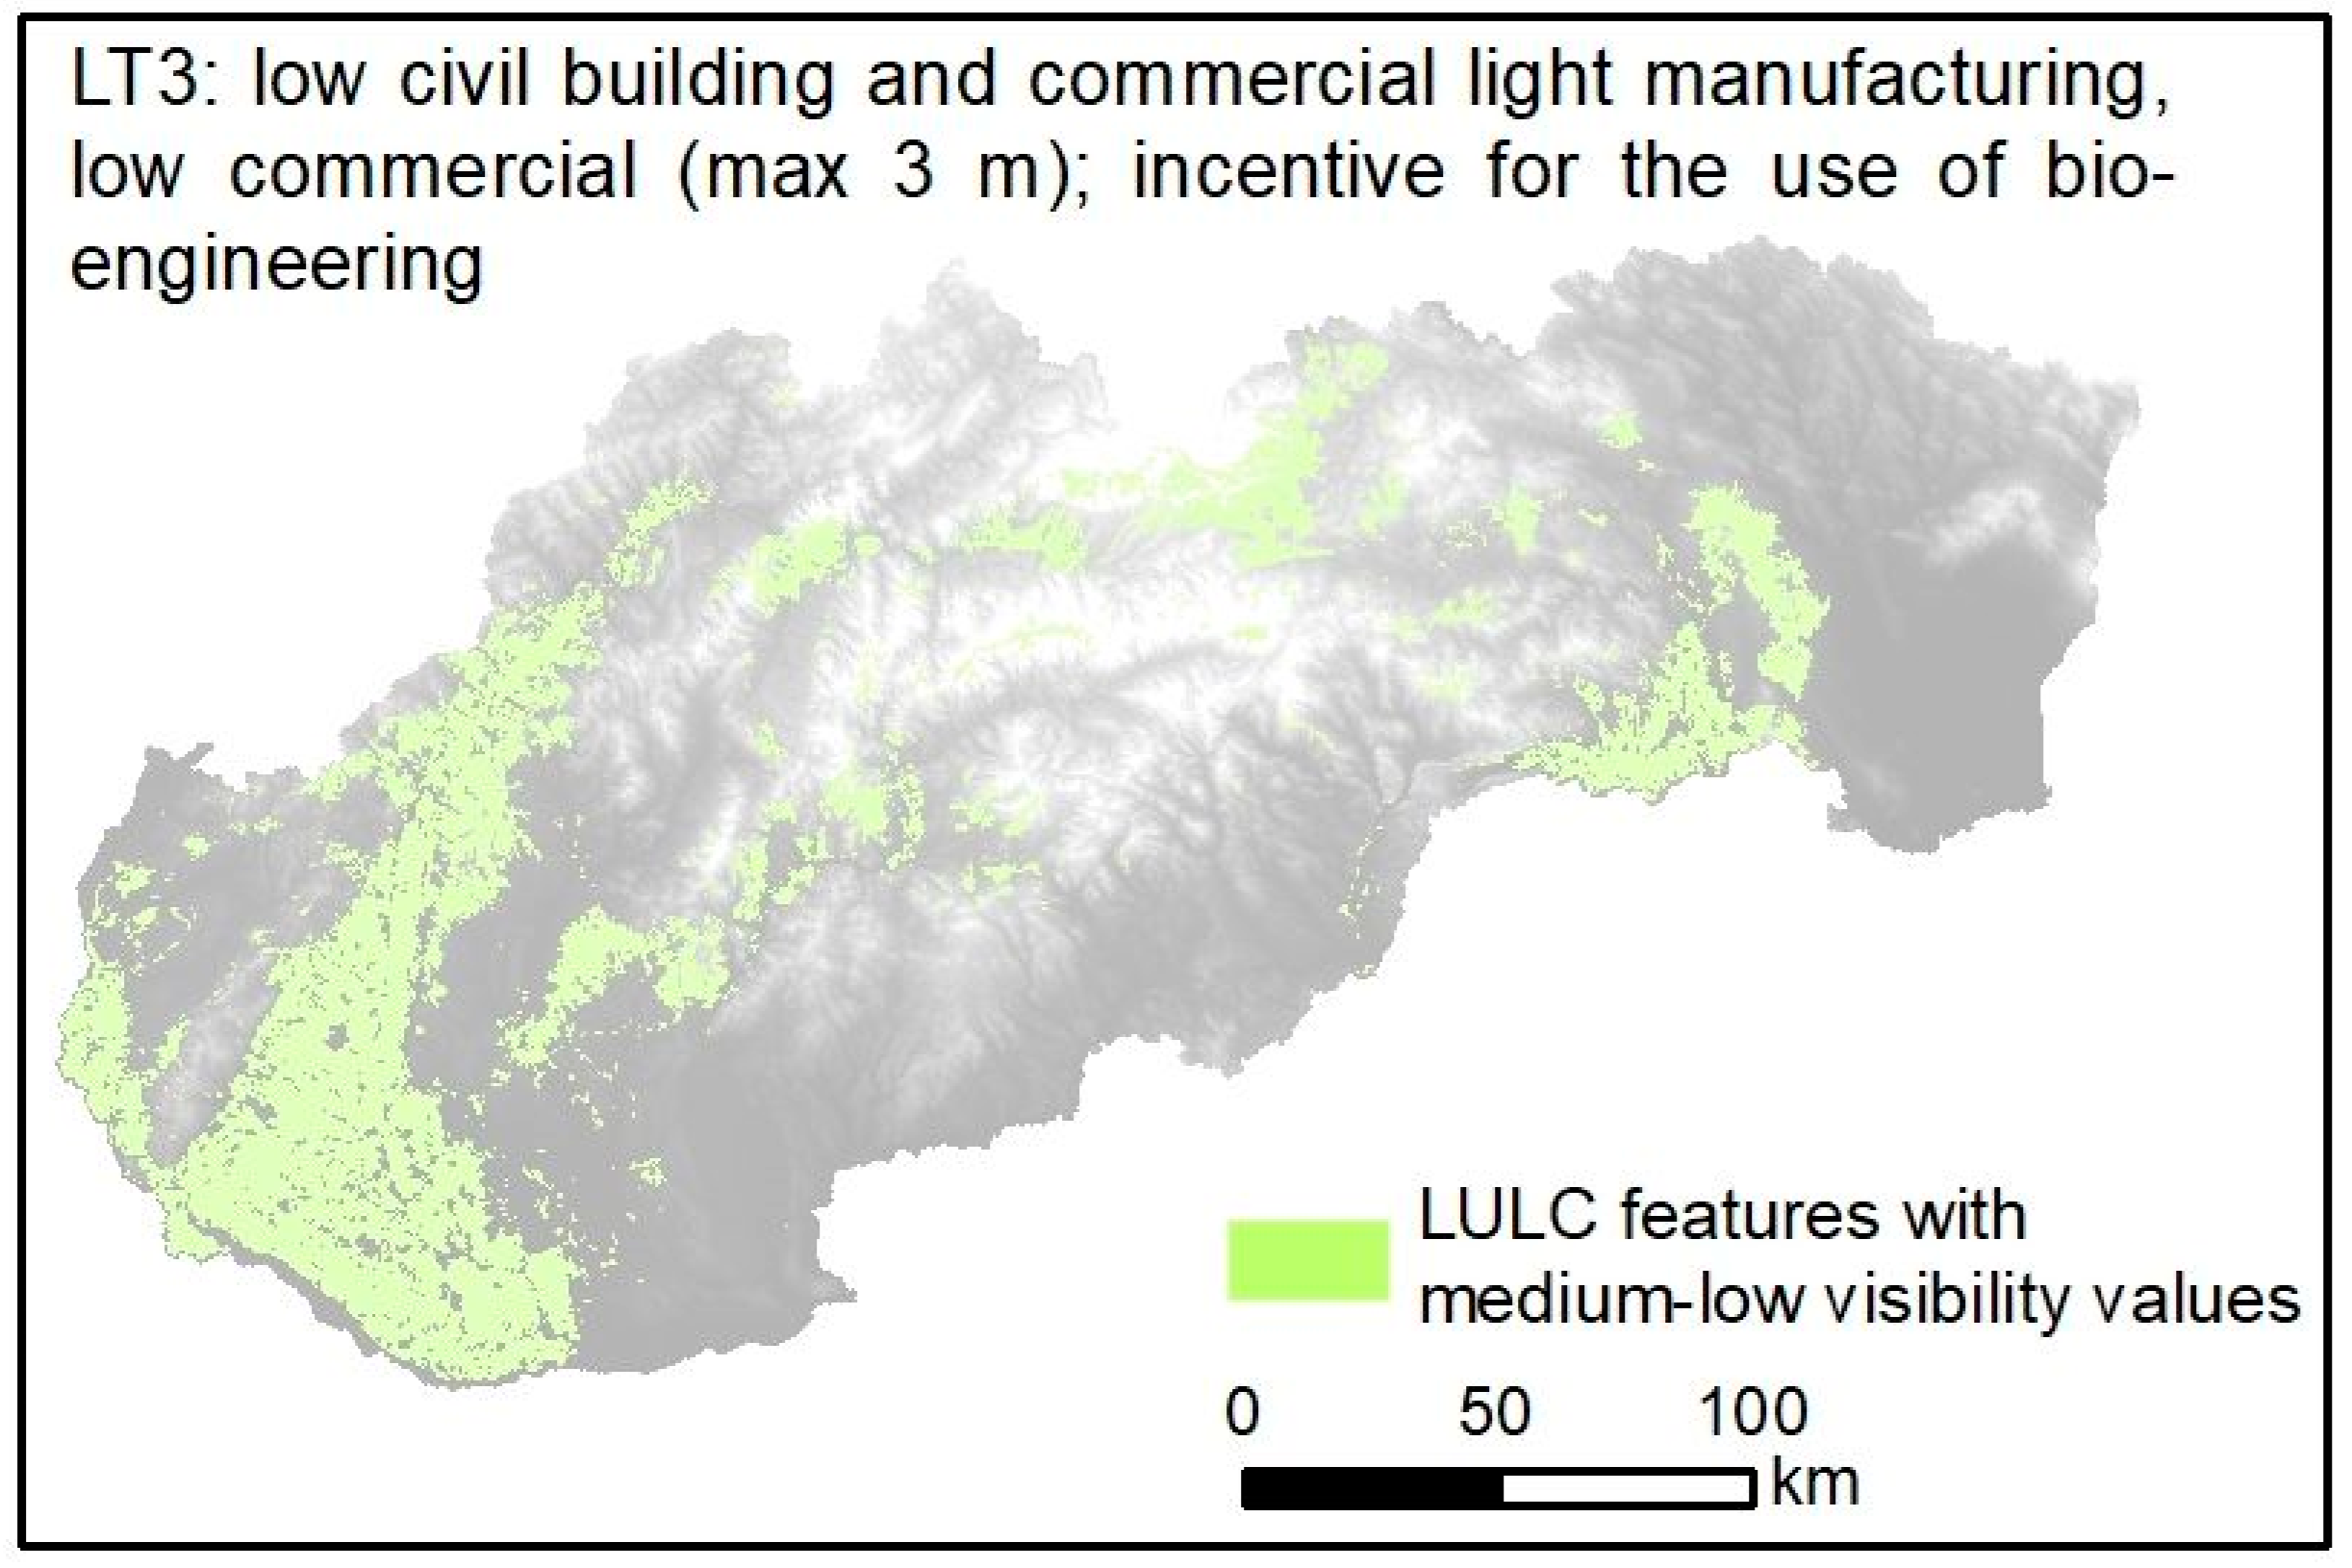
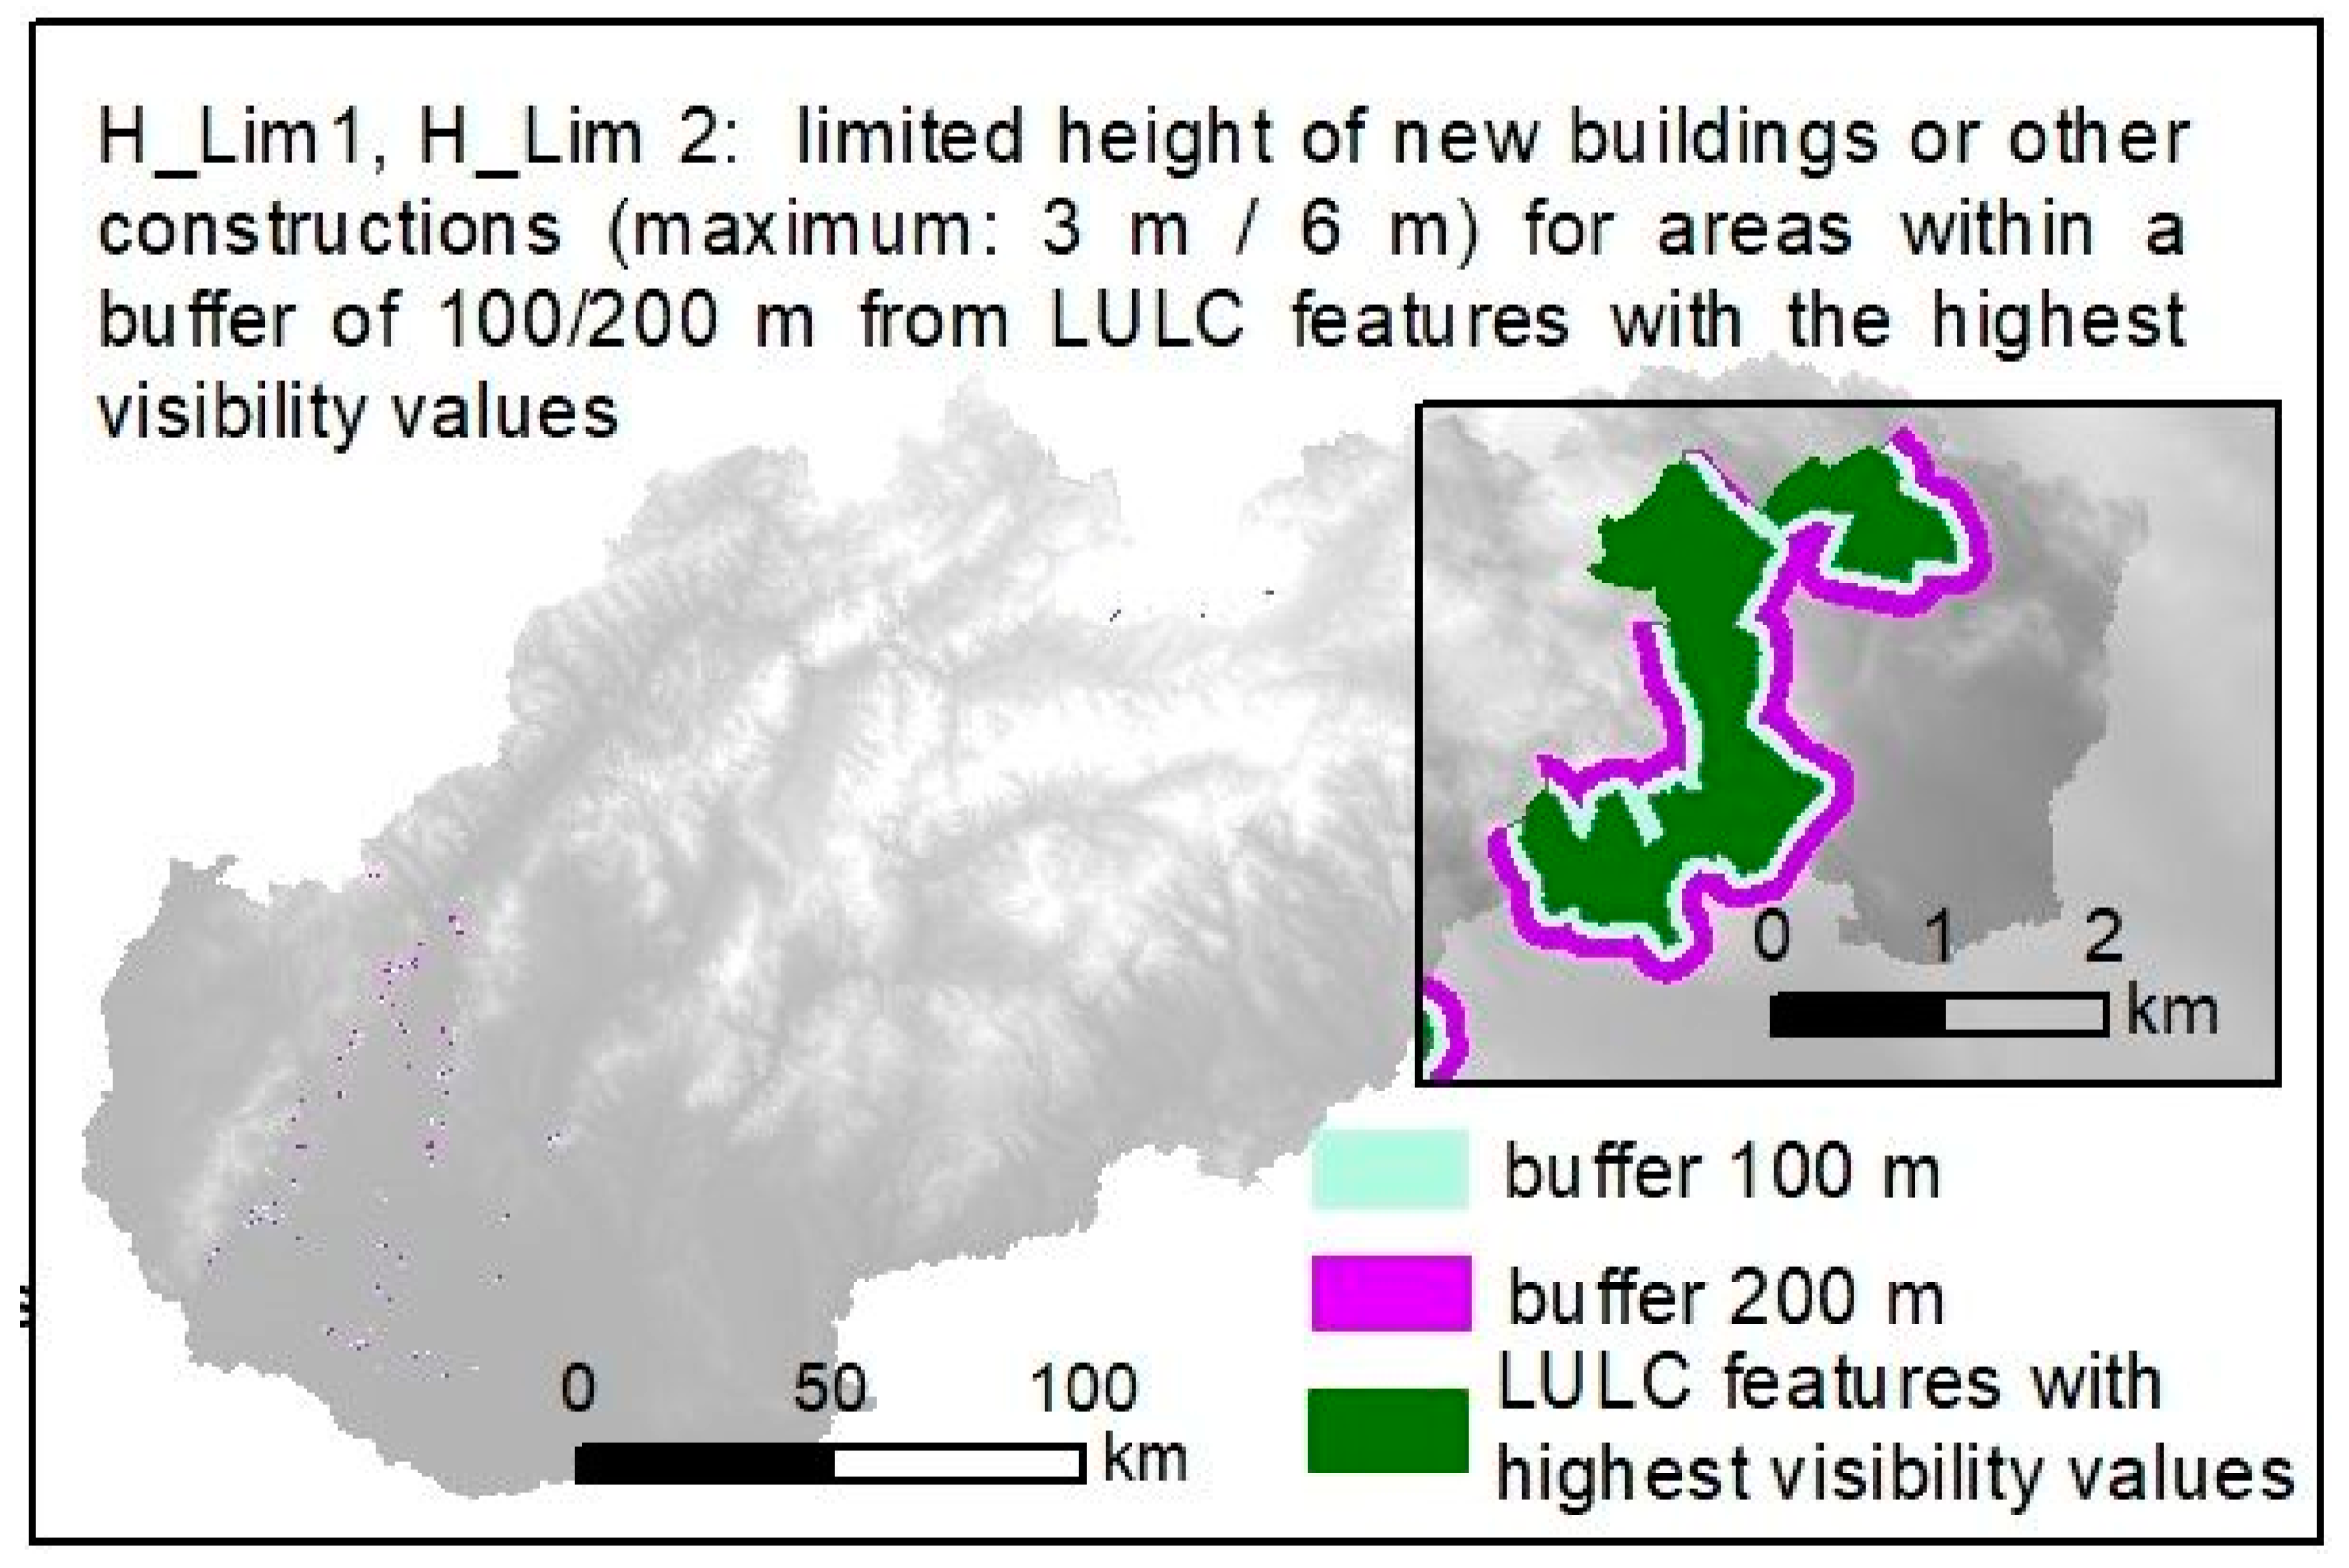
Figure 6 shows the results of the zonal statistics performed to summarize the mean of the visibility values for all cells included in each landscape unit. The map reflects the proximity of landscape units to the road networks. Landscape units with higher visibility values tend to be located near the road network, although there are also large landscape units with good visibility that areas are located far from road networks. (i.e., wide alluvial plains or dune planes).
Table 2 reports the primary statistics of the number of visible points summarized for the different landscape types, namely for levels 1 (basic types), 2 (characteristics types), and 3 (subtypes). At level 3, the most visible landscape types on average are Glacial mountains relief, because relief is naturally more visible; Wide alluvial plains, and Plane depression, because they are mostly located along main roads. The highest values of visibility are found for Core of uplands (slopes and ridges), which are highly visible portions of the landscape.

3.3. Planning Norms

The scenarios of the norms proposed above are mapped in Figure 7, Figure 8, Figure 9 and Figure 10, following the method introduced in the previous section. Figure 7 shows the five proposed types of new norms for landscape protection, while Table 3 also reports some basic statistics on the number and size of the involved areas, and the related types of various LULC features. The results show that the most common LULC categories included in the areas covered by the proposed new norms for landscape protection are agricultural categories.

4. Discussion

4.1. Normative Implications for Landscape Protection

Vineyards were the most common LULC category for which the norm “No landscape transformation allowed” (LT1) can be proposed (2853 ha). This is an interesting result as it provides the opportunity to add an additional argument for the protection of these important and historical landscape features. Indeed vineyards, which belong to the very valuable historical structures of the agricultural landscape, are very poorly protected in the current national landscape planning framework. Nature and landscape protection in Slovakia focuses primarily on attractive forms of biota—endemic, rare, endangered, and similar species-, while landscape structures have no protection, although they can be very valuable. Small portions of vineyards are protected as part of the Little Carpathians protected area. Current socio-economic conditions in Slovakia are unfavorable for the development of viticulture and many vineyards are disappearing or being abandoned. Some have been transformed into cottage areas and/or residential settlements and other anthropic land-uses have been inappropriately located over areas formerly used as vineyards.
Looking at the norm that limits landscape transformations to “only construction of rural buildings or maintenance of existing civil buildings” (LT2), by far the most frequent LULC category “broad-leave forest”. This means that this type of norm for the construction of new buildings may not conflict too much with the majority of this LULC category, where a limited number of buildings or other human activities can be present.
“Permanently irrigated land” was the most frequent LULC category for the norm limiting the height of new commercial or civil buildings in low visible landscapes (LT3) and for limiting the height of new buildings to 3 m (H_Lim1) and 6 m (H_Lim2). Also, for these cases, these norms which regulate the maximum height are likely to not generate too many conflicts with this LULC category, as in “Permanently irrigated land” the potential new constructions or buildings can be of rural types and therefore characterized by the limited height required by this specific norm.
Indeed, there are some instances where the proposed norms can generate some conflicts with existing LULC categories, especially with those where human activities are intense, and landscape transformations are more likely to happen.
For example, in “Discontinuous urban fabric”, or Industrial or commercial units” new building activities are likely to happen and therefore the restrictions posed by the norms can be quite limiting but yet necessary to preserve the landscape visibility. On the opposite, in “continuous urban fabric” category, the high density of the urban fabric may act as physical constrain and limit the possibility of new urban developments or landscape transformations.
The proposed norms can be further specified and tailored to the different LULC categories involved. For example, in agricultural categories such as “permanently irrigated land”, the limitation of the height of buildings can be restricted to specific types of buildings (i.e., civil buildings) only.
However, the visibility assessment cannot be sufficient to characterize completely the complexity of the landscape, as this type of analysis makes use of information on terrain morphology only. Some parts of the landscape with a high level of visibility may express a low landscape value (infrastructure, industrial plants, or intensive farmlands), whereas, on the contrary, other highly valuable areas (deep valleys, rivers) may not be directly visible [6]. Many other geographical, social, and historical factors can be valuable for people and therefore should be taken into account: natural areas, woods, riverbeds, farmlands, urban/historical sites, and other manufactures are all elements concurring to determine the perceived landscape value [27].
Furthermore, the proposed norms should also be integrated by other planning indications aiming at considering additional landscape preferences by different social subjects, protection objectives (i.e., biodiversity protection), management of natural risks (i.e., erosion). To this end, the integration of multidisciplinary landscape values and visibility can be an important step to identify differentiated planning norms for landscape protection.
Indeed, new standards for landscape protection would be very beneficial in Slovakia. In the country, after the socio-economical transformation, urban development has not been coordinated by specific national norms and standards, and this has generated a dramatic change in the character of the landscape. In cities, the development of new residential areas and related services followed unprecedented rates with respect to the pre-transformation period [28]. Urban densification, development of commercial areas and shopping centers, logistics centers, and industrial parks began to spread over agricultural areas with important landscape visibility, and this disrupted significantly the traditional character of the country, as well as its aesthetic. For these reasons, new norms and prescriptions at the national level are fundamental to regulate future changes in landscapes with natural, semi-natural, or agricultural values.
From an international and European perspective, the results obtained can directly contribute to the implementation of the European Landscape Convention (ELC) in Slovakia, especially for what concern the analysis phases required by the ELC process (points 4 and 5). In these phases European States ought to analyze the landscape types in the whole area of their countries, by (1) defining and analyzing their own landscape types at the national level; (2) recording landscape changes; (3) identifying basic drivers of changes; (4) assessing selected landscape types with respect to special values attributed by engaged participants and inhabitants; and (5) ensuring the necessary protection of all defined landscape types. Slovakia signed the ELC in 2005 and already identified and defined the landscape types with regard to their special values [29] and ensured the protection of the visibility of landscape types and the protection of landscape character [17]. From a normative point of view, the results of this research may be applied to a new draft of the law on landscape protection in Slovakia, which focuses on the implementation of the basic principles of the ELC and, at the same time, aims to ensure the protection of individual types and representative landscape geosystems [30].

4.2. Limitations and Possible Improvements

Some limitations related to the method used for the creation of the viewshed can be acknowledged. They are related to the representation and accuracy of the cumulative viewshed. First of all, the method depends strongly on the quality and spatial resolution of the available DTM dataset, as well as on the algorithm used for the viewshed generation, so that different errors may have an impact on the viewshed [31].
Imprecise DTM can produce worst results in higher resolution datasets than in lower resolution ones [32]. Having to assess the entire landscape of the Slovak Republic (an area larger than 49,000 km2), the available 20 m resolution DEM was resampled to 50 m, a resolution that has been considered sufficient to derive a cumulative viewshed for all of the countries, avoiding higher computational times needed in case of higher resolutions of the DTM. However, field surveys and in-site tests can be useful tools to validate the calculated viewshed with the landscape that can be actually visible from the sampled points of view [24].
In theory, the possibility of using a Digital Surface Model would have improved the accuracy of the elevation model. However, in the case of this research, no DSM was available and the possibility of adding the z information of land-cover data to the DTM for entire Slovakia was not convenient for a couple of reasons. First, the size of the study area would have made this further task extremely time-consuming (and beyond the actual scope of this research); second, no information on height was available for the land-cover data and its resolution would have not allowed us to add precise and reliable information of the z values for each category of land-cover: for example, categories of vegetation can include trees and/or shrubs with very different height. For these reasons, and given the nature and extent of this research, the use of a DTM was considered a good choice to achieve the objectives.
The overall reduction of visibility due to general environmental or atmospheric conditions is another aspect that can be further analyzed, especially for landscape assessment when long distance visibility is evaluated. The generic reduction of visibility was already taken into account with a specific option of the GIS algorithm used (the “viewshed” function in ArcGIS). This issue can be better addressed by imposing a distance decay function, although this might require the integration of additional software/models or other data [33,34], which could not be easily available for all the Slovak landscape.
Another limitation is the use the main highways and roads, while landscape can be enjoyed by many other areas or road types. However, considering the scale and extent of this research, the limitation to main highways and roads can be a good choice to evaluate the visibility of relevant parts of the entire Slovak Republic.
Assigning visibility values to LULC features (see Section 2.4) can have some limitations related to LULC data resolution. This could lead to the proposal of landscape protection norms for large LULC features, whilst the portion of highly visible landscape may be actually more limited in size. However, the inclusion of larger patches of LULC in new proposed protection norms resulted in a more conservative approach to landscape protection.
Finally, an important and desirable improvement in the methodology and therefore in results, may foresee include the inclusion of an additional geographic layer related to Cultural Heritage elements, to better consider the cultural dimension in the planning process. In Slovakia recent projects have started to survey and map important elements of the cultural heritage, combining digital photogrammetry (DP), remote sensing and terrestrial laser scanning [35].

5. Conclusions

At a national level, the visibility of a landscape is an important characteristic to be protected against different types of changes driven by urban and infrastructure development. Such changes can modify dramatically the visual quality of the landscape and, in some cases, even exclude some landscape features from the people’s view. Norms and regulations are therefore needed to avoid losing an important and highly relevant portion of the landscape. For the case study of the Slovak Republic, this paper introduced a methodology to identify a set of planning norms to regulate the different possible changes that may occur in highly visible landscape and in close-by areas.
After having analyzed the overall visibility of the Slovak landscape and identified the most visible landscape types, the methodology identified a set of planning norms aimed at protecting the current level of visibility. Norms include some limitations to possible landscape changes, with particular reference to the type of urban development allowed and heights of new buildings: these changes, may generate a potential negative impact on the landscape visibility, i.e., interrupting the line of sights and therefore excluding some landscape features from people’s perception.
The design of norms have followed a spatially explicit approach, by using geographic criteria of distance and proximity, and identified specific areas for their application. Finally, the relation between current land-use/land cover and areas where the norms can be proposed has been analyzed. Maps of the extent and spatial distribution of the proposed norms have highlighted possible situations of accordance or conflict with potential urban development trends, able to support landscape protection planning processes at the national level. A new law for Landscape protection is currently being prepared in Slovakia, aimed at implementing the requirements of the European Landscape Convention and the protection of individual landscape types. The results of this paper may be a useful basis to shape the new law, especially to include important visual factors among the basic standards of landscape protection.

Author Contributions

Conceptualization, D.L.R. and Z.I.; methodology, D.L.R. and Z.I.; software, D.L.R.; validation, D.L.R. and Z.I.; investigation, Z.I. and D.L.R.; resources, Z.I.; writing—original draft preparation, D.L.R.; writing—review and editing, Z.I. and D.L.R.; visualization, D.L.R.; project administration, Z.I.; funding acquisition, Z.I. All authors have read and agreed to the published version of the manuscript.

Funding

This work has been produced with the support of the Integrated Infrastructure Operational Program for the project: Assessment of Landscape Change and its Impact on the Environment. Project code: 313011X649, co-financed by the European Regional Development Fund. Support was also given under ADDRESS project, funded by Piano della Ricerca 2020–2022, (Department of Civil Engineering and Architecture, University of Catania).

Conflicts of Interest

The authors declare no conflict of interest.

References

  1. Martín, B.; Ortega, E.; Otero, I.; Arce, R.M. Landscape character assessment with GIS using map-based indicators and photographs in the relationship between landscape and roads. J. Environ. Manag. 2016, 180, 324–334. [Google Scholar] [CrossRef] [PubMed]
  2. Lim, E.; Honjo, T.; Umeki, K. The validity of VRML images as a stimulus for landscape assess-ment. Landsc. Urban Plan. 2006, 77, 80–93. [Google Scholar] [CrossRef]
  3. Dramstad, W.; Tveit, M.S.; Fjellstad, W.J.; Fry, G. Relationships between visual landscape preferences and map-based indicators of landscape structure. Landsc. Urban Plan. 2006, 78, 465–474. [Google Scholar] [CrossRef]
  4. De Groot, M.; Winnubst, M.H.; Van Schie, N.; Van Ast, J.A. Visioning with the Public: Incorporating Public Values in Landscape Planning. Eur. Plan. Stud. 2013, 22, 1165–1181. [Google Scholar] [CrossRef]
  5. Sahraoui, Y.; Vuidel, G.; Joly, D.; Foltête, J.-C. Integrated GIS software for computing landscape visibility metrics. Trans. GIS 2018, 22, 1310–1323. [Google Scholar] [CrossRef]
  6. Chamberlain, B.C.; Meitner, M.J. A route-based visibility analysis for landscape management. Landsc. Urban Plan. 2013, 111, 13–24. [Google Scholar] [CrossRef]
  7. La Rosa, D. The observed landscape: Map of visible landscape values in the province of Enna (Italy). J. Maps 2011, 7, 291–303. [Google Scholar] [CrossRef]
  8. Wheatley, D. Cumulative viewshed analysis: A GIS-based method for investigating intervisibility, and its archaeological application. In Archaeology and Geographical Information Systems: A European Perspective; Lock, G.R., Stancic, Z., Eds.; Taylor and Francis: London, UK, 1995; pp. 171–185. [Google Scholar]
  9. Wilson, J.; Lindsey, G.; Liu, G. Viewshed characteristics of urban pedestrian trails, Indianapolis, Indiana, USA. J. Maps 2008, 4, 108–118. [Google Scholar] [CrossRef]
  10. Domingo-Santos, J.M.; de Villarán, R.F.; Rapp-Arrarás, I.; de Provens, E.C.-P. The visual exposure in forest and rural landscapes: An algorithm and a GIS tool. Landsc. Urban Plan. 2011, 101, 52–58. [Google Scholar] [CrossRef]
  11. Möller, B. Changing wind-power landscapes: Regional assessment of visual impact on land use and population in Northern Jutland, Denmark. Appl. Energy 2006, 83, 477–494. [Google Scholar] [CrossRef]
  12. VanHorn, J.E.; Mosurinjohn, N.A. Urban 3D GIS modeling of terrorism sniper hazards. Soc. Sci. Comput. Rev. 2010, 28, 482–496. [Google Scholar] [CrossRef]
  13. Kalinauskas, M.; Mikša, K.; Inácio, M.; Gomes, E.; Pereira, P. Mapping and assessment of landscape aesthetic quality in Lithuania. J. Environ. Manag. 2021, 286, 112239. [Google Scholar] [CrossRef] [PubMed]
  14. Wartmann, F.M.; Frick, J.; Kienast, F.; Hunziker, M. Factors influencing visual landscape quality perceived by the public. Results from a national survey. Landsc. Urban Plan. 2021, 208, 104024. [Google Scholar] [CrossRef]
  15. Ioannidis, R.; Koutsoyiannis, D. A review of land use, visibility and public perception of renewable energy in the context of landscape impact. Appl. Energy 2020, 275, 115367. [Google Scholar] [CrossRef]
  16. Miklós, L.; Izakovičová, Z.; Boltiziar, M.; Diviaková, A.; Grotkovská, L.; Hrnčiarová, T.; Imrichová, Z.; Kočická, E.; Kočický, D.; Kenderessy, P.; et al. Atlas Reprezentatívnych Geoekosystémov Slovenska; Slovenská Akadémia Vied, Ústav Krajinnej Ekológie, Ministerstvo Školstva SR: Bratislava, Slovakia, 2006; p. 227. [Google Scholar]
  17. Špulerová, J.; Bezák, P.; Dobrovodská, M.; Lieskovský, J.; Štefunková, D. Traditional agricultural landscapes in Slovakia: Why should we preserve them? Landsc. Res. 2017, 42, 891–903. [Google Scholar] [CrossRef]
  18. Mazúr, E.; Lukniš, M. Regional geomorphological division of SSR. Geogr. J. 1978, 30, 101. [Google Scholar]
  19. Tremboš, P.; Minár, J. Morphological-morphometric types of relief in the Slovak Republic. Map 1: 500 000. In Atlas of the Slovak Republic; Ministry of the Environment of the Slovak Republic Bratislava, Slovak Environment Agency Banská Bystrica: Banská Bystrica, Slovakia, 2002; p. 344. ISBN 80-88833-27-2. [Google Scholar]
  20. Esprit. Digital Terrain Model. Available online: www.esprit-bs.sk (accessed on 15 May 2021).
  21. Bezák, P.; Izakovičová, Z.; Miklós, L. Representative Landscape Types of Slovakia. (In Slovak: Reprezentatívne Typy Krajiny Slovenska); Institute of Landscape Ecology SAS: Bratislava, Slovakia, 2010; 180p, ISBN 978-80-89325-15-3. [Google Scholar]
  22. Slovak Road Administration. Available online: www.cdb.sk (accessed on 15 May 2021).
  23. Tandy, C.R.V. The isovist method of landscape survey. In Methods of Landscape Analysis; Murray, H.C., Ed.; Landscape Research Group: London, UK, 1967; p. 9e10. [Google Scholar]
  24. Nutsford, D.; Reitsma, F.; Pearson, A.L.; Kingham, S. Personalising the viewshed: Visibility analysis from the human perspective. Appl. Geogr. 2015, 62, 1–7. [Google Scholar] [CrossRef]
  25. Llobera, M. Extending GIS-based visual analysis: The concept of visualscapes. Int. J. Geogr. Inf. Sci. 2003, 17, 25–48. [Google Scholar] [CrossRef]
  26. La Rosa, D.; Privitera, R.; Martinico, F.; La Greca, P. Measures of Safeguard and Rehabilitation for landscape protection planning: A qualitative approach based on diversity indicators. J. Environ. Manag. 2013, 127, S73–S83. [Google Scholar] [CrossRef]
  27. Stephenson, J. The Cultural Values Model: An integrated approach to values in landscapes. Landsc. Urban Plan. 2008, 84, 127–139. [Google Scholar] [CrossRef]
  28. Pazúr, R.; Bolliger, J. Enhanced land use datasets and future scenarios of land change for Slovakia. Data Brief 2017, 14, 483–488. [Google Scholar] [CrossRef] [PubMed]
  29. Izakovicova, Z. Implementation of the European Landscape Convention in the Slovak Republic. In Implementation of Landscape Ecological Knowledge in Practice, Proceedings of the 1st IALE-Europe Thematic Symposium; Macias, A., Mizgajski, A., Eds.; Wydawnictwo Naukowe: Poznan, Poland, 2010; pp. 119–125. ISBN 978-83-232-2154-8. [Google Scholar]
  30. Lieskovský, J.; Bezák, L.; Izakovičová, Z. Protection of representative landscape ecosystem of Slovakia-new landscape ecological approach. In Modern Management of Mine Producing, Geology and Environmental Protection 2: Proceedings of the 10th International Multidisciplinary Scientific Geoconference; SGEM: Albena, Bulgaria, 2010; pp. 717–723. ISBN 978-954-91818-1-4. [Google Scholar]
  31. Ervin, S.; Steinitz, C. Landscape Visibility Computation: Necessary, but Not Sufficient. Environ. Plan. B Plan. Des. 2003, 30, 757–766. [Google Scholar] [CrossRef]
  32. Riggs, P.D.; Dean, D.J. An Investigation into the Causes of Errors and Inconsistencies in Predicted Viewsheds. Trans. GIS 2007, 11, 175–196. [Google Scholar] [CrossRef]
  33. Bishop, I.D.; Miller, D.R. Visual assessment of off-shore wind turbines: The influence of distance, contrast, movement and social variables. Renew. Energy 2007, 32, 814–831. [Google Scholar] [CrossRef]
  34. Kumsap, C.; Borne, F.; Moss, D. The technique of distance decayed visibility for forest landscape visualization. Int. J. Geogr. Inf. Sci. 2005, 19, 723–744. [Google Scholar] [CrossRef]
  35. Brehovská, J.; Brunčák, P.; Dedík, L.; Kravjanská, I.; Sučíková, A. Digitization of Cultural Heritage of Slovak Republic. Int. Arch. Photogramm. Remote Sens. Spatial Inf. Sci. 2016, XLI-B5, 421–428. [Google Scholar] [CrossRef] [Green Version]
Figure 1. Map of Landscape types.
Land 11 00977 g001
Figure 2. Selected major roads and DTM for the Slovak Republic.
Land 11 00977 g002
Figure 3. Cumulative viewshed method: numbers in the cell indicates the number of times each cell is visible from the three points in the grey cells.
Land 11 00977 g003
Figure 4. Example of zonal statics function: for each landscape unit (outlined in black) the label indicates the maximum scores of all the cells that fall inside it.
Land 11 00977 g004
Figure 5. Cumulative viewshed from road network (classes made with natural break algorithm).
Land 11 00977 g005
Figure 6. Visibility scores summarized per landscape unit (level 3).
Land 11 00977 g006
Figure 7. Maps of the different proposed norms: LT1.
Land 11 00977 g007
Figure 8. Maps of the different proposed norms: LT2.
Land 11 00977 g008
Figure 9. Maps of the different proposed norms: LT3.
Land 11 00977 g009
Figure 10. Maps of the different proposed norms: LT4.
Land 11 00977 g010
Table 1. Main parameters used in the viewshed analysis.
Height of observer1.6 m
offset height for observed point0
superior vertical angle of observation90°
inferior vertical angle of observation−90°
left horizontal angle of observation0
right horizontal angle of observation360
Table 2. Extent of land-use/land cover categories for each proposed norm (highlighted in green the most frequent categories with higher average values of visibility).
Area (km2)MaxAverageStdSumMinority
Landscape Class—Level 1
lowland landscape14,0612889.1121.2551,231,457235
basin landscape89401814.1010.2114,647,664159
mountain landscape26,0714013.7915.2339,480,493342
Landscape Class—Level 2
Wavy plains 40622337.2717.8311,819,339203
alluvial plains24711574.899.684,835,038131
Hills of basins56461813.5910.108,101,363159
Uplands 16,5813493.4915.9923,132,786342
basin uplands 8241515.1912.141,711,263103
highlands84384013.4812.1011,743,619277
Plains588223413.2524.9731,171,629222
lowland hills41172885.0017.128,240,489235
Mountain relief 105220510.9422.184,604,088174
Landscape Class—Level 3
Wavy plains of river terraces and loess plateaus 26132287.2117.637,539,760194
Core of basins and valleys with alluvial plain 24711574.899.684,835,038131
Hills of basins and valleys 56461813.5910.108,101,363159
Core of uplands (slopes and ridges)13,5023494.0917.4422,093,699342
Uplands of marginal basins and valleys 8241515.1912.141,711,263103
Highly broken hills and uplands of intermountain furrows 21091730.483.16405,83177
Less broken uplands with plateaus 8651550.663.38227,16356
Less broken highlands with furrows 352130.050.49656213
Core of highlands (slopes and ridges) 75874013.6912.5911,183,393277
Less broken highlands with plateaus 280933.448.72384,67273
Plane depressions122519711.8822.525,821,463173
Wide alluvial plains465723413.6125.5625,350,166222
Dune planes 14,4922337.3818.194,279,579194
Lowland polygenetic hills and flat foothills 41,1712885.0017.128,240,489235
Less broken highlands with karst plains 2200661.925.63168,99239
Karst uplands10512159.6625.04406,09376
Mountain relief67951417.1215.181,935,699126
Glacial mountains relief372720517.9029.892,668,389174
Table 3. Extent in hectares of land-use/land cover categories for each proposed norm (ha). Highlighted in green the most frequent categories.
Corine Land Use Land Cover Class (Level 3)No Landscape Transformations Allowed
LT1
Limited Landscape Transformations
LT2
Limited Landscape Transformations
LT3
Limited Height of New Buildings
Max 3 m, within 100 m
H_lim 1
Max 6 m, within 200 m
H_lim 2
Continuous urban fabric156026327100
Discontinuous urban fabric43714,32745,941188192
Industrial or commercial units0347410,0867371
Road and rail networks and associated land0319195800
Port areas00000
Airports0388127300
Mineral extraction sites58493115900
Dump sites03354000
Construction sites023527000
Green urban areas05364600
Non-irrigated arable land38178814583533
Permanently irrigated land9003575414,78928812936
Vineyards285332612677010
Fruit trees and berry plantations35012261985119
Pastures182205322,17399
Complex cultivation patterns997792685082939
Land principally occupied by agriculture, with significant areas of natural vegetation1041641728,868158155
Broad-leaved forest188565,350201,789571578
Coniferous forest307139371,194306291
Mixed forest786632641,1536759
Natural grasslands39429613,6113526
Moors and heathland903219239855457
Transitional woodland-shrub601441618,4222117
Bare rocks006142114113
Sparsely vegetated areas1820000
Inland marshes0047600
Water courses0015361716
Water bodies58046903839
Publisher’s Note: MDPI stays neutral with regard to jurisdictional claims in published maps and institutional affiliations.

