
Spatial Heterogeneity of Public Service Facilities in the Living Circle and Its Influence on Housing Prices: A Case Study of Central Urban Dalian, China


Abstract
:1. Introduction
2. Data and Methods
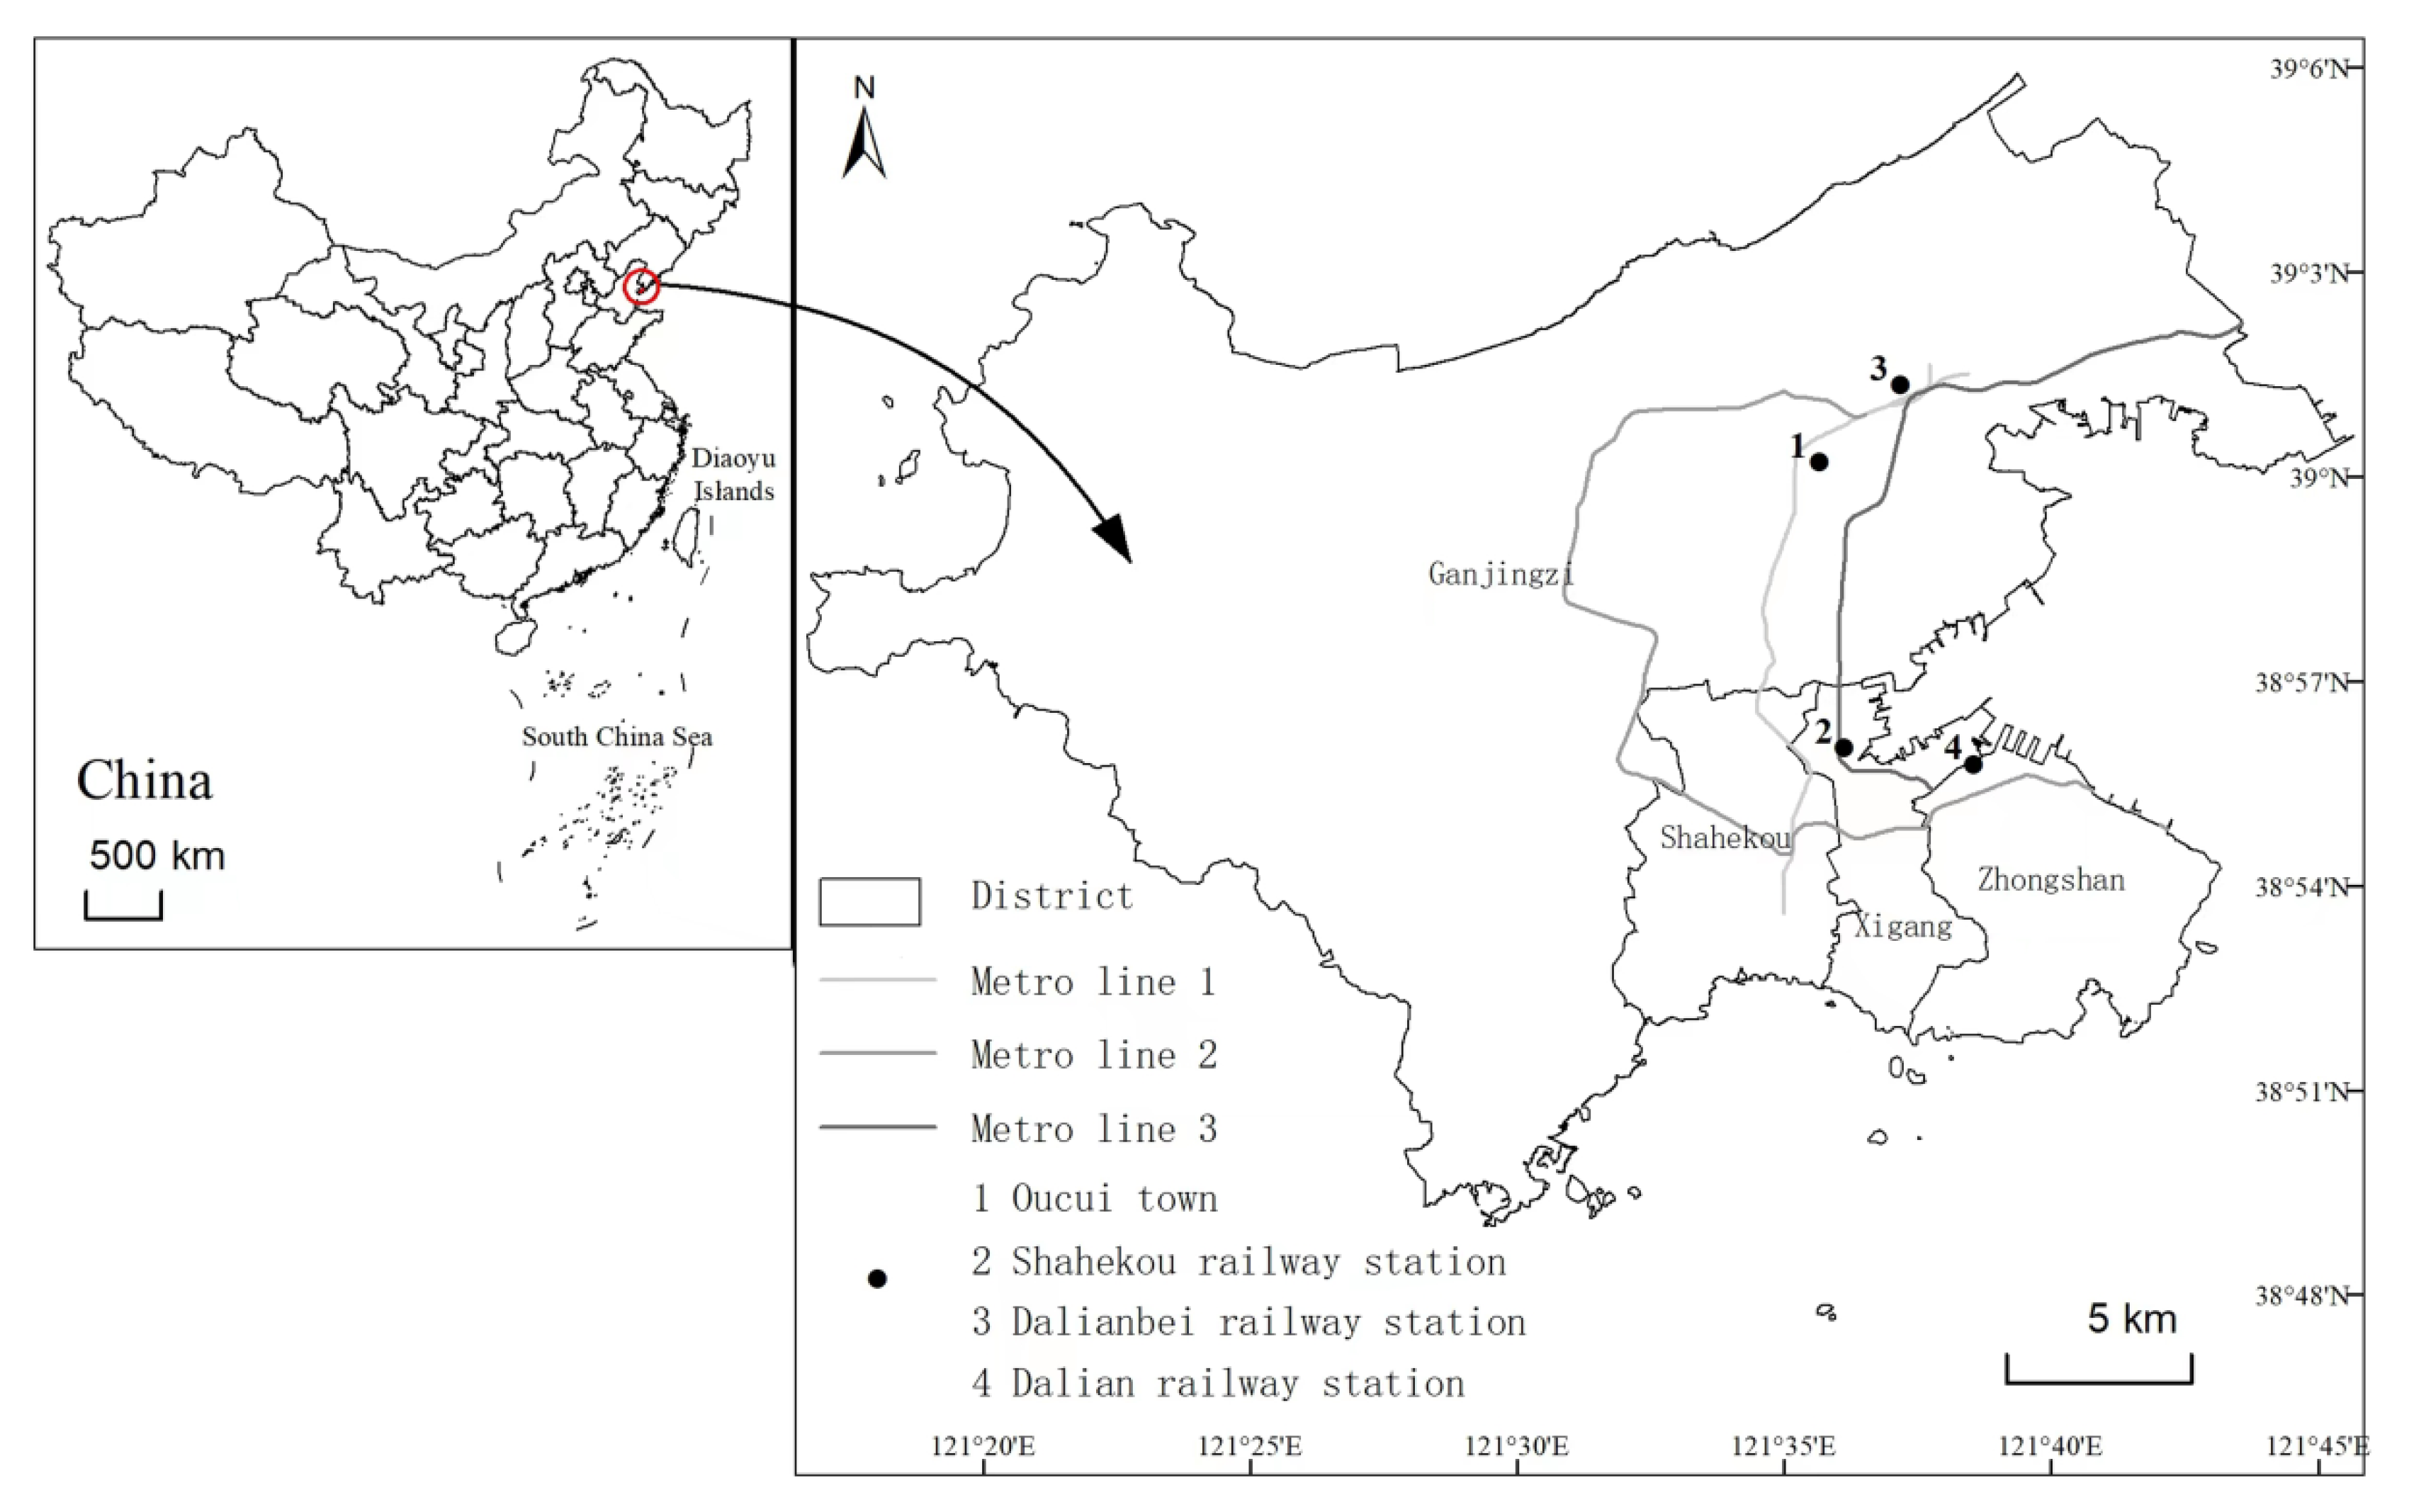
2.1. Research Area
2.2. Data Sources
2.3. Research Methods
3. Results
3.1. Spatial Distribution of Public Service Facilities
3.2. Spatial Agglomeration of Public Service Facilities
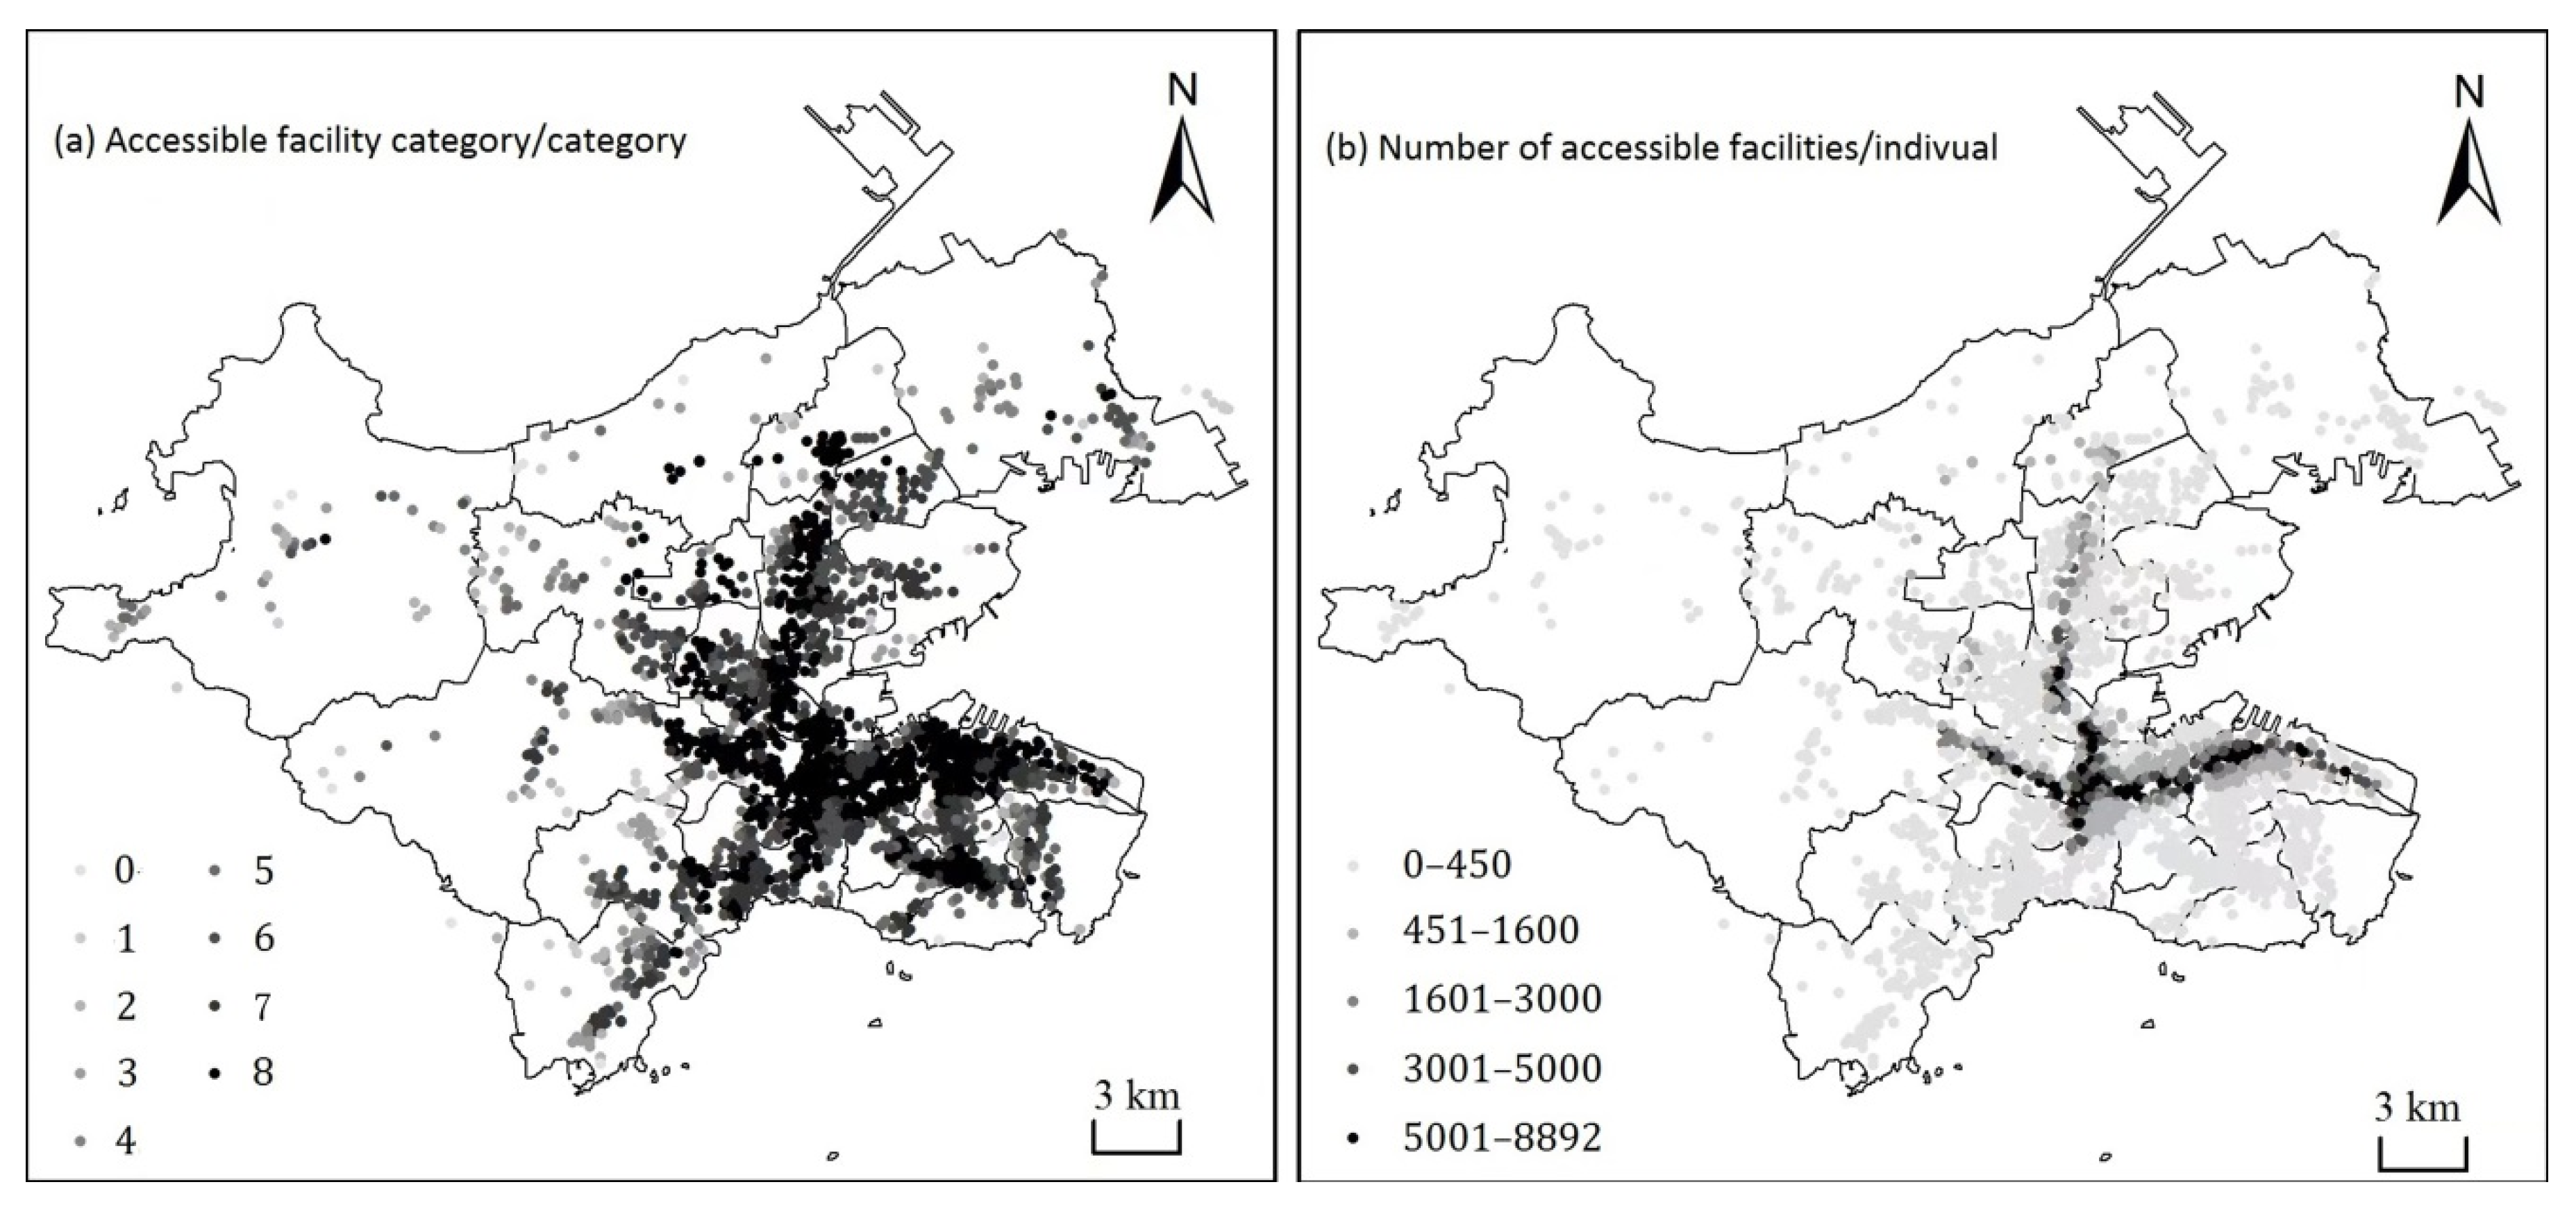
3.3. Analysis of Accessible Public Service Facilities to Residents
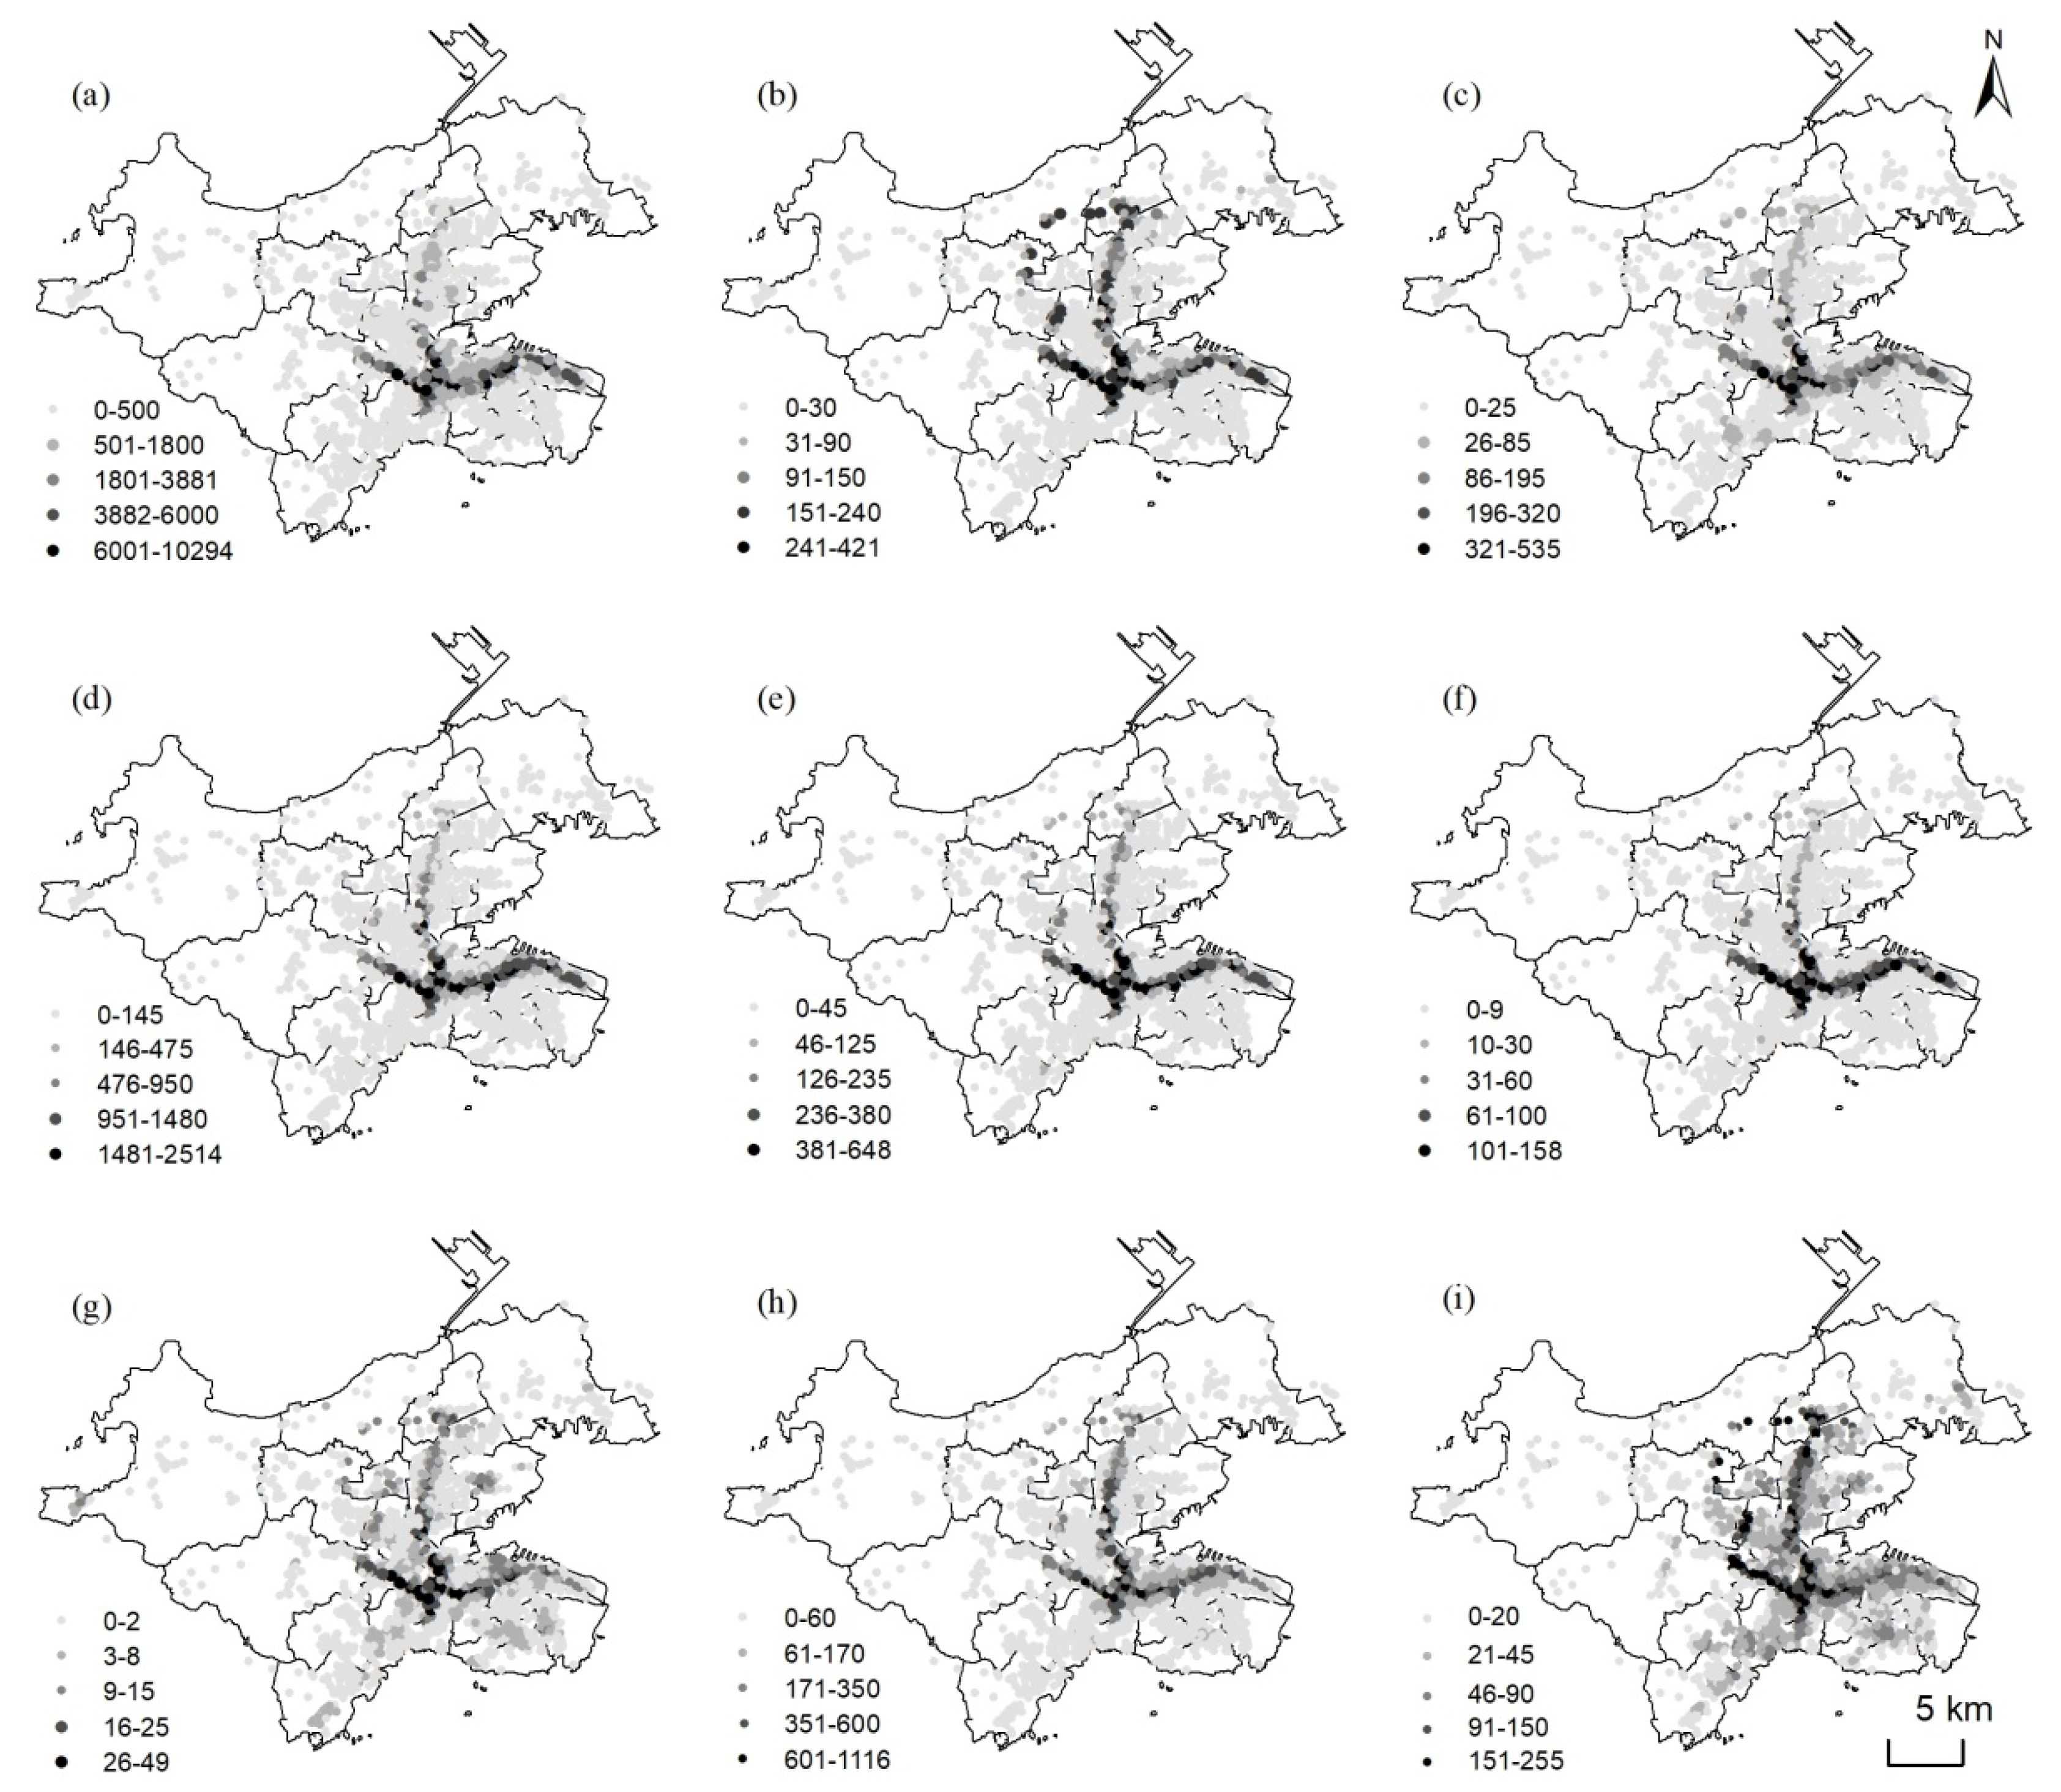
3.4. Accessibility of Public Service Facilities
3.5. Impact of Public Service Facility Accessibility on Housing Prices
3.5.1. Variable Selection
3.5.2. Model Construction and Result Analysis
4. Discussion
4.1. Agglomeration Characteristics of Public Service Facilities at the Microscale
4.2. Extracting Factors Influencing Housing Prices
4.3. Limiting Factors
5. Conclusions
- (1)
- The PSFs in central urban Dalian are unevenly distributed, with more facilities in the Zhongshan, Shahekou, and Xigang Districts than those in the Ganjingzi District. The spatial aggregation of PSFs was evident, although the degree of agglomeration varied depending on the facility type, where the agglomeration of business facilities was higher than that of public welfare facilities. Market-led catering, shopping, and living service facilities formed a high-density region in the core area of the central city, displaying a center–periphery layout. Government-led public welfare services, such as elderly care, transportation, sports and fitness, and medical care were widely distributed, and displayed a multi-center layout with a relatively balanced distribution over the study area.
- (2)
- Significant spatial differences in the number of facilities accessible and the primary urban traffic routes had a notable effect on population and industry agglomeration. Further, differences in public service facility accessibility were also recorded across various communities, with more than two-thirds of residents able to obtain ≥seven types of PSFs within a 15-min walking distance. PSFs were notably limited along the Hongqi Street, Yingchengzi Street, Gezhenbao Street, and Dalian Bay Street, along the edge of Ganjingzi District.
- (3)
- Based on the cumulative opportunity method and distance attenuation effect, the accessibility of various PSFs in the residential areas of central Dalian was calculated. The results showed that the spatial distribution of accessibility is unbalanced, with the distribution of business service facilities generally being higher than that of public welfare facilities. Accessibility for all types of PSFs was the highest in the Shahekou District, while that for operating PSFs in the Zhongshan District was higher than in the other two districts, and the accessibility of public welfare public services was greater in the Xigang District than that in the other two districts. Notably, accessibility for all types of PSFs was the most limited in the Ganjingzi District.
- (4)
- By introducing the commercial areas and characteristic locations of the residential areas, the influence of the accessibility to various PSFs on housing prices were assessed, which revealed that access to education, sports, culture, and leisure facilities, as well as overall accessibility and greening rate of the residential area, had the most significant positive correlations with housing prices. In contrast, the number of households in the residential area and distance between the region and the nearest large shopping center were significantly negatively correlated with housing price.
Author Contributions
Funding
Data Availability Statement
Acknowledgments
Conflicts of Interest
References
- Morrill, R.L.; Symons, J. Efficiency and equity aspects of optimum location. Geogr. Anal. 1977, 9, 215–225. [Google Scholar] [CrossRef]
- Murray, A.T. Maximal coverage location problem: Impacts, significance, and evolution. Int. Reg. Sci. Rev. 2016, 39, 5–27. [Google Scholar] [CrossRef]
- Neutens, T.; Delafontaine, M.; Scott, D.M. A GIS-based method to identify spatiotemporal gaps in public service delivery. Appl. Geogr. 2012, 32, 253–264. [Google Scholar] [CrossRef] [Green Version]
- Bao, K.Y.; Tong, D. The effects of spatial scale and aggregation on food access assessment: A case study of Tucson, Arizona. Prof. Geogr. 2017, 69, 337–347. [Google Scholar] [CrossRef]
- Tang, P.F.; Xiang, J.J.; Luo, J. Spatial accessibility analysis of primary schools at the county level based on the improved potential model: A case study of Xiantao City, Hubei Province. Prog. Geogr. 2014, 36, 697–708. [Google Scholar]
- Jiang, H.B.; Zhang, W.Z.; Wei, S. Public service facility accessibility as influenced by public transportation in Beijing. Prog. Geogr. 2017, 36, 1239–1249. [Google Scholar]
- Tan, P.Y.; Samsudin, R. Effects of spatial scale on assessment of spatial equity of urban park provision. Landsc. Urban Plan. 2017, 158, 139–154. [Google Scholar] [CrossRef]
- Ekkel, E.D.; Vries, S.D. Nearby green space and human health. Landsc. Urban Plan. 2017, 157, 214–220. [Google Scholar] [CrossRef]
- Spyratos, S.; Stathakis, D. Evaluating the services and facilities of European cities using crowd sourced place data. Environ. Plan. B Urban Anal. City Sci. 2018, 45, 733–750. [Google Scholar] [CrossRef]
- Han, Z.; Du, P.; Wang, L. Method for optimal allocation of regional public service infrastructure: A case study of Xinghua street primary school. Sci. Geogr. 2014, 34, 803–809. [Google Scholar]
- Wang, J.C.; Lu, M.; Yuan, Z.Y. Point pattern analysis of ATMs distribution based on Ripley’s K-function method in Nanjing City. Sci. Geogr. Sin. 2016, 36, 1843–1849. [Google Scholar]
- Zhan, D.S.; Zhang, W.Z.; Yu, J.H. Analysis of influencing mechanism of residents’ livability satisfaction in Beijing using geographical detector. Prog. Geogr. 2015, 34, 966–975. [Google Scholar]
- Chen, L.; Zhang, W.Z.; Yang, Y.Z. Residents’ incongruence between reality and preference of accessibility to urban facilities in Beijing. Acta Geogr. Sin. 2013, 68, 1071–1081. [Google Scholar]
- Mao, X.G.; Song, J.P.; Yang, H.Y. Changes in the spatial pattern of Beijing city parks from 2000 to 2010. Prog. Geogr. 2012, 31, 1295–1306. [Google Scholar]
- Rueda, S. City models: Basic indicators. Quaderns 2000, 225, 25–32. [Google Scholar]
- Burton, E. The compact city: Just or just compact? A preliminary analysis. Urban Stud. 2000, 37, 1969–2006. [Google Scholar] [CrossRef]
- MLIT. White Paper on Land, Infrastructure, Transport and Tourism in Japan. (24 June 2016). Available online: http://www.mlit.go.jp/en/statistics/white-paper-mlit-2014.html (accessed on 18 August 2017).
- Shao, Q.; Zhang, W.; Cao, X.; Yang, J.; Yin, J. Threshold and moderating effects of land use on metro ridership in Shenzhen: Implications for TOD planning. J. Transp. Geogr. 2020, 89, 102878. [Google Scholar] [CrossRef]
- Park, K.; Ewing, R.; Sabouri, S.; Choi, D.A.; Hamidi, S.; Tian, G. Guidelines for a polycentric region to reduce vehicle use and increase walking and transit use. J. Am. Plan. Assoc. 2020, 86, 236–249. [Google Scholar] [CrossRef]
- Zhang, W.; Lu, D.; Zhao, Y.; Luo, X.; Yin, J. Incorporating polycentric development and neighborhood life-circle planning for reducing driving in Beijing: Nonlinear and threshold analysis. Cities 2022, 121, 103488. [Google Scholar] [CrossRef]
- Zhu, Y.N. Research on Equal Allocation of Basic Public Service Facilities in Zizhang County from the Perspective of Life Circle; Xi’an University of Architecture and Technology: Xi’an, China, 2017. [Google Scholar]
- Chai, Y.W. Unit-based spatial structure of urban life in China: An empirical study of Lanzhou. Geogr. Res. 1996, 1, 30–38. [Google Scholar]
- Helbich, M.; Schadenberg, B.; Hagenauer, J. Food deserts? Healthy food access in Amsterdam. Appl. Geogr. 2017, 83, 1–12. [Google Scholar] [CrossRef]
- Liu, Z.B.; Zhang, C.; Dai, T.Q. Accessibility evaluation of various public service facilities in Beijing. Econ. Geogr. 2018, 38, 77–84. [Google Scholar]
- Xu, Y.; Wen, M.; Wang, F. Multilevel built environment features and individual odds of overweight and obesity in Utah. Appl. Geogr. 2015, 60, 197–203. [Google Scholar] [CrossRef] [PubMed] [Green Version]
- Shanahan, D.F.; Lin, B.B.; Gaston, K.J. Socio-economic inequalities in access to nature on public and private lands: A case study from Brisbane, Australia. Landsc. Urban Plan. 2014, 130, 14–23. [Google Scholar] [CrossRef]
- Yao, X.S.; Leng, H.; Wei, Y. Evaluation of urban park supply based on the activity demand of the elderly-a case study of Changchun city. Econ. Geogr. 2015, 35, 218–224. [Google Scholar]
- Pulver, A.; Wei, R. Optimizing the spatial location of medical drones. Appl. Geogr. 2018, 90, 9–16. [Google Scholar] [CrossRef]
- Zhan, D.S.; Zhang, W.Z.; Dang, Y.X. Analysis of spatial agglomeration characteristics of public service facilities in Beijing. Econ. Geogr. 2018, 38, 76–82. [Google Scholar]
- Ma, W.J.; Li, L.; Gu, J. Study on spatial layout and accessibility of basic security public service facilities in Shanghai 15-min living circle. Planner 2020, 36, 11–19. [Google Scholar]
- Han, Z.L.; Li, Y.; Liu, T.B. Spatial differentiation analysis of public service facilities allocation in community life circle--A case study of Shahekou district, Dalian. Adv. Geogr. Sci. 2019, 38, 1701–1711. [Google Scholar]
- Zhang, X.K.; Pei, X.R.; Li, J.R. Spatial difference of public service facilities allocation in downtown Tianjin from the perspective of the living circle. Resour. Environ. Arid. Area 2021, 35, 43–51. [Google Scholar]
- Li, R.H.; Gong, S.Z.; Gao, Y. Accessibility of public service facilities in Beijing and its impact on housing prices. J. Peking Univ. (Nat. Sci. Ed.) 2021, 57, 875–884. [Google Scholar]
- Zhao, P.J.; Luo, J.; Hu, H.Y. Research on Spatial Matching between Life Circle Scope and Service Facilities Based on Big Data--Taking Beijing as an Example. Adv. Geogr. Sci. 2021, 40, 541–553. [Google Scholar]
- Mcallister, D.M. Equity and efficiency in public facility location. Geogr. Anal. 1976, 8, 47–63. [Google Scholar] [CrossRef]
- Pozoukidou, G.; Chatziyiannaki, Z. 15-min City: Decomposing the new urban planning eutopia. Sustainability 2021, 13, 928. [Google Scholar] [CrossRef]
- Weng, M.; Ding, N.; Li, J.; Jin, X.; Xiao, H.; He, Z.; Su, S. The 15-min walkable neighborhoods: Measurement, social inequalities and implications for building healthy communities in urban China. J. Transp. Health 2019, 13, 259–273. [Google Scholar] [CrossRef]
- Xue, B.; Xiao, X.; Li, J.Z. Spatial differentiation and empirical study of influencing factors of housing prices in old industrial areas based on POI big data. Hum. Geogr. 2019, 34, 106–114. [Google Scholar]
- Wang, H. Analysis of influencing factors of real estate price based on spatial measurement. Econ. Rev. 2012, 01, 48–56. [Google Scholar]
- Song, W.X.; Liu, C.H. Study on the price differentiation mechanism of urban commercial housing in the integrated region of Yangtze River Delta. Geogr. Res. 2018, 37, 92–102. [Google Scholar]
- Dong, Z.Y.; Guan, H.; Ming, Y. Analysis of influencing factors of real estate price: An empirical study based on panel data of provinces and cities in China. J. China Univ. Geosci. (Soc. Sci. Ed.) 2010, 10, 98–103. [Google Scholar]
- Sun, B.; Shan, Y. Characteristics and influencing factors of spatial differentiation of housing prices in big cities under the action of a polyesters-a case study of Hefei. Resour. Environ. Yangtze River Basin 2021, 30, 1538–1546. [Google Scholar]
- Luo, X.R.; Yue, B.J.; Lin, A.W. The influence of accessibility of public service facilities on housing prices in downtown Wuhan based is on the analysis of the triple play transportation system. Reg. Res. Dev. 2019, 38, 86–91, 96. [Google Scholar]
- Gao, Z.Y.; Zhang, H.F.; Ma, X.F. Study on spatial coordination between residential space and public service facilities in Xining city. Resour. Environ. Arid. Area 2020, 34, 64–72. [Google Scholar]
- Zhao, P.J.; Hu, H.Y.; Hai, X.D. Multi-dimensional identification of a spatial range of metropolitan area in urban agglomeration based on mobile phone signaling data-A case study of Beijing-Tianjin-Hebei. Urban Dev. Res. 2019, 26, 69–79. [Google Scholar]
- Huang, J.N.; Zhu, K.Y. Social equity performance evaluation of public service facilities layout in Wuhan based on POI data. Mod. City Res. 2021, 6, 24–30. [Google Scholar]
- Zhang, W.Z.; Yu, J.H.; Zhan, D.S. Research Report on Livable Cities in China; Science Press: Beijing, China, 2016. [Google Scholar]
- Zhao, D.X.; Han, Z.L.; Ren, Q.L. Study on the relationship between the spatial feature of urban population aging and the pension resources matching: Take the three provinces of the Northeast China as an example. Resour. Sci. 2018, 40, 1773–1786. [Google Scholar]
- Song, W.X.; Ma, Y.Z.; Chen, Y.R. Temporal and spatial differentiation and influencing factors of residential sales and rent prices in Nanjing city. Adv. Geogr. Sci. 2018, 37, 1268–1276. [Google Scholar]
- Zhang, J.; Yang, Y.; Jiang, T.C. Analysis of housing price evolution in Shanghai-based on spatio-temporal heterogeneity detection. Surv. Mapp. Sci. 2020, 45, 175–196. [Google Scholar]
- Zhang, Z.P.; Zheng, D.Q. Mining and analysis of objective factors affecting regional housing prices. Comput. Appl. Softw. 2019, 36, 32–85. [Google Scholar]


| Category | Item | Quantity/ Individual | Proportion/% |
|---|---|---|---|
| Shopping/ catering | Shopping malls, supermarkets, restaurants | 16,334 | 59.28 |
| Transportation | Bus station, subway station | 1424 | 5.17 |
| Educational | Kindergarten, primary school, middle school, and secondary vocational training school | 945 | 3.43 |
| Life service | Post office, beauty salon, laundry, bath, bank | 4171 | 15.14 |
| Physical fitness | Sports venues, chess, and card rooms, park squares | 1461 | 5.30 |
| Cultural/leisure | Theaters, libraries, comprehensive cultural centers | 255 | 0.93 |
| Pension facilities | Nursing homes and activity centers for the elderly | 214 | 0.78 |
| Medical | Pharmacy, clinic, health service center, hospital | 2748 | 9.97 |
| Total | 27,552 | 100 |
| Facility | Expected Value | Observations | Nearest Neighbor Index | p-Value | Z-Value |
|---|---|---|---|---|---|
| Shopping/ catering | 116.081 | 21.940 | 0.189 | 0.000 | −198.286 |
| Transportation | 320.325 | 130.234 | 0.407 | 0.000 | −45.921 |
| Educational | 416.562 | 159.147 | 0.382 | 0.000 | −36.341 |
| Life service | 219.425 | 44.424 | 0.202 | 0.000 | −98.538 |
| Physical fitness | 401.530 | 156.750 | 0.390 | 0.000 | −44.577 |
| Cultural/leisure | 755.041 | 366.671 | 0.486 | 0.000 | −15.714 |
| Elderly care | 946.117 | 566.404 | 0.599 | 0.000 | −11.232 |
| Medical | 266.178 | 65.642 | 0.247 | 0.000 | −75.554 |
| Administrative Area | Shopping/Catering | Life Service | Elderly Care | Transportation | Physical Fitness | Medical | Educational | Cultural/ Leisure | Total Accessibility |
|---|---|---|---|---|---|---|---|---|---|
| Zhongshan | 1216 | 316 | 4 | 41 | 77 | 88 | 45 | 20 | 39 |
| Xigang | 1102 | 271 | 6 | 43 | 65 | 111 | 52 | 20 | 50 |
| Shahekou | 1475 | 373 | 8 | 72 | 107 | 163 | 89 | 29 | 73 |
| Ganjingzi | 115 | 66 | 3 | 29 | 26 | 46 | 13 | 5 | 37 |
| Variable | The Logarithmic of House Price 1 | The Logarithmic of House Price 2 | The Logarithmic of House Price 3 | The Logarithmic of House Price 4 | The Logarithmic of House Price 5 | The Logarithmic of House Price 6 | The Logarithmic of House Price 7 |
|---|---|---|---|---|---|---|---|
| The logarithm of shopping/ catering accessibility | 0.004 *** | ||||||
| The logarithm of traffic accessibility | 0.007 ** | ||||||
| The logarithm of educational accessibility | 0.007 *** | 0.004 ** | |||||
| The logarithm of sports accessibility | 0.011 *** | 0.006 *** | |||||
| The logarithm of Cultural/leisure accessibility | 0.006 *** | 0.004 *** | |||||
| The logarithm of overall accessibility | 0.009 * | ||||||
| The logarithm of households | −0.019 ** | −0.022 *** | −0.021 *** | −0.021 *** | −0.020 *** | −0.022 *** | −0. 020 *** |
| Greening rate | 1.268 *** | 1.256 *** | 0.302 *** | 1.286 *** | 1.298 *** | 0.265 *** | 1.338 *** |
| The logarithm of the distance between the community and large shopping center | −0.060 *** | −0.065 *** | −0.050 *** | −0.056 *** | −0.056 *** | −0.065 *** | −0. 042 *** |
| Constant term | 9.978 *** | 10.027 *** | 9.915 *** | 9.935 *** | 9.968 *** | 10.016 *** | 9.824 *** |
| Sample size N | 2422 | 2422 | 2422 | 2422 | 2422 | 2422 | 2422 |
| Judgment Coefficient | 0.510 | 0.515 | 0.513 | 0.480 | 0.505 | 0.479 | 0.486 |
| F statistic | 67.44 *** | 65.89 *** | 70.81 *** | 72.09 *** | 71.23 *** | 66.55 *** | 50.596 *** |
Publisher’s Note: MDPI stays neutral with regard to jurisdictional claims in published maps and institutional affiliations. |
© 2022 by the authors. Licensee MDPI, Basel, Switzerland. This article is an open access article distributed under the terms and conditions of the Creative Commons Attribution (CC BY) license (https://creativecommons.org/licenses/by/4.0/).
Share and Cite
Hao, J.; Ma, H. Spatial Heterogeneity of Public Service Facilities in the Living Circle and Its Influence on Housing Prices: A Case Study of Central Urban Dalian, China. Land 2022, 11, 1095. https://doi.org/10.3390/land11071095
Hao J, Ma H. Spatial Heterogeneity of Public Service Facilities in the Living Circle and Its Influence on Housing Prices: A Case Study of Central Urban Dalian, China. Land. 2022; 11(7):1095. https://doi.org/10.3390/land11071095
Chicago/Turabian StyleHao, Jinlian, and Haitao Ma. 2022. "Spatial Heterogeneity of Public Service Facilities in the Living Circle and Its Influence on Housing Prices: A Case Study of Central Urban Dalian, China" Land 11, no. 7: 1095. https://doi.org/10.3390/land11071095
APA StyleHao, J., & Ma, H. (2022). Spatial Heterogeneity of Public Service Facilities in the Living Circle and Its Influence on Housing Prices: A Case Study of Central Urban Dalian, China. Land, 11(7), 1095. https://doi.org/10.3390/land11071095