1. Introduction
In recent decades, land as an environmental resource has gained increasing importance in European policies. The goal of “no net land take” by 2050 defined in the 2011 Roadmap to a Resource Efficient Europe [
1] is part of the European Union’s 7th Environmental Action Program [
2] and is also part of the Soil Strategy of the European Union for 2030 [
3]. The strategy recommends that Member States set their own national, regional, and local targets by 2023 for net land take reduction by the year 2030 and report on their progress in order to make measurable contributions to the EU’s 2050 target. The strategy also proposes the application of “land take hierarchy” principles to increase land-use efficiency through more effective land reuse—promoting reductions in land take and soil sealing.
Land take is “the loss of undeveloped land to human-developed land” [
4] (p. 4). Land take can also be defined as the loss of natural and semi-natural land to urban and other artificial land developments. Accordingly, it is also known as land consumption or land artificialization [
5,
6]. It includes the development of areas that are sealed by construction and urban infrastructure, and non-sealed areas, such as urban green parks and some sports and leisure facilities [
7]. Land take leads to the loss of natural capital and landscape fragmentation [
7,
8]. Soil sealing is considered the most harmful expression of land take because it is a generally irreversible process that reduces habitat space and compromises the soil’s ability to provide important ecosystem services, such as biomass supply, water and nutrient cycling, and organic carbon storage [
9,
10]. The loss of soil’s ecological functions triggers heat island effects and flooding, and can even increase soil, water, and air pollution [
7,
11].
The main drivers of land take are population growth and economic development [
12,
13]. The former is mainly related to a need for more housing, public facilities, and transportation; the latter relates to new industrial and commercial sites, the competition between municipalities to attract more investment, and the prioritization of economic development over environmental sustainability, in a broad sense. Colsaet et al. [
12] carried out an extensive literature review on this topic, concluding that urban expansion “is not a mere result of market forces but is also shaped by institutions and public policies” (p. 346), including land use regulation, the legal and fiscal framework, the lack of both vertical (between administrative levels) and horizontal (between municipalities) coordination, and the strong dependence of local governments on tax revenues (such as property taxes).
The reverse process of land take (the conversion of artificial land into non-artificial land) is generally known as the re-naturalization or restoration of developed land. It is also less commonly referred to as the re-cultivation of developed land [
7]. An increase in vegetation cover provided by re-naturalization translates into an increase in soil carbon stocks [
14].
Net land take evaluates, for a given period, the difference between land take and re-naturalization of developed land. The “no net land take” target aims to protect soils and safeguard the services they provide through more sustainable land use, which involves reducing the consumption of undeveloped land [
15]. Meeting this target by the year 2050 calls for new construction to take place on abandoned or underutilized urban land and for the non-artificial land consumed by urbanization be offset by re-naturalizing an equivalent amount of artificial land, which requires significant investment in developed land recycling [
7]. Recycling of developed land aims at increasing the density of buildings (densification or infilling), building on abandoned or underused land (gray recycling), or converting developed land into green urban areas (green recycling). Both densification and gray recycling allow nations to respond to the housing needs of a growing population and diversify economic activity in areas that are already part of the urban perimeter, maximizing the use of existing infrastructure. Green recycling allows for preserving some of the natural soil functions that are vital to urban sustainability. Proper planning of green urban areas can contribute to the development of green infrastructure [
7].
It should be noted that land designated herein as urban or developed refers to the Corine Land Cover (CLC) level 1 class known as artificial surfaces, and land designated as non-urban, undeveloped, or natural refers to the remaining CLC classes.
1.1. Framing the “No Net Land Take” Goal
Given the lack of a binding legal framework to achieve the goal of “no net land take” by 2050, the European Union has sought to raise awareness among Member States on the issues of land take and recycling of developed land by means of the dissemination of various studies [
7,
11,
16,
17], and more recently, through inclusion of said issues in the Soil Strategy of the European Union for 2030 [
3]. Over recent decades, most European countries have adopted strategic planning guidelines to promote the sustainable development of their territories [
5], following the principles of the European Spatial Development Perspective [
18], the Territorial Agendas of the European Union [
19,
20,
21], and the New Urban Agenda [
22].
At the global level, the 2030 Agenda for Sustainable Development established 17 Sustainable Development Goals and 169 targets, which should be achieved by the year 2030 by all countries [
23]. Targets 11 and 15 deal with land consumption and land degradation, respectively, which are both related to net land take. Target 11.3 aims, among other things, to improve inclusive and sustainable urbanization in all countries. The indicator chosen for monitoring this (11.3.1) is the “ratio of land consumption rate to population growth rate.” As land take reflects the consumption of non-artificial land for urban development, it constitutes part of land consumption. The other part comprises the consumption of artificial land, which in this study corresponds to developed land recycling and re-naturalization. Target 15.3 aims, among other things, to combat desertification and restore degraded land. The proposed indicator for the monitoring thereof (15.3.1) measures the proportion of land that is degraded, which is also related to net land take. Land degradation can be assessed by the loss of ecosystem services provided by soil, such as a decrease in soil carbon stocks [
24], and the re-cultivation of developed land usually increases these stocks [
14].
1.2. Types of Interventions to Avoid, Reduce, or Offset Land Take
Based on the analysis of over 200 case studies from different European territorial contexts, the ESPON SUPER project (Sustainable Urbanization and Land Use Practices in European Regions) has identified the following types of interventions that can contribute to avoiding, reducing, and/or compensating for land take: densification, regeneration, urban containment, and governance and sectoral policies [
25,
26].
Densification aims at increasing the density of people living in built-up areas, usually by defining zones and quantitative thresholds for the closure of gaps. This may involve an increase in building volume or the reorganization of the existing urban structure [
26].
Regeneration aims at reusing and improving abandoned and problematic sites, such as brownfields. Brownfields are urban areas that have been abandoned or are underused, such as former industrial sites, which may have contamination problems.
Containment initiatives aim to limit land development beyond a certain area, to reduce urban sprawl and promote more rational land use (e.g., green belts and urban growth boundaries). Normally, these interventions foster the redevelopment and densification of urban neighborhoods and improve the green spaces in the rural-urban interface.
Governance approaches to reduce land take can encompass policy goal setting, spatial planning at different levels or sectors of action, financial incentives, and environmental assessments of plans and projects aimed at urban development [
27]. According to the SUPER conclusions [
26], interventions that address various sectoral policies (e.g., transportation, environment, and agriculture) and their potential impacts on land use tend to promote more sustainable development.
The types of interventions mentioned can make use of more than one instrument, such as legislation (binding laws and regulations), zonal land-use regulations establishing binding principles, incentive and economic programs (policy packages aimed at a particular objective), and projects (e.g., those implemented under the URBACT III program) [
25].
Given that strategies or visions are non-binding instruments, their success often depends on the existence of financial or binding instruments that make it possible to achieve targets. Accordingly, the adoption of strategies does not in itself guarantee successful interventions.
1.3. Data Sources Used at the European Level to Estimate Land Take, Re-Naturalization, and Recycling of Developed Land
Assessment of land cover/land use changes associated with the land take, re-naturalization, and recycling of developed land, can be achieved through a wide variety of data sources. The net land take indicators produced by the European Environment Agency (EEA) [
7,
11] for Europe are based on CLC maps, which are inadequate for monitoring these processes at the level of countries and their regions, as they do not make it possible to identify change areas of less than 5 ha [
28]. The indicators for developed land recycling produced by the EEA are based on the Urban Atlas [
29], which has a higher spatial resolution than CLC but only covers medium to large cities and their functional areas, preventing the monitoring of the phenomenon in other areas of interest. Another data source available at the European level is the Land Use/Cover Area frame Survey, known as LUCAS [
30]. As the estimates for land take provided by LUCAS are based on sampling locations, they are less accurate than those resulting from full coverage datasets. The high-resolution imperviousness layers produced by Copernicus [
31] capture “the spatial distribution of artificially sealed areas, including the level of sealing of the soil per area unit.” Accordingly, they only make it possible to monitor the sealed land, i.e., permanent land take, but integration with other land cover or land use datasets may make it possible to estimate non-permanent land take. Given the limitations of European data sources, the evaluation in each member state of the above processes is often based on national data sources, generally more detailed than those available at the European level. The definitions of the processes and their assessment methodologies also vary substantially among countries and regions.
1.4. How Are Some Countries and Regions in Europe Approaching the “No Net Land Take” Goal?
The definition of quantitative targets aimed at achieving national objectives, such as a reduction in net land take, and the monitoring of such targets, are the responsibility of central governments. However, as land-use planning decisions are mainly taken at the regional or municipal levels, to meet a national target, translation into regional or local targets is necessary [
5].
Some European countries have already set national quantitative targets for reducing land take or increasing the recycling of developed land. Among these, one should highlight Luxembourg, which limited land take to 1 ha per day by the year 2020 in its National Sustainable Development Plan, designed in 2007 [
5]. As a result, the land take dropped to 0.46 ha/day between 2007 and 2018 [
32]. The Luxembourg Spatial Planning Program is currently under review, and it is expected that it will reduce the land take target to 0.25 ha/day by 2035 [
32]. Assessment of the land take in Luxembourg is based on orthophotos [
33].
In Austria, land take is estimated based on cadastral data. In 2002, the Austrian government set a threshold of 1 ha/day by 2010 for soil sealing [
16]. The report on Land Take Reduction in Austria, presented on 8 October 2019, revealed a downward trend in land take since 2010 [
34]. However, the land take was still 11.5 ha/day between 2018 and 2020, and soil sealing was also above the limit set for 2010 (>4.0 ha/day) [
35]. Given this situation, the Austrian government’s program for 2020–2024 has set a land take target of 2.5 ha/day by the year 2030.
In Flanders (a region of Belgium), two data sources are used to monitor land take: the official federal cadastral statistics on built-up areas, available with annual updates since 1985, and the Flanders land use database [
36], which is updated every 3 years but was only made available in 2013. In 2016, land take in Flanders amounted to 6 ha/day [
37]. In order to reach the “no net land take” target by 2050, the Flemish Spatial Policy Plan aims to curb settlement growth so that it is zero by 2040. To meet this objective, the Flemish government intends to densify settlements, promote the multifunctional use of space, encourage management of contaminated sites, redevelop brownfield sites, and further dynamic landfill management [
38].
In Wallonia (another region of Belgium), land take is also quantified on the basis of cadastral data. The target of “no net land take” by 2050 is addressed by the 2018 Walloon Spatial Development Perspective (Schéma de Développement du Territoire), which limits land take to 1.6 ha/day by 2030 in order to meet the 2050 target. In 2020, the land taken in Wallonia doubled the 2030 target. The aforementioned document also states that by 2030, 50% of new housing and 30% of economic areas should be developed in brownfields [
39].
In Germany, land take was quantified based on two datasets: the “Authoritative Real Estate Cadastre Information System” and the “Digital Basic Landscape Model of the Authoritative Topographic and Cartographic Information System” [
40]. In Germany, the land take evaluates the conversion of non-artificial areas into settlements and transportation networks (excluding, for example, the creation of mining sites from non-artificial areas). The first national target for curbing land take was set in 2002, to reduce it to 30 ha/day by 2020. In order to achieve this goal, the German government promoted the reuse of brownfields and the development of under-utilized urban areas [
41]. In 2013, a legally binding priority for inner urban development come into force, requiring settlements to consider inner urban potential before expanding into surrounding areas. In 2016, the German Sustainable Development Strategy was relaunched, and the land take target was reset to less than 30 ha/day by 2030. The monitoring of land consumption in Germany relies on combined quantification by three indicators: the surface area occupied by settlements and transportation networks, the density of settlements, and open urban space per capita. The goal is reducing land take at the expense of increasing settlement density without decreasing urban open space per capita [
42]. Meeting these targets is supported by two territorial planning instruments: the land consumption reduction action plan and the land certificate trading scheme [
26]. The land certificate trading scheme was implemented in a pilot project led by the German Environment Agency, involving 87 municipalities. Each municipality received a number of certificates representing the area available for new development based on its population. Surplus or insufficient areas were tradeable between municipalities through the sale or purchase of certificates. This project showed that the trading scheme effectively reduces land take [
43]. Despite the enormous importance given to land as an environmental resource by the instruments in place in Germany, undeveloped land consumed by built-up areas, open urban space, and transportation still amounted to 57.9 ha/day in 2020 [
44].
Although the “no net land take” target was only introduced into French legislation in 2018, as a response to measure 1.3 of the Biodiversity Plan, which aims to limit the consumption of natural, agricultural, and forest areas [
45], in 2010 the French Law on modernization of agriculture and fisheries had already set a target to halve the rate of agricultural land consumption by 2020 [
5]. The French Biodiversity Plan is, however, silent on the deadline for achieving the “no net land take” target. In 2019, the French land take observatory was set up. It reports that since 2016 there has been stagnation in the land take rate in France, and that the consumption of natural, agricultural, and forest areas amounted to 54.8 ha/day between 2019 and 2020 [
46]. By 2020, the French government started funding private and public brownfield redevelopment operations [
15]. The data sources used in France for assessing land take are the OCS GE reference database and the cadastral tax files (“fichiers fonciers”), which enable the detection of changes in land use, in particular, the conversion of natural, agricultural, or forest areas into built-up areas. By definition, cadastral files do not cover the land in the public domain, such as the road network.
Monitoring of land transformation in Italy is carried out under Law 132/2016. Net land take is assessed annually from maps produced by means of photo-interpretation and the semiautomatic classification of remote sensing images (Sentinel-1 and Sentinel-2). In said assessment, land take covers changes from non-artificial to artificial areas (excluding the creation of green urban areas from agricultural areas) and the conversion of green urban areas into sealed areas. A clear distinction is made between permanent land take (land sealing) and reversible land take [
47]. In Italy, the net land take was 14.2 ha/day between 2019 and 2020. In the same period, land re-naturalization amounted to 1.4 ha/day. The main difficulties experienced in controlling land take in Italy are the lack of a uniform policy framework at the national level and the absence of effective regulatory measures in most of the country [
47,
48].
Although the UK’s National Planning Policy Framework makes no reference to the goal of “no net land take” [
15], the re-use of previously developed land for housing has been an objective of English spatial policy since the late 1990s, intending to reduce urban sprawl and greenfield development and to densify urban areas [
49]. The national target set in 1998 of having at least 60% of new housing built on brownfield land by 2008 was achieved and surpassed before 2008.
It should be noted that the above summary has sought to depict how the objective of reducing land take is being addressed in some countries and regions in Europe without looking at the effectiveness of the measures adopted, as this would require an analysis of the political and social contexts, and how the initiatives described are implemented by the legal instruments in place.
1.5. Study Aims
The main objective of this study was to quantify and characterize the non-artificial land transformed by urban development, and the artificial land that has been re-naturalized or recycled, between 2007 and 2018, in mainland Portugal. This assessment aims to contribute to:
Deepening the knowledge on the land take, re-naturalization, and recycling of developed land, and on drivers thereof;
Assessing the situation in mainland Portugal regarding the “no net land take” target;
Supporting the setting of national and regional targets which, thus far, do not exist;
Raising awareness among decision-makers and public authorities of the context of the issues addressed.
Although Portuguese legislation does not explicitly refer to the goal of “no net land take,” the European guidelines on spatial planning were reflected in the Law on Public Policy on Soil Land-use Planning and Urban Planning (2014), in the National Strategy for Sustainable Urban Development 2014–2020 (2015), and finally, in the strategy and territorial model of the National Program for Spatial Planning Policy (2019). In 2015, the legal framework for spatial planning instruments and the land-use regime for municipal master plans were revised. These revisions included, among other things, the suppression of the urban expansion area category and the strengthening of the exceptional nature of the reclassification of rural land to urban land (to avoid the expansion of urban perimeters). Since then, this reclassification has required proof of economic and financial sustainability, and justification of the need for it, in the form of demographic indicators and levels of supply and demand for urban land. Portuguese Law also provides for certain tools similar to Tradeable Development Rights, which have the potential to encourage the densification and redevelopment of urban centers. However, said instruments have found little use so far. It is also worth noting the existence of different types of funding for urban regeneration. Furthermore, since the 1970s and 1980s, Portugal has had several other spatial planning instruments to protect agricultural and natural land and promote biodiversity, namely, the National Agricultural Reserve, the National Ecological Reserve, and the National Network of Protected Areas.
The monitoring of Sustainable Development Goals 2030 in Portugal is only carried out at the national level, and there are no regionally differentiated targets and criteria defined by the central government. Concerning net land take and developed land recycling, since their extent was unknown until now, this study aims to contribute to their regular follow-up, and to inform decisions regarding the establishment of national or regional quantitative objectives to meet the European target.
2. Materials and Methods
This study is based on the Land and Ecosystem Accounting (LEAC) system developed by the EEA [
50,
51,
52]. This system describes land cover/land use changes through flows between land cover types, allowing us to understand how their stocks are transformed over time. Flows correspond to gains or losses due to transfers of land area between land cover/land use types [
50]. When applying this accounting system to the land cover class known as artificial surfaces, a gain (or formation) is any conversion of non-artificial land to artificial land, and a loss (or consumption) is any conversion of artificial land to non-artificial land. While land take evaluates gains, re-naturalization evaluates losses. Developed land recycling evaluates the transformations between different types of artificial land.
The LEAC system provides a framework for linking changes in land use and land cover to their causes (driving forces). The processes that cause area transfers between land cover/land use types were classified into Land Cover Flows (LCFs) by the EEA [
50,
51]. An LCF represents a set of land cover changes grouped by a common driving force. It is essential to have a good understanding of the processes that are driving land cover changes to design policy measures that help shape future trends [
50]. Analysis of LCFs by source and target land cover classes provides knowledge (quantitative and qualitative) of each land cover/land use change.
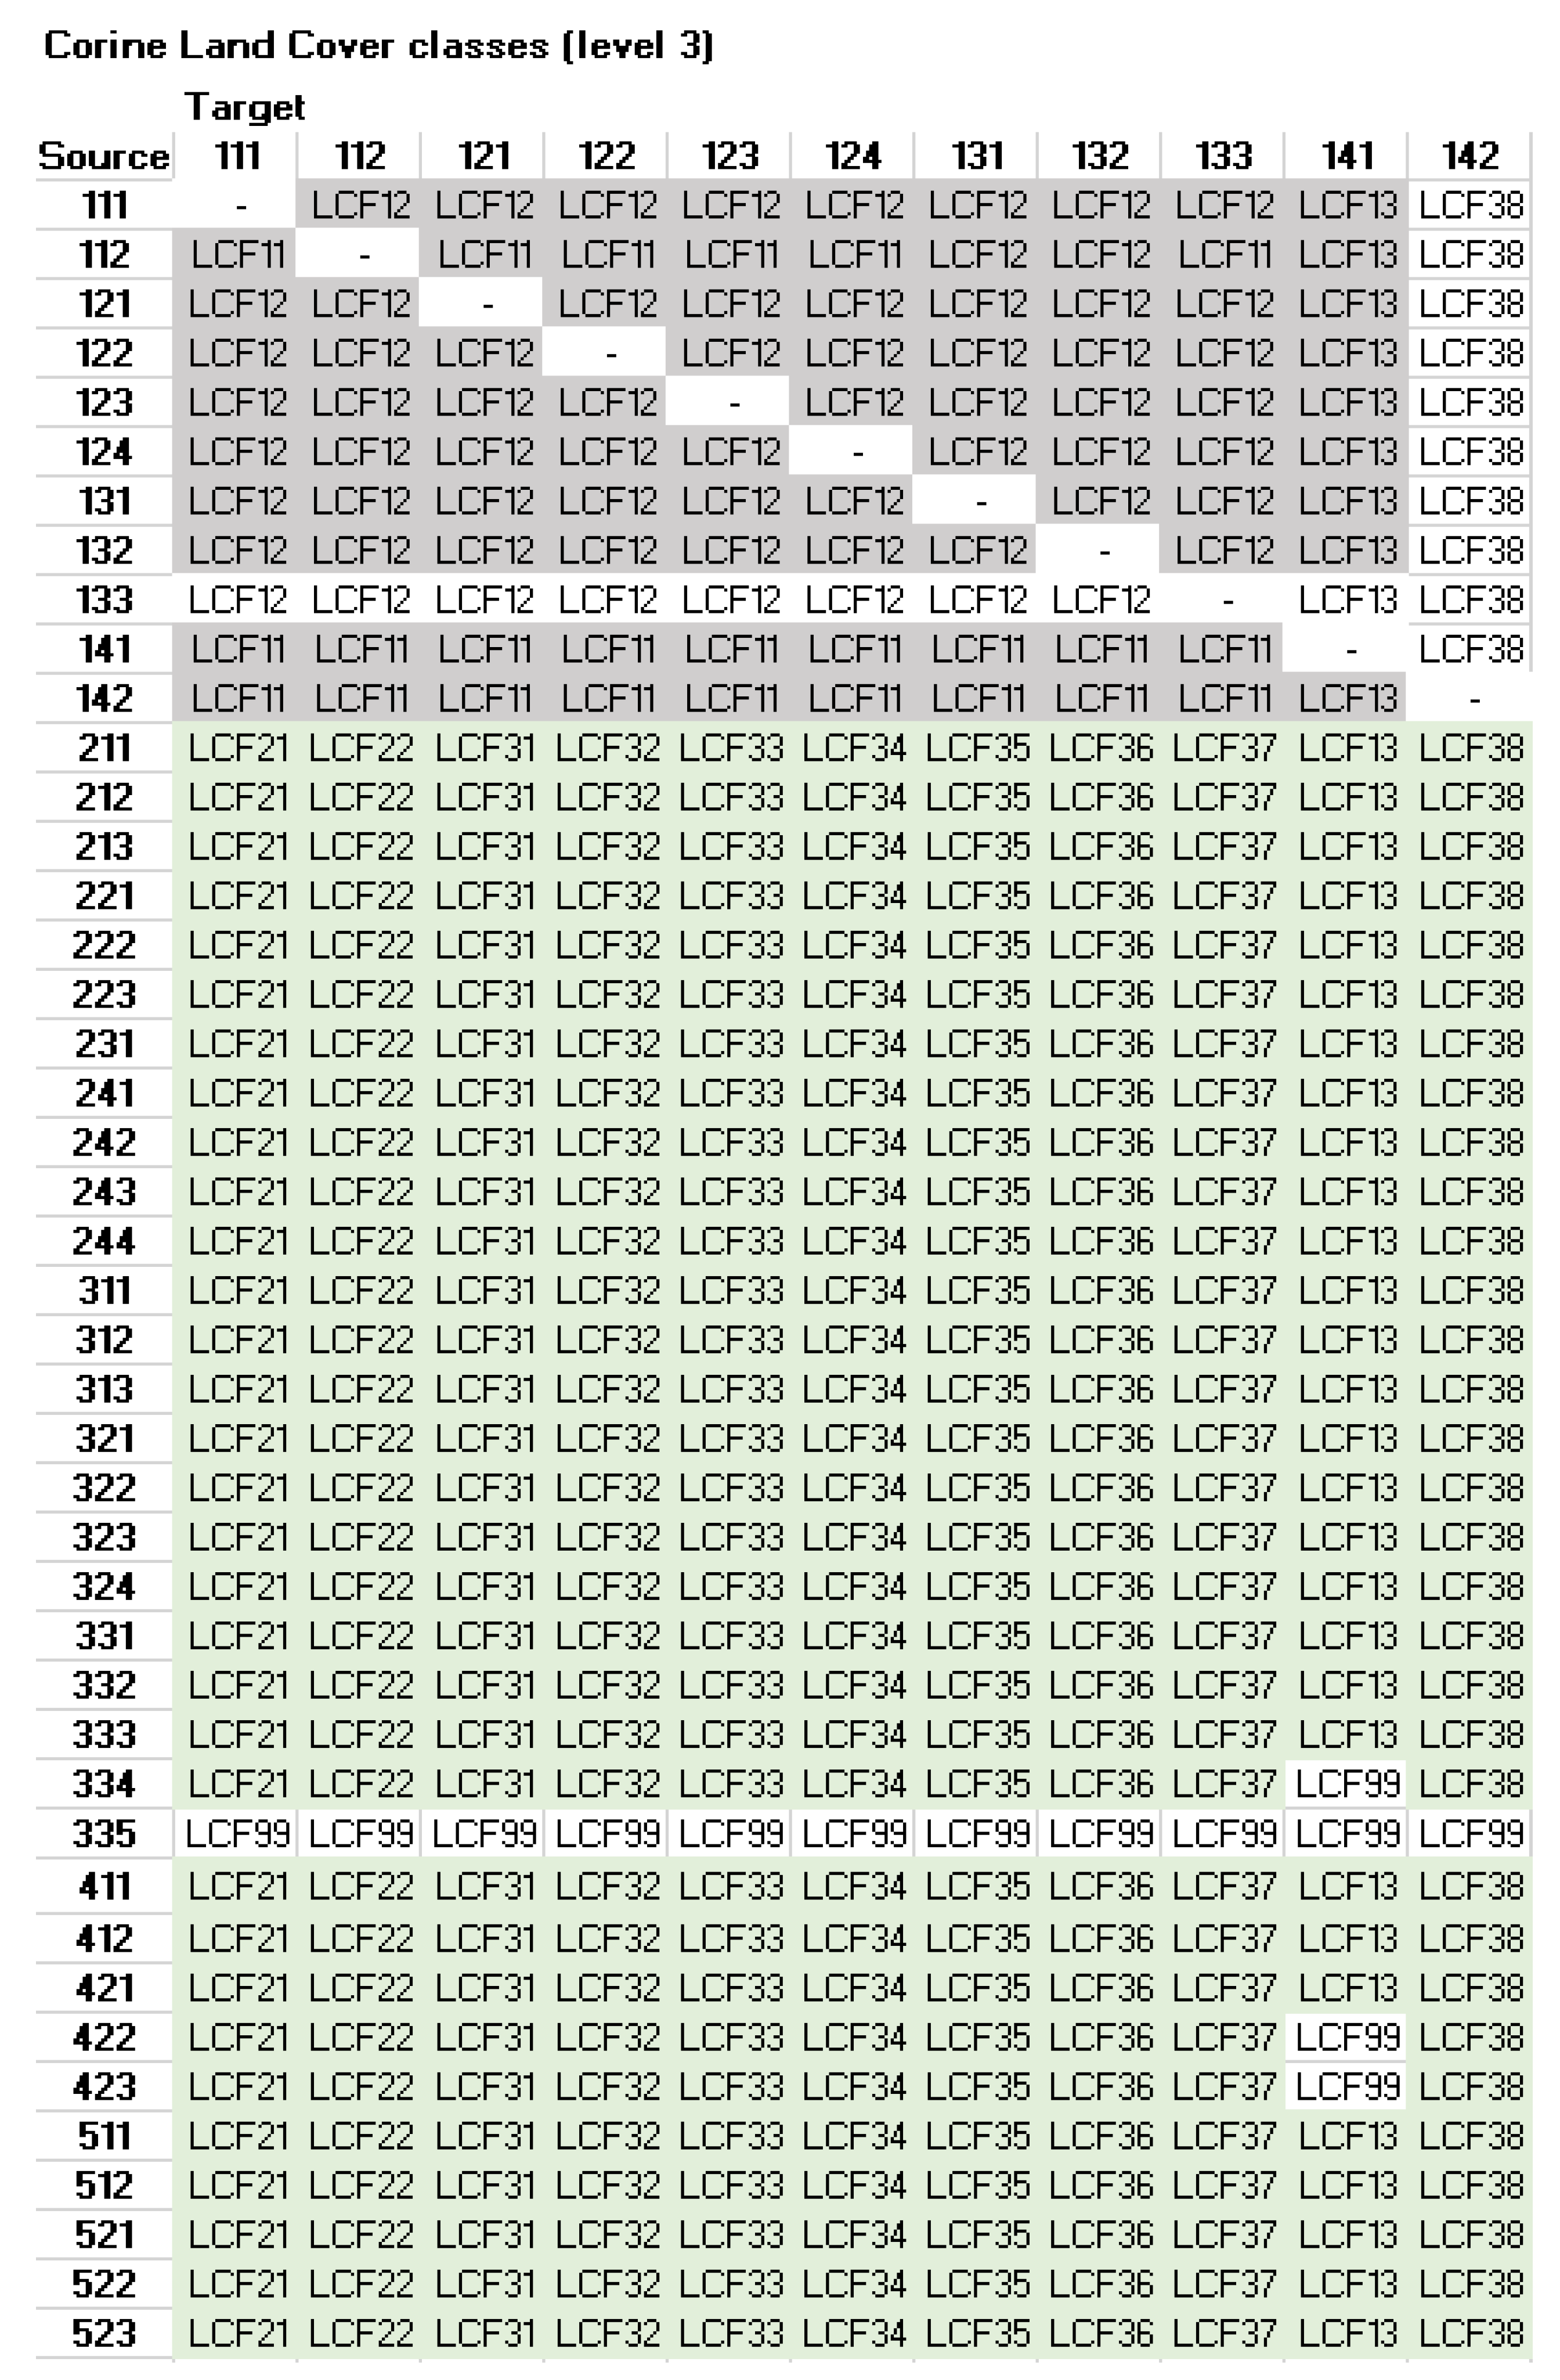
The Land Cover Flows identified by EEA [
50] resulted from the analysis of the change matrix obtained from the overlay of two CLC maps. Given that the third level of the CLC nomenclature contains 44 land cover classes, the change matrix includes over 1800 changes. These were grouped into processes (LCFs) in accordance with three hierarchical levels. The first level contains nine LCFs, which at the second level are broken down into 40 [
52].
Table 1 identifies the first-level LCFs causing land cover changes and the second-level processes underlying the land take, re-naturalization, and recycling of developed land. One should point out that in this table, and indeed the whole study, assumes that urban or developed land is representative of the CLC classes relating to artificial surfaces, and that non-urban or undeveloped land is representative of the remaining CLC classes.
To identify the source (origin) and target (destination) classes of land cover conversions to which the LCFs refer, we subsequently aggregated the 44 CLC classes used to identify LCFs into eight land cover types, which integrate the LEAC nomenclature (see
Table A1 in
Appendix A). This nomenclature groups CLC classes with similar land use or environmental characteristics and simplifies the interpretation of LCF processes.
The methodology adopted to assess land take is similar to that used by the EEA for calculating the CSI 014/LSI 001 indicator [
7], which assesses the amount of non-artificial surfaces (agricultural, forest, semi-natural and natural areas, wetlands, or water surfaces) converted to artificial surfaces. This methodology is explained in
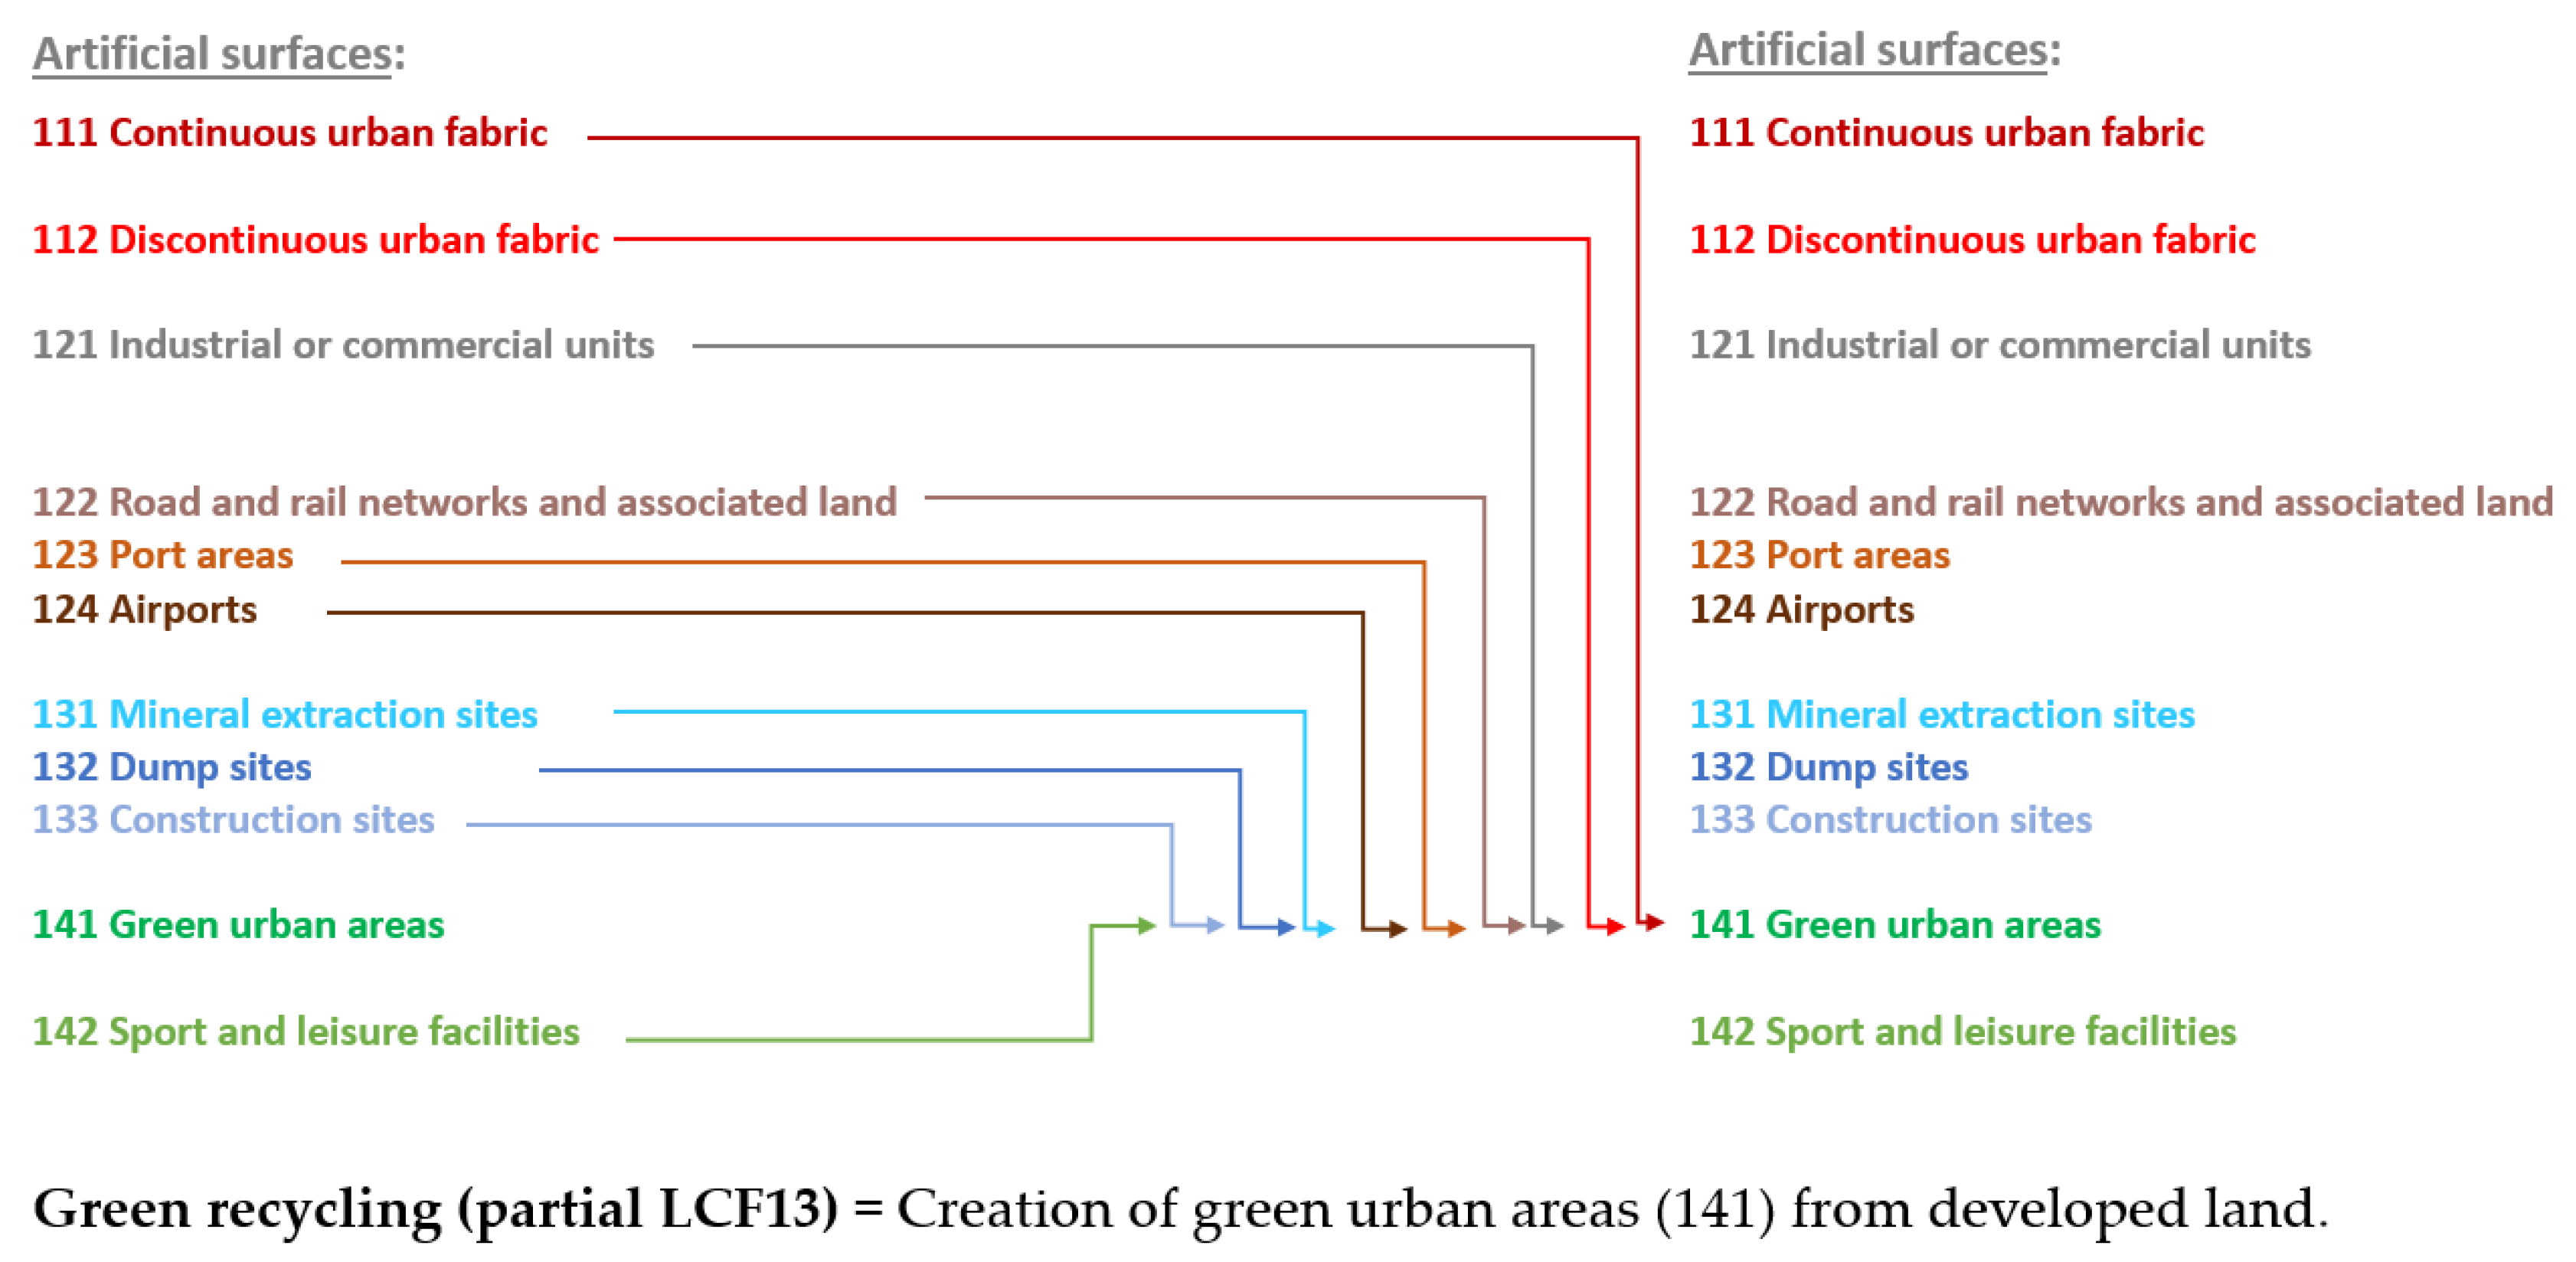
Figure 1 by level-2 Land Cover Flows (in green) and the changes between land cover classes (CLC-level 3), accounted for in the land take amount assessment. According to
Figure 1, the processes (level-2 LCFs) driving land take (in green) are LCF21, LCF22, LCF31, LCF32, LCF33, LCF34, LCF35, LCF36, LCF37, and those parts of LCF38 and LCF13 that relate to the conversion of non-artificial areas into sport and leisure facilities and green urban areas, respectively.
The formation or creation of artificial land assesses, for a given period, the sum of the surface areas gained by each of the classes that make up the artificial surfaces (CLC-level 3). This sum comprises internal conversions between these classes and their gains in terms of surface area due to land take. According to the LEAC quantification system, the formation of artificial land is explained by four types of processes (LCF-level 1): Urban land management (LCF1); urban residential expansion (LCF2); expansion of economic facilities and infrastructures (LCF3); and land cover changes due to multiple natural causes (LCF9). As land take excludes conversions between classes of artificial surfaces, only some of the conversions between land cover classes considered by these four processes are included in land take estimation. Accordingly, the land take estimate is usually lower than the creation of artificial land that occurred in the same period.
Land re-naturalization assesses, for a given period, the surface area of artificial land converted into non-artificial land (agricultural, forest, semi-natural and natural areas, wetlands, and water bodies). The transitions between land cover classes (CLC-level 3) accounted for in the land re-naturalization quantification are shown in
Table 2, which also shows the level-2 LCFs related to land re-naturalization—namely, the conversion of artificial areas to agricultural areas (LCF54), forests and woodlands (partial LCF63), dams and reservoirs (partial LCF81), semi-natural areas (partial LCF91), and intertidal flats, estuaries, or sea and ocean (partial LCF93).
The consumption or loss of artificial land assesses, for a given period, the total area lost by each of the classes (CLC-level 3) of the artificial surfaces. This sum includes internal conversions between these classes and the surface area loss due to land re-naturalization. In accordance with the LEAC quantification system, the consumption of artificial land can be explained by four types of processes (LCF-level 1): conversion from other land covers to agricultural land (LCF5), increase in forest land cover and other semi-natural areas (LCF6), waterbody and wetland creation and management (LCF8), and land cover changes due to multiple natural causes (LCF9). As land re-naturalization excludes internal conversions between classes of artificial surfaces, only some of the conversions between land cover classes considered by these four processes are included in the land re-naturalization estimate. Accordingly, the land re-naturalization estimate is usually lower than the consumption of artificial land that occurred in the same period.
As explained in the Introduction, net land take assesses the difference between land take and land re-naturalization, and the monitoring thereof allows one to evaluate how far we are from the European target [
1].
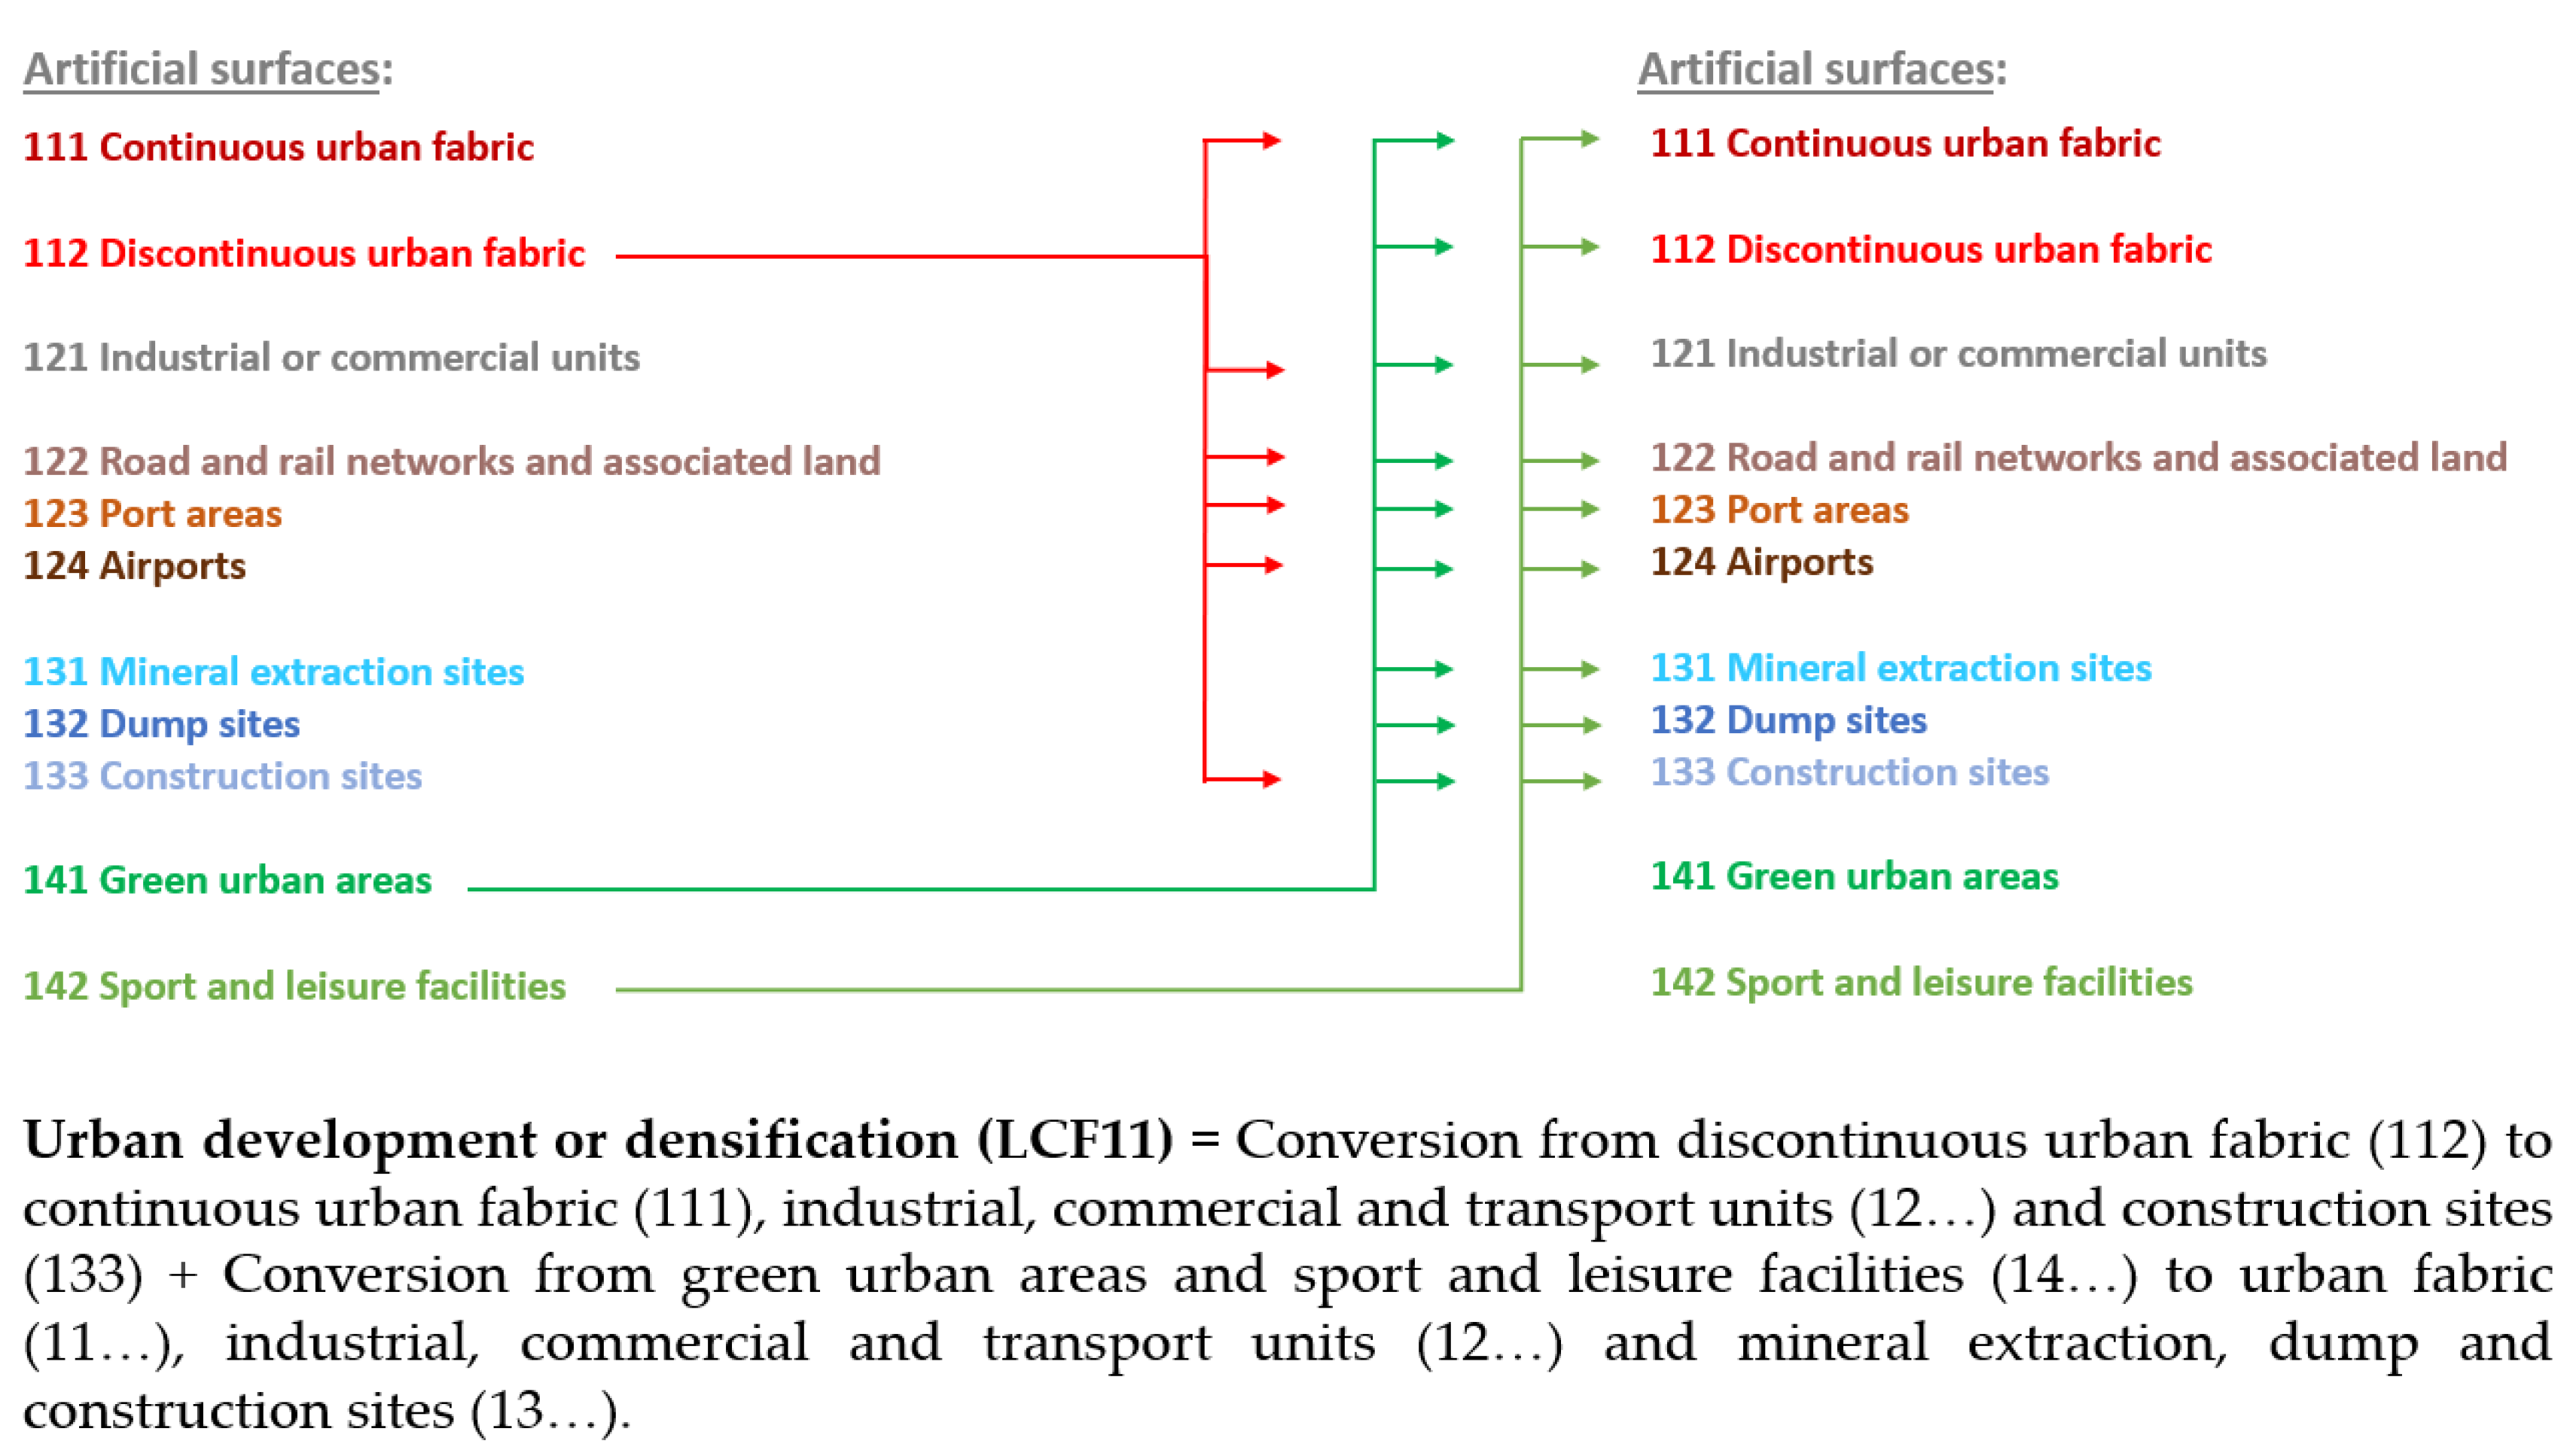
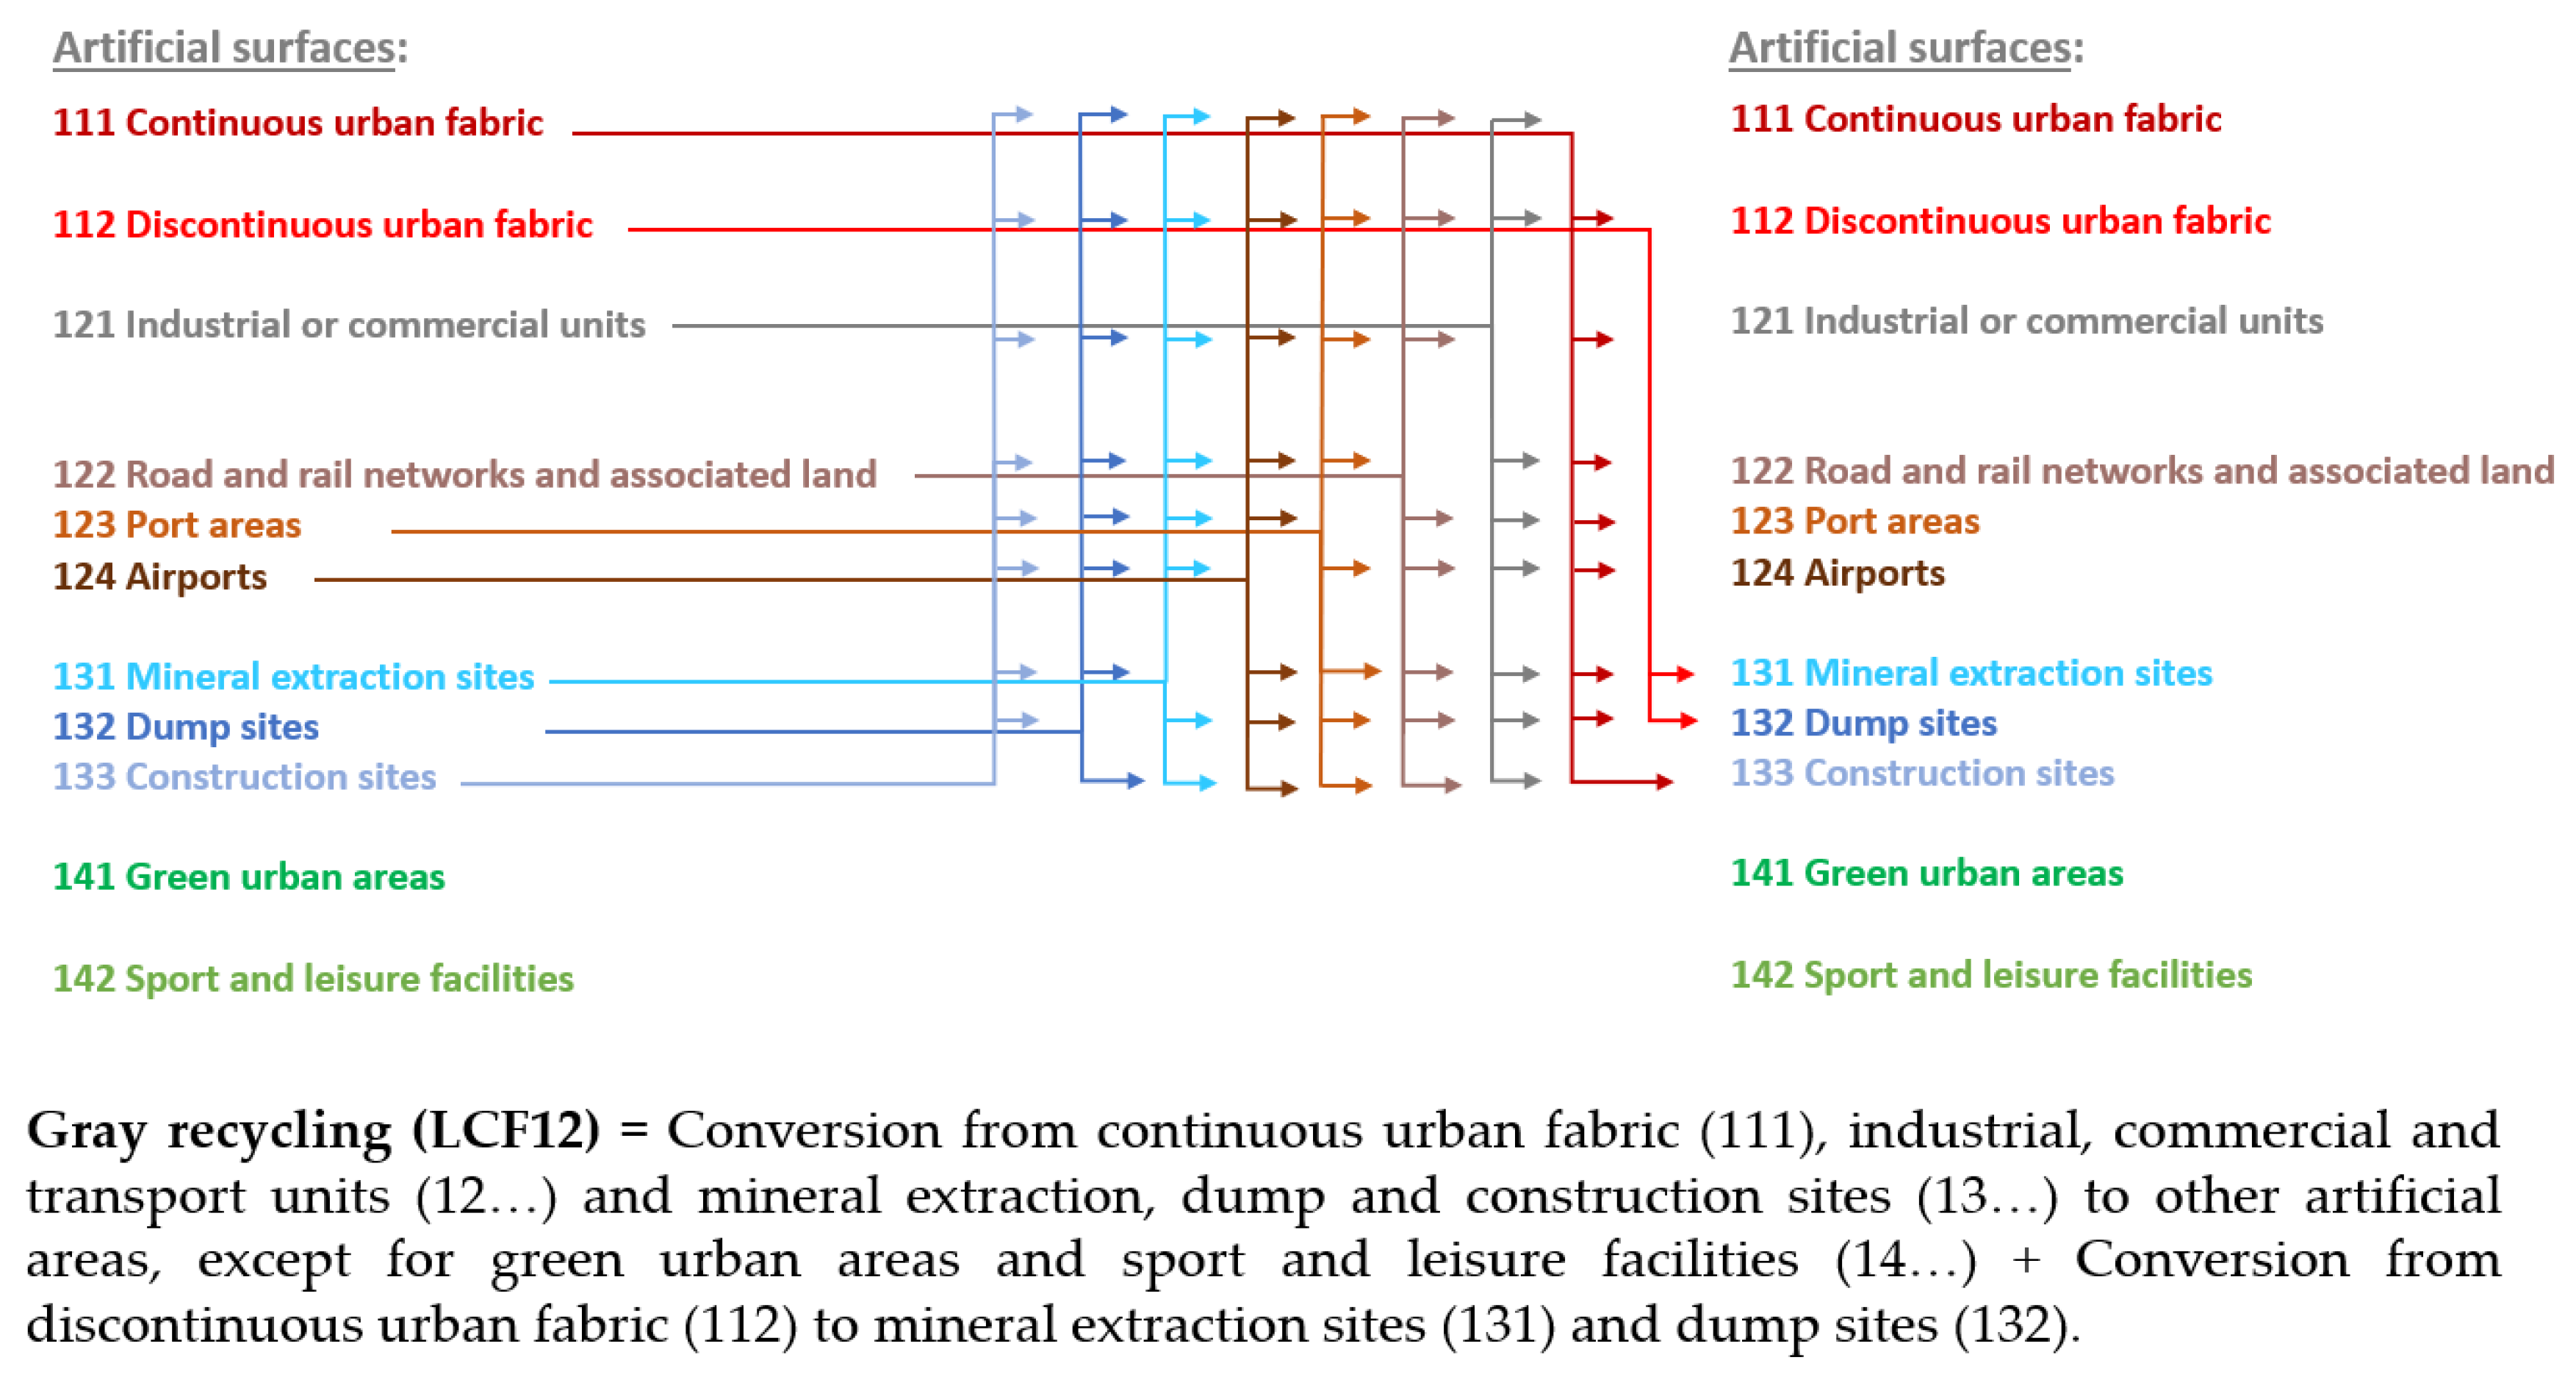
From the analysis of
Table 1 and
Figure 1, it follows that the changes between artificial surfaces related to LCF11 and LCF12 are due to urban development (densification or infilling) and gray recycling, respectively. The changes resulting from LCF11 and LCF12, and those resulting from LCF13 (conversion of artificial and non-artificial areas into green urban areas), are integral parts of a process called urban land management (LCF1).
Our assessment of developed land recycling (in the broadest sense) covers urban development or infilling (LCF11), gray recycling (LCF12), and green recycling; and excludes the conversion of non-artificial areas into urban green areas (partial LCF13) and the conversion of construction sites into any land cover class. The latter is based on the premise that such sites represent a transitional land cover class that will evolve in the short term into a definitive one [
17] (p. 42). Such sites usually include areas under construction, roads and infrastructures, and other areas under transformation, which, after completion of the construction work, may revert to land cover classes other than artificial.
Figure 1 also shows (in gray) the changes between land cover classes (CLC-level 3) accounted for in the assessment of the recycling of developed land and the processes (level 2 LCFs) linked to these changes.
Our approach to assessing the recycling of developed land (in the broadest sense) differs from that used by the EEA for calculating the LSI 008 indicator [
53] in that the latter takes into consideration a more comprehensive account of green recycling, which additionally includes the conversion of artificial areas into sports and leisure facilities (part of LCF38).
To assess the importance of each of the processes of developed land recycling (LCF11, LCF12, and part of LCF13), we determined their representativeness in urban land management (LCF1). Furthermore, we also evaluated the weight of developed land recycling in the creation (formation) of artificial areas, as this indicator is commonly used in international comparisons.
The processes addressed by this study are described in terms of areas per spatial unit for a given period. As spatial units have unequal sizes, we produced the following indicators to make it possible to compare a process between spatial units or to compare our results with those of analogous studies:
Indicator reported in km2/year—this indicator is an annual average (the area of interest, in km2, was divided by the number of years composing the period);
Indicator reported in m2/year.km2—this indicator is an annual rate (the area of interest, in m2, was divided by the number of years in the respective period and multiplied by the spatial unit surface, in km2).
Study Area
Portugal is a southern European state composed of three NUTS (level I) regions: mainland Portugal and the autonomous regions of Madeira and Azores. Mainland Portugal is located in the extreme southwest of the Iberian Peninsula, bordered to the north and east by Spain and to the west and south by the Atlantic Ocean.
This study assesses the land take, re-naturalization, and recycling of developed land in mainland Portugal, broken down by NUTS III, between 2007 and 2018.
This assessment was based on the 2007 and 2018 national land cover/land use maps (known as COS and hereafter referred to as COS2007 and COS 2018), which are vector maps produced by the Directorate-General for Territory. The current COS nomenclature features 83 classes organized in a four-tier hierarchical structure. Although the COS maps do not cover all the classes that make up the third level of the CLC map, it is possible to establish equivalences with CLC nomenclature. Despite the thematic similarities between COS and CLC, COS maps are based on different technical features, namely, the Minimum Mapping Unit (MMU) and the Minimum Distance Between Lines (MDBL). Both are smaller for COS than for CLC (the MMU of COS is 1 ha, whereas that of CLC is 25 ha, and the MDBL of COS is 20 m, whereas that of CLC is 100 m). These differences cause the surface area of the same land cover class (e.g., artificial surfaces) to be larger when calculated using COS than when calculated using CLC.
Since the Land Cover Flows of interest for our assessment were defined based on the third level of the CLC nomenclature, the two national maps (COS2007 and COS2018) were initially reclassified at the third level of the CLC nomenclature. A change matrix was then created for the period 2007–2018 by overlaying the two reclassified maps with the NUTS III boundaries of 2018. Each change between CLC classes (level 3) provided by this matrix was then associated with a Land Cover Flow (LCF level 2) and classified as to its contribution to the phenomena of interest (land take, re-naturalization, or recycling of developed land). Thus, each phenomenon totals the area of a set of changes between land cover/land use types (CLC classes), which were driven by one or several processes (LCFs).
Although the above tasks were carried out based on CLC-level 3 classes, to simplify the description of the source and destination classes to which each flow refers, we adopted the eight land cover types of the LEAC nomenclature (
Table A1 in
Appendix A).
3. Results
The results presented below begin by quantifying the land take, re-naturalization, and net land take in mainland Portugal and its NUTS III regions, during the period 2007–2018. Then, we describe the drivers of land take and re-naturalization and the land cover types they have transformed. Subsequently, developed land recycling and the weights of its components (densification, grey recycling, and green recycling) are estimated. Finally, urban land use efficiency is assessed by comparing the expansion of artificial areas and non-artificial land transformed by new development (i.e., land take) with population growth.
In the period under review, several spatial planning instruments were already in force in mainland Portugal to regulate changes in land use. However, it was only in 2014 that the Law for Public Policy on Soil, Land-use Planning, and Urban Planning reinforced the stance, already expressed in the previous Law of 1999, of considering land (i.e., the soil) as a scarce resource.
Although the national objectives for spatial planning in 2007 already made allowances for the profitability of existing infrastructures, to avoid unnecessary expansion of infrastructure networks and urban perimeters, the use of empty urban spaces, and the rehabilitation of historical centers, among other things, these objectives were reiterated in 2014, thereby reinforcing the need to contain urban sprawl and dispersed building, and the need to favor urban redevelopment and regeneration over new construction.
3.1. Land Take, Re-Naturalization, and Net Land Take
Land take in mainland Portugal amounted to 26.4 km
2/year between 2007 and 2018, representing a change from non-artificial to artificial areas of 7.2 ha/day.
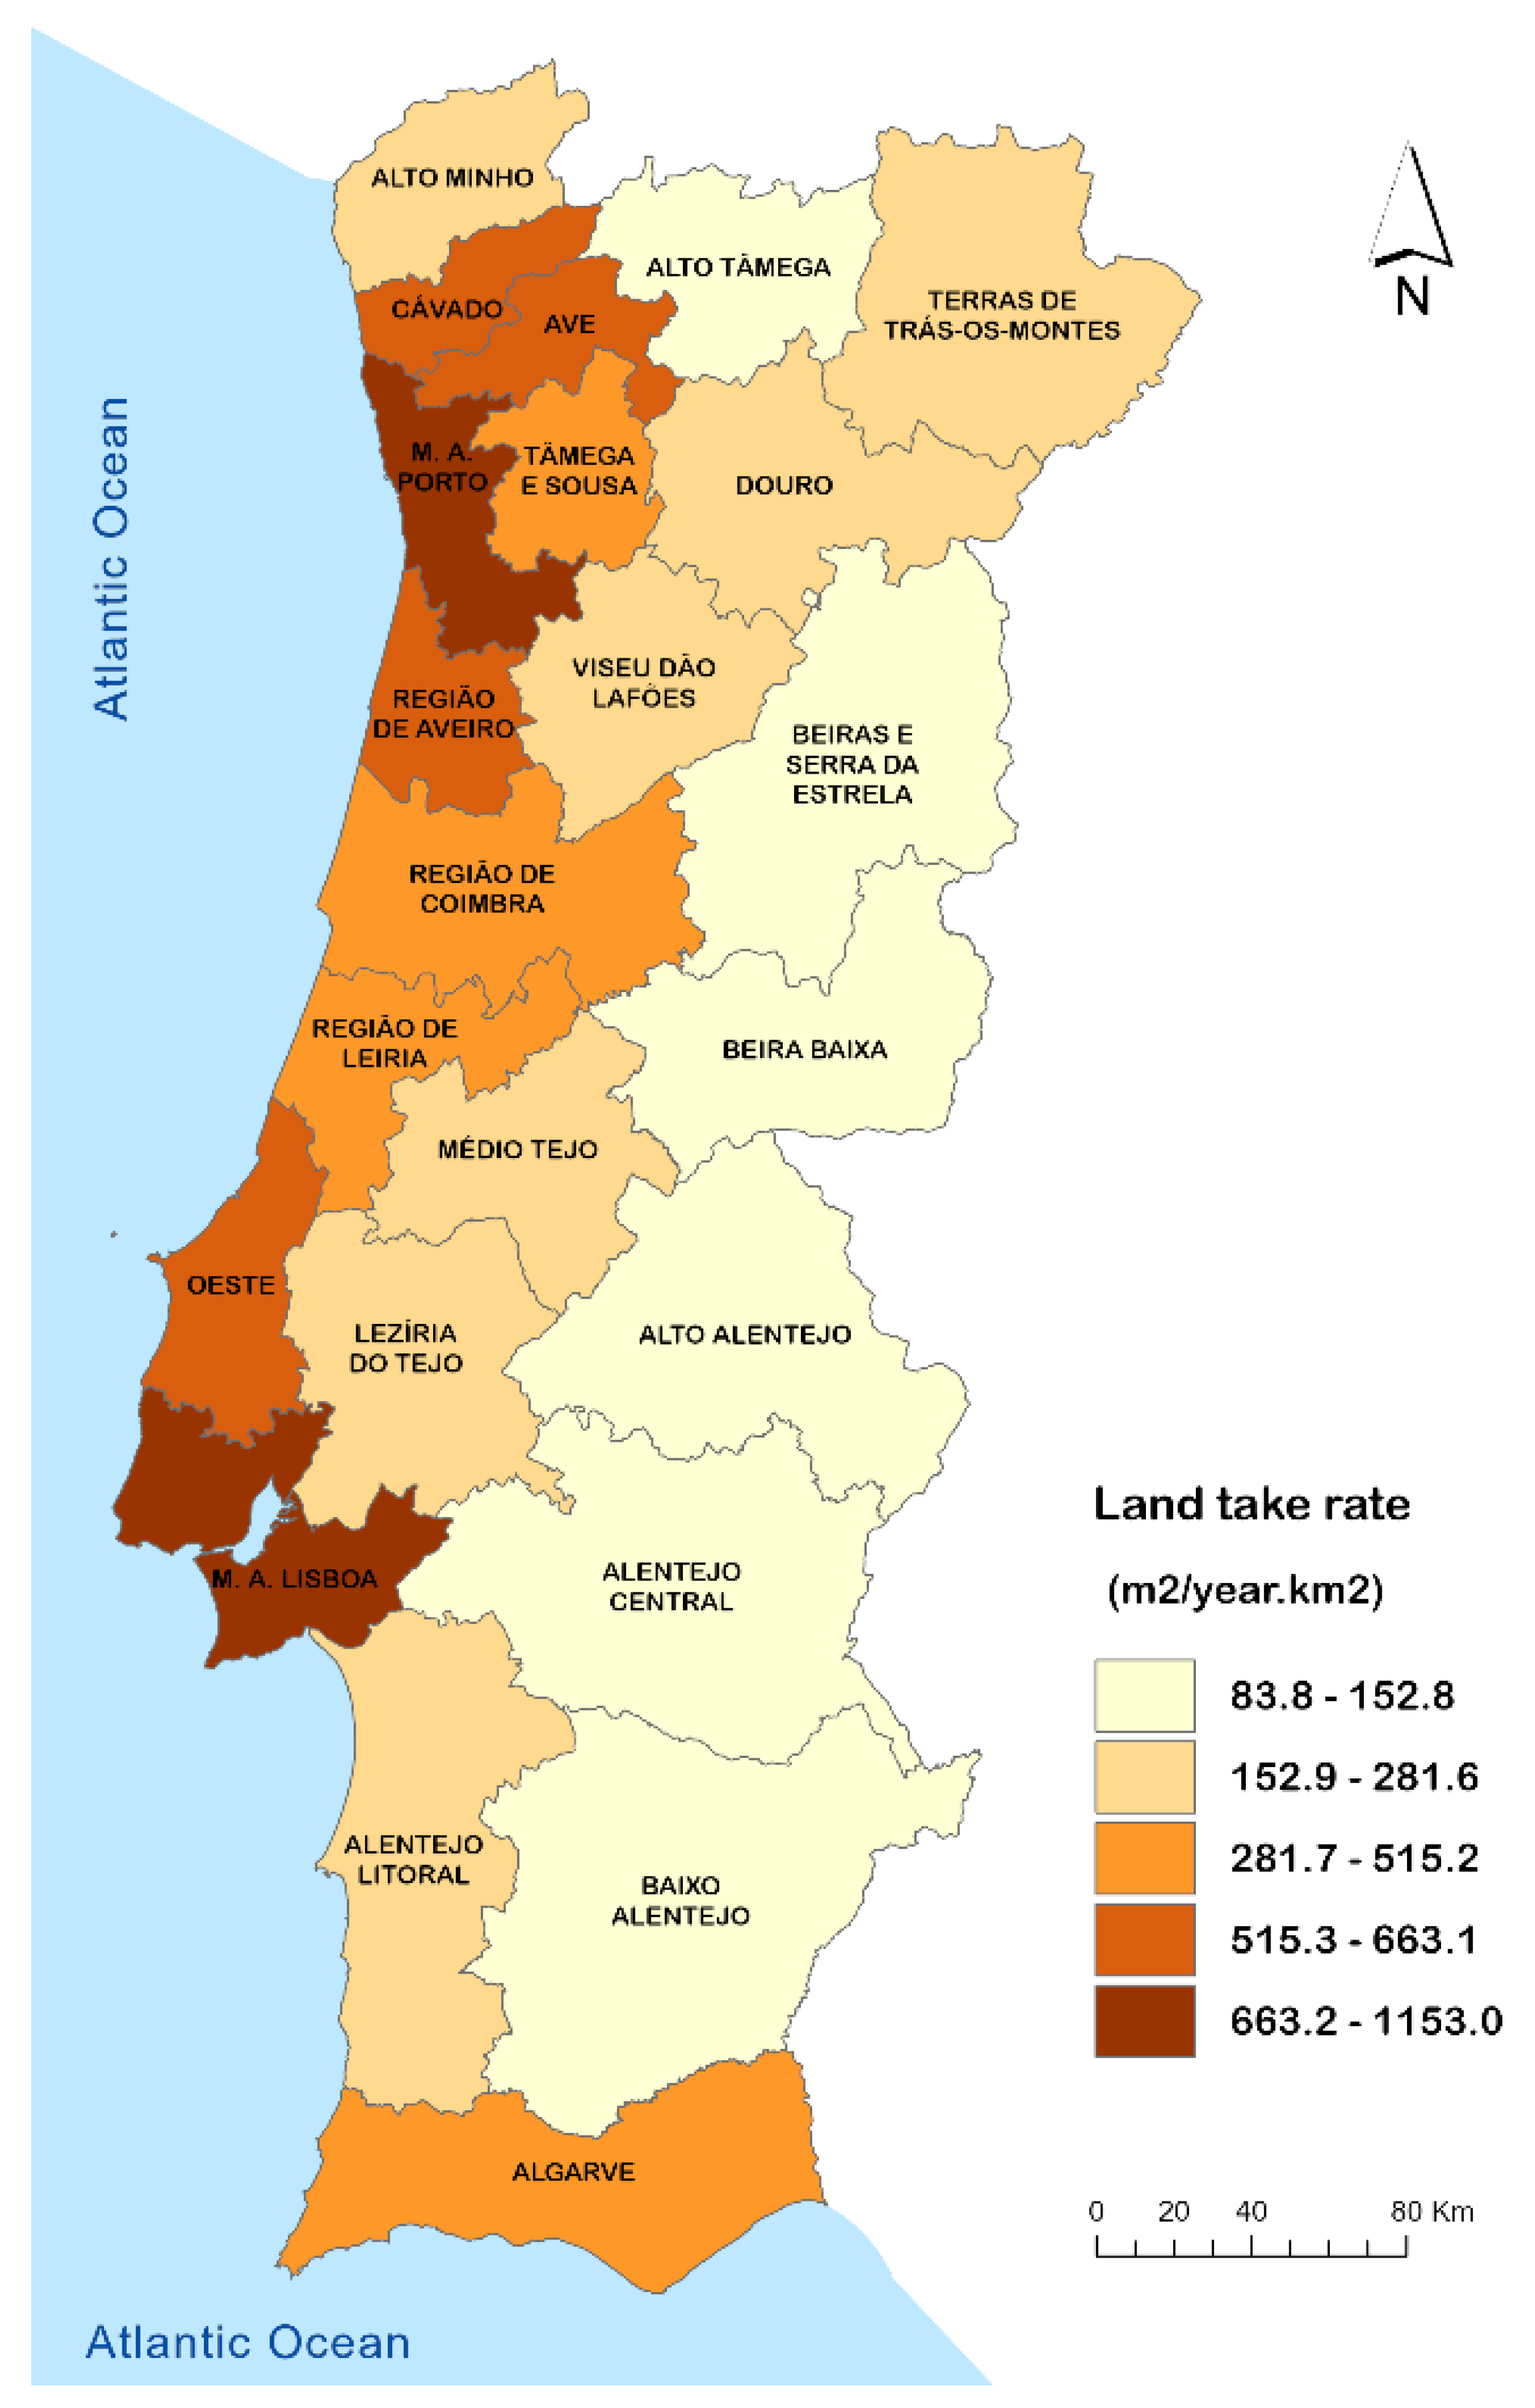
Figure 2 maps the annual land take rate by NUTS III in this period. In addition to this rate,
Table 3 presents (in the second column) the annual average of these land transformations on the mainland, by NUTS III, in the same period. The following facts stand out after analysis of both:
The land take rate shows a similar spatial distribution to that of the resident population, decreasing from the coastal regions towards the interior of the mainland. The highest rates occurred in the two metropolitan areas (M.A. LISBOA and M.A. PORTO) and their neighboring regions.
The land take rate was highest in the Porto metropolitan area (1153 m2/year.km2), slightly lower in the Lisbon metropolitan area (1021 m2/year.km2), and reached figures of 600 m2/year.km2 in the Aveiro, Oeste, and Ave regions.
The lowest land take rates refer to the interior regions of Alto Alentejo and Beira Baixa (83.8 and 107.8 m2/year.km2, respectively).
Land re-naturalization is, in comparison to the reverse phenomenon (land take), a rare process that covers small surface areas on the mainland. The land re-naturalized between 2007 and 2018 (40.8 km
2) represents only 0.05% of mainland Portugal and corresponds to an annual average re-naturalization of 3.7 km
2/year.
Table 3 presents land re-naturalization indicators (in the fourth and fifth columns) for mainland Portugal, by NUTS III, in the above period.
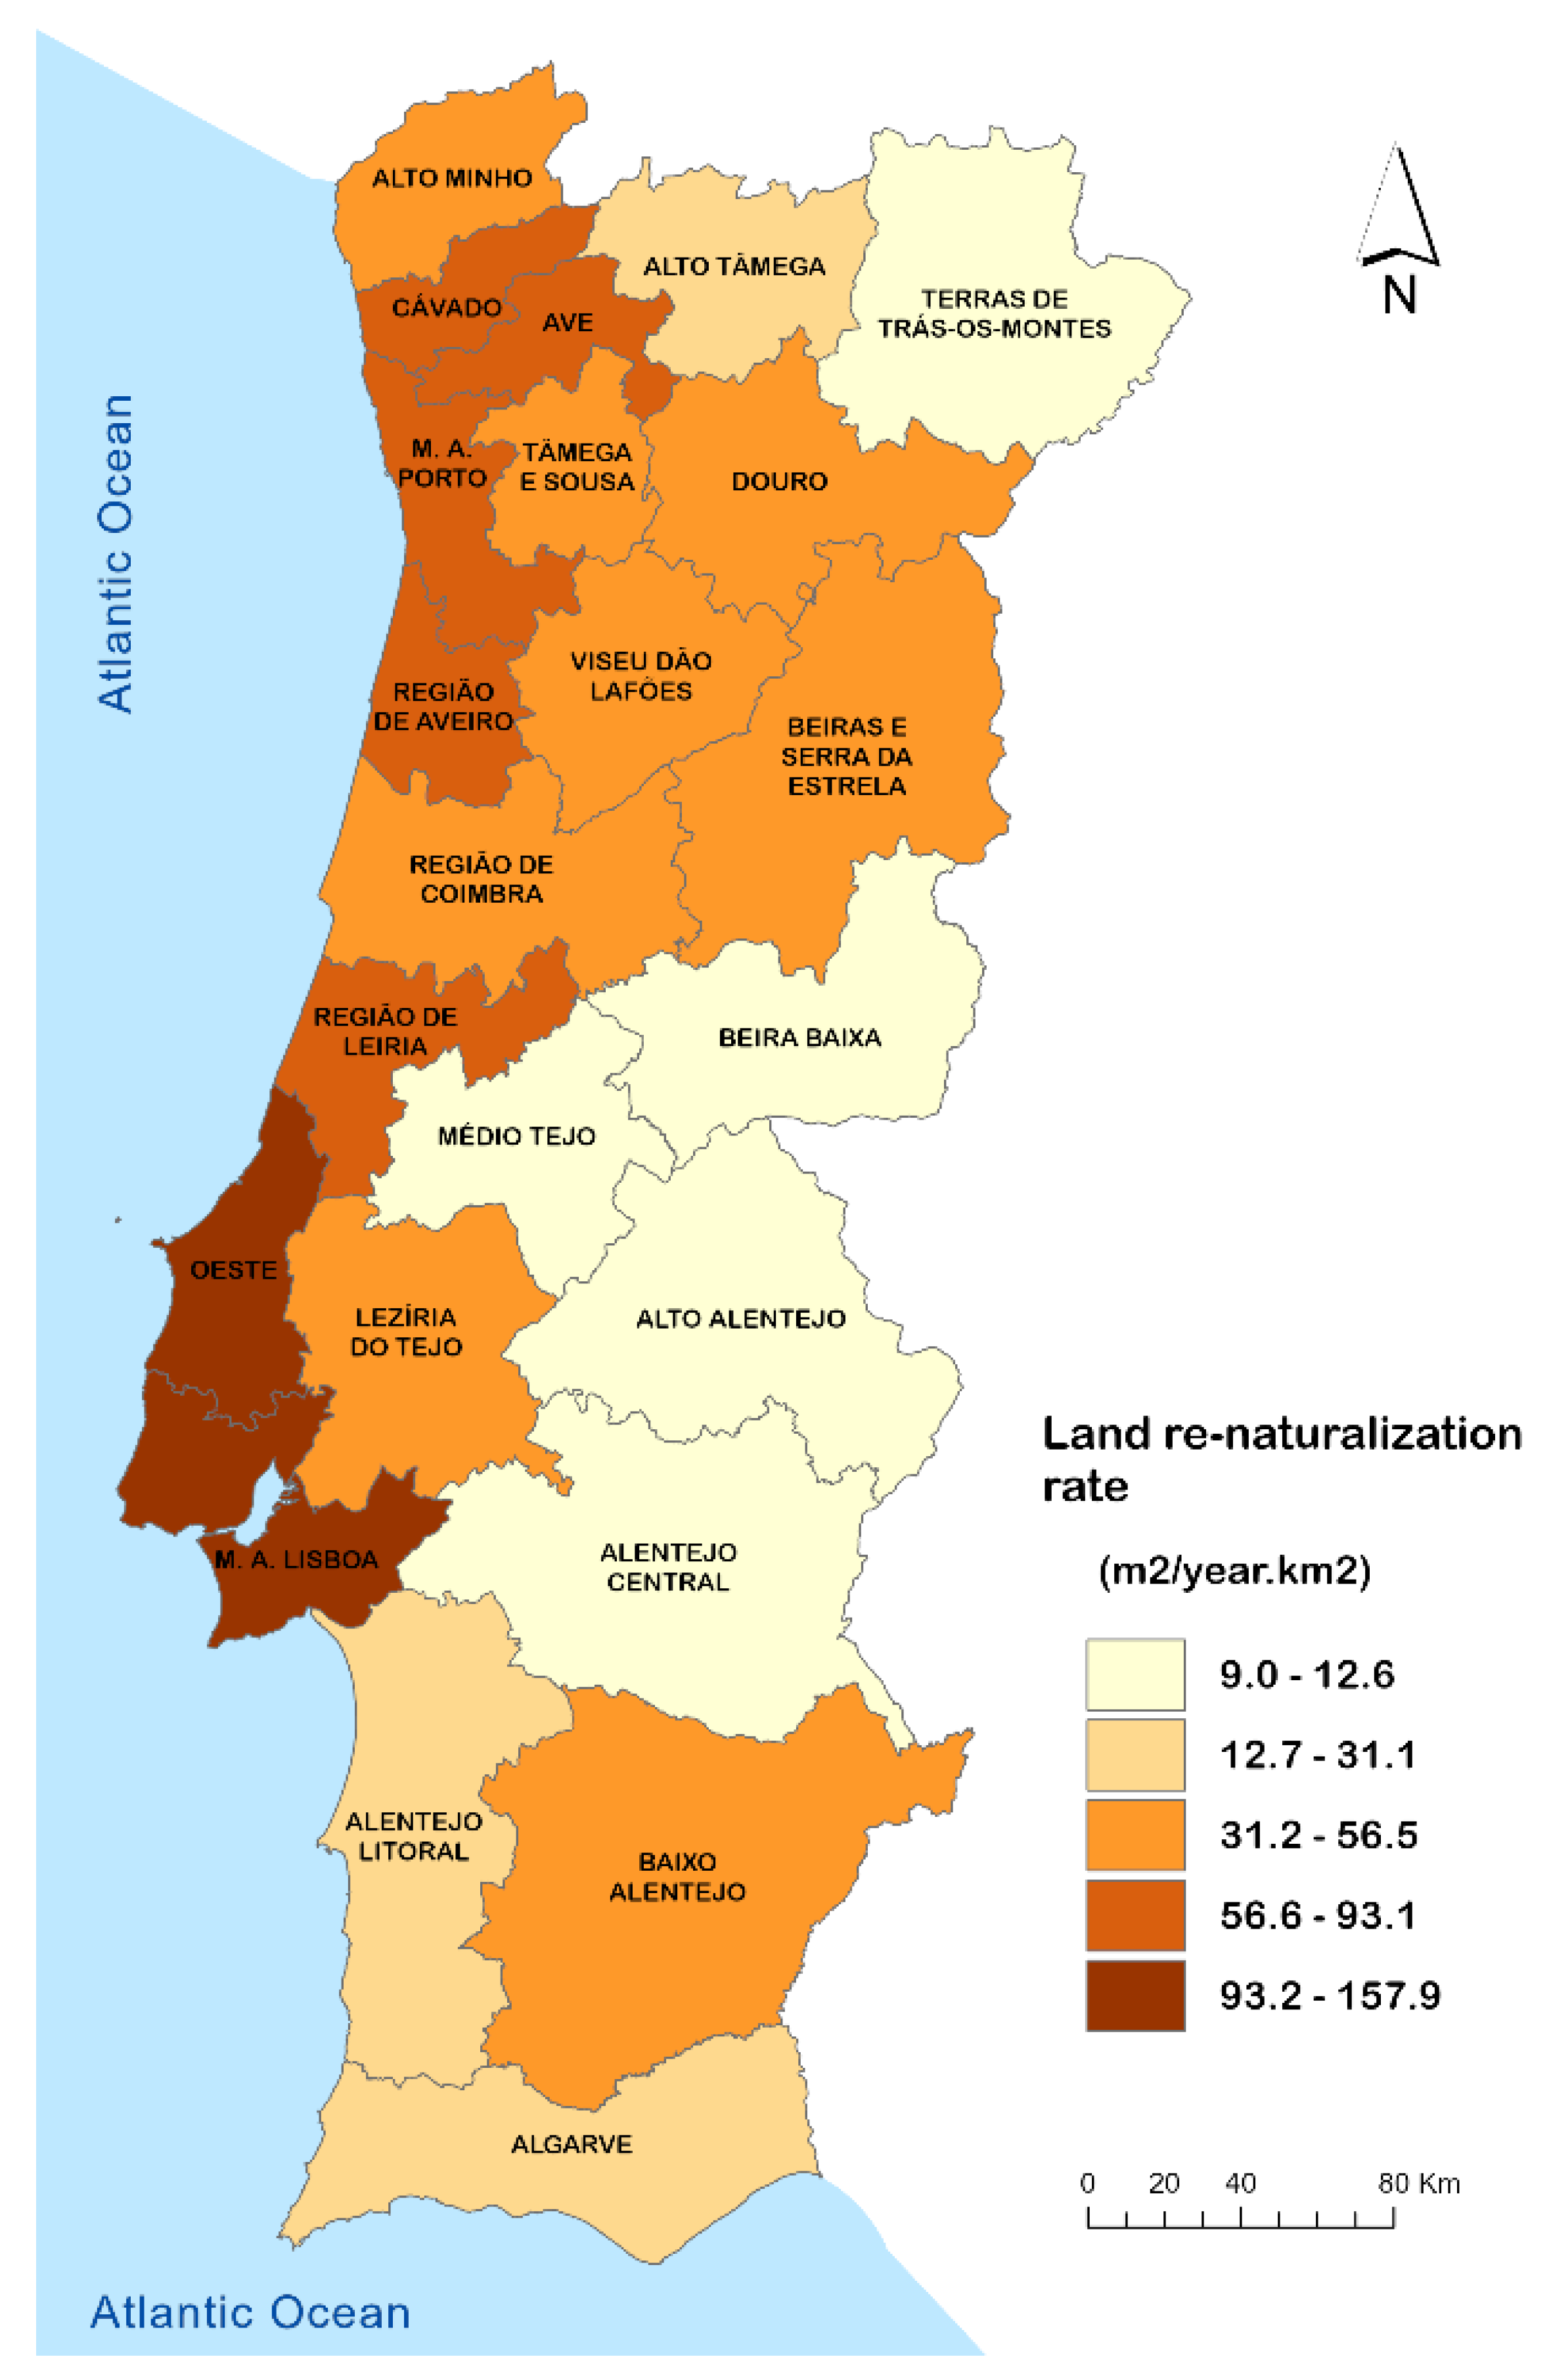
Figure 3 maps the land re-naturalization rate by NUTS III for the same period. The following facts stand out from the analysis of both:
The rate of re-naturalization of developed land in mainland Portugal was 41.6 m2/year.km2.
At the NUTS III level, the highest re-naturalization rates refer to the Lisbon metropolitan area (157.9 m2/year.km2), the Oeste region (148.1 m2/year.km2), the Porto metropolitan area (93.1 m2/year.km2), and the Cávado region (90.4 m2/year.km2).
The lowest re-naturalization rates per NUTS III (<13 m2/year.km2) were in the inland regions of the mainland (Beira Baixa, Alto Alentejo, Alentejo Central, and Terras de Trás-os-Montes).
A more detailed geographical analysis also revealed that 14% of the municipalities in mainland Portugal did not re-naturalize developed land in the period under review.
The balance between land take and re-naturalization shows an annual average of net land take in mainland Portugal of 22.7 km
2/year between 2007 and 2018.
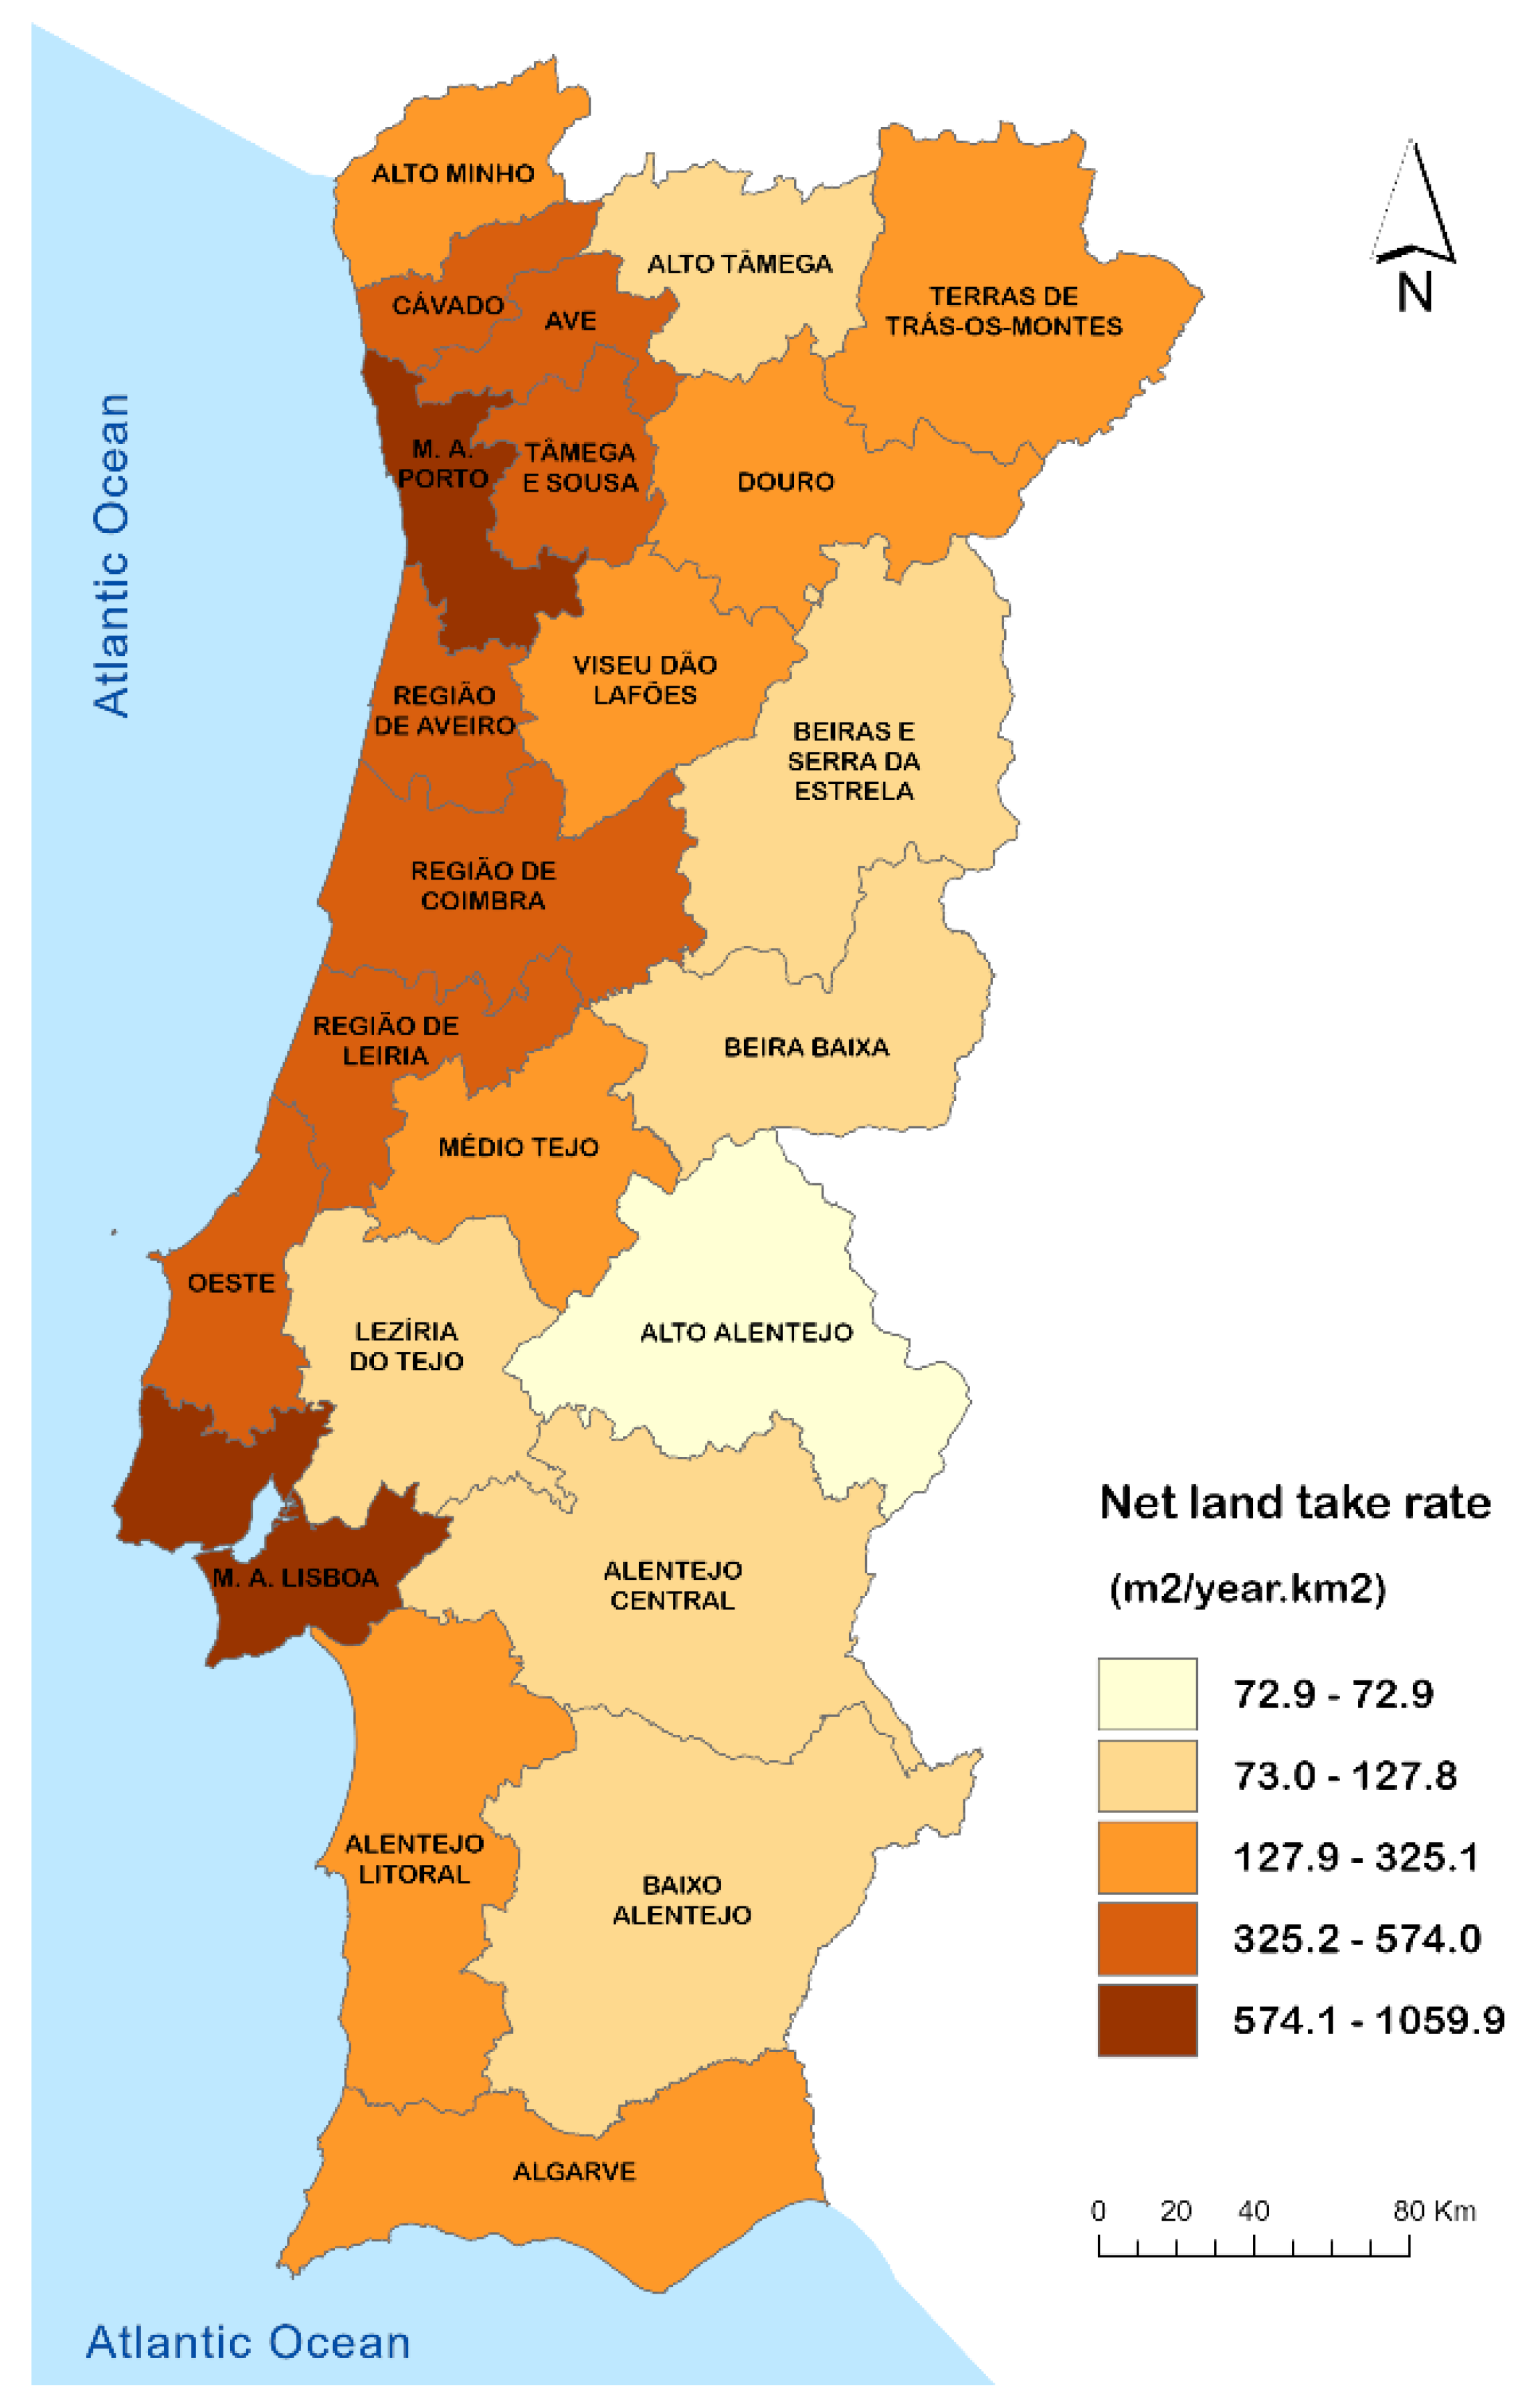
Figure 4 maps the annual net land take rate by NUTS III in this period, and
Table 3 presents (in the 6th and 7th columns) additional net land take indicators for both NUTS III and mainland Portugal.
As noted for the land take rates, the highest rates of net land take occurred in the two metropolitan areas and their immediate surroundings. These rates were higher in the Porto metropolitan area (1059.9 m2/year.km2), slightly lower in the Lisbon metropolitan area (863.2 m2/year.km2), and close to 500 m2/year.km2 in the Aveiro and Ave regions. The lowest net land take rates were in the Alto Alentejo and Beira Baixa regions (72.9 and 98.8 m2/year.km2, respectively).
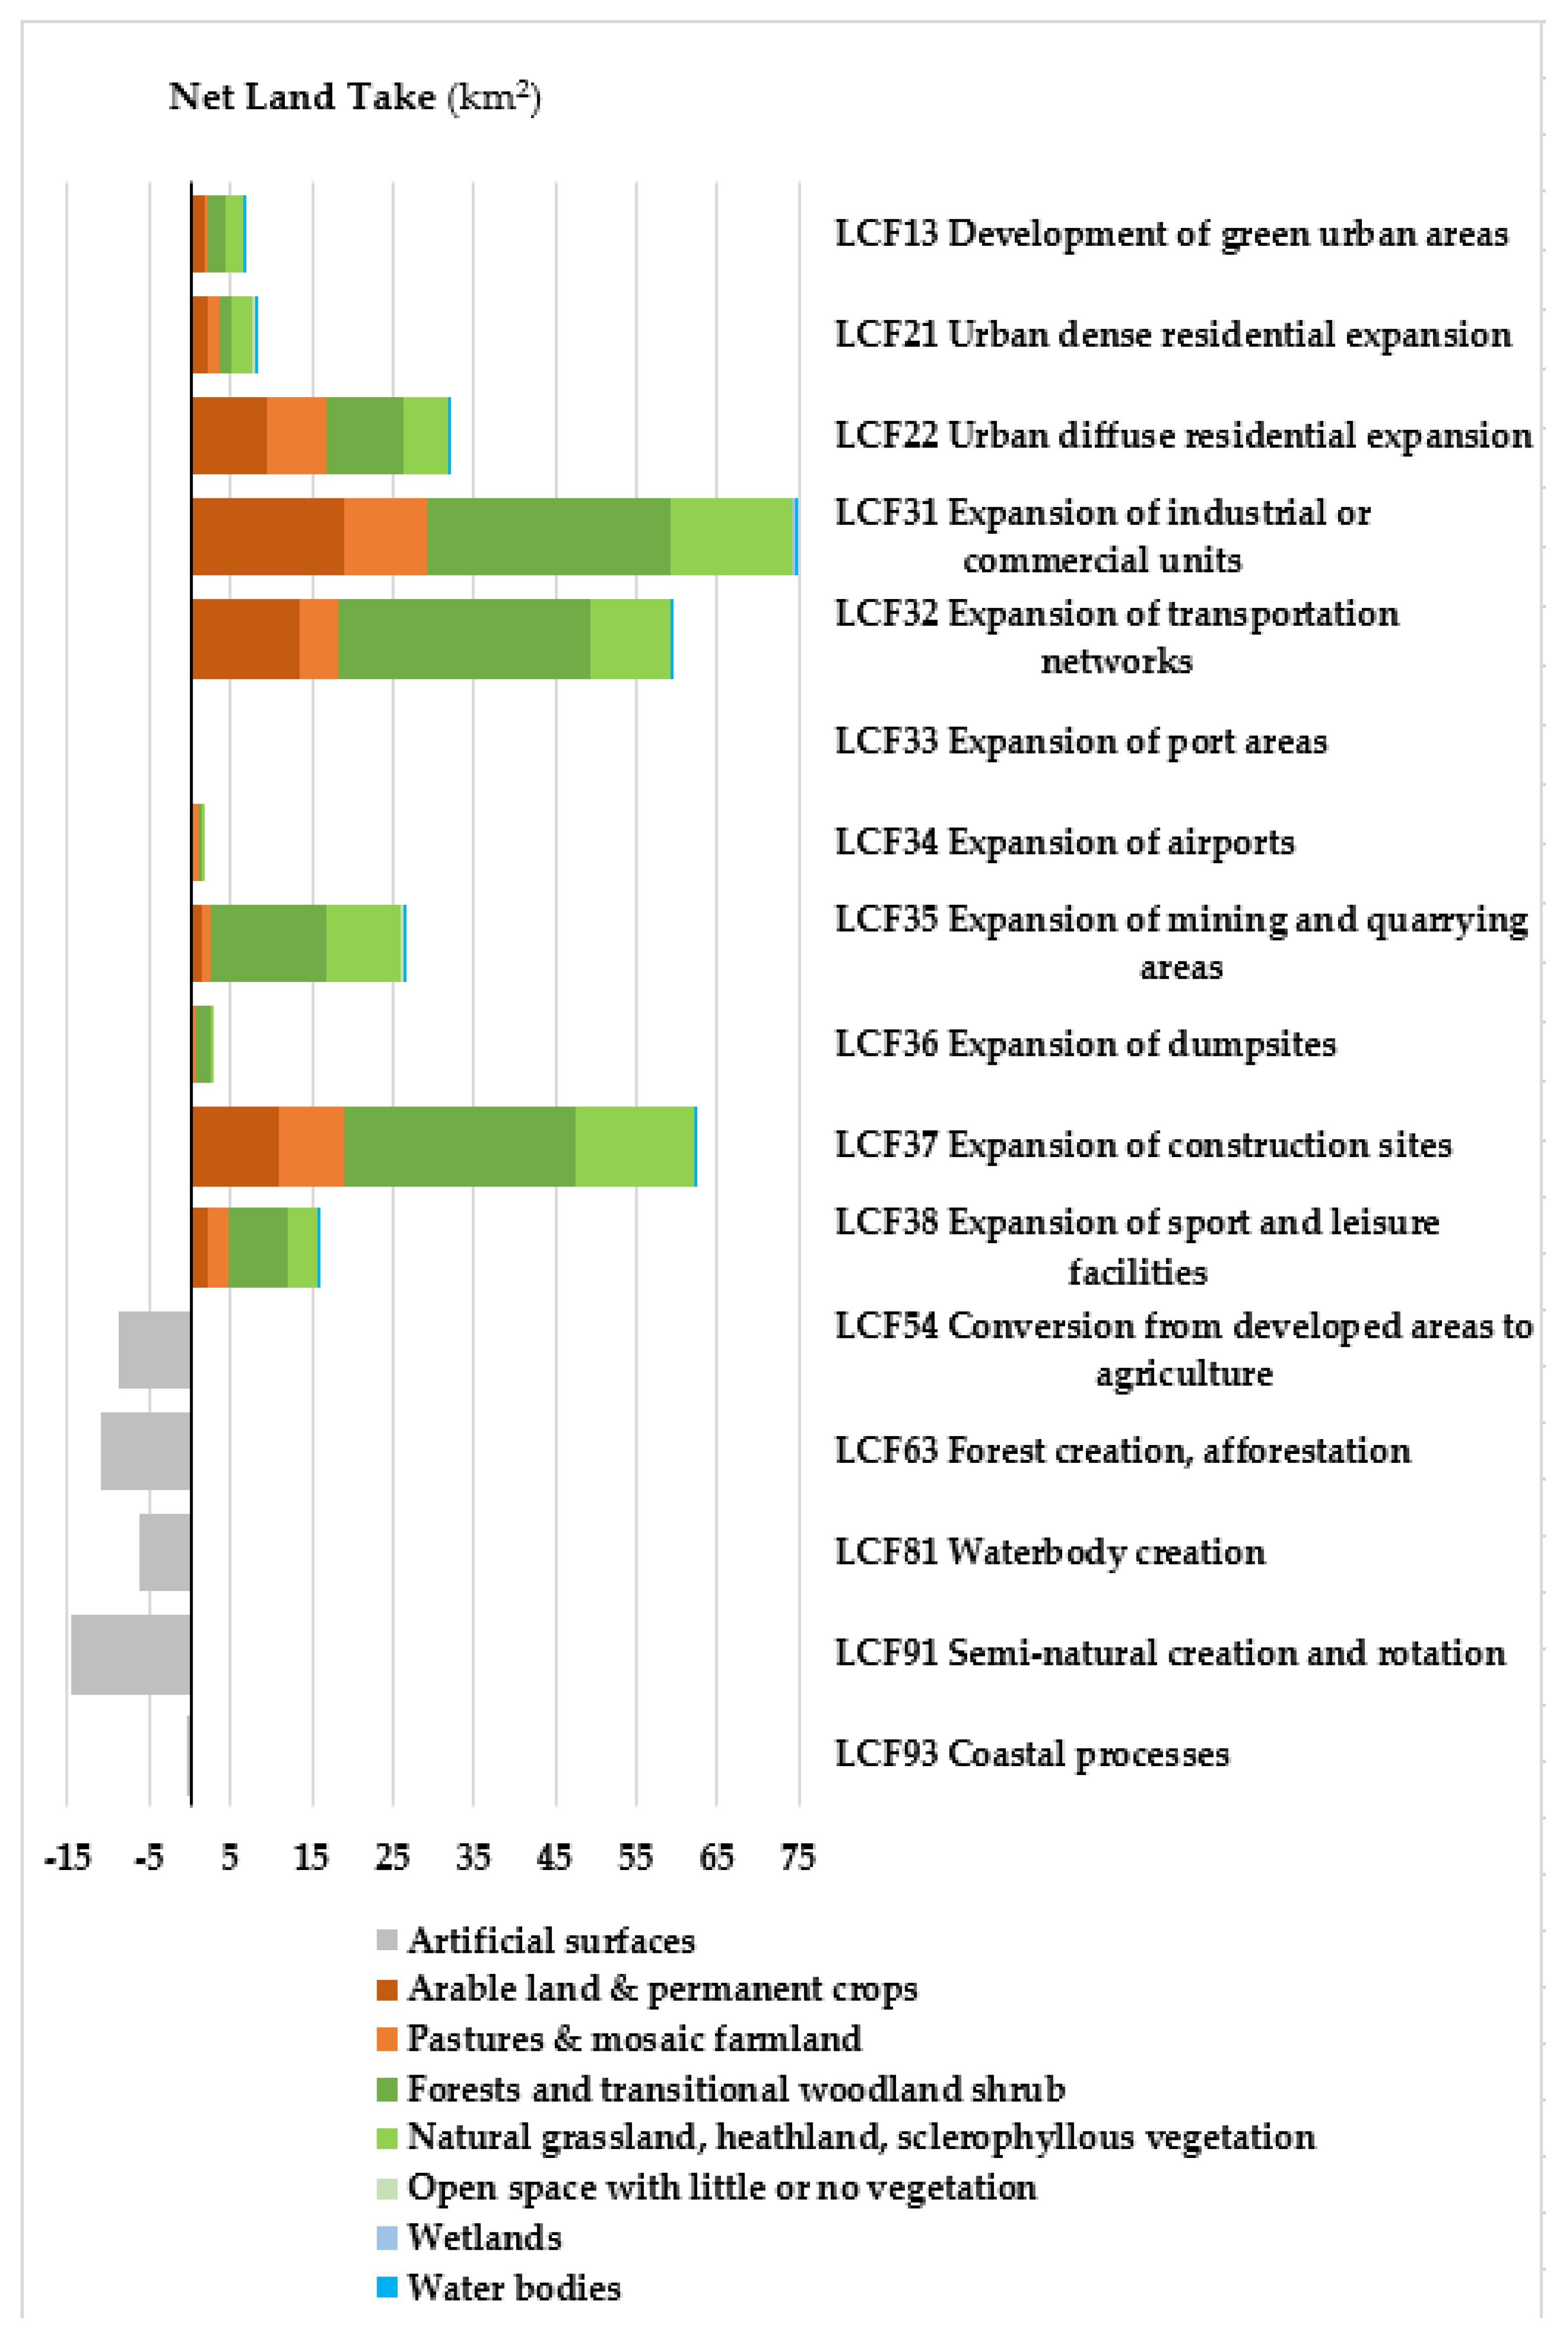
Figure 5 identifies the processes (LCFs) that drove land take and land re-naturalization in mainland Portugal and the land cover types transformed by each LCF (in km
2) between 2007 and 2018. In this figure, the gray bars (negative values) represent the re-naturalization processes, and the bars in other colors (positive values) represent the land take processes.
Table 4 identifies the surface area and land cover types transformed by the land take and land re-naturalization processes. Land cover types are shown as percentages of the surface area transformed by the process. The meanings of the processes in
Table 4 are provided in
Figure 5.
In the period 2007–2018, five land take processes stood out for their relative importance in terms of the area of non-artificial surfaces transformed:
Construction of new industrial and commercial sites (LCF31) accounted for 26% of the non-artificial land taken. The land cover types most used in this conversion were forests and transitional woodland shrub (41%); arable land and permanent crops (25%); natural grassland, heathland, and sclerophyllous vegetation (20%); and pastures and mosaic farmland (14%).
Conversion from non-urban land to construction sites (LCF37) was the process with the second highest relative importance (22%) in land take. The land cover types most used by this conversion were forests and transitional woodland shrub (46%); natural grassland, heathland, and sclerophyllous vegetation (23%); arable land and permanent crops (18%); and pastures and mosaic farmland (13%).
The expansion of transportation networks (LCF32) accounted for 20% of the non-artificial land taken. The land cover types that contributed most to the development of transportation networks were forests and transitional woodland shrub (52%); arable land and permanent crops (23%); and natural grassland, heathland, and sclerophyllous vegetation (17%).
Diffuse residential expansion (LCF22) was responsible for 11% of the non-artificial land taken. The land cover types that contributed most to the creation of discontinuous urban fabric were arable land and permanent crops (30%), forests and transitional woodland shrub (29%), pastures and mosaic farmland (23%), and natural grassland, heathland, and sclerophyllous vegetation (17%).
The expansion of mining and quarrying areas (LCF35) accounted for 9% of the non-artificial land taken. The land cover types that contributed most to the development of those areas were forests and transitional woodland shrub (54%) and natural grassland, heathland, and sclerophyllous vegetation (34%).
In summary, in the period under review, the consumption of non-artificial surfaces in mainland Portugal was mostly driven by the expansion of economic sites and infrastructures (LCF3). The land cover types most expended by those changes were forests and transitional woodland shrub (43.6%), natural grassland, heathland, and sclerophyllous vegetation (21.8%), and arable land and permanent crops (21.2%).
The processes with the highest significance in terms of land re-naturalization in the period 2007–2018 were the conversion of artificial areas into semi-natural areas (partial LCF91), forest and woodlands (partial LCF63), and agriculture (LCF54). These processes contributed respectively, 36%, 27%, and 22% to the creation of re-naturalized land.
An analysis based on CLC classes (level 3) showed that conversions from mineral extraction sites and construction sites (131 + 133) to non-artificial land accounted for 91% of re-naturalization. Among these transformations, the most common were the conversions from the two classes above to bushes (322) and to broad-leaved and coniferous forests (311 + 312), which had shares of 32% and 26%, respectively, in the re-naturalization of developed land. As far as the creation of agricultural areas from mineral extraction and construction sites is concerned, the development of non-irrigated arable land (211) and permanent pastures (231) stands out, which together accounted for 8% of land re-naturalization. The conversion of construction sites to inland waters (511 + 512) accounted for 14% of land re-naturalization.
3.2. Recycling of Developed Land
In this section, we analyze transformations between artificial surface classes, namely, urban development (LCF11) or densification, gray recycling (LCF12), and green recycling (partial LCF13). As mentioned above, these three processes are referred to (in a broad sense) as developed land recycling.
Figure A1,
Figure A2 and
Figure A3 in
Appendix B illustrate the conversions between CLC classes (level 3) covered by these three processes. In line with the explanation provided in
Section 2, our assessment of developed land recycling (in the broadest sense) excludes conversions of sites under construction for any class (illustrated in light blue in the figures in
Appendix B).
Table 5 provides indicators of recycling (in the broadest sense) of developed land for mainland Portugal, by NUTS III regions, in the period under assessment.
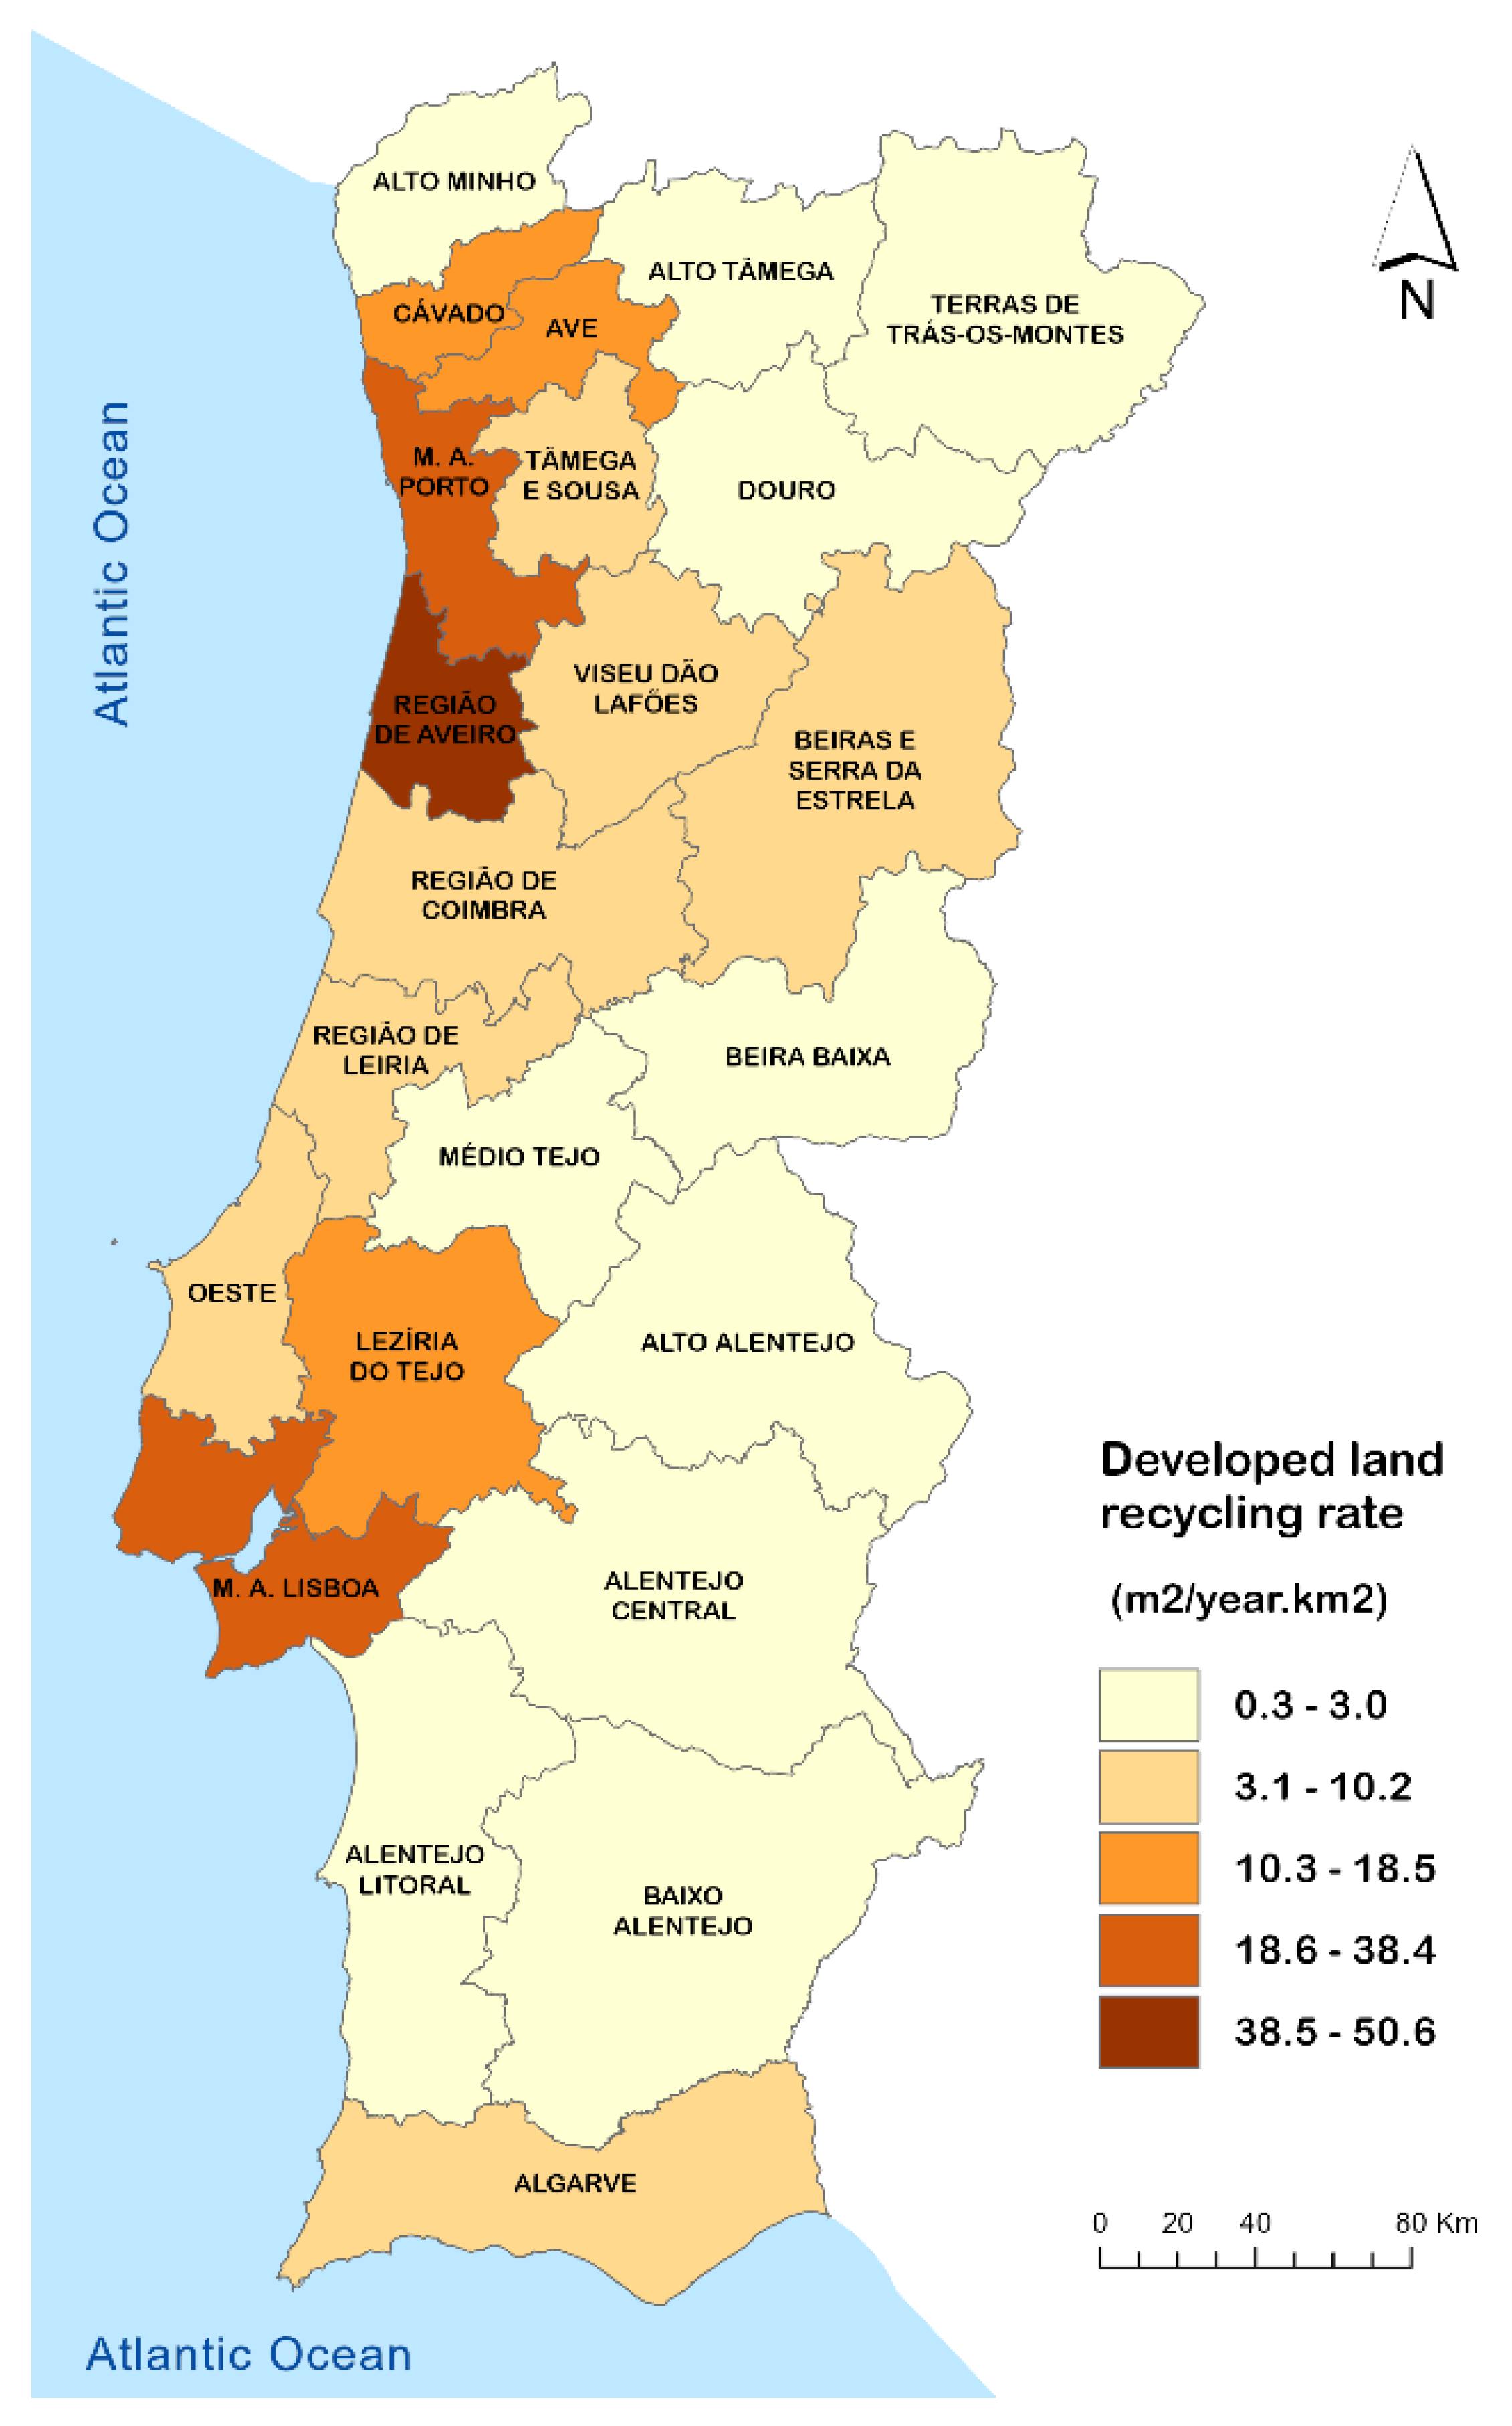
Figure 6 maps the rates shown in the third column of this table. The following conclusions stand out from the analysis of both:
Recycling of developed land is still rare in mainland Portugal. Between 2007 and 2018, the area recycled (6.8 km2) was well lower than that re-cultivated (40.8 km2). The low recycling rates are attributable to the fact that almost half of the mainland municipalities (49%) have not recycled developed land in this period.
The rate of developed land recycling had a similar spatial distribution to that of land take, decreasing from the coast to the mainland’s interior. This rate was 7 m2/year.km2 for mainland Portugal in the period under review.
The highest recycling rates occurred in the Aveiro region (50.6 m2/year.km2); the metropolitan areas (38.4 m2/year.km2 in Lisbon and 27.1 m2/year.km2 in Porto); and the Lezíria do Tejo, Ave, Cávado, and Oeste regions, which had recycling rates of around 10 m2/year.km2.
The lowest recycling rates (≤0.7 m2/year.km2) were observed in interior Alentejo regions (Alto Alentejo, Alentejo Central, and Baixo Alentejo).
The recycling of developed land accounted for 9.1% of the mainland’s urban land management (LCF1) between 2007 and 2018. This share was much higher (≥25%) in regions adjacent to the metropolitan areas, namely, Aveiro and Lezíria do Tejo.
Developed land recycling also accounted for 1.9% of the formation of artificial surface areas on the mainland. The regions with the highest shares were also Lezíria do Tejo (7.1%) and Aveiro (6%).
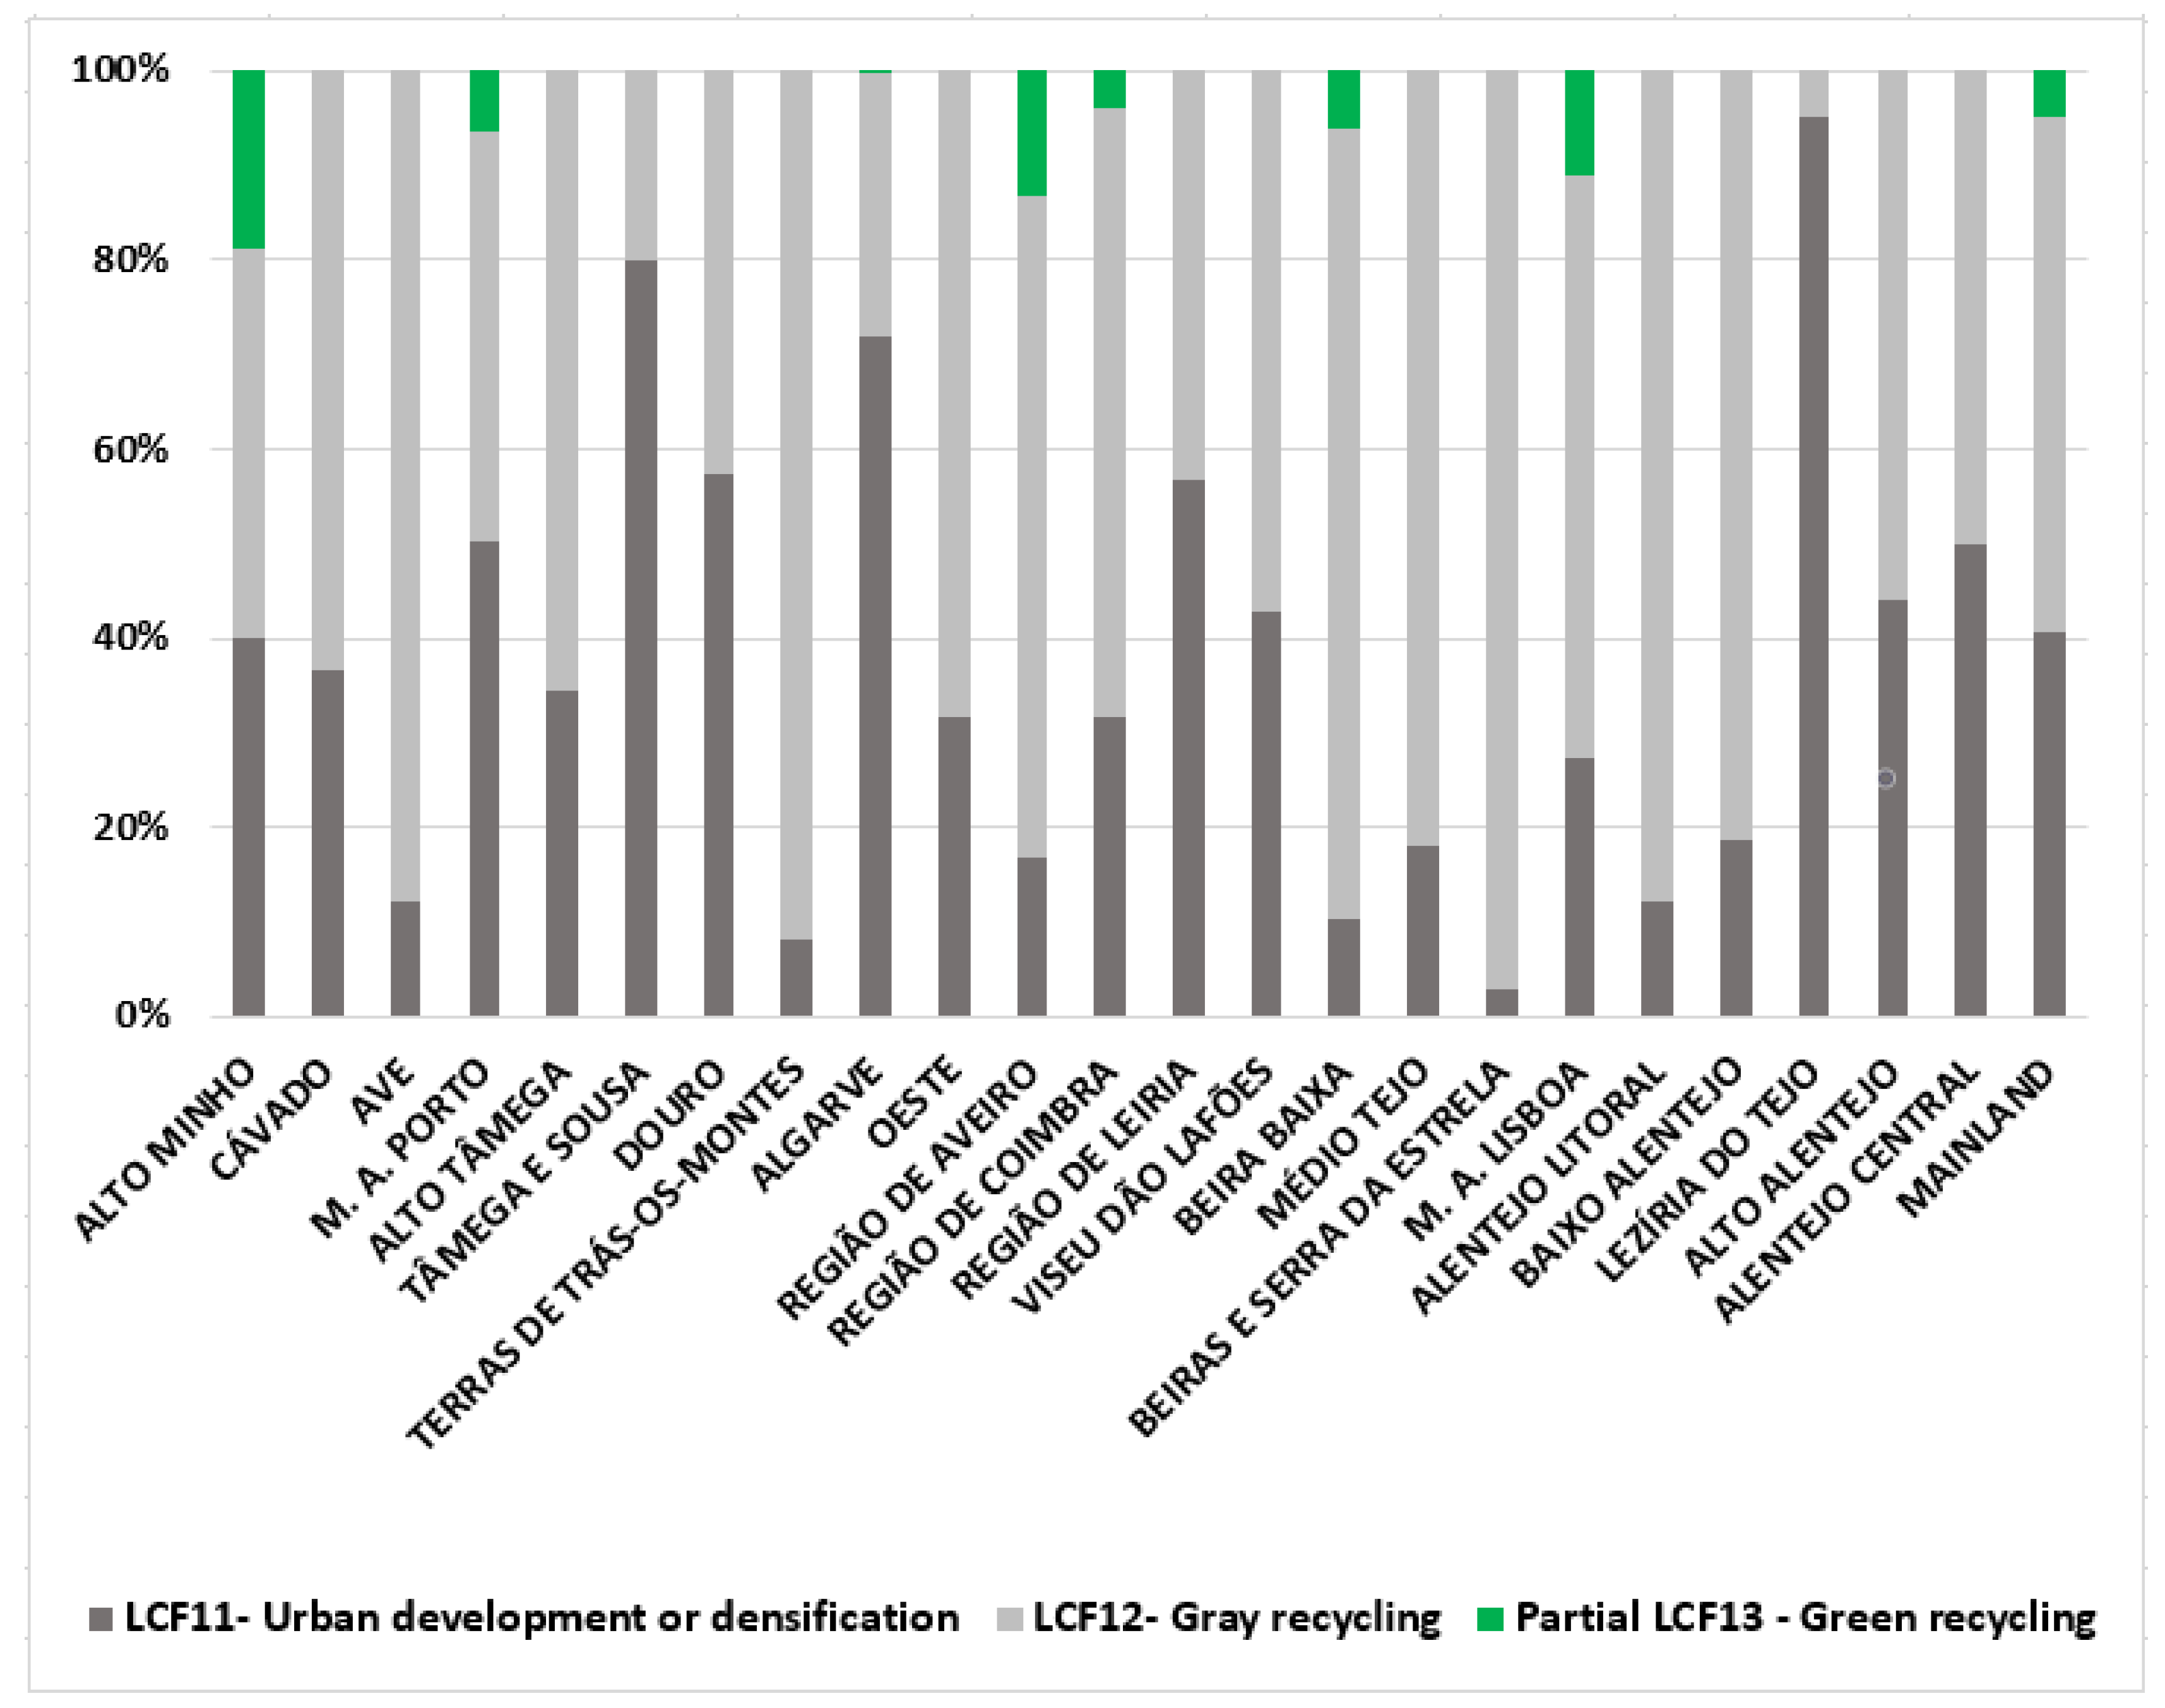
Figure 7 shows the relative significance of developed land recycling processes in the period under analysis. It allows concluding that gray recycling prevailed over urban development (or densification) in mainland Portugal and most of its regions. The majority of NUTS III regions did not carry out green recycling in the 2007–2018 period. This type of land recycling only had some relative importance (less than 20%) in the following spatial units: mainland Portugal, the two metropolitan areas, and the regions of Alto Minho, Aveiro, Beira Baixa, and Coimbra.
3.3. Land Take and Population Growth
This section compares the population growth with the expansion of artificial areas between 2007 and 2018 in mainland Portugal and its NUTS III regions.
Table 6 presents the following additional indicators to assess urban land use efficiency: land take per new inhabitant, artificial area per capita, and share of artificial land by region.
A comparison of the first two indicators in
Table 6 shows that, between 2007 and 2018, in most regions and in mainland Portugal, there was an expansion of artificial land despite a population decrease. As a result, the artificial area per capita increased in all regions and the mainland. The Lisbon metropolitan area and the Algarve are the only regions that had population increases, but they were, nevertheless, lower than those for their artificial surface areas.
On the other hand, the inner regions of the mainland (Alto Alentejo, Beiras e Serra da Estrela, and Alto Tâmega) experienced the highest population reductions.
The land take per new inhabitant indicator shows the uniqueness of the Lisbon metropolitan area and the Algarve compared to the other regions of mainland Portugal, which presented negative figures for this indicator, because they had population declines between 2007 and 2018. The lowest land take per new inhabitant happened in the Oeste region (−39373.2 m2/inhabitant). Although in this region, the area of non-artificial land transformed by urban development (15.6 km2) is not among the highest, the decrease in its population (−396 inhabitants) was the smallest of those observed in regions that lost population.
The fact that in 2018 almost half (47%) of the resident population in mainland Portugal was concentrated in the two metropolitan areas justifies that these two regions had the highest shares of artificial land (25.1% for Porto and 21.7% for Lisbon).
Although in 2018, the Lisbon metropolitan area had about one million more inhabitants than the Porto metropolitan area, the artificial area per capita in Porto (297 m
2/inhabitant) was higher than in Lisbon (230 m
2/inhabitant), which shows that Lisbon is denser than Porto. Despite the higher shares of artificial land observed in the two metropolitan areas (see
Table 6), the regions of Cávado, Ave, Aveiro, Tâmega e Sousa, and Oeste also stand out for having, in 2018, more than 10% of their surface areas occupied by artificial land. In the above regions, the lowest artificial surface area per capita value was registered in Tâmega e Sousa (469 m
2/inhabitant), and the highest was in Oeste (656 m
2/inhabitant).
4. Discussion
We would first like to point out that, like other authors, we consider that the term ‘land take’ is controversial, as the land is not taken but transformed by urban development [
5,
6,
25,
26]. Its use in this paper is only justified by the recognition the term has gained with the spread of the goal of “no net land take”. The designation ‘land consumption’ is also in itself questionable, as it reflects a change in land cover/land use, and only changes of non-artificial to artificial land are accounted for by land take.
This study assessed the land take, re-naturalization, and recycling of developed land in mainland Portugal, broken down by NUTS III region, through an analysis of land cover/land use changes between 2007 and 2018.
The 2007 and 2018 national land cover/land use maps (COS) served as baseline data. Since national cadastral data is either not available or up to date for the whole of the mainland, COS maps were considered the most complete and accurate data source for quantifying and tracking the phenomena of interest due to their regular updating (every three years) and their spatial coverage (mainland Portugal).
The Land and Ecosystem Accounting system, developed by the EEA [
50,
51,
52], was adopted to assess the land cover/use changes contributing to the phenomena addressed and their driving forces. In this assessment, a Minimum Mapping Unit was not defined for change identification, which may have contributed to some of the changes considered, especially those related to small areas, no longer reflecting their original land cover/land use classification. This approach was, however, justified by both the small number and small size of some of the changes of interest for this study.
The main innovative contribution of this study was the assessment of land take, re-naturalization, and recycling of developed land using national data sources and the Land and Ecosystem Accounting system. Monitoring the European target in any country or region requires a quantitative assessment of these phenomena, and their extent in mainland Portugal was previously unknown.
Since our findings depend on the data sources and assessment approach used, their comparability with results published by the EEA [
7,
11,
17,
53] for mainland Portugal, which considers different assessment periods and data sources, is limited. Regarding this issue, Decoville and Schneider [
5] point out that the land take estimates provided by distinct data sources present significant variability, which questions the measurability of the 2050 target and its comparison across countries. Furthermore, land take is described by most countries using an average annual or daily surface area, which is not comparable across countries due to their uneven spatial extents, so this metric only evaluates the performance of the same spatial unit over time.
The following is a summary of the main results obtained in this study, which are compared, whenever possible, with the European trends and discussed in light of the policies in force in mainland Portugal.
The non-artificial land consumed by urbanization during the period under consideration (7.2 ha/day) represents 0.3% of mainland Portugal’s surface area, which is more than double that observed between 2006 and 2018 in 39 European countries (0.14%) (percentage based on the content available at [
11]).
The main drivers of land take in the mainland in the 2007–2018 period were the development of new industrial and commercial sites and the creation of construction sites, transportation networks, and residential areas. The first three accounted for 68% of the land taken, and residential extension accounted for 13.7%. Although the period available for comparison at the European level (2006–2018) was slightly longer than that taken into consideration herein (2007–2018), it was found that the main drivers of land taken in Europe (39 countries) are similar to those observed for mainland Portugal. Nevertheless, the expansion of mining and quarrying areas in the rest of Europe was more significant than the expansion of transportation networks.
The land cover types most consumed by the conversion of non-artificial areas into artificial areas in mainland Portugal were forests and transitional woodland shrub (43.6%), and natural grassland, heathland, sclerophyllous vegetation (21.8%). The consumption of arable land and permanent crops by the land take was 21.2%. In contrast to observations for mainland Portugal, arable land and permanent crops (44.6%) and pastures and mosaic farmland (26.9%) were the land cover classes most used by land take in Europe (39 countries) between 2006 and 2018 (percentages based on the content available at [
11]).
Daily re-naturalization in mainland Portugal between 2007 and 2018 (1.0 ha/day) was about seven times less than the land uptake by new urbanization. The highest rates of re-naturalization were in the coastal regions, mainly those interconnecting the two metropolitan areas. Re-naturalization was even null in several municipalities in mainland Portugal (14%). Since re-naturalization makes it possible to compensate for some of the non-artificial land used by urbanization, its practice should be promoted on the mainland. Although the land lost for human development is commonly much higher than that re-naturalized, the proportion of land re-naturalized in mainland Portugal between 2007 and 2018 (0.5%) was higher than that re-naturalized in Europe (39 countries) between 2006 and 2018 (0.013%) (percentage based on the content available at [
11]).
In the period under analysis, the changing of artificial areas into semi-natural areas accounted for 36% of re-naturalization in mainland Portugal; the conversion of mineral extraction sites and construction sites to bushland was the most common (32%). Given that scrub development results from land abandonment and increases the risk of forest fires, it should be noted that this is the least desirable type of re-naturalization for our territory.
The conversion of developed land into agricultural areas accounted for 22% of the land re-naturalization in mainland Portugal. This conversion was, however, the most noteworthy (at 71.5%) in 39 European countries between 2006 and 2018 (percentage based on the content available in [
11]).
Regarding the reuse of developed land, the surface area recycled between 2007 and 2018 in mainland Portugal (6.8 km2) was six times less than the surface area re-naturalized (40.8 km2), so the annual average of land recycled (0.6 km2/year) was very low. This low average is attributable to the fact that almost half of the mainland municipalities (49%) have not recycled developed land in this period. Of the regions that did register recycling, Aveiro stands out with a maximum annual recycling rate of 50.6 m2/year.km2, along with the two metropolitan areas and some regions adjacent to these.
A European study on this topic [
17,
53] reported that, between 2006 and 2012, the contribution of developed land recycling to the creation of artificial surface areas in 318 functional urban areas of medium to large European cities was still relatively low (13.5%). This value is, however, much higher than that observed in the mainland (1.9%) and in the Lezíria do Tejo region (7.1%), which recorded the highest figure.
As for land recycling processes, gray recycling was more relevant than urban development (or densification) in most regions, and in mainland Portugal, where it accounted for 55% of land recycled between 2007 and 2018. In contrast to mainland Portugal, densification was the most frequent recycling process in the above-mentioned European cities. This disparity between results is likely due to the use of different base data. As observed in the aforementioned European cities, green recycling was the least common recycling process in mainland Portugal (4.9%), though most regions have not implemented it.
It should be highlighted that our green recycling estimate is, by definition, lower than that of the EEA [
17,
53] because it only includes the development of green urban areas from artificial areas. The EEA estimate additionally covers the development of sports and leisure facilities from artificial land, based on the assumption that this creates additional green cover, and therefore increases the area of unsealed land. We have not included this option because our base maps show that more than half of the surfaces occupied by sports and leisure are is sealed.
Since the reuse of developed land prevents land take and the contribution thereof to the creation of artificial surface areas in mainland Portugal was extremely low, we conclude that practice thereof should be encouraged in Portugal.
Our results show that the daily net land take in mainland Portugal (6.2 ha/day) between 2007 and 2018 is still far from the “zero net land take” target, mainly due to the rarity or even lack of either re-naturalization (1 ha/day) or developed land recycling processes (0.2 ha/day).
Between 2007 and 2018, mainland Portugal and most of its regions experienced a decrease in inhabitants and an expansion of artificial surface areas. The Lisbon metropolitan area and Algarve were the only regions that recorded an increase in population, but these increases were less than the growth in their artificial surface areas. In the said period, the rate of land take in mainland Portugal (7.2 ha/day) decreased substantially in comparison to the 1990–2007 period (34 ha/day) [
54]. However, in the period 1990–2007, the population increased in the mainland and most of its regions, whereas from 2007 to 2018, there were population declines in most of the territory. Despite the positive reduction in the land take rate between the two periods, the rate observed in the latter period did not follow population dynamics. As most of the non-artificial land taken between 2007 and 2018 served for the development of economic sites and infrastructures, and while some regions still need to invest in this to halt population loss, it is not sustainable for artificial areas to continue to grow over the next decade at the same rate.
The above results show that the current legislation in Portugal to control land use, namely, the instruments to protect agricultural and natural land (often seen by local governments as obstacles to the development of their territories), is not effective enough to promote the re-use of developed land, which is vital to reduce land take. On the other hand, the recent reinforcement in the national legislation of concerns containing urban sprawl and encouraging urban densification and regeneration may have contributed to the fact that their impact on reversing the trend of land take in the mainland is not yet noticeable.
The introduction of the European target in countries such as Portugal, which have multi-level planning systems and where land take presents significant spatial variability, makes it advisable to define differentiated guidelines or targets for the regional and local levels. Since in our country, it is up to the local authorities to authorize and issue building permits under the municipal land use plans, it is paramount that the regional guidelines allow for balance and articulation among the municipalities. Furthermore, it is necessary to make decision-makers and stakeholders aware of the existence of the European goal, inform them about the type of interventions that can help achieve it, and promote stakeholder involvement in the development and implementation of land use plans [
13].
As highlighted by Build Europe [
15], the target of “no net land take” ignores the different social and economic conditions in European countries and regions. Accordingly, measures aimed at achieving the target should be adapted to the specific context of each country or region. In line with this view, Decoville [
33] argues that land take should not be assessed based on a single indicator, as evaluation thereof requires the identification of the main drivers and knowledge of the demographic and economic developments and policy measures in place in the same period.
The definition of interventions to reach the European goal requires a comprehensive evaluation of the phenomena addressed, such as the one provided by this study for mainland Portugal. It is recognized, however, that the study would be improved by regional and municipal assessments similar to those presented for mainland Portugal, which would allow differentiating the driving forces of net land take at these levels and support the definition of more targeted interventions. Quantifying permanent land take is another aspect that could help improve the study. Knowledge of the surface area of sealed land would reveal the most intense form of land take, which is usually irreversible [
16].
Shortage of time did not allow the evaluation of the aforementioned aspects. Thus, the research we intend to undertake in the short term will include the regional analysis of both sealed land and land take drivers and the identification of inland urban areas with reuse potential.
5. Conclusions
This study discloses that the term “land take” has different significance among Member States, which prevents comparisons of its estimates across countries. For this reason, clarification of the land use changes that the term covers are needed. Despite the ambiguity of land take’s definition, there is evidence that several countries are acting on the message contained in the goal, which is the protection of soils, especially those that are most fertile and productive. To this end, some countries, such as Italy, already assign economic value to soil based on the functions and ecosystems it provides, to classify land and estimate losses and gains due to its transformations [
47]. Moreover, the economic valuation of soil also supports the establishment of fees for land take or rating systems for defining building rights [
13].
A reduction in net land take is only feasible through an increase in the re-naturalization of developed land, a process that is undertaken in specific and rare circumstances. Accordingly, developed land recycling (or inner urban development) is the only intervention that can seriously mitigate land take. As implementation thereof may be unfeasible in already highly densified urban areas where the population continues to grow, it must be admitted that the “no net land take” target may be unattainable for some countries and regions in Europe by the year 2050. Such countries should pursue more sustainable urban development, which preserves land as a natural resource and maximizes the functions and services it provides.
The descriptions in the first section of some of the initiatives and instruments used to prevent land take also showed that the actions aimed at the 2050 target differ across countries and that the indicators monitored are equally diverse, favoring an adjustment in the target to match the land use planning objectives of the countries or regions. In line with the vision of the ESPON SUPER project, we believe that the ultimate aim of the “no net land take” target should be “to harness the potential of each territory to contribute to European sustainability” [
26] (p. 97). Therefore, replication of good practices from other countries or regions (extensively described in [
26]), with appropriate vertical and horizontal coordination and adapted to the political and socio-economic contexts, may be more effective in achieving this ultimate aim than policy and regulatory harmonization.
Thus, the recommendations we make regarding the implementation of the European goal are based on the RECARE project [
13] and aim at the allocation of dedicated EU funding for more sustainable land use, namely, the increase in green and blue infrastructure, the reuse of brownfield sites, and the creation of binding policy instruments to reduce soil sealing. We also recommend that member states establish laws and regulations to combat land take and financially support local governments in their implementations. Along with the definition of a legal framework concerning land take and soil sealing, they must promote dialogue about the European goal, adopting communication strategies adjusted to the different stakeholders and levels of decision-making.
Regarding mainland Portugal, our findings show low efficiency in urban land use in the mainland and most of its regions (while the mainland’s artificial land increased by 5.7%, its population decreased by 2.6%). The main drivers of land take were the development of new industrial and commercial sites and the expansion of construction sites, transportation networks, and residential areas. Our results also show that the recycling of land developed on the mainland is still very low because almost half of the municipalities do not undertake it. These municipalities are some of inland regions that had the most significant population reductions between 2007 and 2018. While some of these regions still need to invest in new jobs and infrastructures to halt population loss, these should be targeted to sites within the urban perimeters with the potential to be reused.
The European guidelines on land take do not seem sufficient for its mitigation in Portugal, so we consider that setting quantitative targets for different levels (national, regional, and municipal) would be more effective for reducing land take.
This study is of interest to spatial planning actors unaware of the European goal and the interventions European nations can undertake to meet it by 2050. The contents presented can serve as an example for countries that have not yet started to monitor net land take and related processes. Moreover, the study is also of interest to those concerned with sustainable urban development.


