Article

Study on Eco-Environmental Effects of Land-Use Transitions and Their Influencing Factors in the Central and Southern Liaoning Urban Agglomeration: A Production–Living–Ecological Perspective

1
JangHo Architecture College, Northeastern University, Shenyang 110169, China
2
Key Laboratory of Regional Sustainable Development Modeling, Institute of Geographic Sciences and Natural Resources Research, Chinese Academy of Sciences, Beijing 100101, China
3
China Building Technique Group Co., Ltd., Beijing 100013, China
*
Author to whom correspondence should be addressed.
Land 2022, 11(6), 937; https://doi.org/10.3390/land11060937
Submission received: 14 May 2022 / Revised: 10 June 2022 / Accepted: 16 June 2022 / Published: 18 June 2022
(This article belongs to the Topic Climate Change and Environmental Sustainability)

Abstract

:
From the perspective of the production–living–ecological space, this paper reclassifies the land-use categories in the central and southern Liaoning urban agglomeration in the years 1990, 2000, 2010 and 2018. It then quantitatively analyzes the spatiotemporal evolution characteristics of land-use transitions by adopting the land-use transfer matrix and other methods. This paper further uses the eco-environmental quality index and ecological contribution rate to explore the eco-environmental effects of the land-use transition. Finally, it identifies the influencing factors of the eco-environmental effect and the spatial differentiation law of the effect in the study area through the multi-scale geographically weighted regression (MGWR) model. The main conclusions reached are as follows: (1) During the study period, a slow increase was seen in the ecological land of the central and southern Liaoning urban agglomeration. A sharp decline occurred in the production land, and a rapid rise was found in the living land. (2) From 1990 to 2018, the eco-environmental quality index in the study region showed significant spatial differentiation, with the distribution characteristics being high in the east and low in the west. The areas have expanded and spread along the Shenyang-Dalian axis to form medium-low quality agglomerations. The encroachment of agricultural production land and urban and rural living land on forest ecological land is the main contributor to the deterioration of the eco-environmental quality during the study period. (3) Compared with the geographically weighted regression model and the ordinary least squares model, a remarkable advancement can be seen in the MGWR model, which is more suitable for research on the influencing factors of eco-environmental quality. In addition, different influencing factors have significant spatial differences in the degree and scale of impact.

1. Introduction

Land-use transition is a major contributor to numerous ecological and environmental issues such as climate warming, loss of biodiversity and a decrease in forest resources [1,2]. For example, the increase in global food demand as a result of population growth is enhancing the human pressure on the global land [3,4,5]. Cultivated land grabbing has occurred in many countries, and part of the grabbed land was the result of intense deforestation and land-use change [6,7]. The disordered transition and the unreasonable use of land have led to a tremendous decrease in forests and a series of environmental problems [8]. In addition, land-use transitions have a significant influence on the global carbon cycle [9]. With the rapid advance of urbanization and industrialization, human activities are causing unprecedented levels of human-induced land degradation [10]. A 2019 Intergovernmental Panel on Climate Change (IPCC) special report indicated that some important carbon sink regions [11], such as the Amazon rainforest, are becoming net emitters of carbon as land degradation advances. These factors have a serious impact on human survival and development and have gradually become the focus of attention in a variety of disciplines [12,13,14,15,16]. At present, the existing research on land-use transition centers on four aspects: spatiotemporal patterns and processes [17,18], driving forces and driving mechanisms [19,20,21,22], simulated predictions and sustainable development [23], and eco-environmental effects [24]. The research scales are mainly at the global, national, river basin, provincial and municipal levels. The consistent increase in the number of studies related to the protection of the environment and ecosystem has been seen since 2007, possibly due to the influence of the Millennium Ecosystem Assessment (MA) and The Economics of Ecosystems Biodiversity (TEEB) initiative [25]. Land-use transition is a significant factor that triggers changes in the ecological environment. The optimal allocation and effective management of land resources are conducive to the improvement of the ecological environment and promote the sustainable use of land [26]. Considering the global effort to achieve the Sustainable Development Goals (SDGs) related to life on land [27], further research into the eco-environmental effect of land-use transition and its formation mechanism at the regional level can provide sound support for effective management of land [28]. This is significant to the guidance and coordinated development of regional land resource development and eco-environmental protection.
Extensive research has been conducted on the ecological and environmental effects of land-use transitions. The research perspectives mainly cover the following three types. First, from the perspective of habitat fragmentation [29], efforts are made to analyze the evolution of landscape patterns triggered by land-use changes and their impact on the biological habitat of organisms. Second, from the perspective of environmental quality evolution, efforts are made to analyze the impact of land-use changes on the value of ecosystem services [30,31,32]. Third, from the perspective of production–living–ecological spaces (PLES) [33], the land-use types are classified according to production, living and ecological functions. Efforts are then made to probe into the changes in the regional ecological and environmental quality generated by the dominant land function transition. The production–living–ecological space division method coincides with the sustainable development three-pillar concept [34]. Land-use transitions can be linked with regional development transformation, which is becoming an important entry point for studying land-use transitions [35]. In China and some developing countries, rapid urbanization and rapid economic development have brought about huge changes in PLES [36]. The PLES imbalance is the main cause of environmental pollution, excessive consumption of energy resources and ecological system degradation [37]. Therefore, the construction of the PLES classification system is of great significance for measuring the level of regional development coordination, identifying land-use conflicts and exploring sustainable development paths.
In terms of research methods, numerous explorations have been made by researchers. The main methods used for the comprehensive measurement of the ecological effects of land-use transitions include the landscape ecological risk index [38,39,40,41], ecosystem service value model and eco-environmental quality index [42], of which the eco-environmental quality index establishes the correlation between land-use cover change and environmental quality through ecological assignment. The eco-environmental quality index can more accurately depict the spatial evolution characteristics of the eco-environmental effect of regional land-use transition and has been widely applied since its introduction [43,44,45]. The main methods for studying the driving mechanism of eco-environmental quality include the geographically weighted regression (GWR) model [12,46], the partial least squares regression method [47], spatial principal component analysis [48,49,50] and the geographic detector [51,52,53,54]. However, the amount of related research is limited and uses relatively simple methods. At present, the measurement methods for the ecological effects of land-use transitions have become relatively mature, but the research scales are mostly at the national, provincial, municipal, and river basins levels, which lack research on urban agglomerations. In addition, the focus of existing research stresses the functional structure of PLES and the spatial-temporal evolution characteristics of eco-environmental effects. This lacks sufficient discussion on the driving mechanism and the relatively simple research methods of influencing factors, which leads to the incomplete and superficial discussion of results. Different factors impact the eco-environmental quality at different scales [25]. However, previous theoretical methods and model applications often ignore the spatial scale of the influencing factors. These factors can have an adverse impact on research accuracy.
The central and southern Liaoning urban agglomeration is a region in China that enjoyed an earlier industrial start and possesses a higher level of urbanization [55]. During the development process, land-use transitions in this area had a significant impact on the ecological environment. Therefore, it is of great practical significance to use this area as a research object. However, there is little related research on this area. In view of this deficiency, this paper takes the central and southern Liaoning urban agglomeration as the research object. Specifically, our objectives are to (1) quantify the spatiotemporal changes in land-use categories from the perspective of PLES in the central and southern Liaoning urban agglomeration between 1990 and 2018; (2) analyze the dynamics of eco-environmental quality by constructing an evaluation index, and then study the ecological contribution of land-use transitions; and (3) examine the degree and scale of impact of different influencing factors on the eco-environmental quality index using the multi-scale geographically weighted regression (MGWR) model. This can provide solid theoretical support for the coordinated development of production–living–ecological spaces in the central and southern Liaoning urban agglomeration and for the formulation of differentiated ecological protection policies at the regional level.

2. Materials and Methods
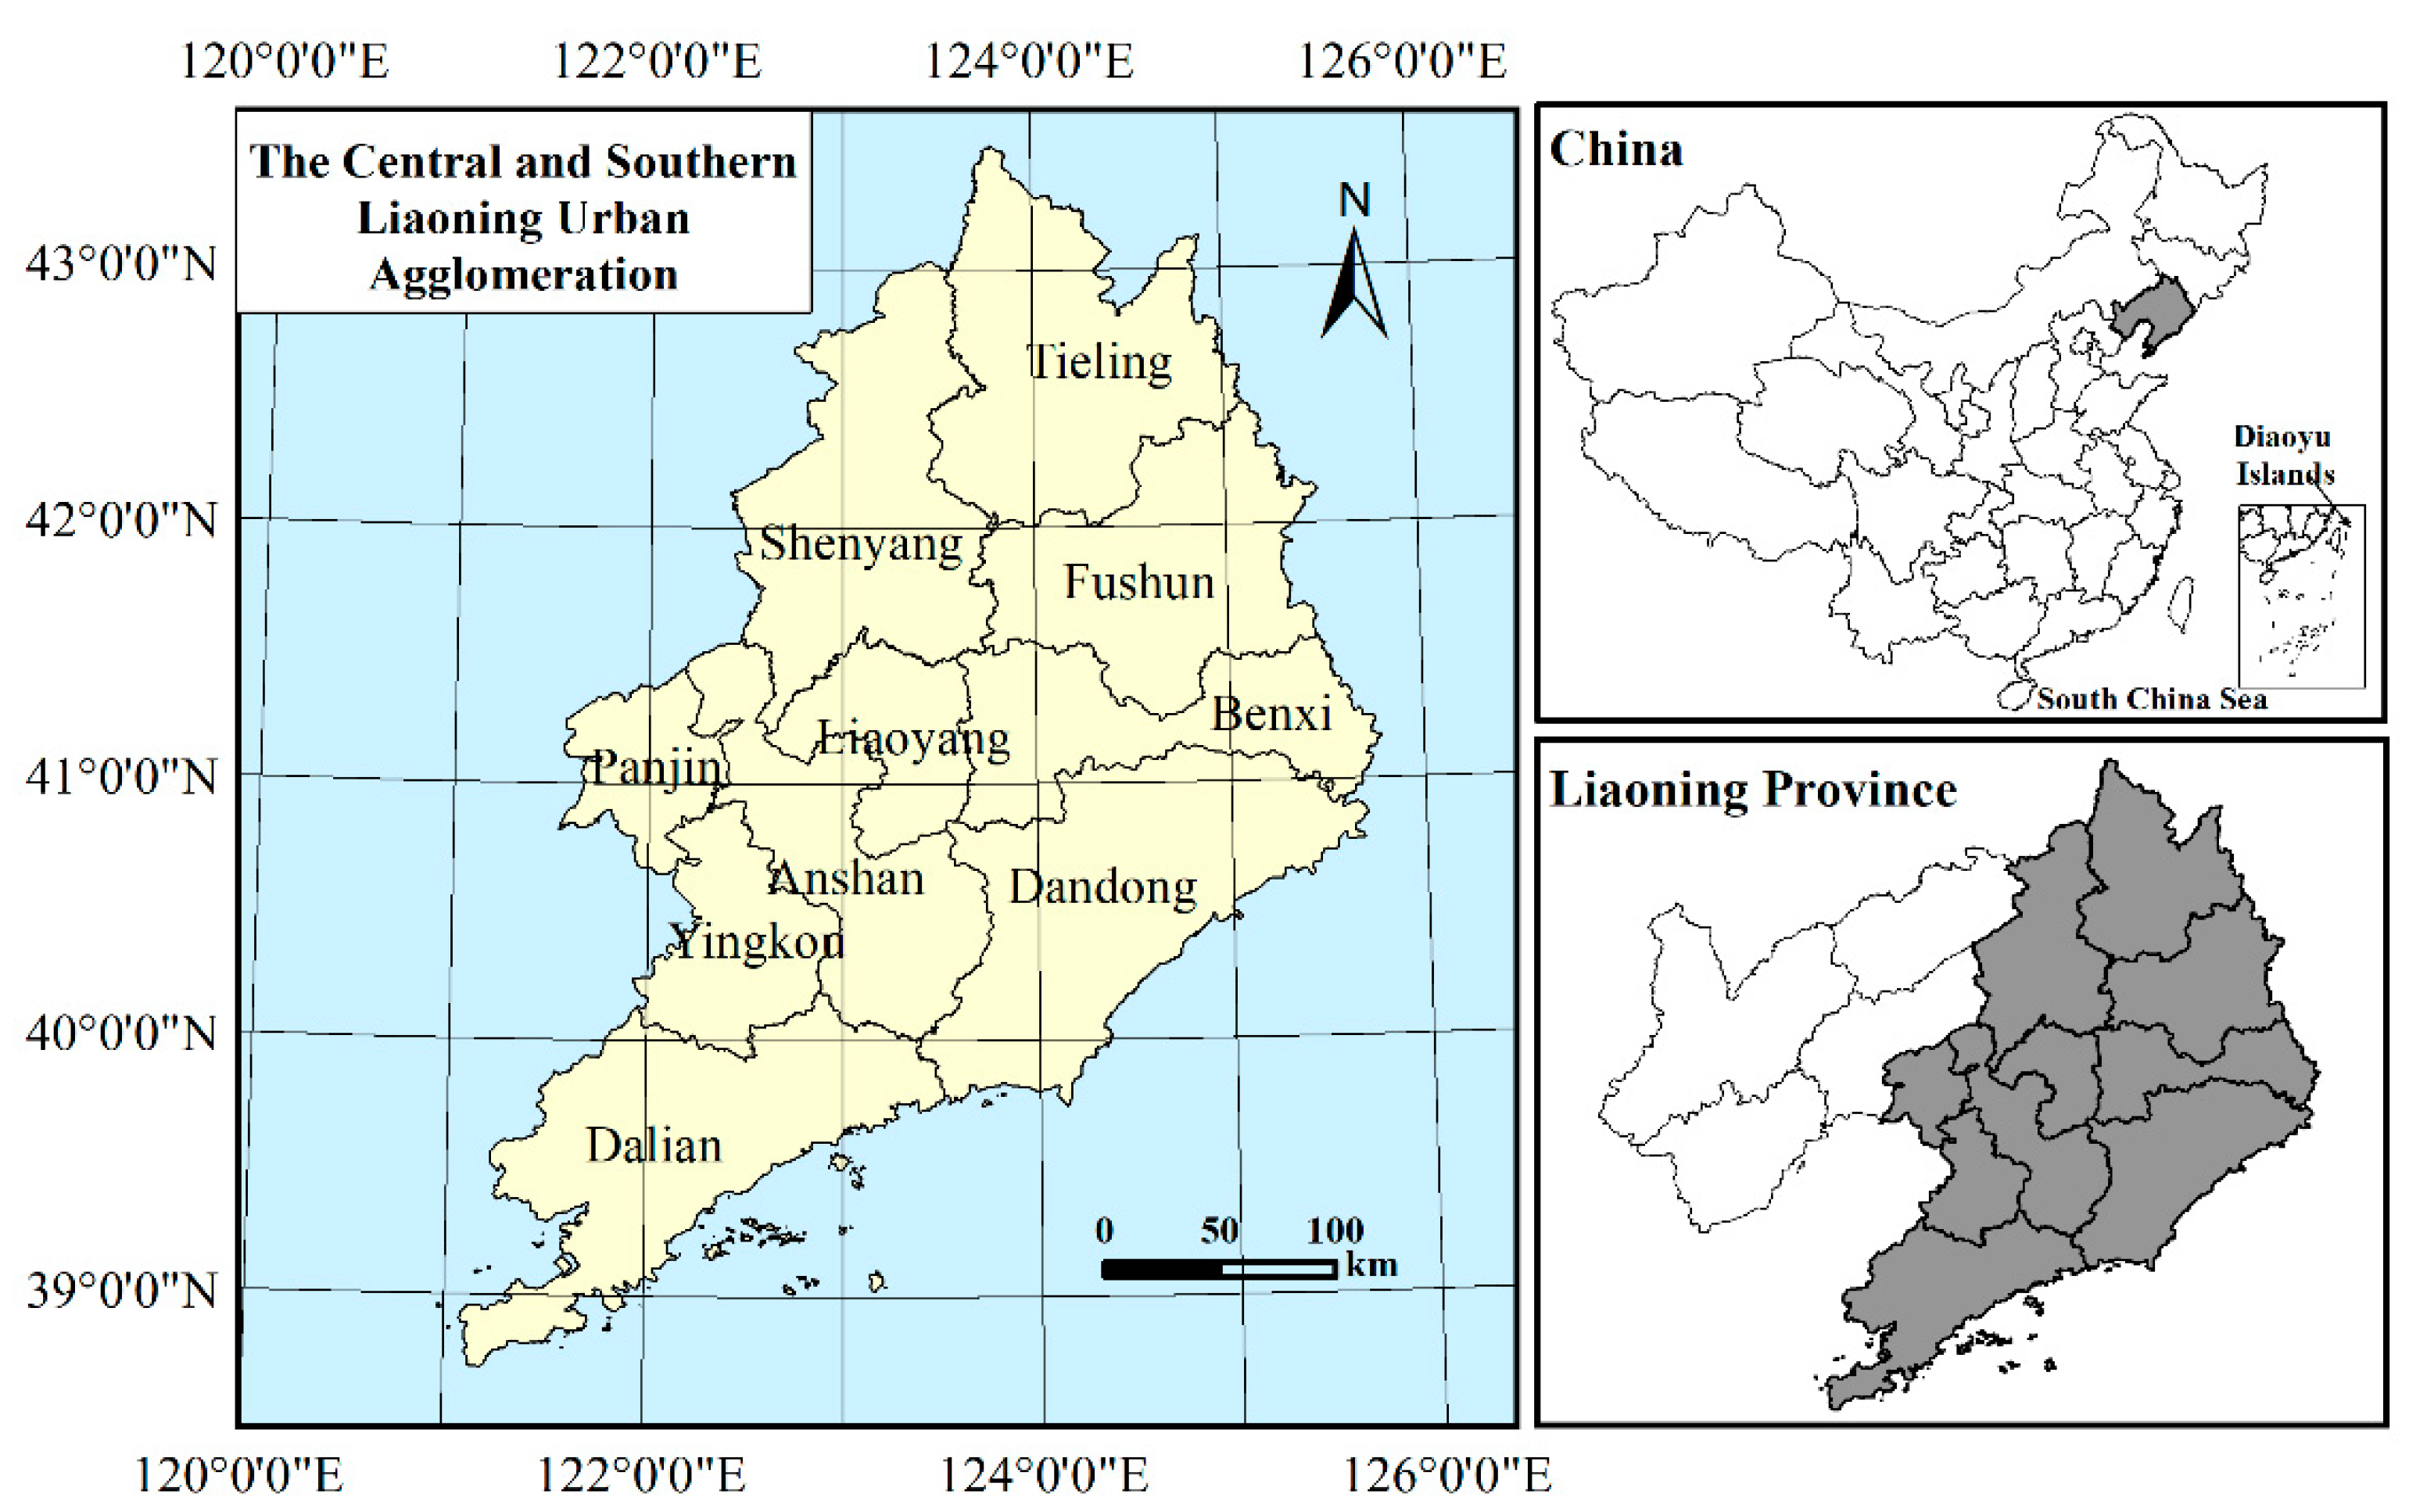
2.1. Study Area

The central and southern Liaoning urban agglomeration is located in the southern area of Northeast China along the coast of the Bohai Sea in Liaoning Province. Together with the Beijing–Tianjin–Hebei metropolitan circle and the Shandong Peninsula urban agglomeration, it forms the Bohai Rim Economic Circle. The distribution of landform types is mountainous and hilly in the eastern region, with the Liaohe Plain in the central and western regions. It is composed of the two deputy provincial-level cities of Shenyang and Dalian, as well as the eight prefecture-level cities of Anshan, Fushun, Benxi, Yingkou, Liaoyang, Tieling, Panjin and Dandong (Figure 1), covering an area of about 97,638 square kilometers [56]. As the largest heavy industry base in China, the central and southern Liaoning urban agglomeration is the main driver for economic growth and revitalization in Northeast China and plays a major role in promoting “Belt and Road” construction, boosting new urbanization and bolstering the overall revitalization of Northeast China [57,58]. Over the years, with the rapid advance of urbanization and large-scale industrialization, a substantial change has been seen in the dominant function of land use. The study of eco-environmental response patterns of land-use transitions and its influencing factors in the central and southern Liaoning urban agglomeration is of practical guiding significance in conducting spatial planning and control, as well as regional ecological and environmental protection, in the future.

2.2. Data Sources and Processing

The research data includes information such as land-use remote sensing monitoring data and spatial distribution network data sets for population and GDP. The descriptions of the data are shown in Table 1. The technical process of this paper is as follows: (1) The GIS reclassification method is used to reclassify remote sensing monitoring data land-use types and obtain a PLES land-use type diagram. (2) The ArcGIS 10.3 software area tabulation tool is used to perform a cross-analysis of the reclassified PLES land-use type diagram in the study area for the years 1990, 2000, 2010 and 2018. After that, the Excel pivot table function is used to handle the exported data and establish the land-use function transfer matrix. Based on this data, a Sankey diagram is drawn using Origin 2022. (3) The area weighting method is used to assign the eco-environmental quality value to secondary PLES land types. Then the GIS fishnet method is used to create 1 km × 1 km fishnet grids, and the zonal statistical tabulation method is used to count the PLES land-use types in each grid. Based on this, the eco-environmental quality value of each gird is calculated using the GIS map algebra method and the eco-environmental quality index of the study area is determined using the interpolation method. The ecological contribution rate is calculated in Excel using the above results. (4) GIS spatial analysis methods such as the proximity analysis method and zoning statistical tabulation method are adopted to obtain slope, land-use intensity and other independent variable indicators. Then the collinearity test is conducted for each indicator variable using SPSS 25.0 software to select the main influencing factors of the eco-environmental quality index. The ordinary least squares (OLS), GWR and MGWR models are used for the variable regression analysis based on the MGWR 2.2 software, and the results are compared.

2.3. Methodology

2.3.1. Establishment of the PLES Classification System

Land is a multi-functional complex in which production, living and ecological functions intersect and are unified. However, due to different land-use patterns, intensities and related users, land can exhibit the primary and secondary functions of the above three functions [63,64]. In other words, land often has a dominant function, despite its multiple functions. Based on the dominant function of land use, land can be divided into production, living and ecological spaces [65]. Production land refers to land for agricultural, industrial and commercial activities that is used to obtain products and supply functions. Living land refers to that which carries and protects human settlements, and ecological land is that which regulates, maintains and protects the function of ecological security. The construction of the PLES classification system is of great significance for measuring the coordination levels of regional development, identifying land-use conflicts and exploring sustainable development paths. At present, there are two main PLES classification methods: one based on land function index system scores [66] and the other based on land dominant functions [15]. According to the diversity of land functions, the former uses multi-source data to construct an evaluation index system, quantitatively calculates the PLE scores of the land and determines the PLES. The latter determines the dominant function of the land based on the subjective land-use intention of the actor, thereby dividing the land-use types into production space, living space and ecological space. For example, cultivated land is not only able to produce food, but also able to regulate the ecology. However, the main purpose of people’s use of cultivated land is to produce food. Therefore, it is classified as production land. This method is based on the dominant function of land use and directly combines land-use types. The operation is simple, and the classification standards are unified, which is more suitable for regional-scale analysis. Therefore, this paper refers to this method and combines the characteristics of land use in the study area to construct a classification system of PLES in the study area based on the principle of combining scientificity and practicability. In addition, with reference to the research results of Li et al. and Cui et al. [67,68], the eco-environmental quality value is determined for each secondary land type of the land-use classification system. The area weighting method is used to gain the eco-environmental quality value for each secondary land type of the dominant PLES land-use classification, as shown in the following table (Table 2).

2.3.2. PLES Transition Analysis

The functional structure transformation of production–living–ecological space (PLES) is achieved through the use of the Sankey diagram and land-use transfer matrix model. The Sankey diagram exhibits a visual display of the transition of land-use function structure in the form of energy flow. The transfer matrix refers to the arrangement of the transfer area of land-use changes in the form of a matrix, which not only demonstrates the specific quantitative change of land use, but also presents the PLES transfer direction. The mathematical formula is as follows:
S i j = | S 11 S 12 S 1 n S 21 S 22 S 2 n S n 1 S n 2 S n n |
In the formula, S represents the area, i and j represent the land-use types at the early and late stages of the study, and n represents the number of land-use types.

2.3.3. Eco-Environmental Quality Index

The eco-environmental quality index is based on the land-use cover change data interpreted by remote sensing, where the ecological quality and structural proportion of land use in PLES in the evaluation units are taken into full consideration to determine the eco-environmental quality [65,69]. The expression of the eco-environmental quality index of each evaluation unit is as follows:
E V i = i = 1 N A k i A k R i
In the equation, EVi represents the eco-environmental quality index of the i-th ecological unit; Ri refers to the eco-environmental quality index of the i-th type of land use; Aki is the area of the land-use type i in the k-th ecological unit; Ak is the area of the k-th ecological unit; and N indicates the number of land-use types. The study area is sampled at equal intervals using a 1 km square, and the regional eco-environmental quality index is obtained through the interpolation analysis of the eco-environmental quality index of each evaluation unit.

2.3.4. Ecological Contribution Rate of Land-Use Transitions

The ecological contribution rate of land-use transitions refers to any change in regional ecological quality triggered by the change of a land-use type [70], which can be expressed as:
L E I = ( L E t + 1 L E t ) L A   T A
In the formula, LEI represents the ecological contribution rate of the land-use function transition; LEt and LEt+1 are the ecological quality indexes of the land-use type at the early and late stages of the change reflected by a certain land-use change type, respectively; LA stands for the area of the change type; and TA represents the total area of the region.

2.3.5. Multi-Scale Geographically Weighted Regression (MGWR) Model

Compared with the GWR model, the MGWR model does not perform the regression analysis based on a fixed bandwidth but instead takes into account the scale differences of spatial heterogeneity of various influencing factors, allowing each variable to have its own different spatial smoothing level. This multi-bandwidth method can help establish a more realistic and useful spatial process model, thus making the regression results more stable. The specific bandwidth of each variable can be used as a measurable indicator of the spatial scale at which each spatial process acts [71]. The model calculation formula is as follows:
y i = β 0 ( u i , v i ) + j = 1 k β b w j ( u i , v i ) x i j + ε i
In the formula, yi represents the eco-environmental quality of the sample area i; bwj represents the bandwidth used by the j-th variable regression coefficient; βbwj(ui,vi) represents the regression coefficient of the j-th variable of the sample area i; and β0(ui,vi) and εi represent the intercept and error term of the model at sample area i, respectively. A Gaussian function and AICc criterion are adopted for this model.
Each regression coefficient βbwj of the MGWR model is obtained based on the local regression, and its bandwidth is specific. This is the greatest difference between the MGWR model and the GWR model. A commonly used Gaussian Bi-square kernel function and AICc criterion are adopted for this model. There are generally two options for defining the algorithm used to select an optimal bandwidth when calibrating the MGWR model: (1) golden-section or (2) interval search. The golden-section search method is used to select an optimal bandwidth in the model. The algorithm finds the optimal value for the bandwidth by successively narrowing the range of values inside which the optimal value exists and comparing the optimization score of the model for each. It then returns the value that has the lowest score [72].
The eco-environmental quality is subject to numerous influencing factors such as natural, socio-economic and policy factors [53]. Natural factors constitute the background for the formation of the ecological environment quality pattern, while socio-economic factors are the main factors driving its changes [73,74]. Therefore, this paper selects nine indicators as influencing factors from the two aspects of natural and socio-economic factors. Due to the difficulty of quantifying certain influencing factors, such as policy factors, these factors are not included in the MGWR model. The selection and calculation methods of indicators are shown below (Table 3). Within natural environment factors, topographic and climatic factors have a significant impact on land-use change in large-scale and long-term sequences. They are also the decisive factors for the formation and evolution of the temporal-spatial pattern of eco-environmental quality [75]. Therefore, this study uses relief and slope to characterize the impact of terrain factors on the eco-environmental quality. Annual average precipitation and annual average temperature were selected to characterize the driving influence of climatic factors on the evolution of the eco-environmental quality. Population and economic development are the most dynamic influencing factors in the evolution of eco-environmental quality [76]. Within a certain range, an increase in population and economic level will be accompanied by dramatic changes in land use, which will affect eco-environmental quality. Therefore, this study selects population density and GDP to reflect the impact of socio-economic activities. In addition, land-use changes are direct influencing factors for the evolution of eco-environmental quality. Land-use intensity and diversity can effectively reflect the degree of human activity disturbance to land use [77]. The location factor is also an important factor affecting the evolution of eco-environmental quality. In this study, the distance from the nearest prefecture-level city is selected to represent the location factor. In view of the small number of prefecture-level cities and large number of townships in the study area, as well as the difficulty of data collection, 72 counties (districts) are used as empirical units to study the influencing factors of eco-environmental quality. Due to the convergence of the effects and difficulty of data collection, only the year 2010 is used to study the influencing factors of eco-environmental quality.

3. Results

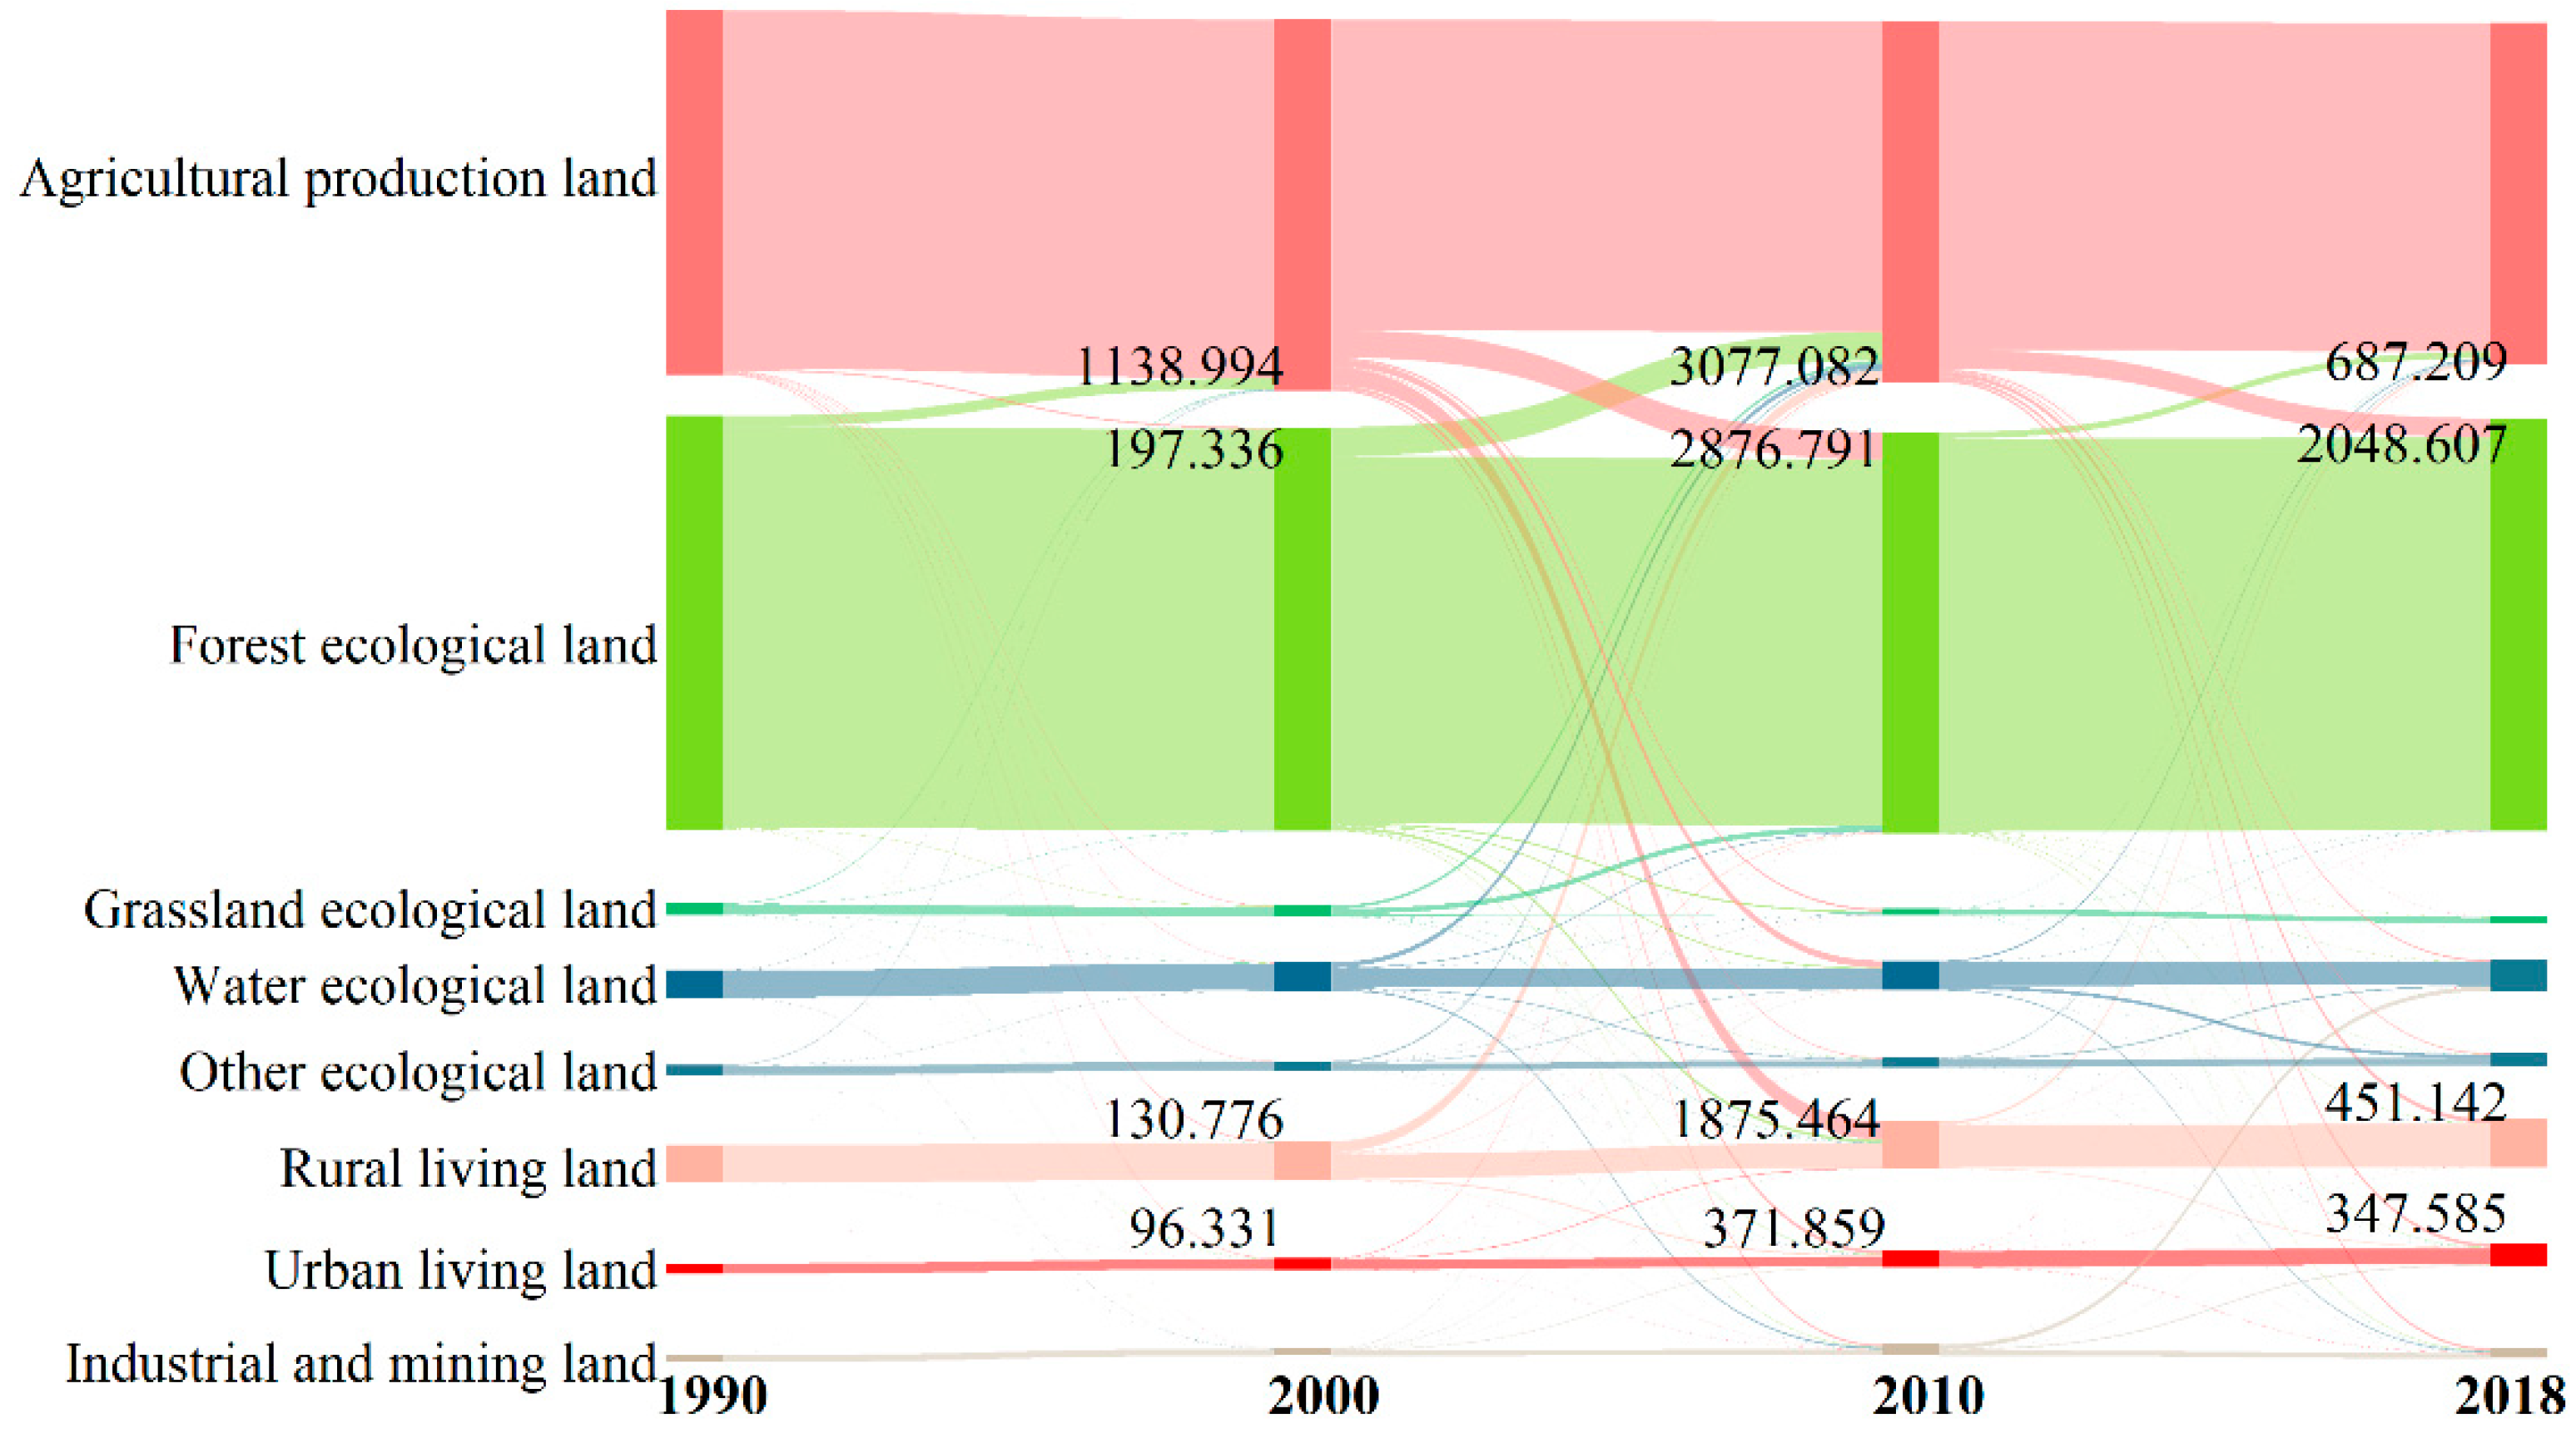
3.1. Analysis of PLES Land-Use Transition Characteristics

3.1.1. Spatiotemporal Pattern Characteristics of Land-Use Transition

From 1990 to 2018, the ecological land in the central and southern Liaoning urban agglomeration demonstrated the widest distribution. It was concentrated in the eastern Changbai Mountains and the central and southern region of the province, representing an increase of 37.353 km2. The living land was scattered in the central and southern coastal areas and continued to expand, showing an increase of 2360.472 km2 over the 28-year period. The production land was mainly distributed in the central and western Liaohe Plain and southern coastal areas and presented a declining trend, dropping by 2147.784 km2 during the study period. It also presented a spatial distribution characteristic that was dense in the northwest and sparse in the southeast (Figure 2, Table 4).
According to the secondary classifications, the forest ecological land, urban living land and agricultural production land presented a wider distribution, which basically has the same spatial distribution pattern as the corresponding first-level land types. In general, the ecological protection projects have had a significant impact on the land-use transition of the central and southern Liaoning urban agglomeration. In the central and southern Liaoning urban agglomeration in the 1990s, there was the Northeast Phenomenon, which featured stagnant urban development and slow urban and rural living land growth [78]. After 2000, the Northeast Revitalization Strategy and the policy of returning farmland to forests have contributed to a remarkable increase in urban and rural living land, a significant decrease of 3256.982 km2 in agricultural production land and a gradual recovery in forest ecological land [79].

3.1.2. Transformation Characteristics of Land-Use Function Structure

In order to further explore the quantity and direction of the mutual transition between the secondary land types in the production–living–ecological space, the land-use transfer matrix (Table 5) was established, and a Sankey diagram was drawn (Figure 3). According to the results, from 1990 to 2018, the amount of agricultural production land converted into forest ecological land ranked first, with a total area of 3847.734 km2, followed by the land changed into urban and rural living land. The largest transfer area was agricultural production land transferred from forest ecological land, totaling 3599.112 km2.
From 1990 to 2000, the increased area of agricultural production land mainly came from forest ecological land, which shows that there was serious deforestation and reclamation in the central and southern Liaoning urban agglomeration during this period. From 2000 to 2018, the scale of mutual conversion between forest ecological land and agricultural production land was the largest, and the phenomenon of simultaneous governance and destruction was present. The gradual implementation of ecological protection projects has helped to reverse the trend of decreasing forest land. The area of agricultural production land transferred into forest ecological land was gradually greater than the occupation area of agricultural production land. This has triggered a positive effect on ecological functions such as wind and sand control and water conservation. However, the region is still confronted with the conflict between food security and ecological protection. The area of agricultural production land converted into urban and rural living land was the second largest. This means that the implementation of the Northeast Revitalization Strategy, accelerated urbanization, and large-scale urban and rural construction have contributed to a remarkable decline in cultivated land. Although land consolidation activities are continuously conducted to achieve a dynamic balance in the total area of agricultural production land, reversing the overall decreasing trend in the total area of cultivated land remains a difficult task [80].

3.2. Eco-Environmental Effects of PLES Land-Use Transitions

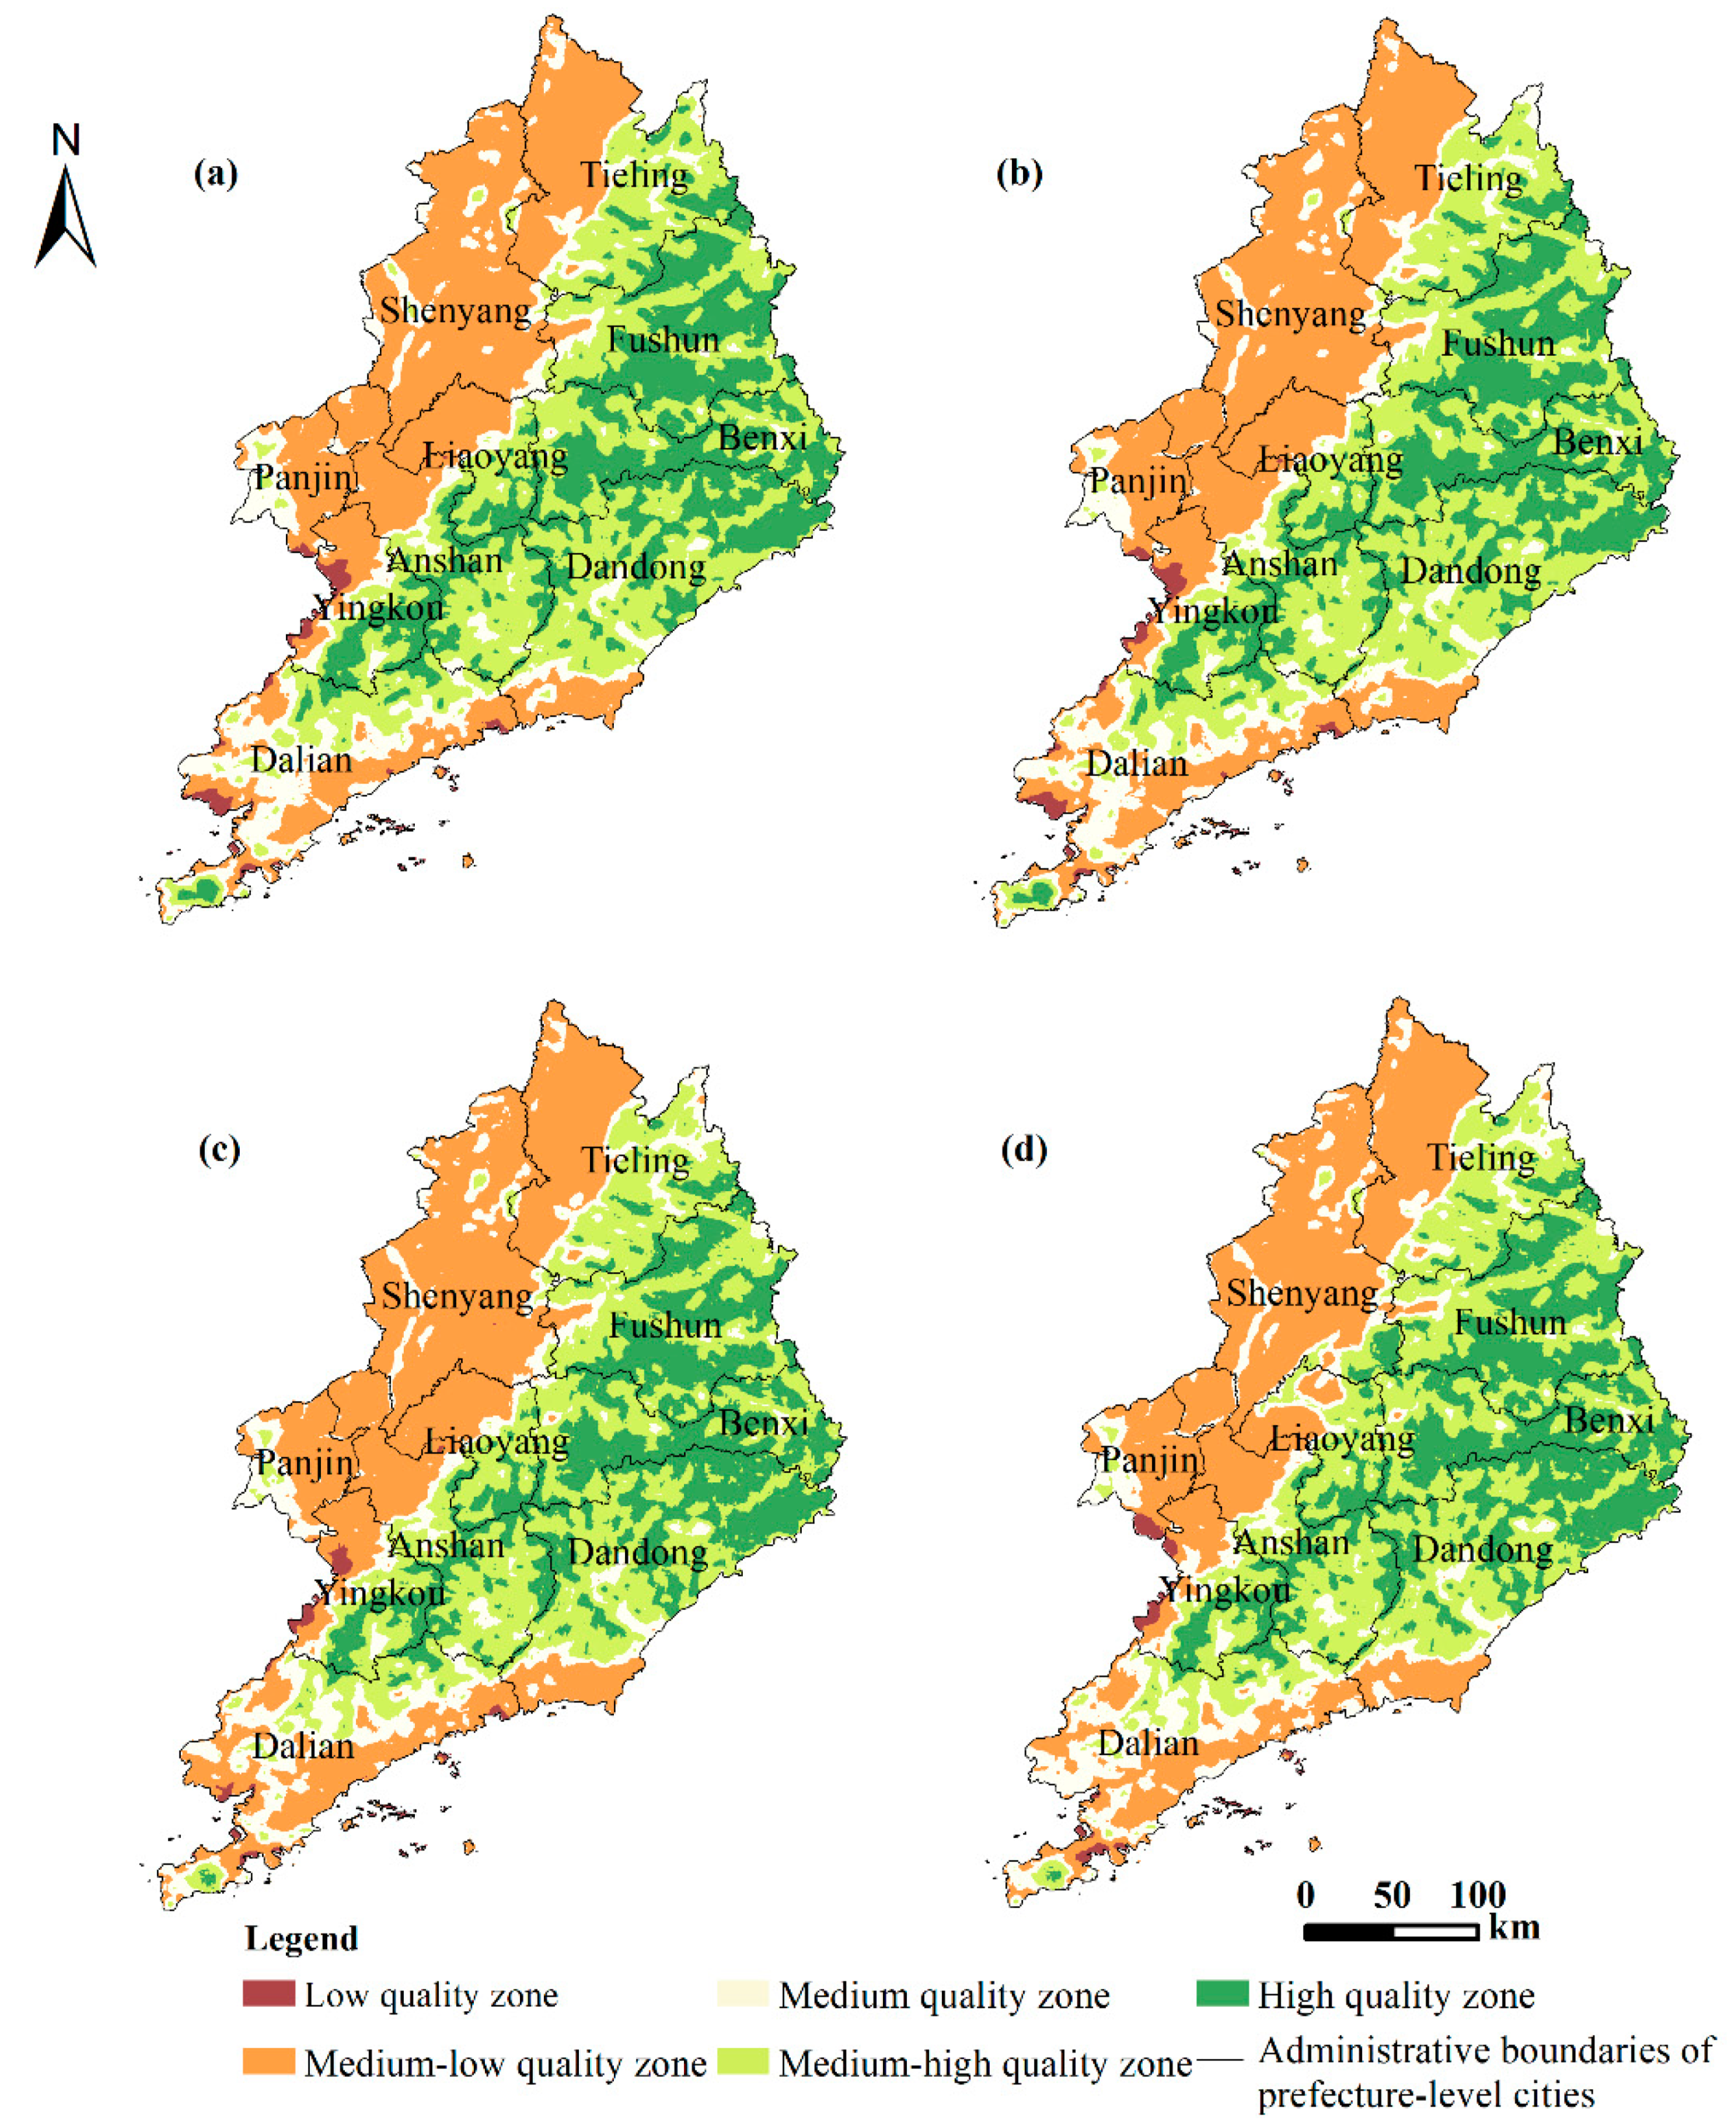
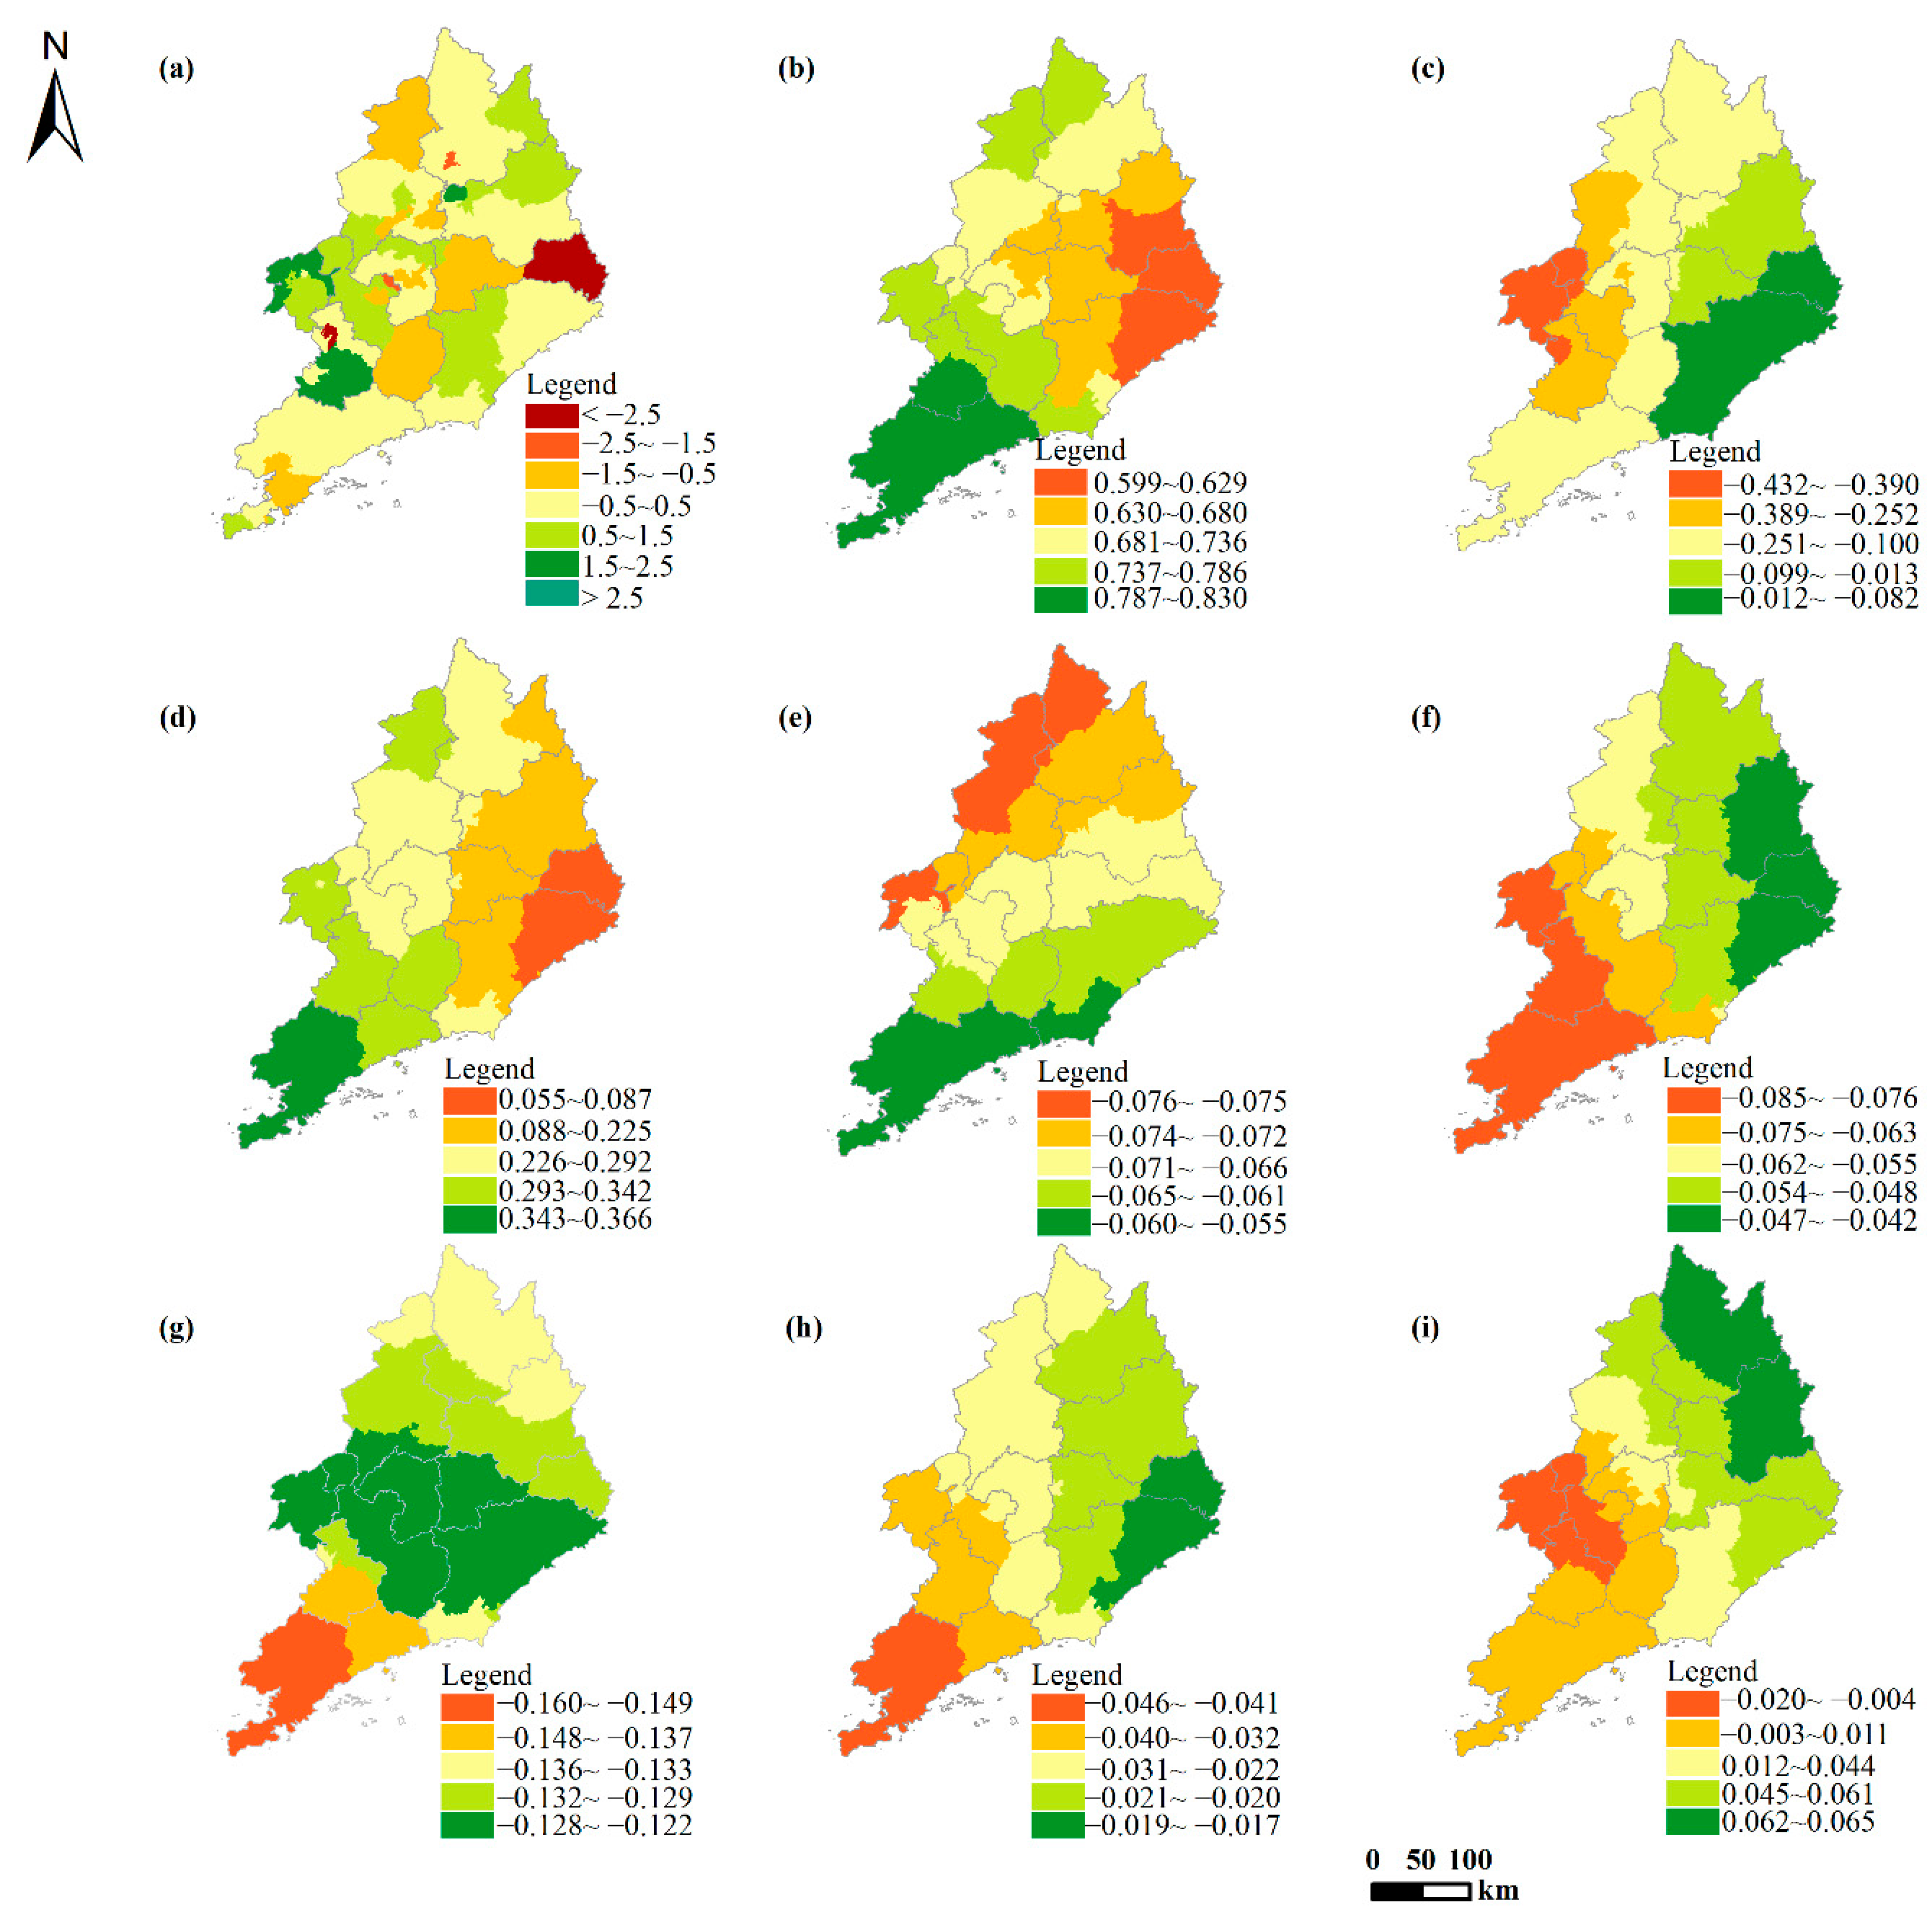
3.2.1. Spatial Distribution Characteristics of the Eco-Environmental Quality Index

From 1990 to 2018, the eco-environmental quality index in the study area presented a trend of first decreasing and then increasing (Table 6). The eco-environmental quality index is marked with significant spatial differentiation, depicting the distribution characteristics of being high in the east and low in the west. The cities of Benxi, Fushun and Dandong in the east have played a core role in forming high-quality eco-environmental agglomerations. The cities of Shenyang and Dalian in the west feature a relatively higher level of urbanization, where the rapid expansion of construction land during urban expansion has had a serious impact on the regional eco-environmental quality. As a result, medium-low quality agglomerations have formed along the Shenyang-Dalian axis (Figure 4).

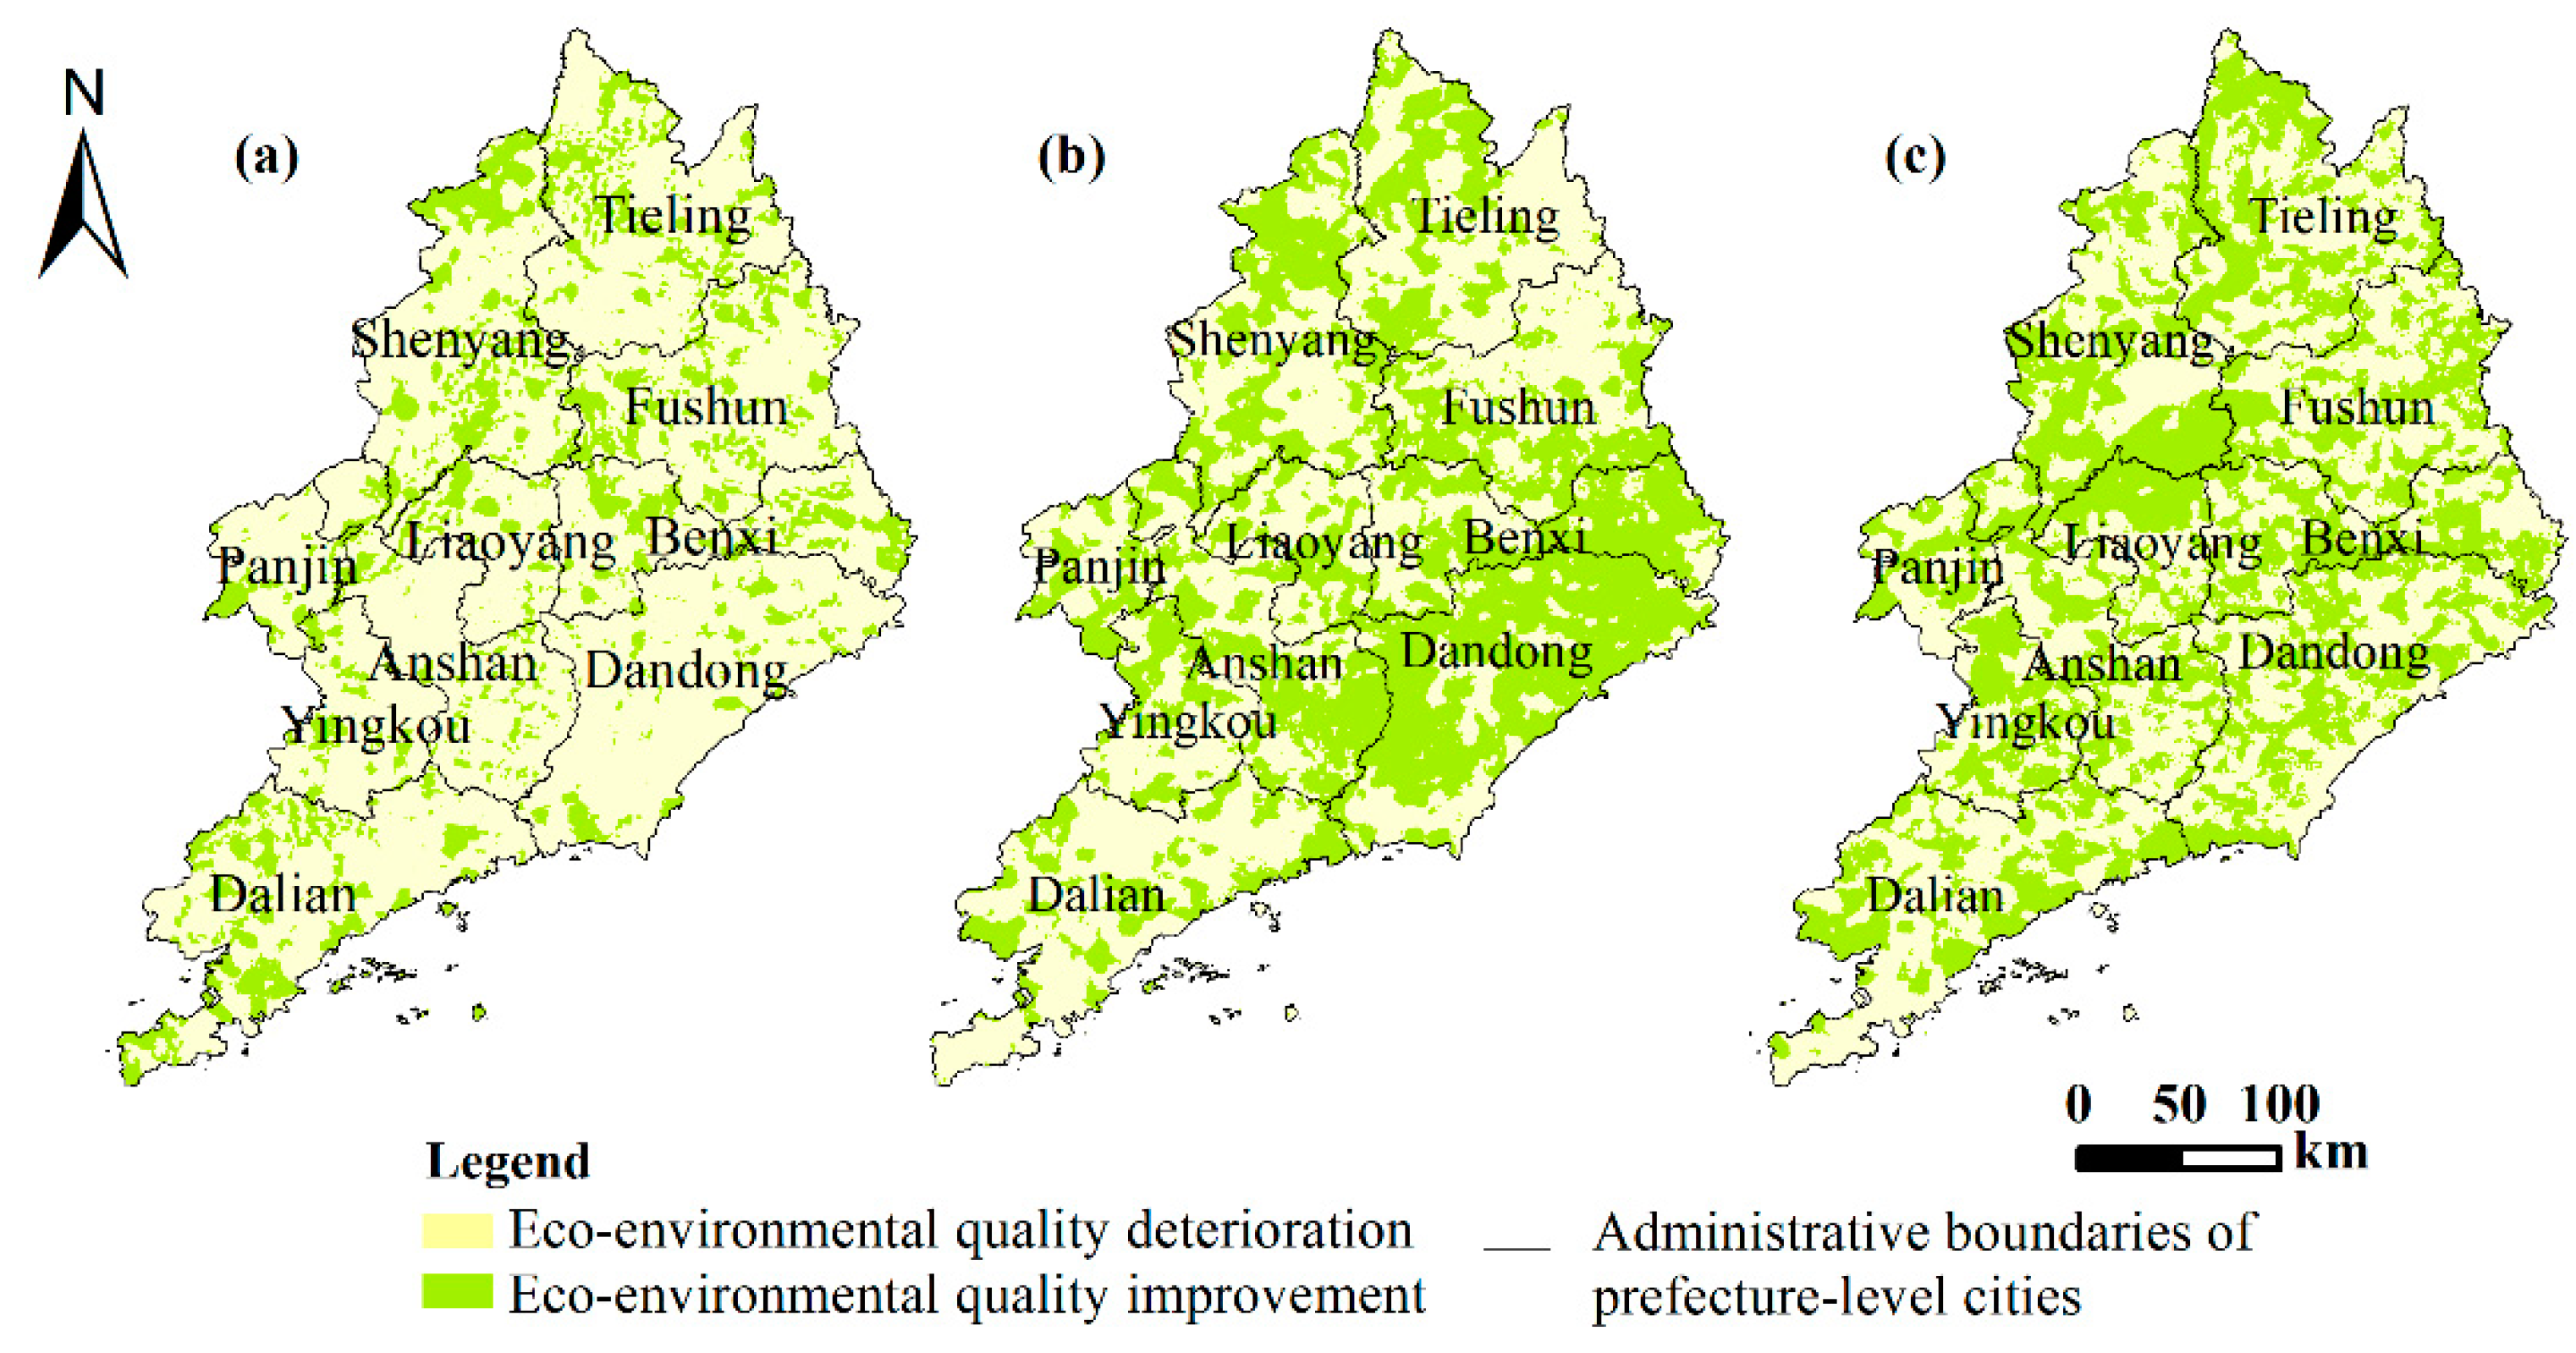
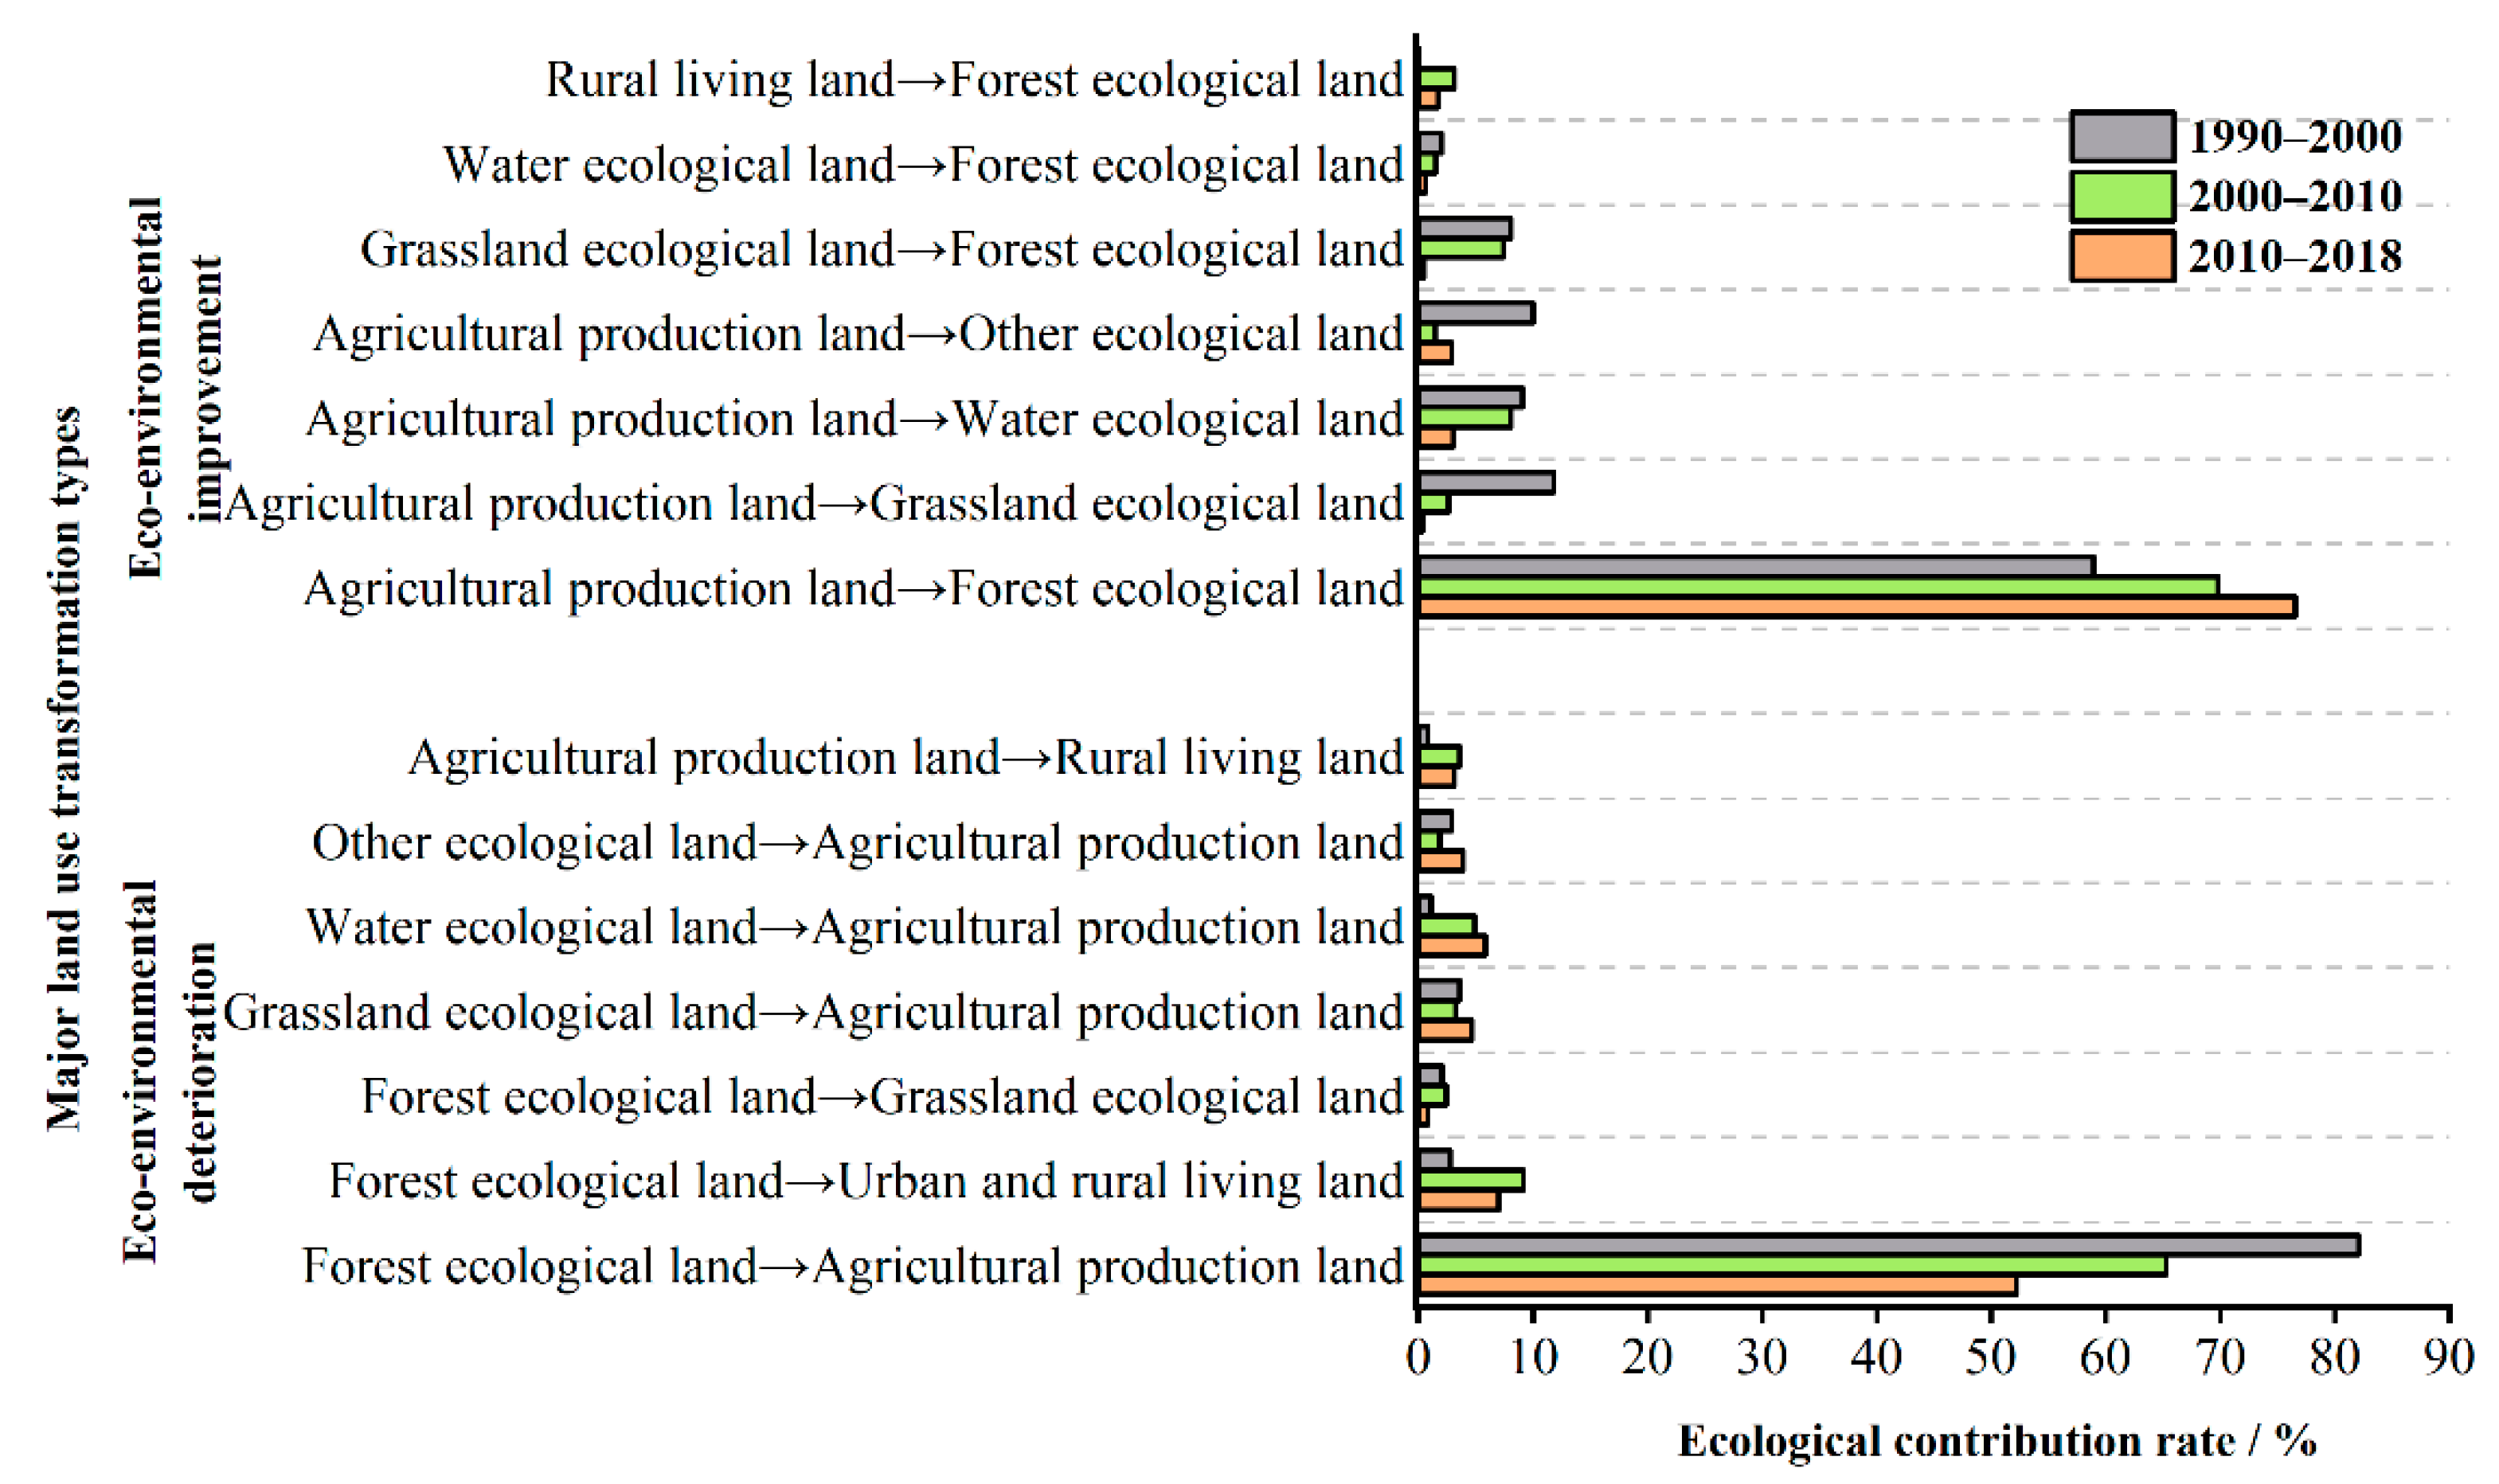
3.2.2. Ecological Contribution Rate Generating an Impact on the Eco-Environmental Quality Index

In order to reveal the impact of each land-use transition on the regional eco-environmental quality, changes were measured in the eco-environmental quality index during the three time periods (Figure 5). The ecological contribution rate of each land-use transition was also measured (Figure 6). According to the results, from 1990 to 2018, there was a gradual increase in the area with an improved ecological environment. The improvement of the ecological environment was mainly due to the gradual implementation of the returning farmland to forest policy. In addition, the proportion of the ecological contribution rate of agricultural production land converted to forest ecological land continued to increase, peaking at 76.497%. After the Northeast Revitalization Strategy was introduced in 2004, the ecological environment of land along the Shenyang-Dalian development axis continued to deteriorate due to rapid urban expansion. The ecological contribution ratio of forest ecological land converted to urban and rural living land climbed from 2.811% in the previous period to 9.155% in the current period. In general, the ecological environment of the central and southern Liaoning urban agglomeration first deteriorated and then improved, but the overall eco-environmental quality in 2018 remained worse than that of 1990. Therefore, the protection of the ecological environment should not be ignored when relevant policies and plans are developed in the central and southern Liaoning urban agglomeration. Additional efforts should be made to adjust the structure and layout of land use in a timely manner for the sake of the continuous improvement of the ecological environment. In addition, the strictest cultivated land protection system should be implemented to prevent a continuous or substantial decrease in the area of cultivated land.

3.3. Analysis of Influencing Factors on the Eco-Environmental Quality Index

3.3.1. Identification of Influencing Factors and the Comparative Analysis of Models

Firstly, a global spatial autocorrelation analysis was conducted for the county (district) level eco-environmental quality in the central and southern Liaoning urban agglomeration. At the 1% significance level, Moran’s I index was 0.584, and the Z value of the normal statistic was 3.153, far beyond the critical value of 2.580. This shows that there is a significant spatial autocorrelation in the county (district) level eco-environmental quality index for the central and southern Liaoning urban agglomeration. Secondly, to avoid a deviation in the estimated results caused by a mutual influence between the indicators, the collinearity test was conducted for each indicator variable. The test results show that the only factor greater than five was the variance inflation factor (VIF) value of the relief index, which was removed. There was no significant cross collinearity between other variables that could be used for the model fitting analysis. Therefore, the OLS, GWR and MGWR models were used for the variable analysis based on the MGWR 2.2 software, and the results were compared as follows (Table 7). Table 7 indicates that the MGWR goodness-of-fit R2 is higher than that of the classic GWR and OLS models, and the Akaike information criterion (AICc) value and residual squared are much lower. This shows that the fitting results of the MGWR model in this study are better than those of the first two models.

3.3.2. Scale Analysis of Influencing Factors Based on the MGWR Model

The bandwidth of the variables in the GWR model is fixed and can only reflect the average value of each variable’s action scale. The bandwidth of each variable in the MGWR model is variable and can directly reflect the difference in the action scale of different variables [81]. This means that the influence of the independent variable on the ecological environment quality index is basically the same within the bandwidth range, and once the scale is exceeded, the regression coefficient will change drastically.
The bandwidths of the respective variables in the regression results of the MGWR and GWR models are summarized below (Table 8). It can be seen from Table 8 that the optimal bandwidth of the variables in the GWR model is 63.000. However, the optimal bandwidth of each variable in the MGWR model differs from variable to variable, indicating that there are certain differences in the effect scales of different influencing factors on each eco-environmental quality index in the study area. The bandwidth of variables in natural environment factors is generally slightly lower than that of variables in socio-economic factors, indicating that the regression coefficients of variables in socio-economic factors are relatively more stable in space. The minimum action scale of annual average precipitation is 43.000, indicating that the eco-environmental quality index is more sensitive to annual average precipitation and will vary greatly in space with the changes in annual average precipitation. In general, the action scales of all variables are small, indicating that there is obvious spatial heterogeneity in the relationship and structure of the independent variables affecting the eco-environmental quality index in the central and southern Liaoning urban agglomeration.

3.3.3. Regression Coefficients Analysis of Influencing Factors Based on the MGWR Model

The average values of the regression coefficients of the respective variables are summarized in the regression results of the MGWR model (Table 9). The ArcGIS 10.3 software natural breakpoint method is used to visualize the standardized residuals and the coefficients of the respective variables (Figure 7). The results indicate that the range of the standardized residual values stands between (−2.5, 2.5) and that the model has a better general effect (Figure 7a). As for the influencing factors on eco-environmental quality, the descending order of the factors is the slope, annual average precipitation, annual average temperature, land-use intensity, population density, GDP, land-use diversity and distance from the nearest prefecture-level city (Table 9).
From the perspective of spatial distribution, the eight independent variables show significant spatial differences in the degree of impact on the eco-environmental quality index in the study area. The absolute value distribution of the regression coefficients of the slope, annual average temperature and annual average precipitation presents a circular increase pattern from east to west (Figure 7b–d). Those areas with a lower degree of slope impact, annual average temperature and annual average precipitation basically have the same distribution pattern as the eastern dense forest area. The degree of impact of GDP, land-use intensity and land-use diversity on eco-environmental quality in the southern coastal area is higher than that in the other areas. This is due to the fact that the southern coastal area has a relatively developed economy, with a higher level of land development and a higher degree of disturbance by human activities on land. These factors are more likely to boost the formation of production and living spaces, thereby worsening the quality of the ecological environment (Figure 7f–h). The absolute value distribution of the regression coefficient of population density presents a circular increase pattern from southeast to northwest, which indicates that the impact degree of population density on the quality of the ecological environment in the northwest is higher than in the southeast. This is due to the fact that the natural conditions of Shenyang and Panjin in the northwest are worse than in other cities in Liaoning Province. This then leads to a lower regional ecological environment recovery capability compared with the eastern region and a higher sensitivity to human disturbance (Figure 7e) [82].

4. Discussion

4.1. Research Significance

Previous studies have focused on the measurement methods of different ecological effects of land-use transitions but failed to connect land-use transitions and the development stage of regional transitions [17]. Land use is divided according to production, living and ecological spaces, which can connect land-use transformation with regional transformation and development. This division method has become a research area that coincides with the three-pillar concept of sustainable land use: production, living and ecology [34]. This serves as an important entry point for land-use transformation. The urban agglomeration in central and southern Liaoning is an important heavy industry base and major grain-producing area in China [57]. Due to the influence of policies and its own positioning, it has undergone a number of developments such as the Northeast Phenomenon, Northeast Revitalization, and New Northeast Phenomenon in the past 30 years [80]. This study found that with the different development in urbanization and economy, the spatial structure of production-living-ecology in the study area has also undergone significant changes. Its transition characteristics match up with different development stages. At the same time, this leads to differences in the spatial and temporal changes in the regional ecological environment quality. However, during the study period, the overall ecological environment quality of the study area changed little. This was due to the two trends of deterioration and improvement, which offset each other to a certain extent. The mutual transformation of agricultural production land, forest land, ecological land and urban and rural residential land is the main conflict of land use in this region, threatening both food security and ecological security. At different stages of development, the different transformation structures among the three led to changes in the quality of the ecological environment. In the future, during the formulation of territorial space optimization strategies and planning, it is necessary to comprehensively consider the social development stage, regional development goal orientation and ecological protection principles [80]. The results of this paper based on the PLES concept demonstrate that the characteristics of land-use transitions in the study area in each period are compatible with the regional economic and social transition stages. This causes changes in the quality of the ecological environment and shows significant policy-led characteristics that are important for regional policy regulation. It is of great significance to explore sustainable development paths. This further verifies the advantages and necessity of research from this perspective.
Previous studies have placed a greater focus on the temporal and spatial evolution characteristics of land-use transitions and their eco-environmental effects [4,48,52]. However, there is insufficient discussion on the influencing factors of eco-environmental effects, and the research methods are singular and lack innovation. Moreover, the quality of the ecological environment is usually determined by the spatial processes of multiple influencing factors at different scales, and the scale analysis of the influencing factors is particularly important [25]. However, the previous theoretical methods and model applications often ignore the spatial scale of the influencing factors [51,52,53,54]. This, in turn, will cause the regression results to be unstable. In this paper, the MGWR model is used to analyze the scale and degree of influence of different variables on the quality of the ecological environment to compensate for the shortcomings in this research field. The research results show that the quality of the ecological environment has an obvious spatial correlation, and there are differences in the scale and degree of influence of different variables on the quality of the ecological environment. As far as the scale of action is concerned, the scale of action of natural environment elements on the quality of the ecological environment is smaller because the natural environment within the study area is complex [82]. The degree of influence of natural environment elements on the quality of the ecological environment is also more spatially heterogeneous. In terms of the degree of influence, the slope has the greatest positive impact on the eco-environmental quality index. This is because natural factors such as slope often determine the basic pattern of regional land use, which in turn affects the quality of the ecological environment [54]. The Liaohe Plain, with gentle slopes in the central and western parts of the study area, is easy to develop into production and living land, and the eco-environmental quality index is low. In contrast, in the mountainous areas with steeper slopes in the east, the local climate is complex, and it is easy to form woodland ecological land [46]. As a result, the eco-environmental quality index is relatively high. In addition to the natural environmental factors, the land-use intensity has the greatest impact on the eco-environmental quality index. Among them, the impact of land-use intensity on the southern coastal areas is higher than in other areas. This is because excessive land-use intensity is more likely to lead to the degradation of coastal tidal flat wetlands, which in turn affects the quality of the ecological environment [76]. In the future regulation of territorial space, attention should be paid to regional differences in the improvement of ecological protection policies.
The research in this paper applies the MGWR model with statistical inference to the empirical research on the influencing factors of eco-environmental effects. The research results show that the MGWR model results are greatly improved compared with the previous GWR and OLS models. In addition, unlike the GWR model, the MGWR model can reflect the scale of the impact of different variables on the dependent variable, making the regression results more reliable. The research in this paper demonstrates that MGWR is more suitable for related research on the influencing factors of eco-environmental quality, proving a theoretical and empirical basis for the further application of the MGWR model in this field.

4.2. Limiting Factors

This paper still contains some deficiencies, which will be further studied, including the following:
(1)
This paper conducts an analysis of the effects of natural environmental factors and socio-economic factors in identifying the influencing factors of eco-environmental quality. Due to the availability of data and the limited measurement of indicators, this paper lacks in-depth discussions on the invisible forms of land use (soil quality, price, etc.) and non-quantifiable policy factors [83], which may lead to some deviation in the model. In future studies, the impact of natural factors, socio-economic factors, policy factors and dominant and invisible changes in the forms of land use on eco-environmental quality shall be taken into full consideration to enhance the research accuracy;
(2)
Due to the huge computational volume of the MGWR model, regression analysis cannot be performed at a scale of 1 km spatial resolution of the data. In this paper, counties (districts) are taken as the research unit for the influencing factors of eco-environmental quality, and the selected sample size is relatively smaller, which may result in some errors [81,84]. It is hoped that the improvement of computational methods and computer performance in the future can allow regression analysis to be conducted on a more refined scale.

5. Conclusions

From the perspective of production–living–ecological spaces, this paper takes the remote sensing monitoring data of land use status and adopts such methods as the land use transfer matrix, the eco-environmental quality index, and the ecological contribution rate of land-use transitions to quantitatively analyze the spatiotemporal evolution characteristics and ecological environment effects of land-use transitions in the central and southern Liaoning urban agglomeration from 1990 to 2018. It also identifies the influencing factors of the eco-environmental effect and the spatial differentiation law of the effect in the study area through the use of the MGWR model. The main conclusions reached are as follows:
(1)
From 1990 to 2018, a continuous increase was seen in the ecological land and living land in the central and southern Liaoning urban agglomeration, while a constant decrease was found in production land, with a sharp decline of 2147.784 km2. According to the secondary classification, the scale of mutual conversion between agricultural production land and forest ecological land was the largest during the study period. Ecological land experienced a shift from slow land degradation to restoration and improvement during the period. However, the region was still confronted with a conflict between food security and ecological protection. The characteristics of land-use transitions in each period are in line with the stage of regional economic and social transformation, presenting prominent policy-dominated characteristics;
(2)
During the study period, the eco-environmental quality index of the central and southern Liaoning urban agglomeration demonstrated significant spatial differentiation, with the distribution characteristics being high in the east and low in the west. The cities of Benxi, Fushun and Dandong in the east created a core that formed high-quality eco-environmental agglomerations. The areas expanded and spread along the Shenyang-Dalian axis to form medium-low quality agglomerations. The overall ecological environment of the region presented the trend of deterioration followed by improvement, but the ending value of the index was still lower than the starting value. The encroachment of agricultural production land and urban and rural living land on forest ecological land is the main contributor to the deterioration of eco-environmental quality during the study period.
(3)
Compared with the GWR model and the OLS model, remarkable advancement can be found in the MGWR model, which is more suitable for research on influencing factors of eco-environmental quality. Regarding these factors, the descending order of the factors is as follows: slope, annual average precipitation, annual average temperature, land-use intensity, population density, GDP, land-use diversity and distance from the nearest prefecture-level city. Different factors have significant spatial differences in the degree of impact and action scale. The impact of population density on the quality of the ecological environment in the northwest is larger than in the southeast. Additionally, the impact of factors such as GDP, land-use intensity and land-use diversity on the eco-environmental quality in the southern coastal area is greater than in other regions.

Author Contributions

Conceptualization, N.H. and R.P.; methodology, N.H.; software, N.H.; validation, N.H., J.Z., H.Y., D.S. and R.P.; formal analysis, N.H.; data curation, R.P. and H.Y.; writing—original draft preparation, N.H.; writing—review and editing, R.P., D.S. and H.Y.; visualization, N.H. All authors have read and agreed to the published version of the manuscript.

Funding

This research received no external funding.

Institutional Review Board Statement

Not applicable.

Informed Consent Statement

Not applicable.

Data Availability Statement

The data presented in this study are available on request from the author.

Conflicts of Interest

The authors declare no conflict of interest.

References

  1. Newbold, T.; Hudson, L.N.; Arnell, A.P.; Contu, S.; De Palma, A.; Ferrier, S.; Hill, S.L.L.; Hoskins, A.J.; Lysenko, I.; Phillips, H.R.P.; et al. Has land use pushed terrestrial biodiversity beyond the planetary boundary? A global assessment. Science 2016, 353, 288–291. [Google Scholar] [CrossRef]
  2. Newbold, T.; Hudson, L.N.; Hill, S.L.L.; Contu, S.; Lysenko, I.; Senior, R.A.; Boerger, L.; Bennett, D.J.; Choimes, A.; Collen, B.; et al. Global effects of land use on local terrestrial biodiversity. Nature 2015, 520, 45. [Google Scholar] [CrossRef] [Green Version]
  3. Mueller, M.F.; Penny, G.; Niles, M.T.; Ricciardi, V.; Chiarelli, D.D.; Davis, K.F.; Dell’Angelo, J.; D’Odorico, P.; Rosa, L.; Rulli, M.C.; et al. Impact of transnational land acquisitions on local food security and dietary diversity. Proc. Natl. Acad. Sci. USA 2021, 118, e2020535118. [Google Scholar] [CrossRef]
  4. Foley, J.A.; Ramankutty, N.; Brauman, K.A.; Cassidy, E.S.; Gerber, J.S.; Johnston, M.; Mueller, N.D.; O’Connell, C.; Ray, D.K.; West, P.C.; et al. Solutions for a cultivated planet. Nature 2011, 478, 337–342. [Google Scholar] [CrossRef] [Green Version]
  5. Yang, D.; Luan, W.; Yang, J.; Xue, B.; Zhang, X.; Wang, H.; Pian, F. The contribution of data-driven poverty alleviation funds in achieving mid-21st-Century multidimensional poverty alleviation planning. Humanit. Soc. Sci. Commun. 2022, 9. [Google Scholar] [CrossRef]
  6. Calvet-Mir, L.; Gomez-Baggethun, E.; Reyes-Garcia, V. Beyond food production: Ecosystem services provided by home gardens. A case study in Vall Fosca, Catalan Pyrenees, Northeastern Spain. Ecol. Econ. 2012, 74, 153–160. [Google Scholar] [CrossRef]
  7. Rulli, M.C.; Saviori, A.; D’Odorico, P. Global land and water grabbing. Proc. Natl. Acad. Sci. USA 2013, 110, 892–897. [Google Scholar] [CrossRef] [Green Version]
  8. Quintas-Soriano, C.; Castro, A.J.; Castro, H.; Garcia-Llorente, M. Impacts of land use change on ecosystem services and implications for human well-being in Spanish drylands. Land Use Policy 2016, 54, 534–548. [Google Scholar] [CrossRef]
  9. Houghton, R.A.; Nassikas, A.A. Global and regional fluxes of carbon from land use and land cover change 1850-2015. Glob. Biogeochem. Cycles 2017, 31, 456–472. [Google Scholar] [CrossRef]
  10. Song, X.P.; Hansen, M.C.; Stehman, S.V.; Potapov, P.V.; Tyukavina, A.; Vermote, E.F.; Townshend, J.R. Global land change from 1982 to 2016. Nature 2018, 560, 639–643. [Google Scholar] [CrossRef]
  11. Shukla, P.R.; Skea, J.; Buendia, C.E.; Masson-Delmotte, V. Climate Change and Land: An IPCC Special Report on Climate Change, Desertification, Land Degradation, Sustainable Land Management, Food Security, and Greenhouse Gas Fluxes in Terrestrial Ecosystems; IPCC: Geneva, Switzerland, 2019; in press. [Google Scholar]
  12. Wang, A.; Liao, X.; Tong, Z.; Du, W.; Zhang, J.; Liu, X.; Guo, E.; Liu, M. Spatiotemporal variation of ecological carrying capacity in Dongliao River Basin, China. Ecol. Indic. 2022, 135, 108548. [Google Scholar] [CrossRef]
  13. Manniello, C.; Cillis, G.; Statuto, D.; Di Pasquale, A.; Picuno, P. GIScience and historical cartography for evaluating land use changes and resulting effects on carbon balance. ISPRS Int. J. Geo-Inf. 2022, 11, 179. [Google Scholar] [CrossRef]
  14. Ahmed, N.; Wang, G.; Booij, M.J.; Sun, X.; Hussain, F.; Nabi, G. Separation of the impact of landuse/landcover change and climate change on runoff in the upstream area of the Yangtze River, China. Water Resour. Manag. 2022, 36, 181–201. [Google Scholar] [CrossRef]
  15. Yang, Y.Y.; Bao, W.K.; Li, Y.H.; Wang, Y.S.; Chen, Z.F. Land use transition and its eco-environmental effects in the Beijing-Tianjin-Hebei Urban Agglomeration: A production-living-ecological perspective. Land 2020, 9, 285. [Google Scholar] [CrossRef]
  16. Tello, E.; Marull, J.; Padro, R.; Cattaneo, C.; Coll, F. The Loss of Landscape Ecological Functionality in the Barcelona Province (1956–2009): Could Land-Use History Involve a Legacy for Current Biodiversity? Sustainability 2020, 12, 2238. [Google Scholar] [CrossRef] [Green Version]
  17. Dewan, A.M.; Yamaguchi, Y. Land use and land cover change in Greater Dhaka, Bangladesh: Using remote sensing to promote sustainable urbanization. Appl. Geogr. 2009, 29, 390–401. [Google Scholar] [CrossRef]
  18. Yu, H.; Yang, J.; Li, T.; Jin, Y.; Sun, D. Morphological and functional polycentric structure assessment of megacity: An integrated approach with spatial distribution and interaction. Sustain. Cities Soc. 2022, 80, 103800. [Google Scholar] [CrossRef]
  19. Xie, W.; Jin, W.; Chen, K.; Wu, J.; Zhou, C. Land use transition and its influencing factors in poverty-stricken mountainous areas of sangzhi county, china. Sustainability 2019, 11, 4915. [Google Scholar] [CrossRef] [Green Version]
  20. Yang, J.; Guo, A.; Li, Y.; Zhang, Y.; Li, X. Simulation of landscape spatial layout evolution in rural-urban fringe areas: A case study of Ganjingzi District. GISci. Remote Sens. 2019, 56, 388–405. [Google Scholar] [CrossRef]
  21. He, Q.; Tan, R.; Yang, J. Synchronized simulation of urban diffusional and aggregational process based on the affinity propagation cellular automata: A case study of Wuhan city. Acta Geogr. Sin. 2021, 76, 2522–2535. [Google Scholar] [CrossRef]
  22. He, F.; Yang, J. Simulation of coastal urban construction land based on the perspective of the Offshore Island Connection Line. GISci. Remote Sens. 2022, 59, 801–821. [Google Scholar] [CrossRef]
  23. Tan, R.; Liu, Y.; Zhou, K.; Jiao, L.; Tang, W. A game-theory based agent-cellular model for use in urban growth simulation: A case study of the rapidly urbanizing Wuhan area of central China. Comput. Environ. Urban Syst. 2015, 49, 15–29. [Google Scholar] [CrossRef]
  24. Hu, P.P.; Li, F.; Sun, X.; Liu, Y.L.; Chen, X.C.; Hu, D. Assessment of land-use/cover changes and its ecological effect in rapidly urbanized areas-taking Pearl River Delta Urban Agglomeration as a case. Sustainability 2021, 13, 5075. [Google Scholar] [CrossRef]
  25. Hanacek, K.; Rodriguez-Labajos, B. Impacts of land-use and management changes on cultural agroecosystem services and environmental conflicts—A global review. Glob. Environ. Chang.-Hum. Policy Dimens. 2018, 50, 41–59. [Google Scholar] [CrossRef]
  26. Chen, C.; Park, T.; Wang, X.; Piao, S.; Xu, B.; Chaturvedi, R.K.; Fuchs, R.; Brovkin, V.; Ciais, P.; Fensholt, R.; et al. China and India lead in greening of the world through land-use management. Nat. Sustain. 2019, 2, 122–129. [Google Scholar] [CrossRef]
  27. Griggs, D.; Stafford-Smith, M.; Gaffney, O.; Rockstroem, J.; Oehman, M.C.; Shyamsundar, P.; Steffen, W.; Glaser, G.; Kanie, N.; Noble, I. Sustainable development goals for people and planet. Nature 2013, 495, 305–307. [Google Scholar] [CrossRef]
  28. Qu, Y.; Long, H. The economic and environmental effects of land use transitions under rapid urbanization and the implications for land use management. Habitat Int. 2018, 82, 113–121. [Google Scholar] [CrossRef]
  29. Fischer, J.; Lindenmayer, D.B. Landscape modification and habitat fragmentation: A synthesis. Glob. Ecol. Biogeogr. 2007, 16, 265–280. [Google Scholar] [CrossRef]
  30. Long, H.L.; Liu, Y.Q.; Hou, X.G.; Li, T.T.; Li, Y.R. Effects of land use transitions due to rapid urbanization on ecosystem services: Implications for urban planning in the new developing area of China. Habitat Int. 2014, 44, 536–544. [Google Scholar] [CrossRef]
  31. Lawler, J.J.; Lewis, D.J.; Nelson, E.; Plantinga, A.J.; Polasky, S.; Withey, J.C.; Helmers, D.P.; Martinuzzi, S.; Pennington, D.; Radeloff, V.C. Projected land-use change impacts on ecosystem services in the United States. Proc. Natl. Acad. Sci. USA 2014, 111, 7492–7497. [Google Scholar] [CrossRef] [Green Version]
  32. Asadolahi, Z.; Salmanmahiny, A.; Sakieh, Y.; Mirkarimi, S.H.; Baral, H.; Azimi, M. Dynamic trade-off analysis of multiple ecosystem services under land use change scenarios: Towards putting ecosystem services into planning in Iran. Ecol. Complex. 2018, 36, 250–260. [Google Scholar] [CrossRef]
  33. Li, C.X.; Wu, J.Y. Land use transformation and eco-environmental effects based on production-living-ecological spatial synergy: Evidence from Shaanxi Province, China. Environ. Sci. Pollut. Res. 2022, 29, 41492–41504. [Google Scholar] [CrossRef]
  34. Xi, F.; Wang, R.; Shi, J.; Zhang, J.; Yu, Y.; Wang, N.; Wang, Z. Spatio-Temporal Pattern and Conflict Identification of Production-Living-Ecological Space in the Yellow River Basin. Land 2022, 11, 744. [Google Scholar] [CrossRef]
  35. Jiang, X.; Zhai, S.; Liu, H.; Chen, J.; Zhu, Y.; Wang, Z. Multi-scenario simulation of production-living-ecological space and ecological effects based on shared socioeconomic pathways in Zhengzhou, China. Ecol. Indic. 2022, 137, 108750. [Google Scholar] [CrossRef]
  36. Bryan, B.A.; Gao, L.; Ye, Y.; Sun, X.; Connor, J.D.; Crossman, N.D.; Stafford-Smith, M.; Wu, J.; He, C.; Yu, D.; et al. China’s response to a national land-system sustainability emergency. Nature 2018, 559, 193–204. [Google Scholar] [CrossRef]
  37. Chen, Y.; Su, X.; Wang, X. Spatial Transformation Characteristics and Conflict Measurement of Production-Living-Ecology: Evidence from Urban Agglomeration of China. Int. J. Environ. Res. Public Health 2022, 19, 1458. [Google Scholar] [CrossRef]
  38. Chen, J.; Dong, B.; Li, H.; Zhang, S.; Peng, L.; Fang, L.; Zhang, C.; Li, S. Study on landscape ecological risk assessment of Hooded Crane breeding and overwintering habitat. Environ. Res. 2020, 187, 109649. [Google Scholar] [CrossRef]
  39. Cui, L.; Zhao, Y.; Liu, J.; Han, L.; Ao, Y.; Yin, S. Landscape ecological risk assessment in Qinling Mountain. Geol. J. 2018, 53, 342–351. [Google Scholar] [CrossRef]
  40. Wu, P.; Zhan, W.; Cheng, N.; Yang, H.; Wu, Y. A framework to calculate annual landscape ecological risk index based on land use/land cover changes: A case study on Shengjin Lake Wetland. IEEE J. Sel. Top. Appl. Earth Obs. Remote Sens. 2021, 14, 11926–11935. [Google Scholar] [CrossRef]
  41. Xu, Q.; Guo, P.; Jin, M.; Qi, J. Multi-scenario landscape ecological risk assessment based on Markov-FLUS composite model. Geomat. Nat. Hazards Risk 2021, 12, 1448–1465. [Google Scholar] [CrossRef]
  42. Guo, B.; Zhou, Y.; Zhu, J.; Liu, W.; Wang, F.; Wang, L.; Yan, F.; Wang, F.; Yang, G.; Luo, W.; et al. Spatial patterns of ecosystem vulnerability changes during 2001–2011 in the three-river source region of the Qinghai-Tibetan Plateau, China. J. Arid. Land 2016, 8, 23–35. [Google Scholar] [CrossRef]
  43. Ma, H.; Shi, L. Assessment of eco-environmental quality of Western Taiwan Straits Economic Zone. Environ. Monit. Assess. 2016, 188, 311. [Google Scholar] [CrossRef]
  44. Sun, R.; Wu, Z.; Chen, B.; Yang, C.; Qi, D.; Lan, G.; Fraedrich, K. Effects of land-use change on eco-environmental quality in Hainan Island, China. Ecol. Indic. 2020, 109, 105777. [Google Scholar] [CrossRef]
  45. Zhang, L.; Zhang, H.; Xu, E. Information entropy and elasticity analysis of the land use structure change influencing eco-environmental quality in Qinghai-Tibet Plateau from 1990 to 2015. Environ. Sci. Pollut. Res. 2022, 29, 18348–18364. [Google Scholar] [CrossRef]
  46. Kong, D.; Chen, H.; Wu, K. The evolution of “Production-Living-Ecological” space, eco-environmental effects and its influencing factors in China. J. Nat. Resour. 2021, 36, 1116–1135. [Google Scholar] [CrossRef]
  47. Dong, J.; Zhang, Z.; Da, X.; Zhang, W.; Feng, X. Eco-environmental effects of land use transformation and its driving forces from the perspective of “production-living-ecological” spaces: A case study of Gansu Province. Acta Ecol. Sin. 2021, 41, 5919–5928. [Google Scholar] [CrossRef]
  48. Li, A.N.; Wang, A.S.; Liang, S.L.; Zhou, W.C. Eco-environmental vulnerability evaluation in mountainous region using remote sensing and GIS—A case study in the upper reaches of Minjiang River, China. Ecol. Modell. 2006, 192, 175–187. [Google Scholar] [CrossRef]
  49. Shao, H.; Liu, M.; Shao, Q.; Sun, X.; Wu, J.; Xiang, Z.; Yang, W. Research on eco-environmental vulnerability evaluation of the Anning River Basin in the upper reaches of the Yangtze River. Environ. Earth Sci. 2014, 72, 1555–1568. [Google Scholar] [CrossRef]
  50. Wang, S.-Y.; Liu, J.-S.; Yang, C.-J. Eco-environmental vulnerability evaluation in the Yellow River Basin, China. Pedosphere 2008, 18, 171–182. [Google Scholar] [CrossRef]
  51. Dai, X.; Gao, Y.; He, X.; Liu, T.; Jiang, B.; Shao, H.; Yao, Y. Spatial-temporal pattern evolution and driving force analysis of ecological environment vulnerability in Panzhihua City. Environ. Sci. Pollut. Res. 2021, 28, 7151–7166. [Google Scholar] [CrossRef]
  52. Wu, X.; Zhang, H. Evaluation of ecological environmental quality and factor explanatory power analysis in western Chongqing, China. Ecol. Indic. 2021, 132, 108311. [Google Scholar] [CrossRef]
  53. Ji, J.; Wang, S.; Zhou, Y.; Liu, W.; Wang, L. Studying the eco-environmental quality variations of Jing-Jin-Ji Urban Agglomeration and its driving factors in different ecosystem service regions from 2001 to 2015. IEEE Access 2020, 8, 154940–154952. [Google Scholar] [CrossRef]
  54. Chen, W.; Li, J.; Zeng, J.; Ran, D.; Yang, B. Spatial heterogeneity and formation mechanism of eco-environmental effect of land use change in China. Geogr. Res. 2019, 38, 2173–2187. [Google Scholar] [CrossRef]
  55. Cong, D.; Qu, H. Research on spatiotemporal development and coupling of intensive urban land use and urbanization efficiency—Taking Mid-Southern Liaoning Urban Agglomeration as example. Res. Soil Water Conserv. 2015, 22, 298–311. [Google Scholar] [CrossRef]
  56. Statistics Bureau of Liaoning Province. Liao Ning Statistical Yearbook (2019), 1st ed.; China Statistics Press: Beijing, China, 2019; pp. 1–55.
  57. Liu, B.; Fang, Y. Characteristics and territorial types of agriculture multifunction evolution in Mid-southern Liaoning urban agglomeration. Sci. Geogr. Sin. 2020, 40, 1720–1730. [Google Scholar] [CrossRef]
  58. Xu, Y.; Lei, G. Study on evolution of urban land structure in Liaozhongnan city groups. Econ. Geogr. 2018, 38, 69–77. [Google Scholar] [CrossRef]
  59. Xu, X.; Liu, J.; Zhang, S.; LI, R. China Multi Period Land Use and Land Cover Remote Sensing Monitoring Data Set (CNLUCC); Resource and Environment Data Cloud Platform: Beijing, China, 2018. [Google Scholar] [CrossRef]
  60. Zhang, Y.; Liu, Y.; Zhang, Y.; Liu, Y.; Zhang, G.; Chen, Y. On the spatial relationship between ecosystem services and urbanization: A case study in Wuhan, China. Sci. Total Environ. 2018, 637, 780–790. [Google Scholar] [CrossRef]
  61. Peng, J.; Tian, L.; Liu, Y.; Zhao, M.; Hu, Y.N.; Wu, J. Ecosystem services response to urbanization in metropolitan areas: Thresholds identification. Sci. Total Environ. 2017, 607, 706–714. [Google Scholar] [CrossRef]
  62. Xu, X. A Kilometer Grid Dataset of Population Spatial Distribution in China; Resource and Environment Data Cloud Platform: Beijing, China, 2010. [Google Scholar] [CrossRef]
  63. Bennett, E.M.; Peterson, G.D.; Gordon, L.J. Understanding relationships among multiple ecosystem services. Ecol. Lett. 2009, 12, 1394–1404. [Google Scholar] [CrossRef]
  64. Nelson, E.; Mendoza, G.; Regetz, J.; Polasky, S.; Tallis, H.; Cameron, D.R.; Chan, K.M.A.; Daily, G.C.; Goldstein, J.; Kareiva, P.M.; et al. Modeling multiple ecosystem services, biodiversity conservation, commodity production, and tradeoffs at landscape scales. Front. Ecol. Environ. 2009, 7, 4–11. [Google Scholar] [CrossRef]
  65. Yang, Q.; Duan, X.; Wang, L.; Jin, Z. Land use transformation based on ecological-production-living spaces and associated eco-environment effects: A case study in the Yangtze River Delta. Sci. Geogr. Sin. 2018, 38, 97–106. [Google Scholar] [CrossRef]
  66. Deng, Y.; Yang, R. Influence Mechanism of Production-Living-Ecological Space Changes in the Urbanization Process of Guangdong Province, China. Land 2021, 10, 1357. [Google Scholar] [CrossRef]
  67. Li, X.; Fang, C.; Huang, J.; Mao, H. The urban land use transformations and associated effects on eco-environment in northwest China arid region: A case study in Hexi region, Gansu province. Quat. Sci. 2003, 23, 280–290. [Google Scholar]
  68. Cui, J.; Zang, S. Regional disparities of land use changes and their eco-environmental effects in Harbin-Daqing-Qiqihar Industrial Corridor. Geogr. Res. 2013, 32, 848–856. [Google Scholar]
  69. Gong, Y.; Han, S.; Shi, X.; Tang, X. Temporal and spatial evolution and associated eco-environment effects of the land use transformation of ecological-production-living spaces in Guangdong province. Res. Soil Water Conserv. 2020, 27, 203–209. [Google Scholar] [CrossRef]
  70. Yi, L.; Zhang, Z.; Zhao, X.; Liu, B.; Wang, X.; Wen, Q.; Zuo, L.; Liu, F.; Xu, J.; Hu, S. Have changes to unused land in china improved or exacerbated its environmental quality in the past three decades? Sustainability 2016, 8, 184. [Google Scholar] [CrossRef] [Green Version]
  71. Oshan, T.M.; Li, Z.; Kang, W.; Wolf, L.J.; Fotheringham, A.S. MGWR: A python implementation of Multiscale Geographically Weighted Regression for investigating process spatial heterogeneity and scale. ISPRS Int. J. Geo-Inf. 2019, 8, 269. [Google Scholar] [CrossRef] [Green Version]
  72. Yu, H.; Fotheringham, A.S.; Li, Z.; Oshan, T.; Kang, W.; Wolf, L.J. Inference in Multiscale Geographically Weighted Regression. Geogr. Anal. 2020, 52, 87–106. [Google Scholar] [CrossRef]
  73. Seifollahi-Aghmiuni, S.; Kalantari, Z.; Egidi, G.; Gaburova, L.; Salvati, L. Urbanisation-driven land degradation and socioeconomic challenges in peri-urban areas: Insights from Southern Europe. Ambio 2022, 51, 1446–1458. [Google Scholar] [CrossRef]
  74. Zak, M.R.; Cabido, M.; Caceres, D.; Diaz, S. What drives accelerated land cover change in central Argentina? Synergistic consequences of climatic, socioeconomic, and technological factors. Environ. Manag. 2008, 42, 181–189. [Google Scholar] [CrossRef]
  75. Bajocco, S.; Ceccarelli, T.; Smiraglia, D.; Salvati, L.; Ricotta, C. Modeling the ecological niche of long-term land use changes: The role of biophysical factors. Ecol. Indic. 2016, 60, 231–236. [Google Scholar] [CrossRef]
  76. Fan, X.; Zhao, L.; He, D. Land Use Changes and its Driving Factors in a Coastal Zone. Pol. J. Environ. Stud. 2020, 29, 1143–1150. [Google Scholar] [CrossRef]
  77. Geist, H.J.; Lambin, E.F. Dynamic causal patterns of desertification. Bioscience 2004, 54, 817–829. [Google Scholar] [CrossRef] [Green Version]
  78. Lu, C.; Zhang, A. Land use transition and its eco-environment effects in Northeast China. J. China Agric. Univ. 2020, 25, 123–133. [Google Scholar]
  79. Tian, J.; Wang, B.; Wang, S. Land use transition in Northeast China: Features measurement and mechanism exploration. Econ. Geogr. 2020, 40, 184–195. [Google Scholar] [CrossRef]
  80. Tian, J.; Wang, B.; Cheng, L.; Wang, S. The process and mechanism of regional land use transition guided by policy: A case study of Northeast China. Geogr. Res. 2020, 39, 805–821. [Google Scholar]
  81. Fotheringham, A.S.; Yang, W.; Kang, W. Multiscale Geographically Weighted Regression (MGWR). Ann. Am. Assoc. Geogr. 2017, 107, 1247–1265. [Google Scholar] [CrossRef]
  82. Zheng, X.; Zhang, Z.; Hu, Y.; Li, X. Coordinated development study on the about land utilization and ecological environment in Liaoning Province. Res. Soil Water Conserv. 2008, 15, 212–215. [Google Scholar]
  83. MacDonald, D.; Crabtree, J.R.; Wiesinger, G.; Dax, T.; Stamou, N.; Fleury, P.; Lazpita, J.G.; Gibon, A. Agricultural abandonment in mountain areas of Europe: Environmental consequences and policy response. J. Environ. Manag. 2000, 59, 47–69. [Google Scholar] [CrossRef]
  84. Mansour, S.; Al Kindi, A.; Al-Said, A.; Al-Said, A.; Atkinson, P. Sociodemographic determinants of COVID-19 incidence rates in Oman: Geospatial modelling using multiscale geographically weighted regression (MGWR). Sustain. Cities Soc. 2021, 65, 102627. [Google Scholar] [CrossRef]
Figure 1. Location of the study area in Liaoning Province, China.
Land 11 00937 g001
Figure 2. The production–living–ecological land use of the central and southern Liaoning urban agglomeration 1990–2018. (a) 1990; (b) 2000; (c) 2010; (d) 2018.
Land 11 00937 g002
Figure 3. Sankey diagram of land-use transitions in the central and southern Liaoning urban agglomeration 1990–2018.
Land 11 00937 g003
Figure 4. Distribution of the eco-environmental quality index in the central and southern Liaoning urban agglomeration 1990–2018. (a) 1990; (b) 2000; (c) 2010; (d) 2018.
Land 11 00937 g004
Figure 5. Improvement and deterioration of the eco-environmental quality index in the central and southern Liaoning urban agglomeration 1990–2018. (a) 1990–2000; (b) 2000–2010; (c) 2010–2018.
Land 11 00937 g005
Figure 6. Major land-use transformation and contribution rates influencing the eco-environmental quality index.
Land 11 00937 g006
Figure 7. Spatial distribution of standardized residual and regression coefficients of driving factors for eco-environmental quality based on the MGWR model in the central and southern Liaoning urban agglomeration in 2010. (a) standardized residual; (b) slope; (c) annual average temperature; (d) annual average precipitation; (e) population density; (f) GDP; (g) land-use intensity; (h) land-use diversity; (i) distance from the nearest prefecture-level city.
Land 11 00937 g007
Table 1. Data sources and descriptions.
Data TypesData DescriptionsTimeData Sources
LULCC 1Remote sensing monitoring and interpretation data of land use with 30 m spatial resolution [59] can achieve an accuracy of over 90%. Land-use types cover six first-level land types (cultivated land, forest land, grassland, water area, construction land and unused land) and 25 s-level land types.1990–2018http://www.resdc.cn
(accessed on
1 September 2021)
DEM 21 km spatial resolution digital elevation model 2010http://www.gscloud.cn/
(accessed on
1 September 2021)
Meteorological
monitoring data
The 1 km spatial resolution is based on the spatial interpolation data set of annual average temperature and annual average precipitation generated from the observation data of more than 2400 meteorological stations in China2010http://www.resdc.cn
(accessed on
1 September 2021)
Population and GDP
spatial distribution
kilometer grid data set
1 km spatial resolution, combined with the spatial interaction law of land-use data, nighttime light data, residential density data, and the spatial interaction pattern of population and GDP [60,61,62]2010http://www.resdc.cn
(accessed on
5 September 2021)
City-level administrative center dataUsed to calculate the distance from city-level administrative centers2010http://www.ngcc.cn/ngcc/
(accessed on
5 September 2021)
Administrative
boundary data
Used to extract administrative boundaries2018http://www.ngcc.cn/ngcc/
(accessed on
10 September 2021)
1 Land use and land cover change. 2 Digital elevation model.
Table 2. Land-use classification for production–living–ecological land use and the eco-environmental quality index.
Dominant Function Classification of PLES Land UseLand-Use Classification System
Secondary Land Type
Eco-Environmental
Quality Index
Primary Land TypeSecondary Land Type
Production land11 agricultural production landPaddy field, dry farmland0.260
12 industrial and mining production landIndustrial and transport
construction land
0.150
Living land21 urban living landUrban land0.200
22 rural living landRural residential land0.200
Ecological land31 forest ecological landForest land, shrub forest
land, sparse forest land,
and other forest land
0.930
32 grassland ecological landHigh coverage grassland,
medium coverage grassland,
low coverage grassland
0.570
33 water ecological landRivers, canals, lakes, reservoirs, ponds, tidal flats, and shoals0.560
34 other ecological landSandy land, saline-alkali land, swampland, bare land,
and bare rocky land
0.620
Table 3. The index system for the multi-scale geographically weighted regression (MGWR) model.
CategoryIndexMeaningCalculation Method
Natural environment factorsSlopeIndicates the impact of terrain factors on the distribution pattern of eco-environmental qualityObtained by using the Slope tool and
Zonal Statistics as Table tool in ArcGIS 10.3
ReliefObtained by using the Block Statistics tool in ArcGIS 10.3
Annual average
precipitation
Indicates the driving influence of climatic factors on the evolution of eco-environmental qualityObtained by using the Zonal Statistics
as Table tool in ArcGIS 10.3
Annual average
temperature
Obtained by using the Zonal Statistics
as Table tool in ArcGIS 10.3
Socio-economic factorsPopulation densityIndicates the impact of social and economic activities on eco-environmental qualityObtained by using the Zonal Statistics
as Table tool in ArcGIS 10.3
GDP 1Obtained by using the Zonal Statistics
as Table tool in ArcGIS 10.3
Land-use intensityIndicates the impact of human activities on land use, which in turn leads to the evolution of eco-environmental qualityThe Shannon–Wiener index is used
to measure the richness, complexity
and order of land use in China
Land-use diversityCalculated based on Shannon’s
diversity index
Distance from the nearest prefecture-level cityIndicates the impact of location factors on eco-environmental qualityObtained by using the Near, Kriging, and Zonal Statistics as Table tools in ArcGIS 10.3
1 Gross domestic product.
Table 4. Area and changes of land-use types in the central and southern Liaoning urban agglomeration 1990–2018 (km2).
Year1112212231323334
199038,637.564 721.323 1066.308 3986.671 43,742.959 1226.825 2926.835 1053.212
200039,345.779 775.773 1211.973 4124.860 42,756.808 1162.134 2997.694 1005.206
201038,261.168 1181.968 1753.572 4967.955 42,539.679 682.178 3196.583 1015.568
201836,088.797 1122.306 2346.507 5066.944 43,764.486 636.056 3302.532 1284.110
1990–2000708.215 54.450 145.665 138.190 −986.152 −64.691 70.859 −48.006
2000–2010−1084.611 406.195 541.598 843.095 −217.129 −479.957 198.889 10.362
2010–2018−2172.371 −59.662 592.935 98.989 1224.807 −46.121 105.949 268.542
1990–2018−2548.768 400.983 1280.199 1080.274 21.527 −590.769 375.697 230.898
Table 5. Transition matrix of land-use types in the central and southern Liaoning urban agglomeration 1990–2018 (km2).
19902018
1112212231323334Summary in 1990
1130,289.171407.218856.8322028.0643847.734214.143811.455179.93238,634.548
1225.344258.377107.64515.18915.9949.812278.2499.758720.368
2144.38310.412909.73485.8529.8591.0804.6310.1911066.140
221036.15239.373228.6172465.793155.61516.99731.83711.8433986.228
313599.112156.891167.376374.31838,987.637235.337159.63959.08943,739.399
32360.00115.33322.18952.894599.206125.94023.33727.5591226.458
33468.257109.97339.23530.545129.66212.6071732.819394.0722917.170
34264.63123.38210.45013.14515.34319.921104.671601.5951053.138
Summary in 201836,087.0501020.9582342.0775065.80043,761.050635.8373146.6381284.038
Table 6. Eco-environmental quality index 1990–2018.
Year1990200020102018
The mean value of the
eco-environmental quality index
0.575 0.568 0.5650.574
Table 7. Comparison of fitting results for OLS, GWR and MGWR models.
Model IndicatorsOLS 1GWR 2MGWR
AICc63.79058.27744.770
R-squared0.8980.9340.948
Residual sum of squares7.3664.7213.763
1 Ordinary least squares. 2 Geographically weighted regression.
Table 8. Variable bandwidth for GWR and MGWR models.
VariableBandwidth of
GWR Model
Bandwidth of
MGWR Model
Slope63.00044.000
Annual average temperature63.00046.000
Annual average precipitation63.00043.000
Population density63.00071.000
GDP63.00071.000
Land-use identity63.00071.000
Land-use diversity63.00071.000
Distance from the nearest prefecture-level city63.00063.000
Table 9. Statistical description of MGWR coefficient means.
VariableSlopeAnnual Average TemperatureAnnual Average
Precipitation
Population DensityGDPLand-Use IdentityLand-Use DiversityDistance from the Nearest Prefecture-Level City
coefficient0.722−0.1760.254−0.069−0.062−0.132−0.0280.025
Publisher’s Note: MDPI stays neutral with regard to jurisdictional claims in published maps and institutional affiliations.

