
Land Use Change under Population Migration and Its Implications for Human–Land Relationship

Abstract
:1. Introduction
2. Materials and Methods
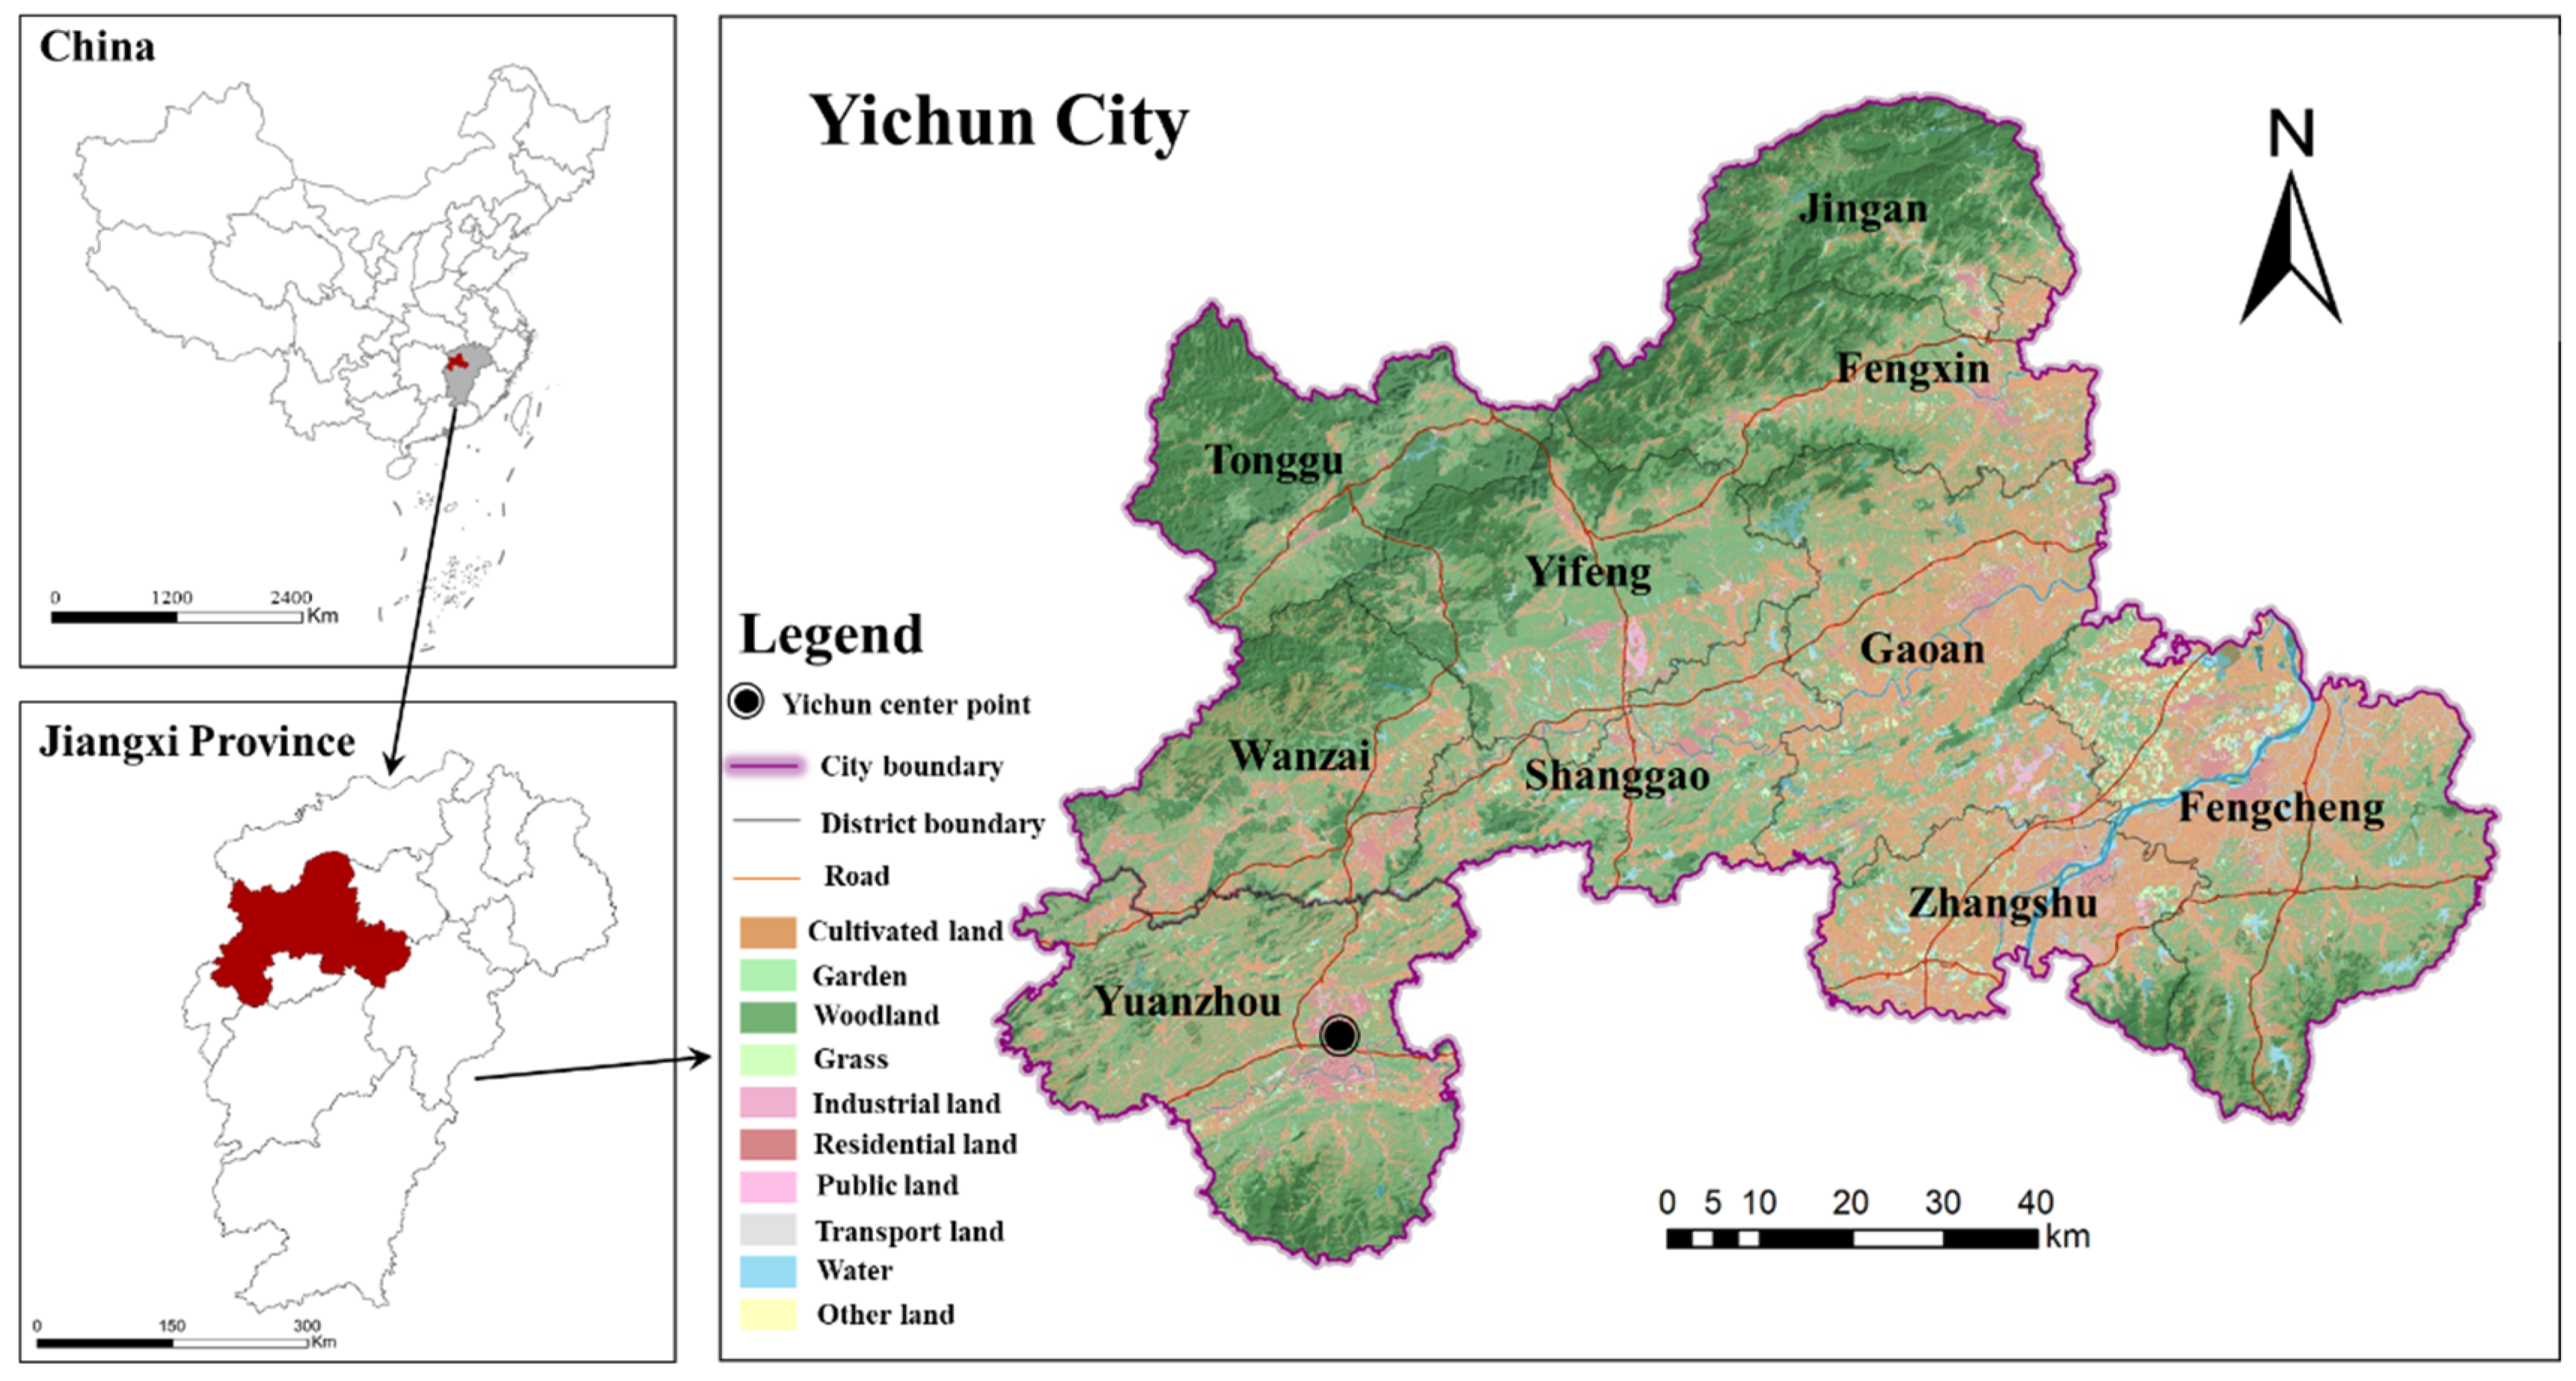
2.1. Study Area
2.2. Data Source and Preprocessing
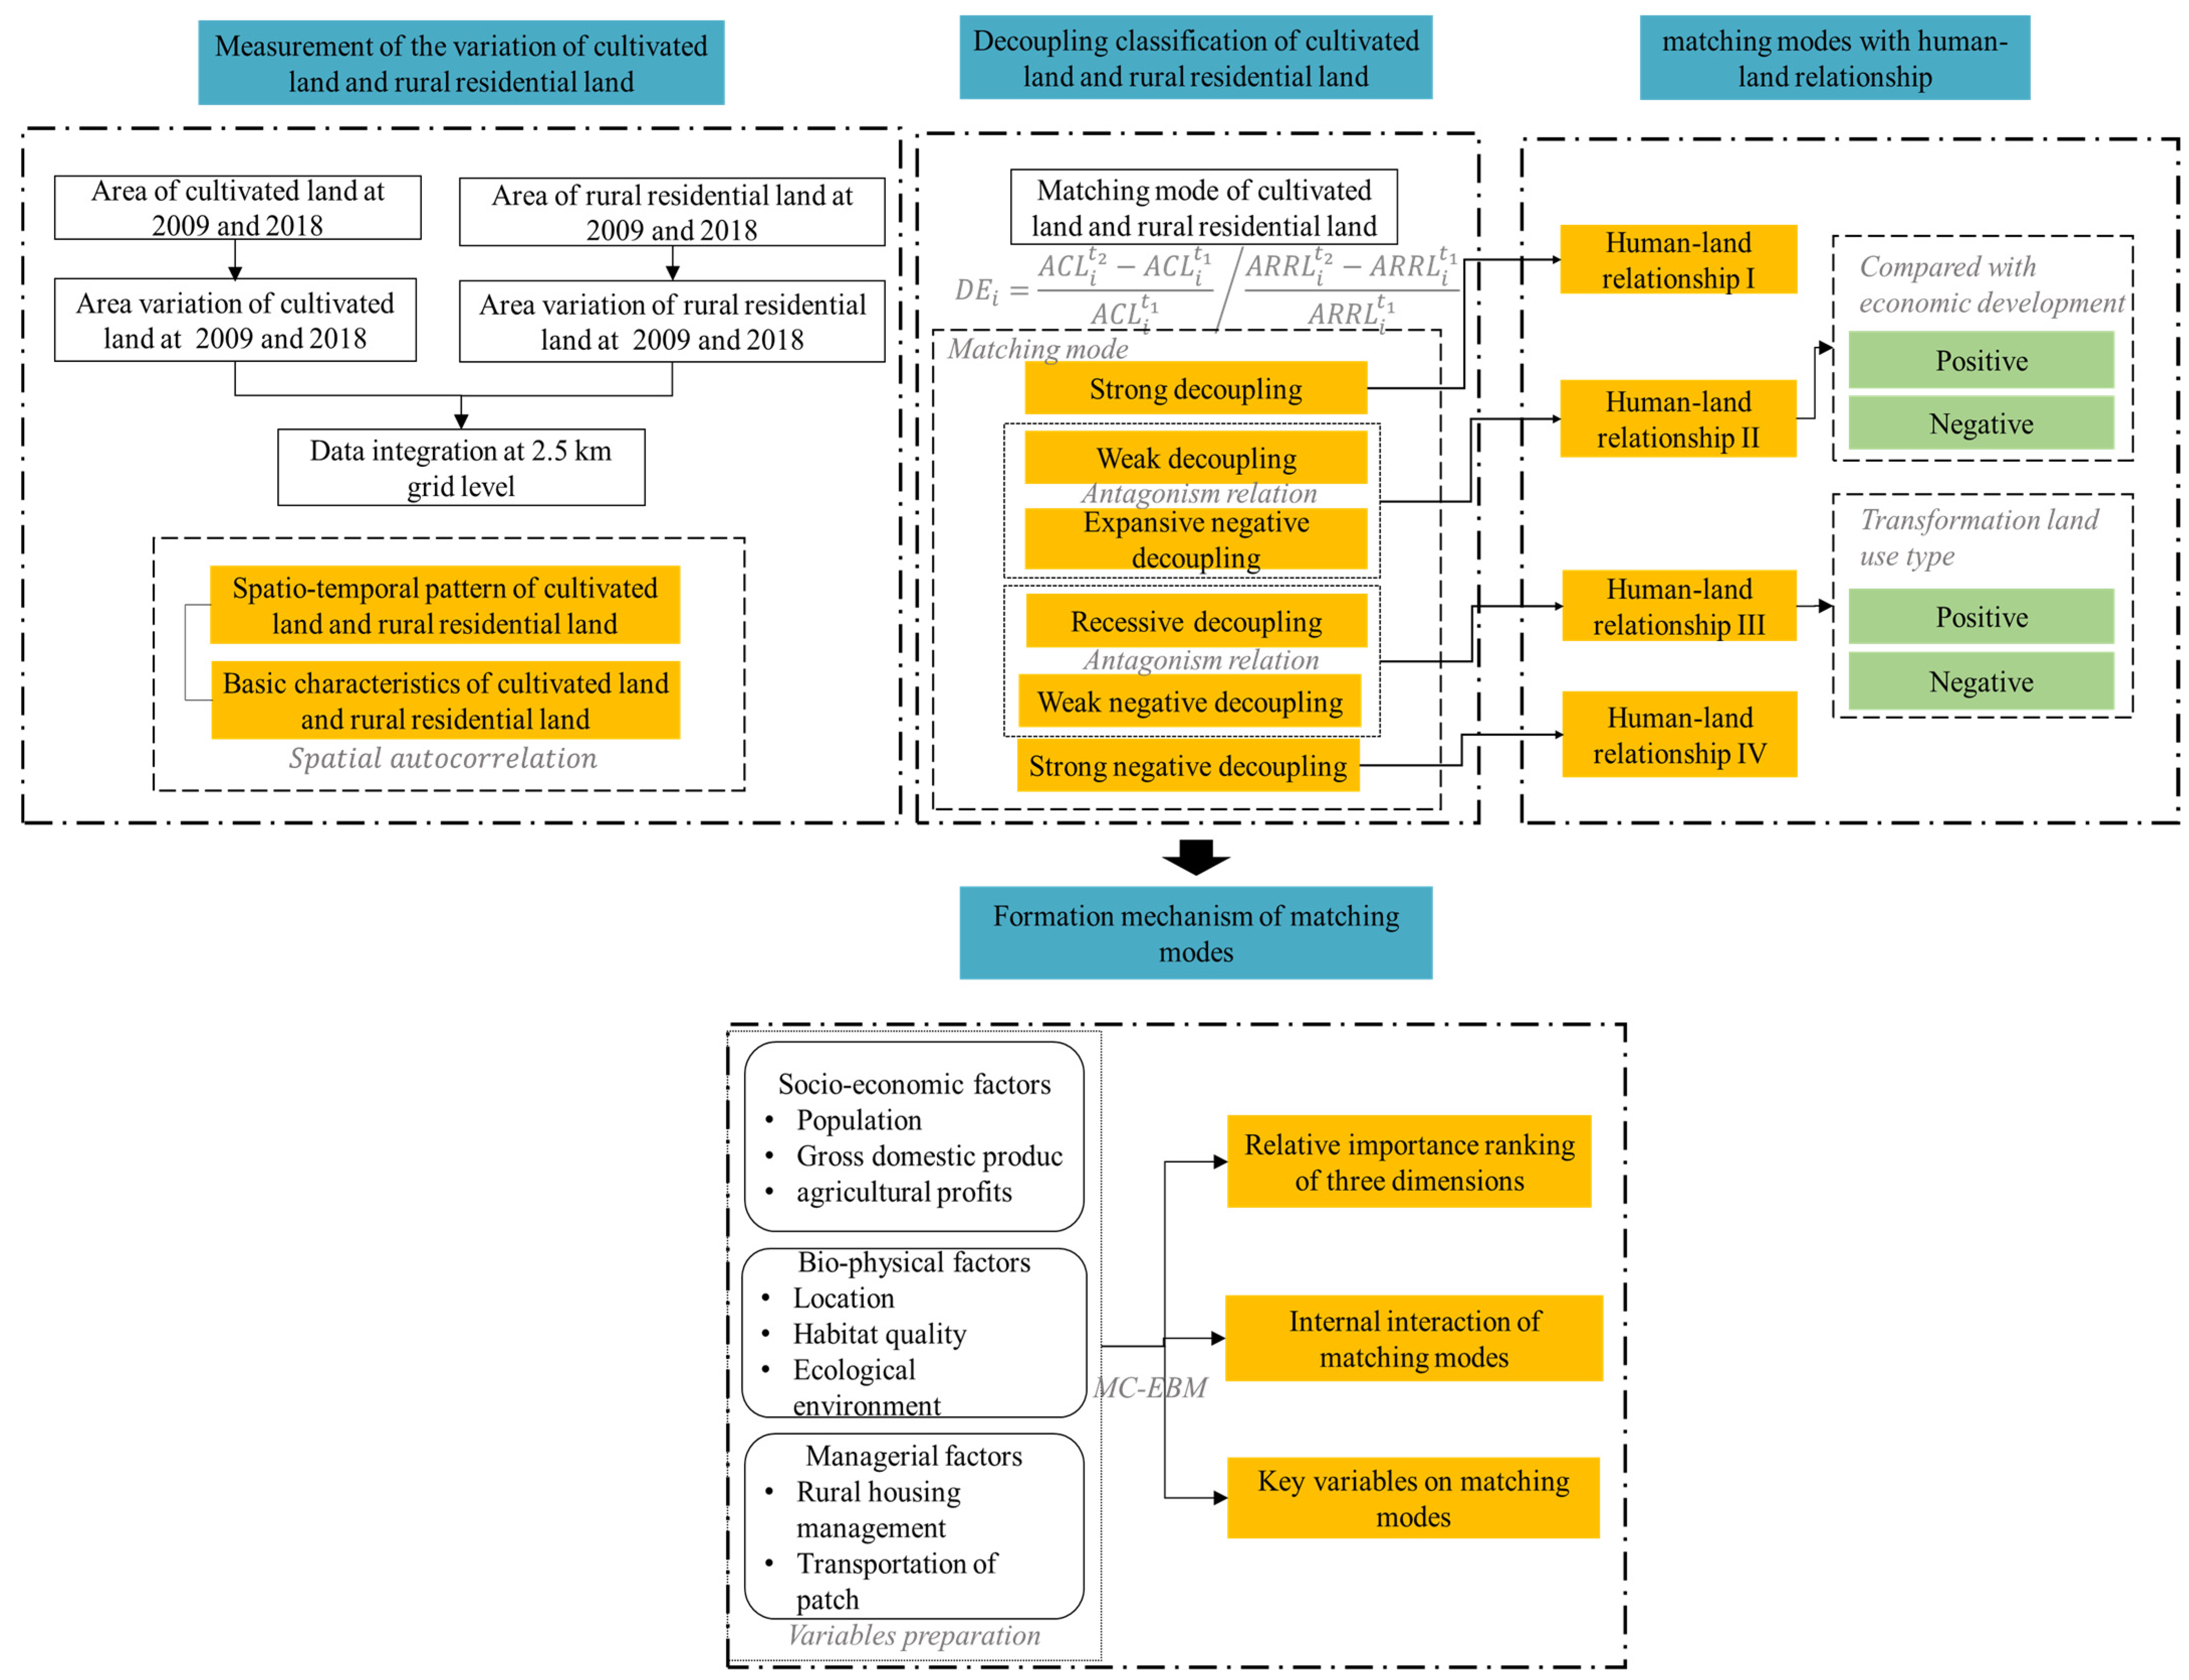
2.3. Flowchart of the Method
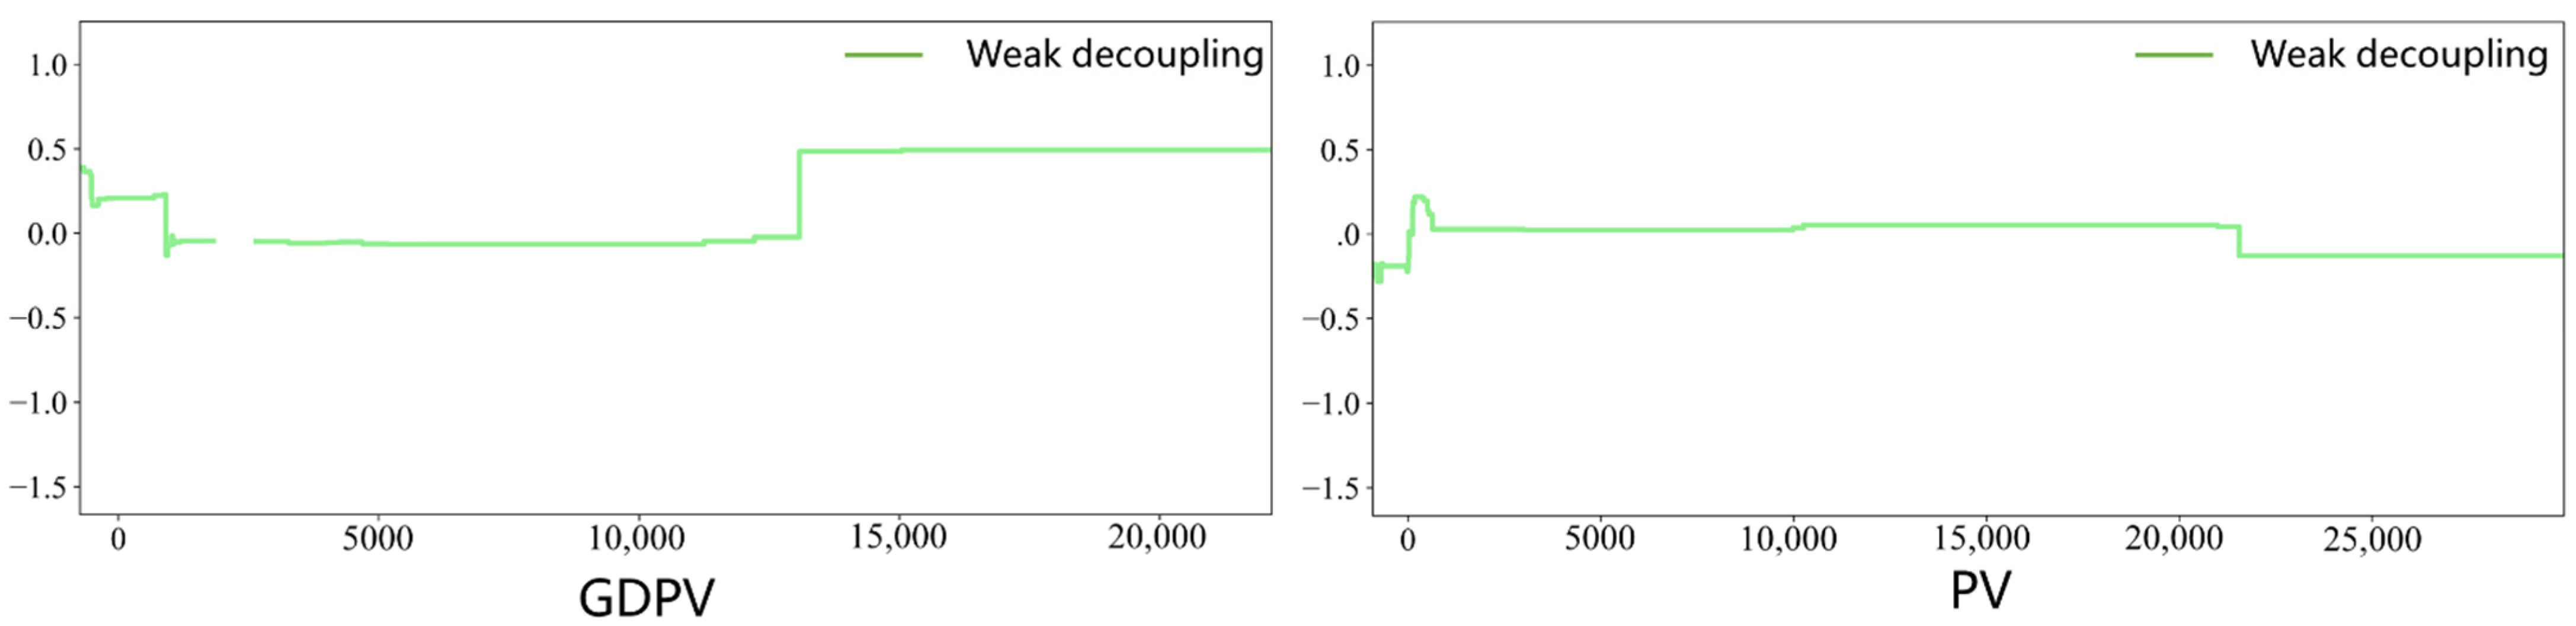
2.4. Decoupling Model
2.5. Variables Preparation for MC-EBM Analysis
2.6. Multiclass Explainable Boosting Machine
3. Results
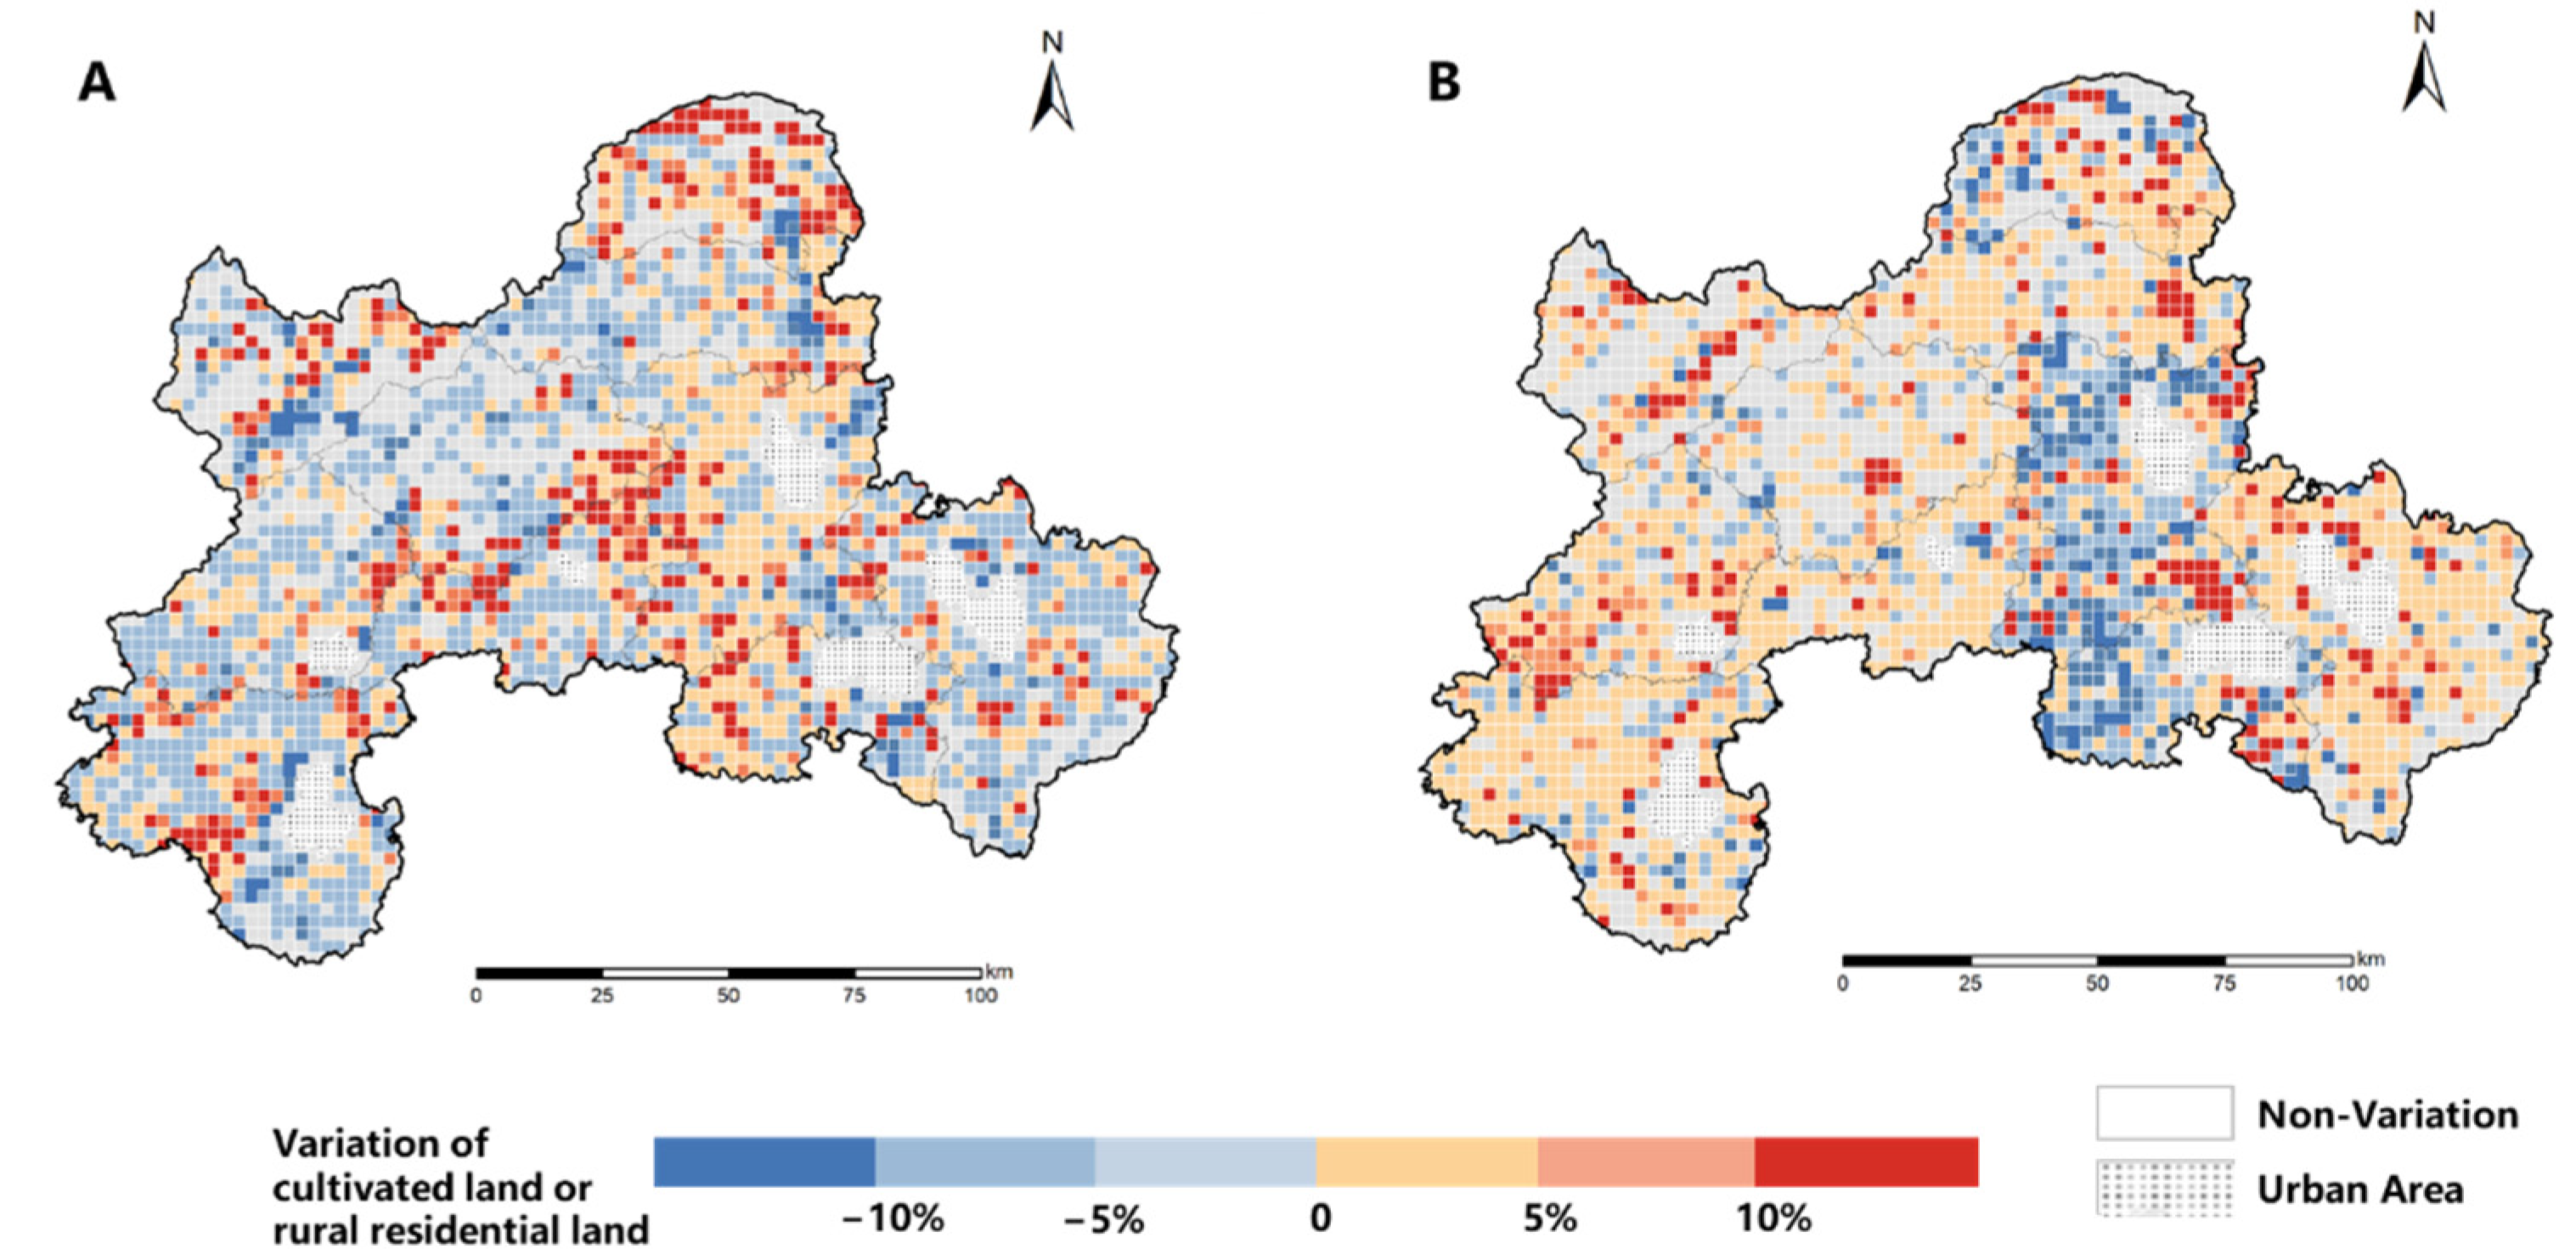
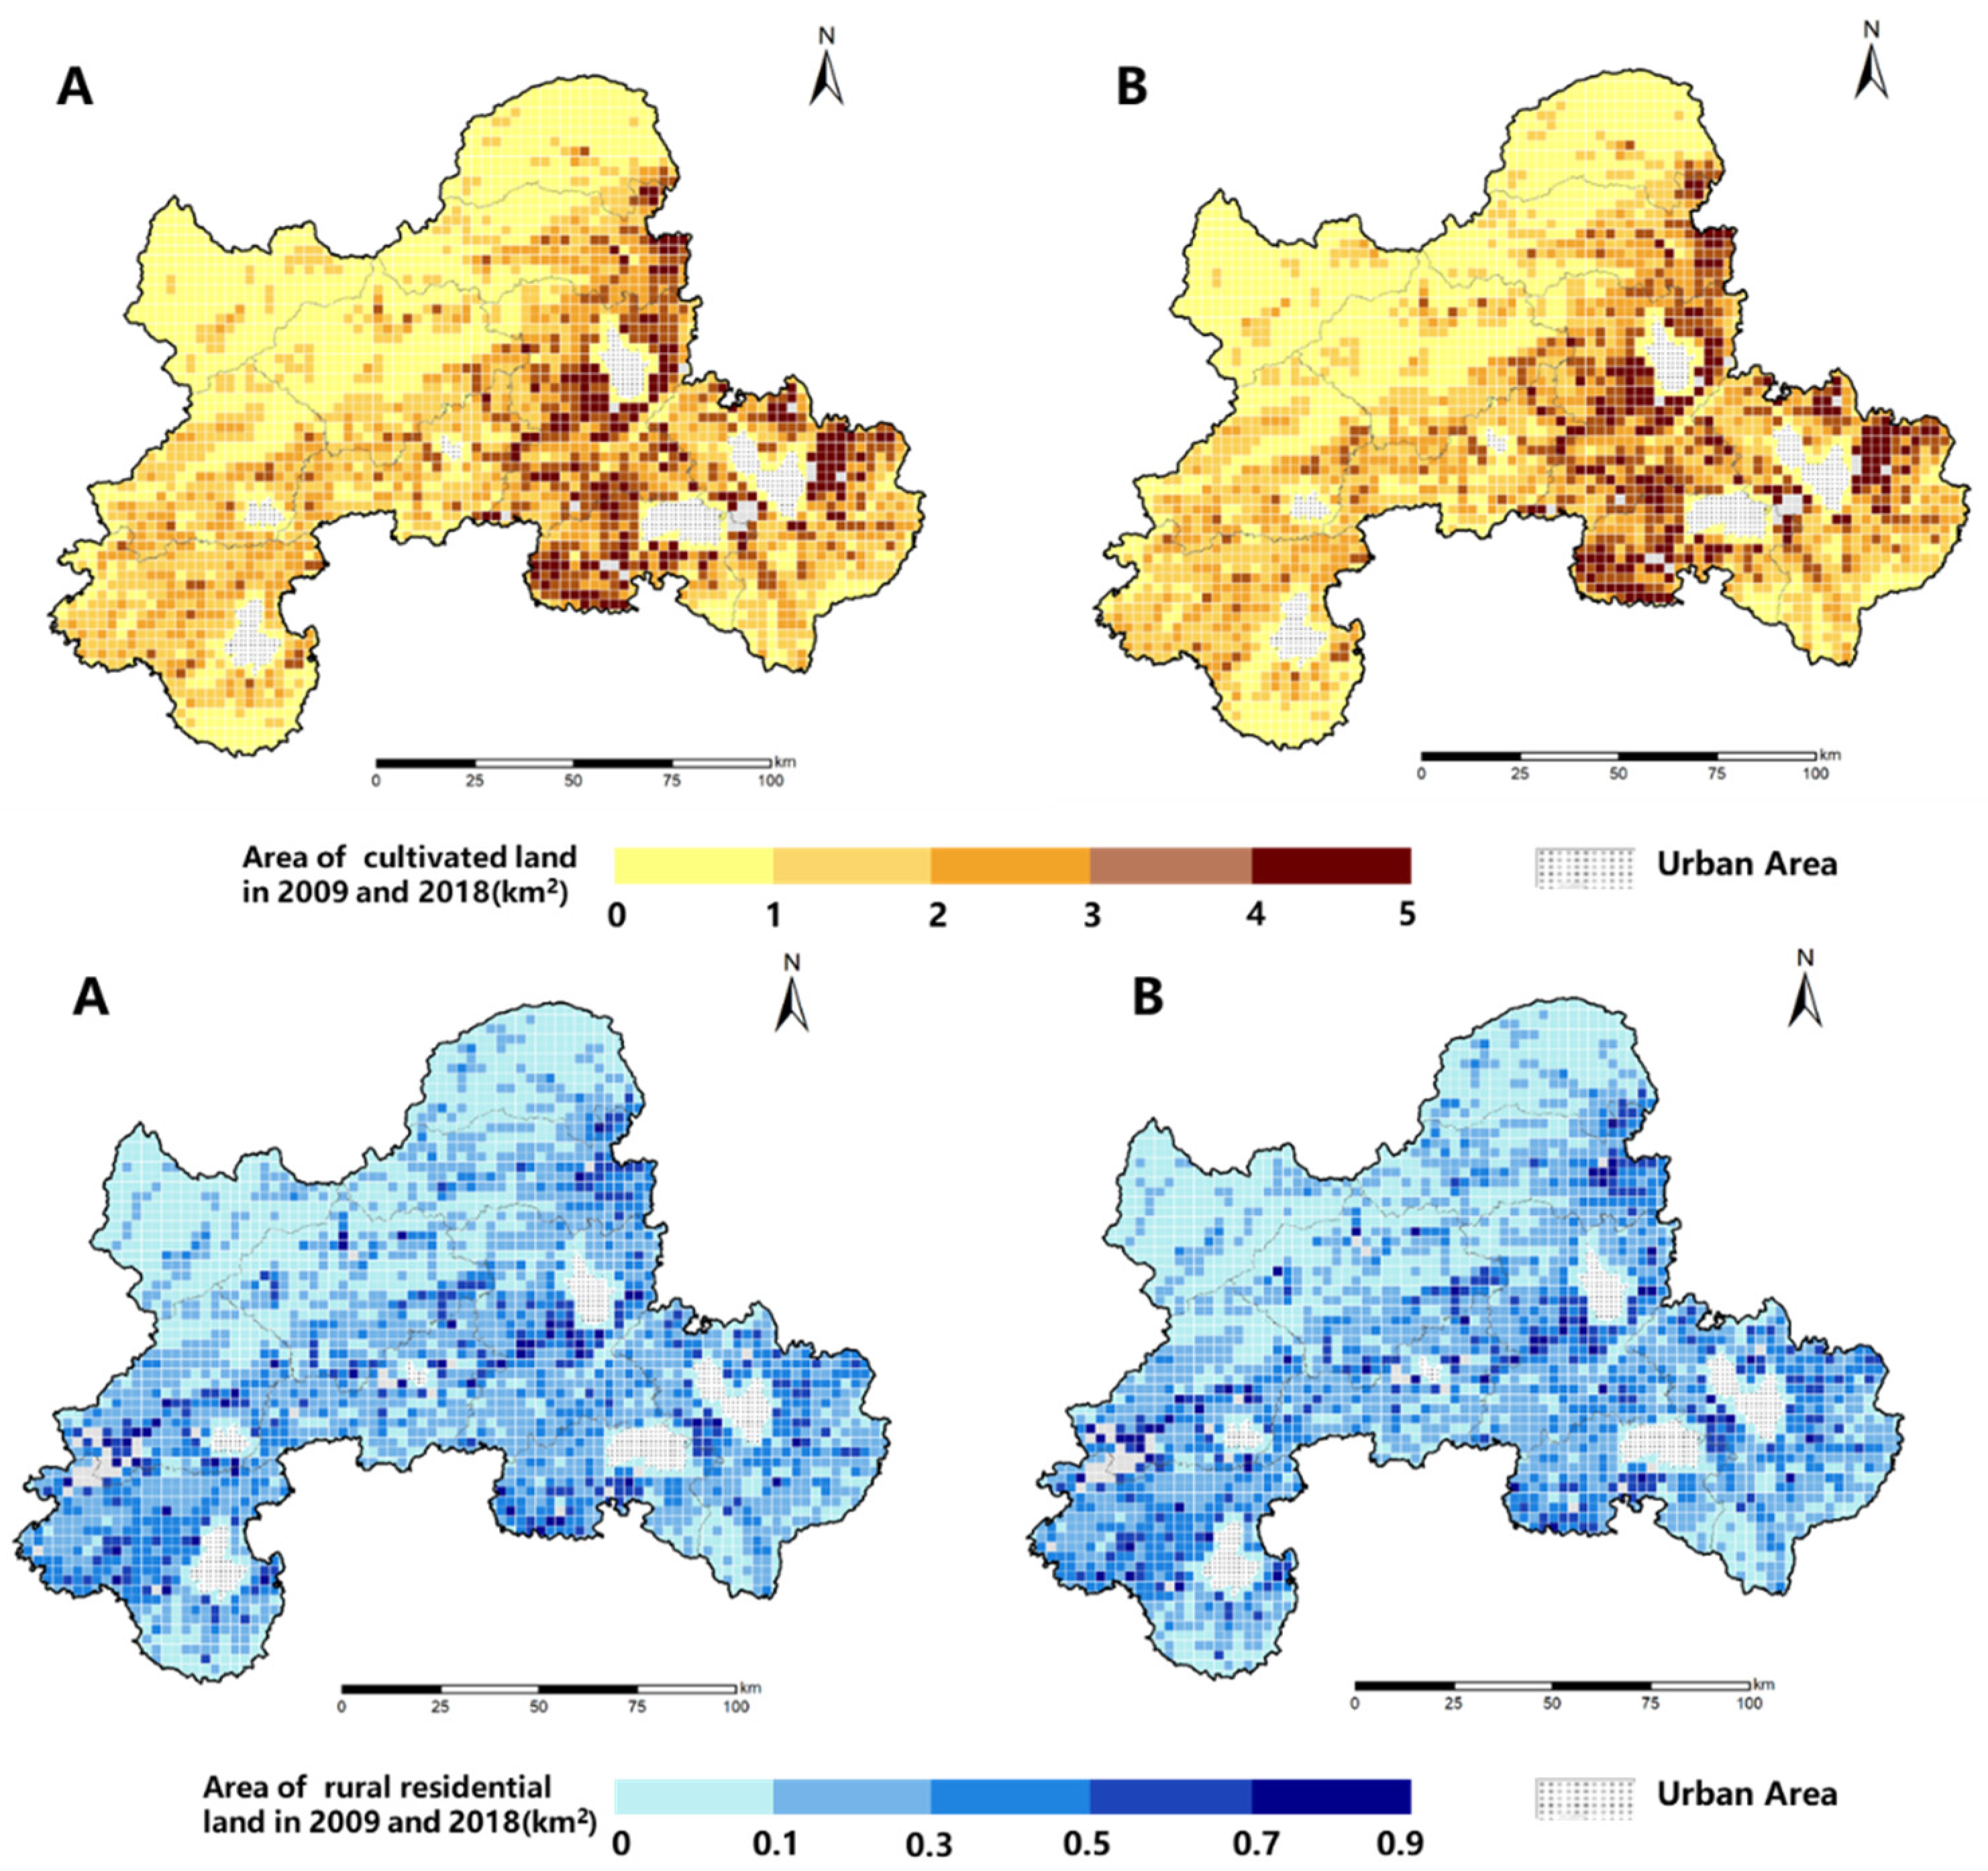
3.1. Spatio-Temporal Pattern of Cultivated Land and Rural Residential Land
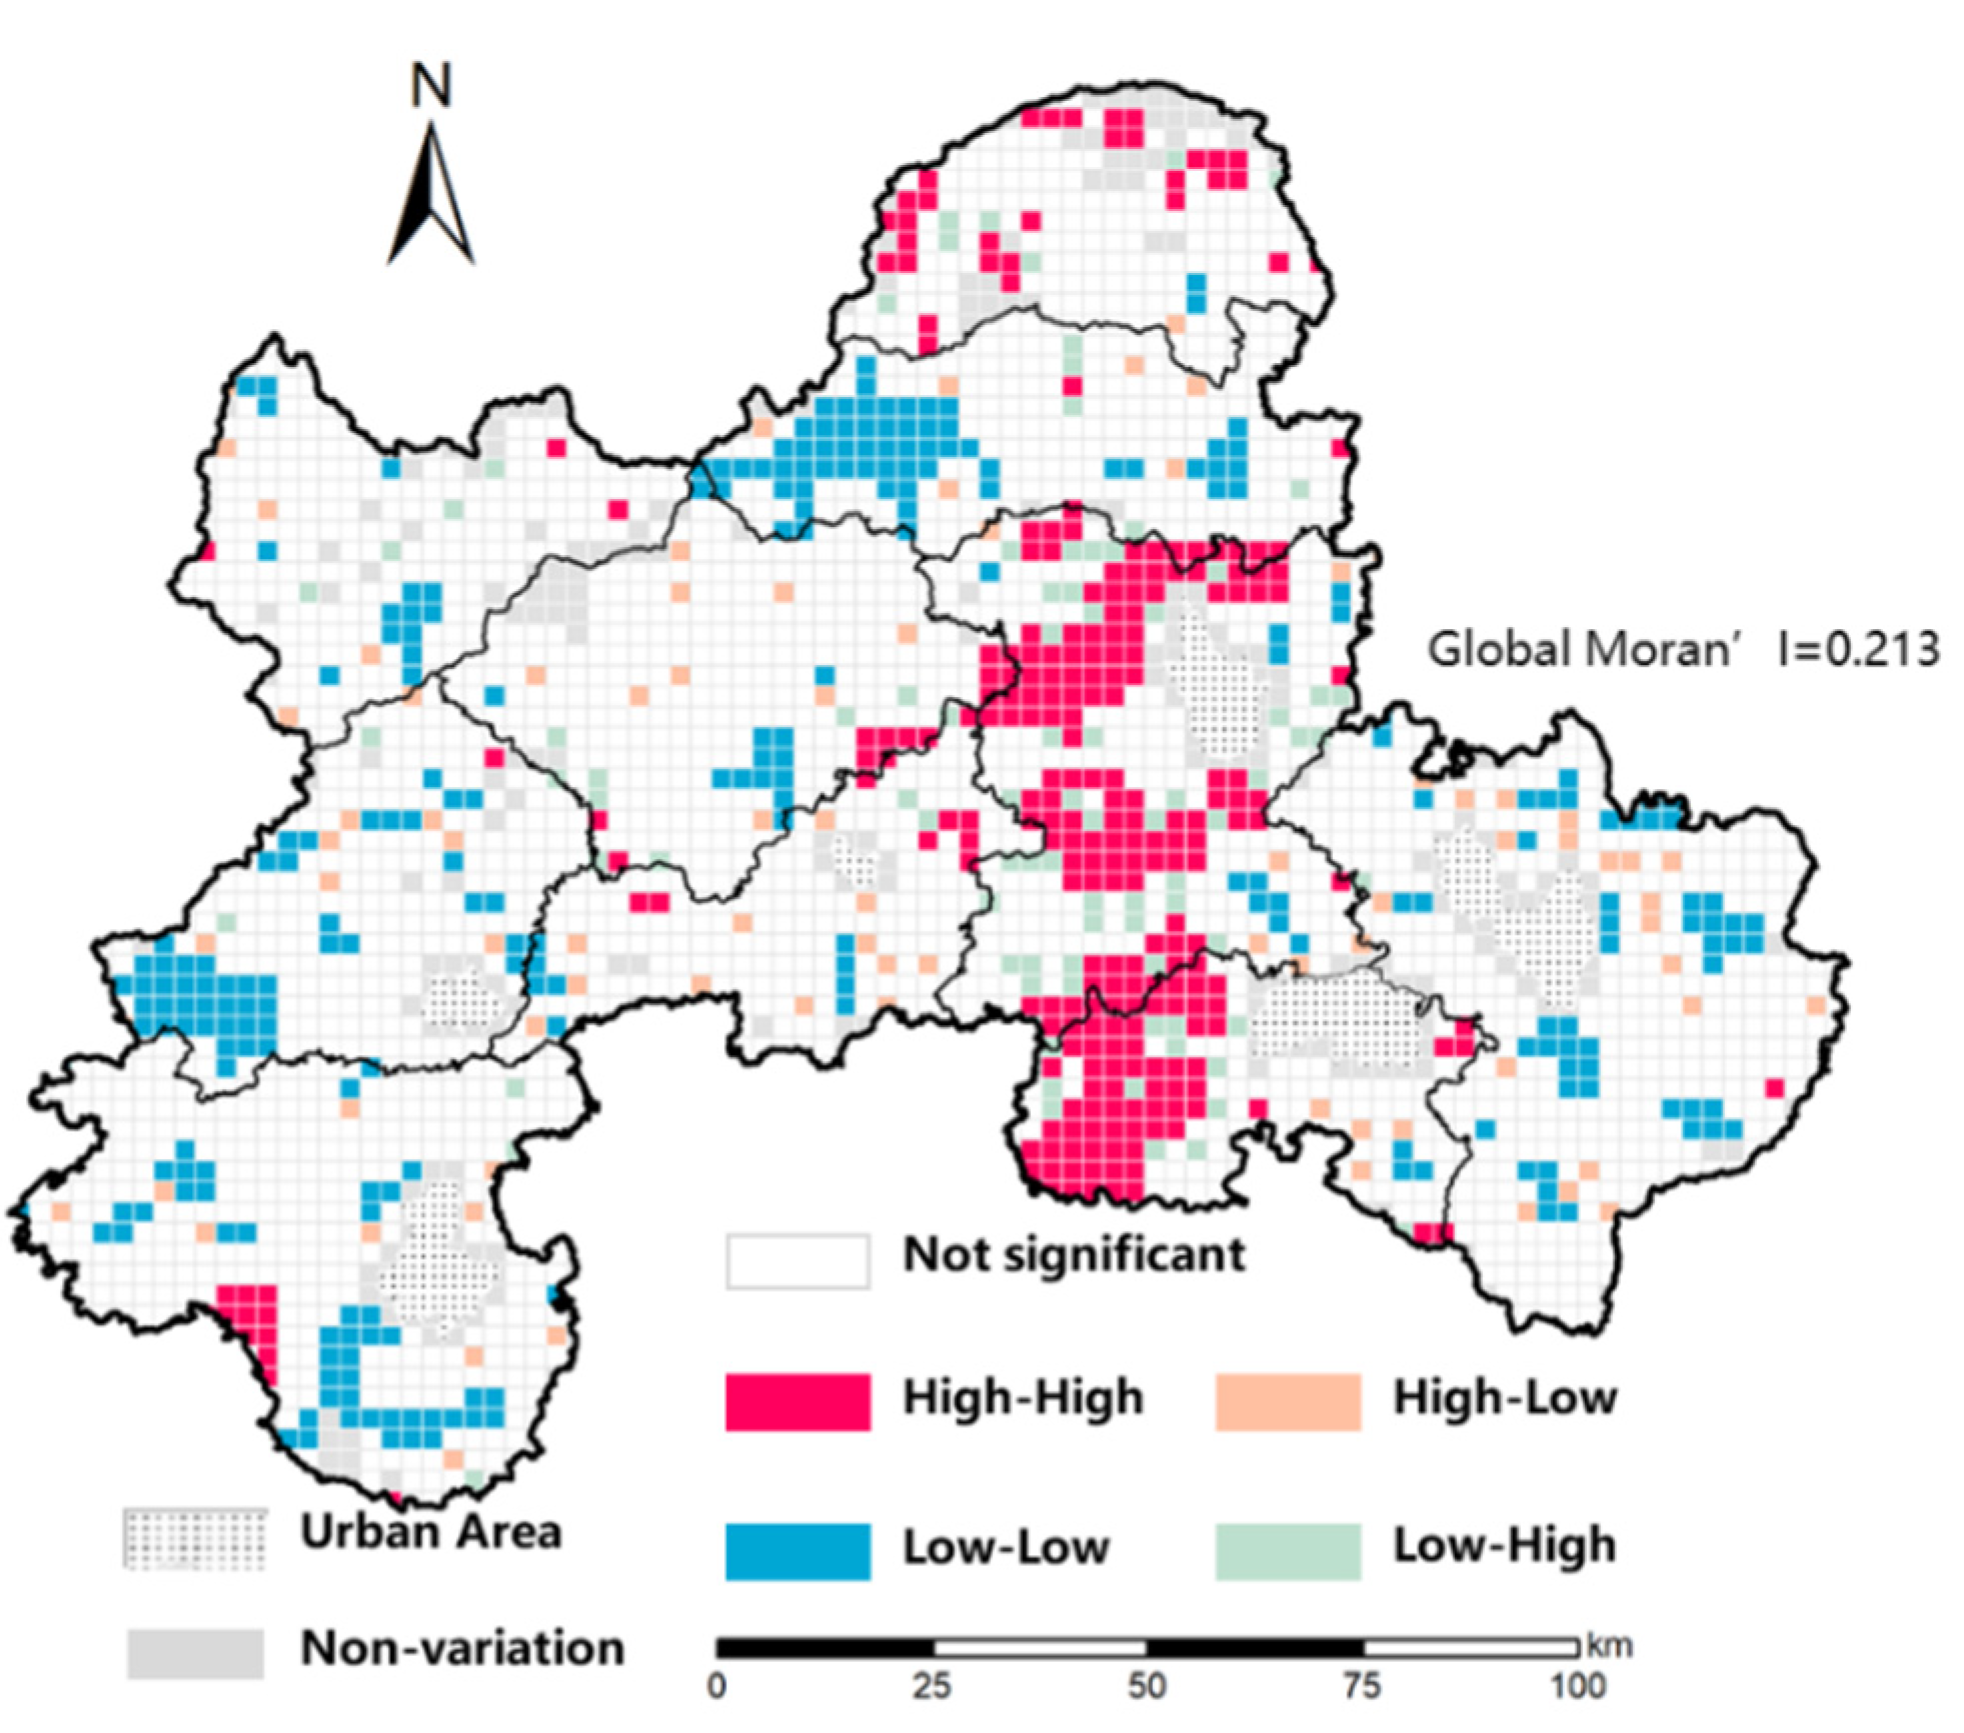
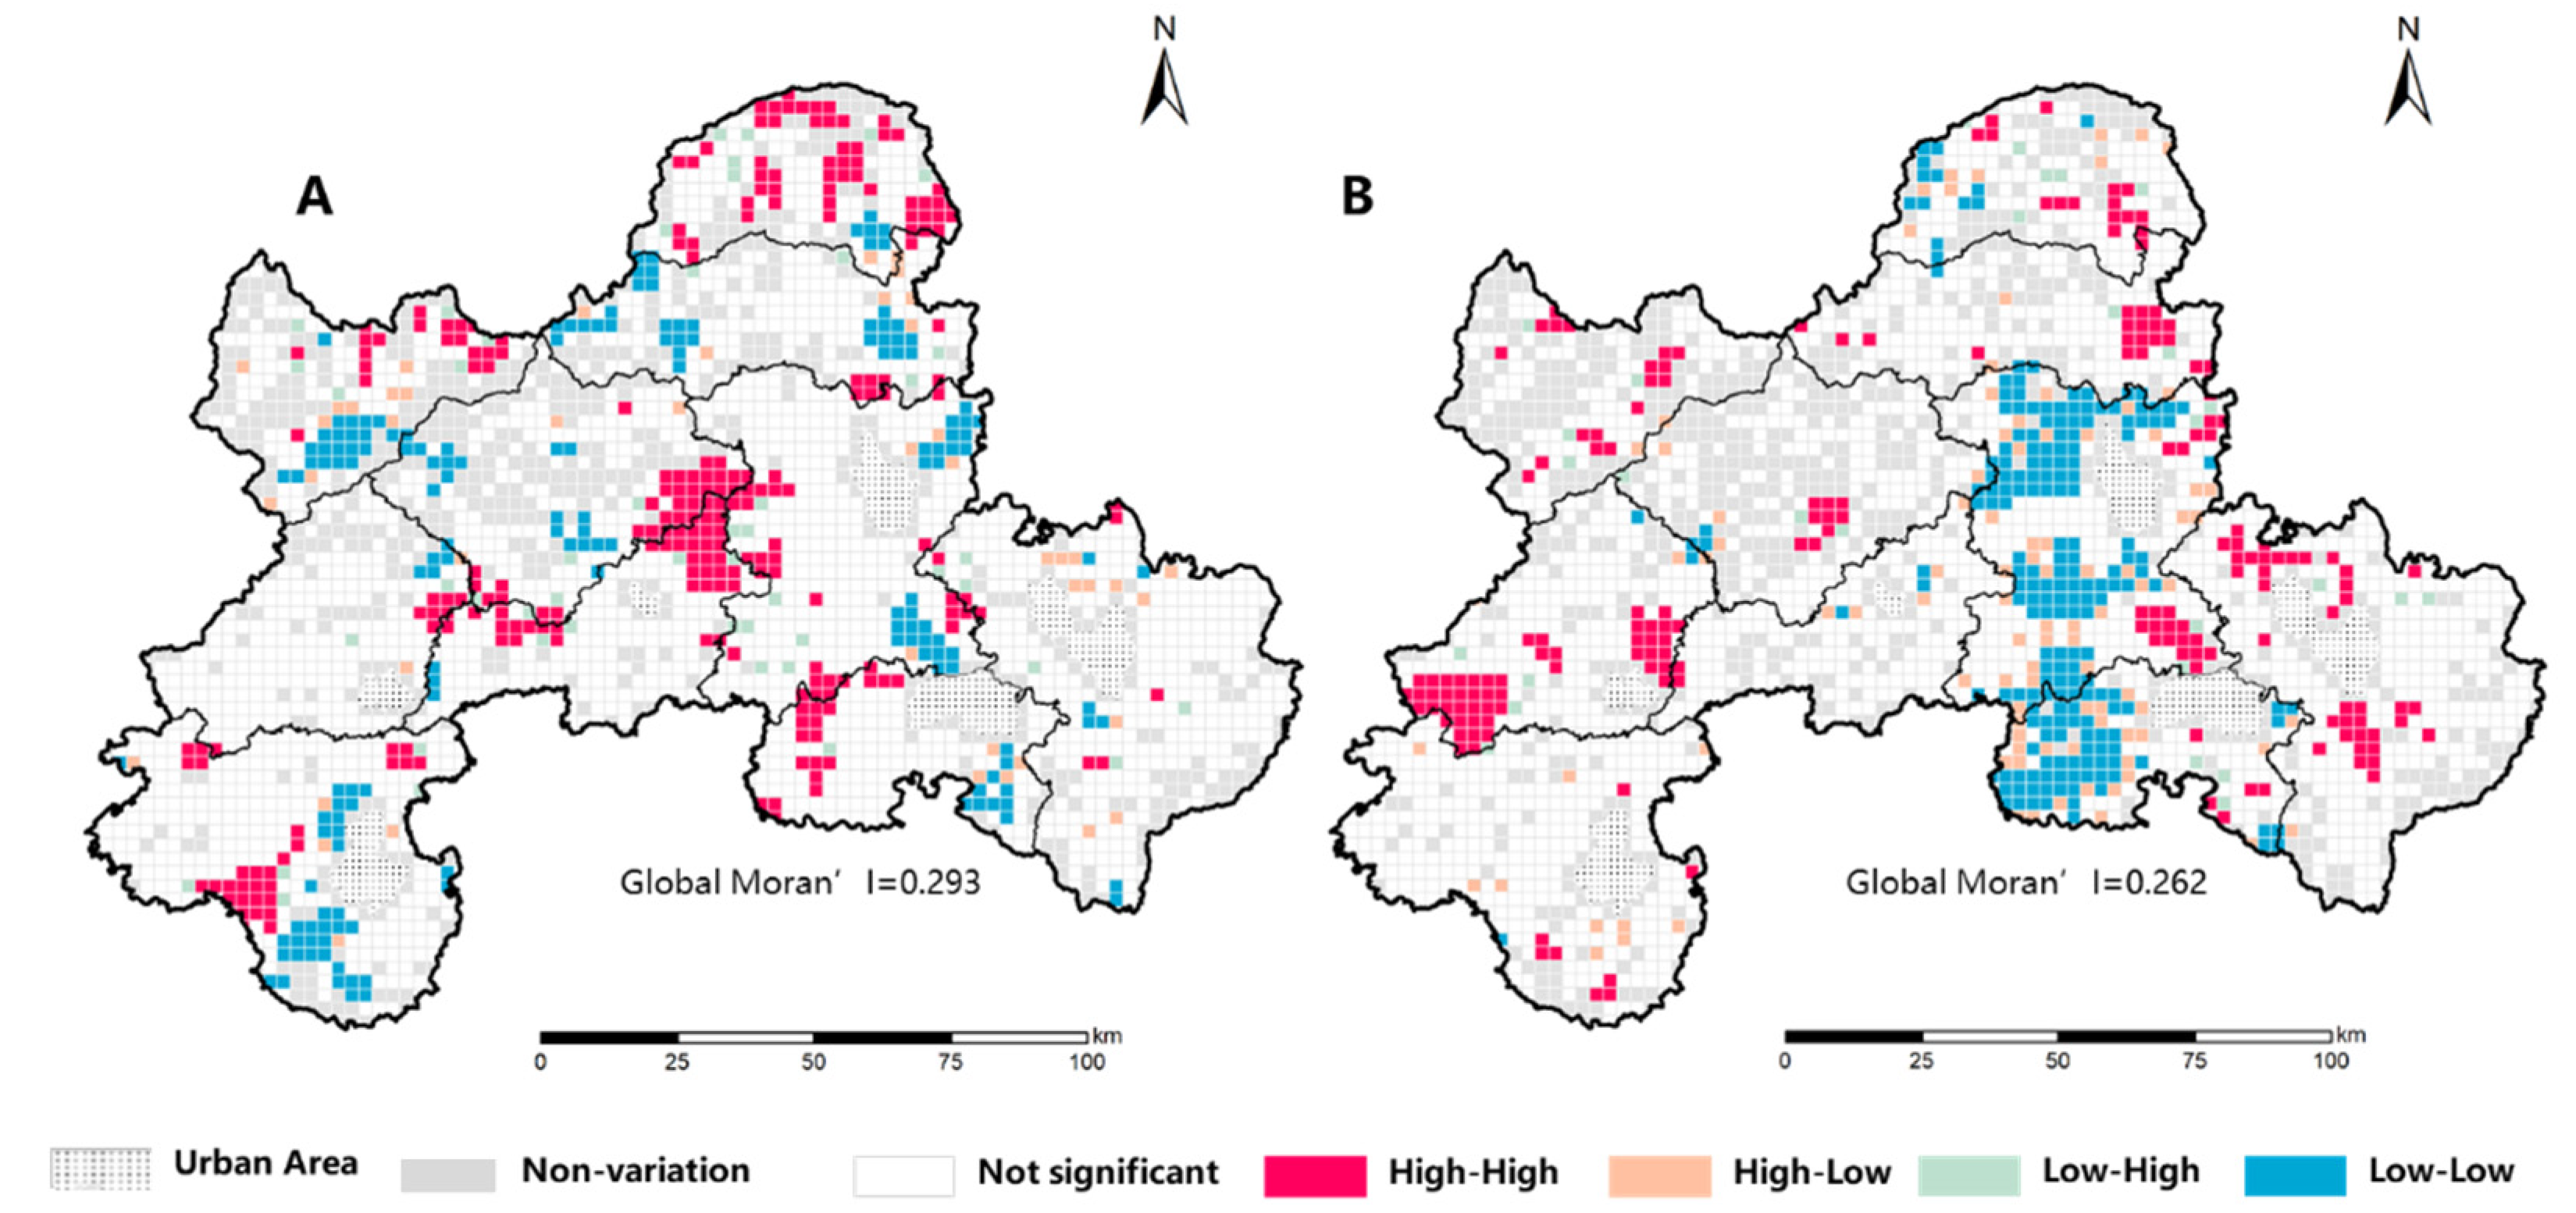
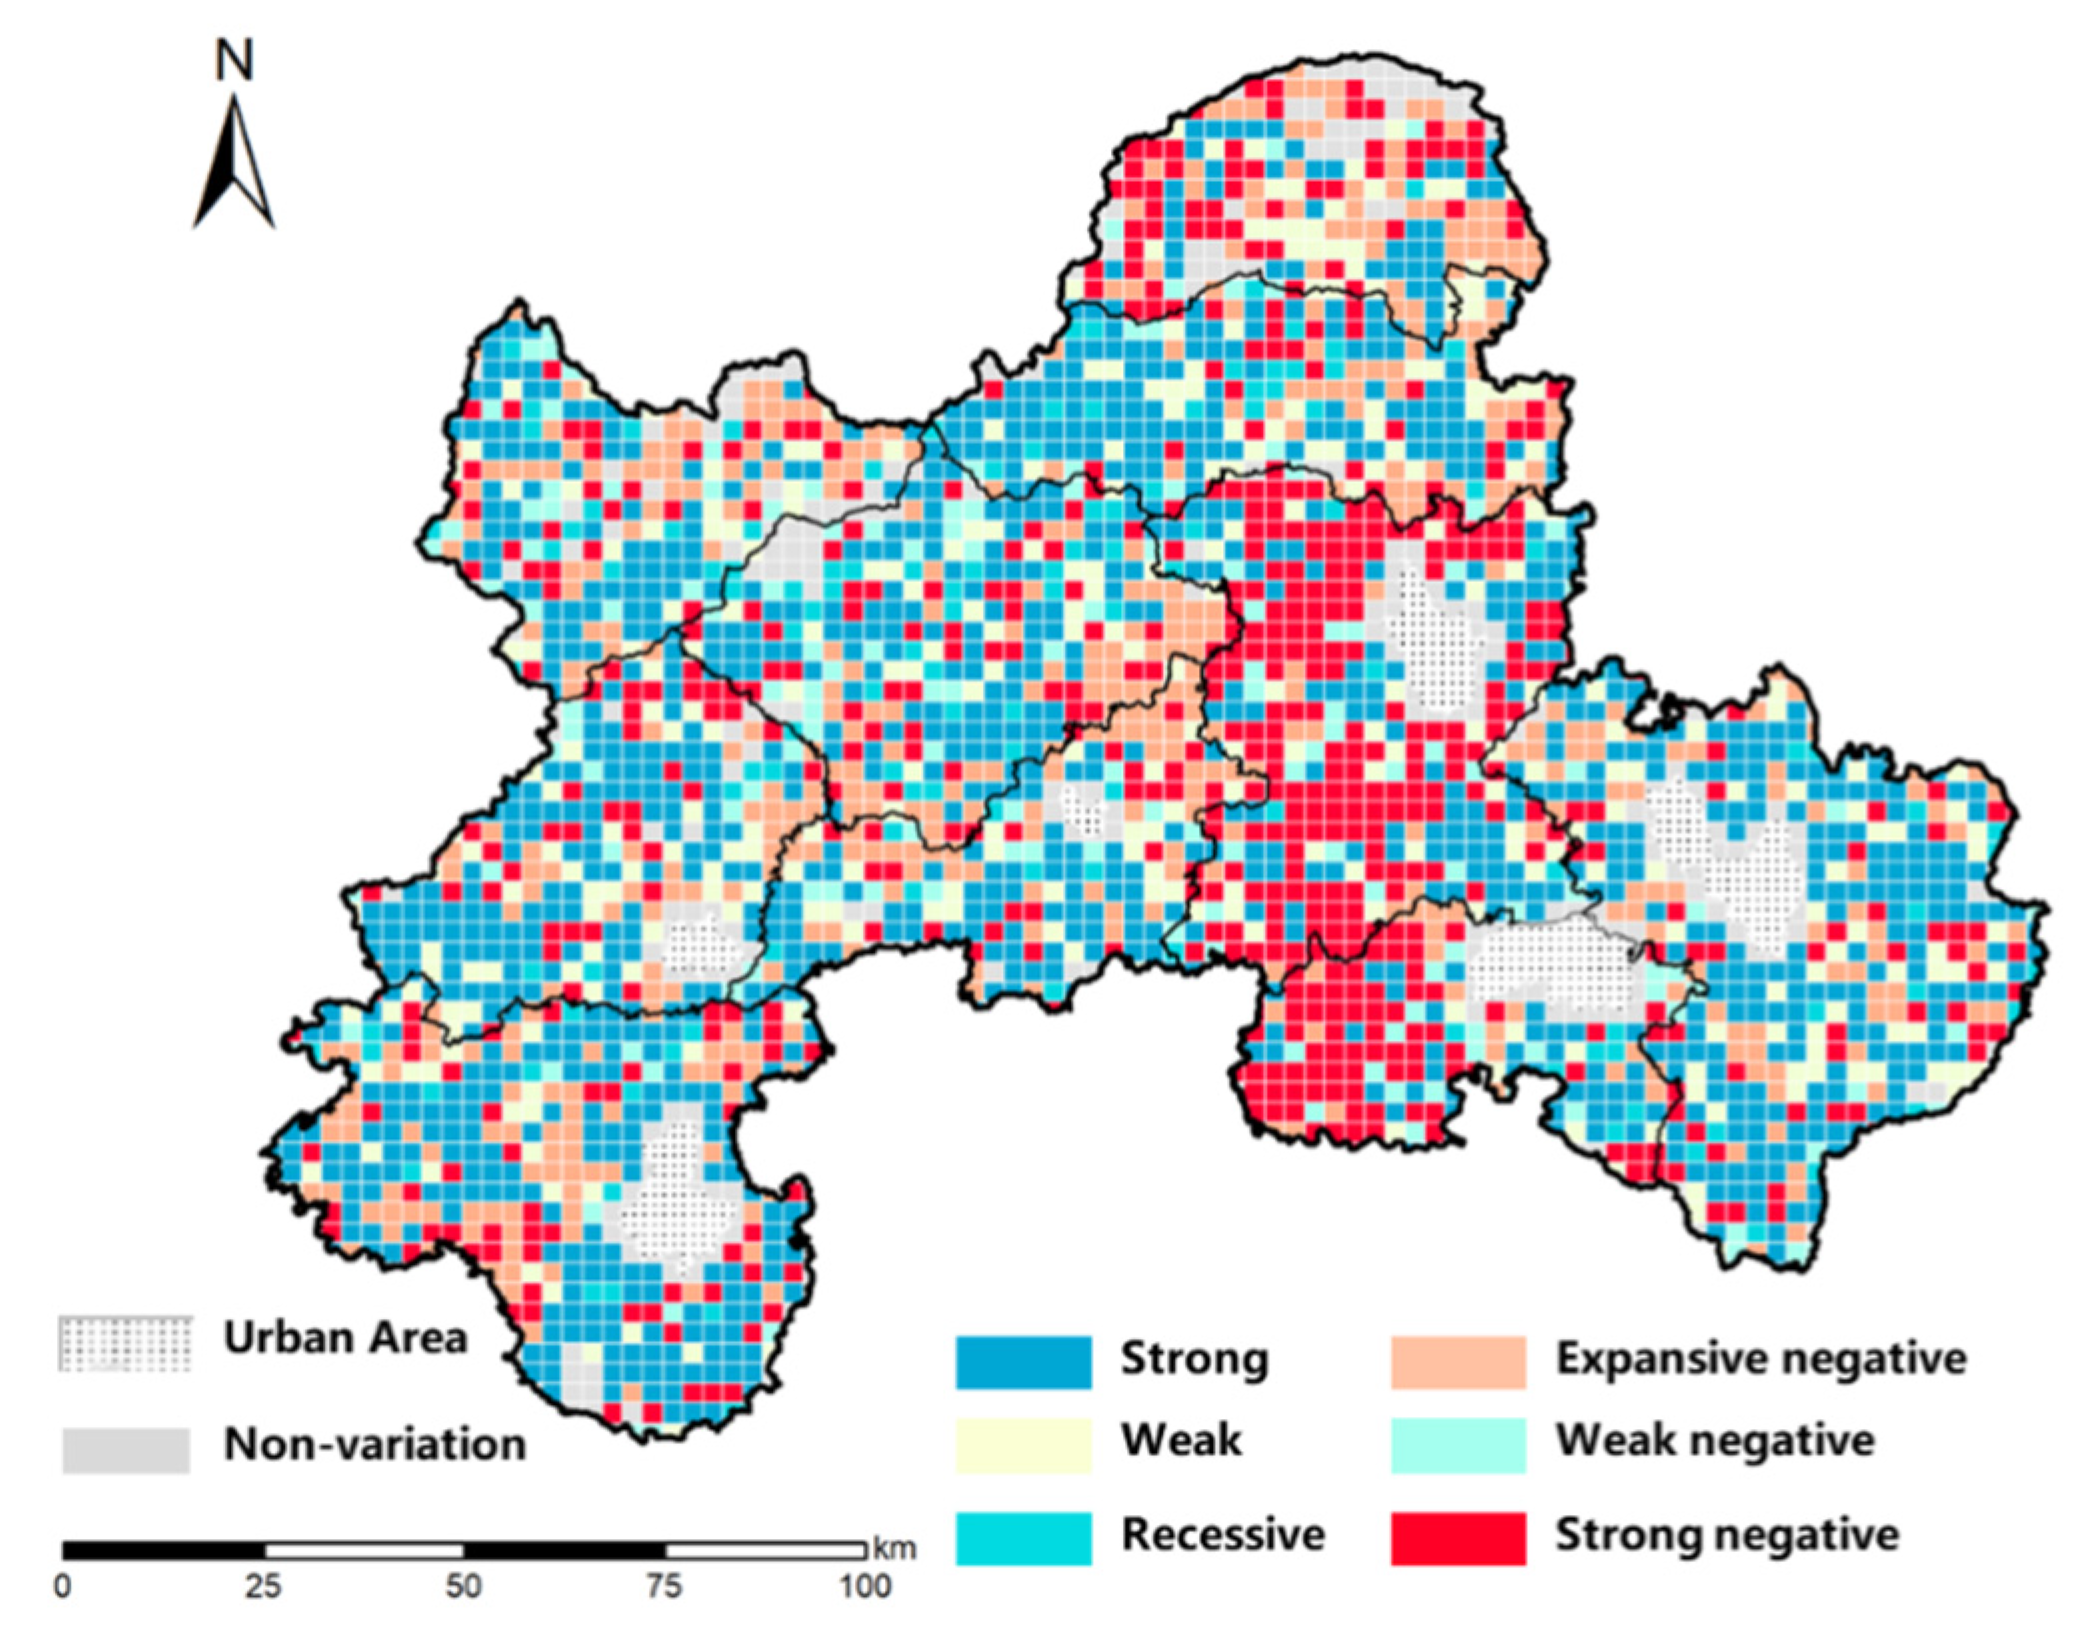
3.2. Matching Modes of Cultivated Land and Rural Residential Land
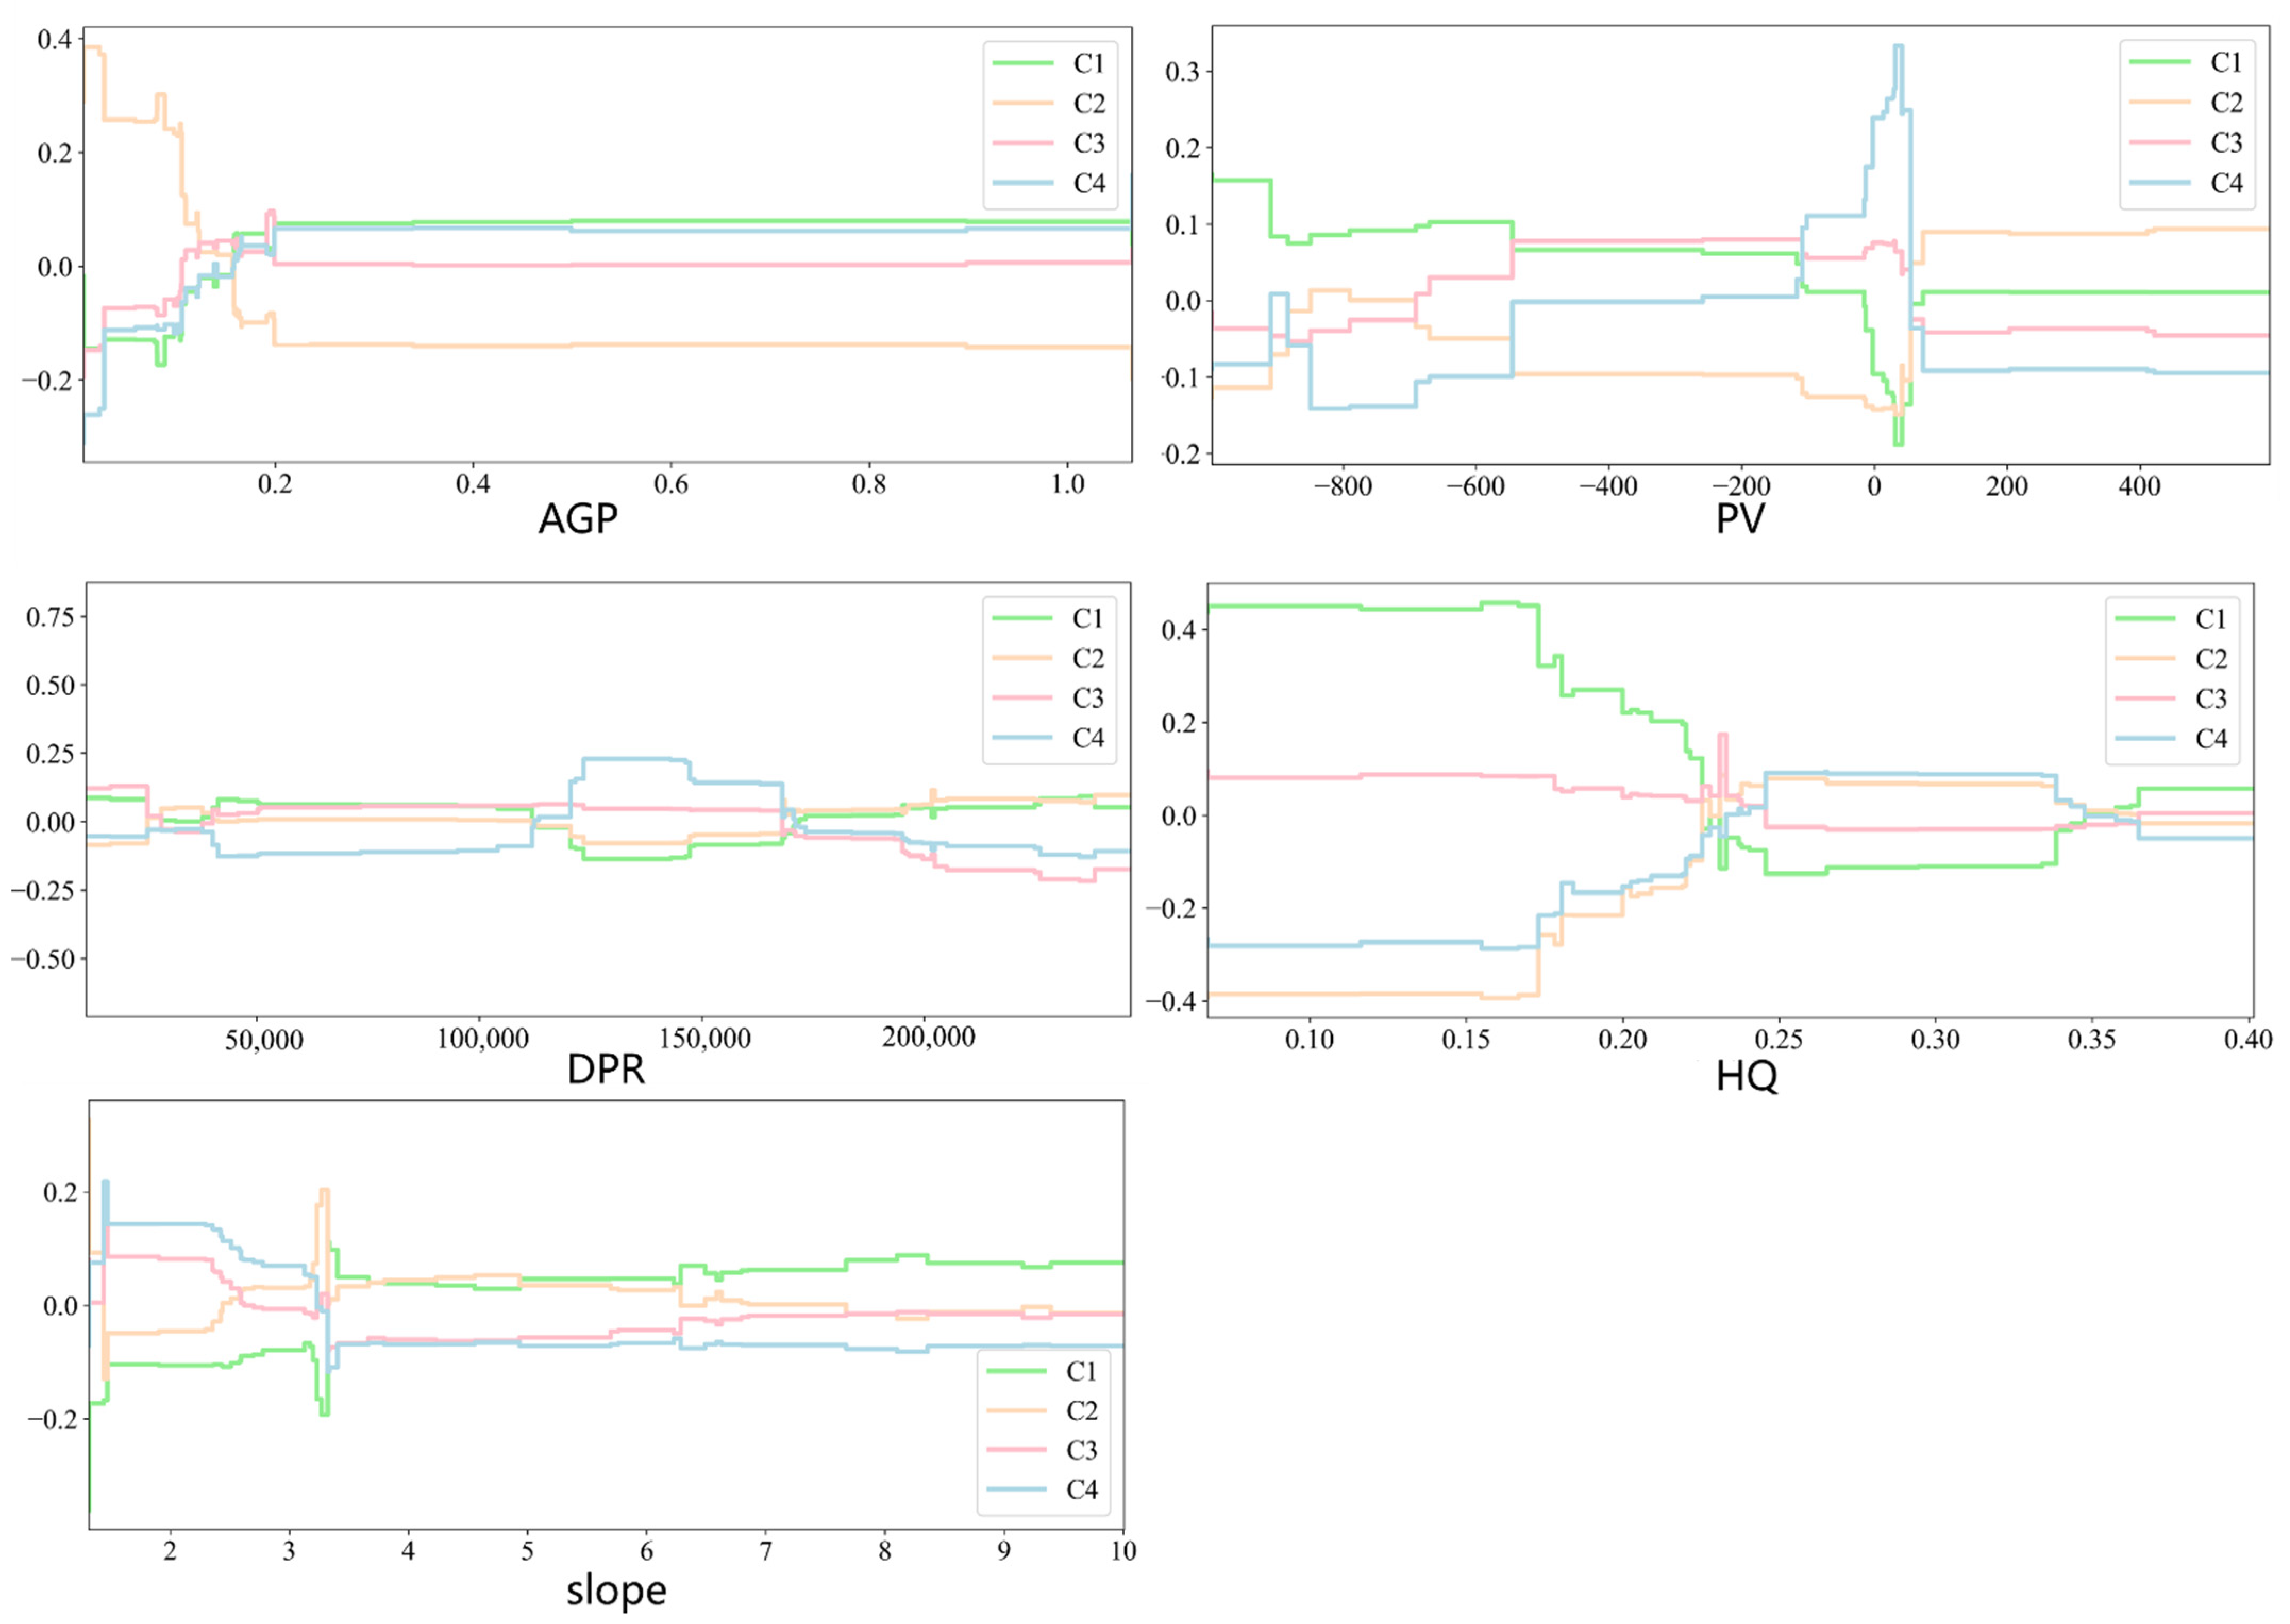
3.3. Key Variables on Matching Modes
4. Discussion
4.1. Basic Characteristics of Cultivated Land and Rural Residential Land
4.2. Formation Mechanism of Matching Modes
4.3. Corresponding Relationship and Response Strategies Based on Matching Modes and Human–Land Relationships
5. Conclusions
Author Contributions
Funding
Informed Consent Statement
Conflicts of Interest
References
- Liu, Y.; Liu, Y.; Zhai, R. Geographical research and optimizing practice of rural hollowing in China. Acta Geogr. Sin. 2009, 64, 1193–1202. [Google Scholar]
- Long, H.; Heilig, G.K.; Li, X.; Zhang, M. Socio-economic development and land-use change: Analysis of rural housing land transition in the Transect of the Yangtse River, China. Land Use Policy 2007, 24, 141–153. [Google Scholar] [CrossRef]
- Liu, Y.; Liu, Y.; Chen, Y.; Long, H. The process and driving forces of rural hollowing in China under rapid urbanization. J. Geogr. Sci. 2010, 20, 876–888. [Google Scholar] [CrossRef]
- Li, S.; Li, X. Global understanding of farmland abandonment: A review and prospects. J. Geogr. Sci. 2017, 27, 1123–1150. [Google Scholar] [CrossRef]
- Chaudhary, S.; Wang, Y.; Khanal, N.R.; Xu, P.; Fu, B.; Dixit, A.M.; Yan, K.; Liu, Q.; Lu, Y. Social Impact of Farmland Abandonment and Its Eco-Environmental Vulnerability in the High Mountain Region of Nepal: A Case Study of Dordi River Basin. Sustainability 2018, 10, 2331. [Google Scholar] [CrossRef] [Green Version]
- Ge, D.; Long, H.; Zhang, Y.; Ma, L.; Li, T. Farmland transition and its influences on grain production in China. Land Use Policy 2018, 70, 94–105. [Google Scholar] [CrossRef]
- Díaz, G.I.; Nahuelhual, L.; Echeverría, C.; Marín, S. Drivers of land abandonment in Southern Chile and implications for landscape planning. Landsc. Urban Plan. 2011, 99, 207–217. [Google Scholar] [CrossRef]
- Baumann, M.; Kuemmerle, T.; Elbakidze, M.; Ozdogan, M.; Radeloff, V.C.; Keuler, N.S.; Prishchepov, A.; Kruhlov, I.; Hostert, P. Patterns and drivers of post-socialist farmland abandonment in Western Ukraine. Land Use Policy 2011, 28, 552–562. [Google Scholar] [CrossRef]
- Tian, G.; Qiao, Z.; Gao, X. Rural settlement land dynamic modes and policy implications in Beijing metropolitan region, China. Habitat Int. 2014, 44, 237–246. [Google Scholar] [CrossRef]
- Song, W.; Li, H. Spatial pattern evolution of rural settlements from 1961 to 2030 in Tongzhou District, China. Land Use Policy 2020, 99, 105044. [Google Scholar] [CrossRef]
- Wen, Y.; Zhang, Z.; Liang, D.; Xu, Z. Rural Residential Land Transition in the Beijing-Tianjin-Hebei Region: Spatial-Temporal Patterns and Policy Implications. Land Use Policy 2020, 96, 104700. [Google Scholar] [CrossRef]
- Xia, Z.; Peng, Y.; Lin, C.; Wen, Y.; Liu, H.; Liu, Z. A spatial frequency/spectral indicator-driven model for estimating cultivated land quality using the gradient boosting decision tree and genetic algorithm-back propagation neural network. Int. Soil Water Conserv. Res. 2022, in press. [CrossRef]
- Su, K.; Hu, B.; Shi, K.; Zhang, Z.; Yang, Q. The structural and functional evolution of rural homesteads in mountainous areas: A case study of Sujiaying village in Yunnan province, China. Land Use Policy 2019, 88, 104100. [Google Scholar] [CrossRef]
- Liu, J.; Jin, X.; Xu, W.; Zhou, Y. Evolution of cultivated land fragmentation and its driving mechanism in rural development: A case study of Jiangsu Province. J. Rural Stud. 2022, 91, 58–72. [Google Scholar] [CrossRef]
- Wang, J.; Wang, S.; Zhou, C. Quantifying embodied cultivated land-use change and its socioeconomic driving forces in China. Appl. Geogr. 2021, 137, 102601. [Google Scholar] [CrossRef]
- Zhang, R.; Li, P.; Xu, L.; Zhong, S.; Wei, H. An integrated accounting system of quantity, quality and value for assessing cultivated land resource assets: A case study in Xinjiang, China. Glob. Ecol. Conserv. 2022, 36, e02115. [Google Scholar] [CrossRef]
- Tao, Z.; Guanghui, J.; Guangyong, L.; Dingyang, Z.; Yanbo, Q. Neglected idle rural residential land (IRRL) in metropolitan suburbs: Spatial differentiation and influencing factors. J. Rural Stud. 2020, 78, 163–175. [Google Scholar] [CrossRef]
- Tao, Z.; Guanghui, J.; Wenqiu, M.; Guangyong, L.; Yanbo, Q.; Yingying, T.; Qinglei, Z.; Yaya, T. Dying villages to prosperous villages: A perspective from revitalization of idle rural residential land (IRRL). J. Rural Stud. 2021, 84, 45–54. [Google Scholar] [CrossRef]
- Lyu, X.; Peng, W.; Niu, S.; Qu, Y.; Xin, Z. Evaluation of sustainable intensification of cultivated land use according to farming households’ livelihood types. Ecol. Indic. 2022, 138, 108848. [Google Scholar] [CrossRef]
- Yang, B.; Wang, Z.; Zou, L.; Zou, L.; Zhang, H. Exploring the eco-efficiency of cultivated land utilization and its influencing factors in China’s Yangtze River Economic Belt, 2001–2018. J. Environ. Manag. 2021, 294, 112939. [Google Scholar] [CrossRef]
- Zhao, L.; Wang, X. Rural Housing Vacancy in Metropolitan Suburbs and Its Influencing Factors: A Case Study of Nanjing, China. Sustainability 2021, 13, 3783. [Google Scholar] [CrossRef]
- Liu, Y.; Liu, S.; Sun, Y.; Wang, F.; Li, M. Driving forces of cultivated land evolution in agro-pastoral areas on the Qinghai-Tibet Plateau based on ecological niche theory. J. Clean. Prod. 2021, 313, 127899. [Google Scholar] [CrossRef]
- Min, M.; Miao, C.; Duan, X.; Yan, W. Formation mechanisms and general characteristics of cultivated land use patterns in the Chaohu Lake Basin, China. Land Use Policy 2022, 117, 106093. [Google Scholar] [CrossRef]
- Li, J.; Lo, K.; Zhang, P.; Guo, M. Reclaiming small to fill large: A novel approach to rural residential land consolidation in China. Land Use Policy 2021, 109, 105706. [Google Scholar] [CrossRef]
- Qu, Y.; Jiang, G.; Zhao, Q.; Ma, W.; Zhang, R.; Yang, Y. Geographic identification, spatial differentiation, and formation mechanism of multifunction of rural settlements: A case study of 804 typical villages in Shandong Province, China. J. Clean. Prod. 2017, 166, 1202–1215. [Google Scholar] [CrossRef]
- Wang, L.; Zheng, W.; Tang, L.; Zhang, S.; Liu, Y.; Ke, X. Spatial optimization of urban land and cropland based on land production capacity to balance cropland protection and ecological conservation. J. Environ. Manag. 2021, 285, 112054. [Google Scholar] [CrossRef]
- Chen, L.; Zhao, H.; Song, G.; Liu, Y. Optimization of cultivated land pattern for achieving cultivated land system security: A case study in Heilongjiang Province, China. Land Use Policy 2021, 108, 105589. [Google Scholar] [CrossRef]
- Zhou, Y.; Li, X.; Liu, Y. Cultivated land protection and rational use in China. Land Use Policy 2021, 106, 105454. [Google Scholar] [CrossRef]
- Li, K.; Wang, J.; Zhang, Y. Heavy metal pollution risk of cultivated land from industrial production in China: Spatial pattern and its enlightenment. Sci. Total Environ. 2022, 828, 154382. [Google Scholar] [CrossRef]
- Li, Q.; Liu, G. Is land nationalization more conducive to sustainable development of cultivated land and food security than land privatization in post-socialist Central Asia? Glob. Food Secur. 2021, 30, 100560. [Google Scholar] [CrossRef]
- Xu, D.; Deng, X.; Huang, K.; Liu, Y.; Yong, Z.; Liu, S. Relationships between labor migration and cropland abandonment in rural China from the perspective of village types. Land Use Policy 2019, 88, 104164. [Google Scholar] [CrossRef]
- Li, D.; Yang, Y.; Du, G.; Huang, S. Understanding the contradiction between rural poverty and rich cultivated land resources: A case study of Heilongjiang Province in Northeast China. Land Use Policy 2021, 108, 105673. [Google Scholar] [CrossRef]
- Zhang, Y.; Li, X.; Song, W. Determinants of cropland abandonment at the parcel, household and village levels in mountain areas of China: A multi-level analysis. Land Use Policy 2014, 41, 186–192. [Google Scholar] [CrossRef]
- Yanbo, Q.; Guanghui, J.; Wenqiu, M.; Zitong, L. How does the rural settlement transition contribute to shaping sustainable rural development? Evidence from Shandong, China. J. Rural Stud. 2021, 82, 279–293. [Google Scholar] [CrossRef]
- Shi, T.; Li, X.; Xin, L.; Xu, X. The spatial distribution of farmland abandonment and its influential factors at the township level: A case study in the mountainous area of China. Land Use Policy 2018, 70, 510–520. [Google Scholar] [CrossRef]
- Liang, X.; Li, Y.; Zhou, Y. Study on the abandonment of sloping farmland in Fengjie County, Three Gorges Reservoir Area, a mountainous area in China. Land Use Policy 2020, 97, 104760. [Google Scholar] [CrossRef]
- Gao, X.; Xu, A.; Liu, L.; Deng, O.; Zeng, M.; Ling, J.; Wei, Y. Understanding rural housing abandonment in China’s rapid urbanization. Habitat Int. 2017, 67, 13–21. [Google Scholar] [CrossRef]
- Wang, C.; Gao, B.; Weng, Z.; Tian, Y. Primary causes of total hamlet abandonment for different types of hamlets in remote mountain areas of China: A case study of Shouning County, Fujian Province. Land Use Policy 2020, 95, 104627. [Google Scholar] [CrossRef]
- Long, H.; Li, T. The coupling characteristics and mechanism of farmland and rural housing land transition in China. J. Geogr. Sci. 2012, 22, 548–562. [Google Scholar] [CrossRef]
- Qu, Y.; Jiang, G.-h.; Li, Z.; Tian, Y.; Wei, S. Understanding rural land use transition and regional consolidation implications in China. Land Use Policy 2019, 82, 742–753. [Google Scholar] [CrossRef]
- Long, H. Coupling Analysis of Farmland and Rural Housing Land Transitions in China; Springer: Berlin/Heidelberg, Germany, 2020; pp. 235–288. [Google Scholar] [CrossRef]
- Ge, D.; Wang, Z.; Tu, S.; Long, H.; Yan, H.; Sun, D.; Qiao, W. Coupling analysis of greenhouse-led farmland transition and rural transformation development in China’s traditional farming area: A case of Qingzhou City. Land Use Policy 2019, 86, 113–125. [Google Scholar] [CrossRef]
- Liu, Y.; Long, H. Land use transitions and their dynamic mechanism: The case of the Huang-Huai-Hai Plain. J. Geogr. Sci. 2016, 26, 515–530. [Google Scholar] [CrossRef] [Green Version]
- Turner Ii, B.L.; Skole, D.; Sanderson, S.; Fischer, G.; Fresco, L.O.; Leemans, R. Land-Use and Land-Cover Change: Science/Research Plan; IGBP Report No. 35/HDP Report No. 7; IGBP: Stockholm, Sweden, 1995; p. 132. [Google Scholar]
- Mi, J.-X.; Li, A.-D.; Zhou, L.-F. Review Study of Interpretation Methods for Future Interpretable Machine Learning. IEEE Access 2020, 8, 191969–191985. [Google Scholar] [CrossRef]
- Tu, M.; Li, W.; Orfila, O.; Li, Y.; Gruyer, D. Exploring nonlinear effects of the built environment on ridesplitting: Evidence from Chengdu. Transp. Res. Part D Transp. Environ. 2021, 93, 102776. [Google Scholar] [CrossRef]
- Tao, T.; Wang, J.; Cao, X. Exploring the non-linear associations between spatial attributes and walking distance to transit. J. Transp. Geogr. 2020, 82, 102560. [Google Scholar] [CrossRef]
- Ding, C.; Cao, X.; Liu, C. How does the station-area built environment influence Metrorail ridership? Using gradient boosting decision trees to identify non-linear thresholds. J. Transp. Geogr. 2019, 77, 70–78. [Google Scholar] [CrossRef]
- Gong, J.; Jian, Y.; Chen, W.; Liu, Y.; Hu, Y. Transitions in rural settlements and implications for rural revitalization in Guangdong Province. J. Rural Stud. 2019, 93, 359–366. [Google Scholar] [CrossRef]
- Wang, D.; Yujia, Z.; Meifeng, Z.; Qingyue, L. Multi-dimensional hollowing characteristics of traditional villages and its influence mechanism based on the micro-scale: A case study of Dongcun Village in Suzhou, China. Land Use Policy 2020, 101, 105146. [Google Scholar] [CrossRef]
- Yan, J.; Yang, Z.; Li, Z.; Li, X.; Xin, L.; Sun, L. Drivers of cropland abandonment in mountainous areas: A household decision model on farming scale in Southwest China. Land Use Policy 2016, 57, 459–469. [Google Scholar] [CrossRef] [Green Version]
- Carter, A. The Economics of Technological Change. Sci. Am. 1966, 214, 25–31. [Google Scholar] [CrossRef]
- Tapio, P. Towards a theory of decoupling: Degrees of decoupling in the EU and the case of road traffic in Finland between 1970 and 2001. Transp. Policy 2005, 12, 137–151. [Google Scholar] [CrossRef] [Green Version]
- Liu, Y.; Cai, E.; Jing, Y.; Gong, J.; Wang, Z. Analyzing the Decoupling between Rural-to-Urban Migrants and Urban Land Expansion in Hubei Province, China. Sustainability 2018, 10, 345. [Google Scholar] [CrossRef] [Green Version]
- Song, W.; Liu, M. Assessment of decoupling between rural settlement area and rural population in China. Land Use Policy 2014, 39, 331–341. [Google Scholar] [CrossRef]
- Tian, J.; Wang, B.; Zhang, C.; Li, W.; Wang, S. Mechanism of regional land use transition in underdeveloped areas of China: A case study of northeast China. Land Use Policy 2020, 94, 104538. [Google Scholar] [CrossRef]
- Xu, M.; Zhang, Z. Spatial differentiation characteristics and driving mechanism of rural-industrial Land transition: A case study of Beijing-Tianjin-Hebei region, China. Land Use Policy 2021, 102, 105239. [Google Scholar] [CrossRef]
- Zhang, Y.; Liu, Y.; Pan, J.; Zhang, Y.; Liu, D.; Chen, H.; Wei, J.; Zhang, Z.; Liu, Y. Exploring Spatially Non-Stationary and Scale-Dependent Responses of Ecosystem Services to Urbanization in Wuhan, China. Int. J. Environ. Res. Public Health 2020, 17, 2989. [Google Scholar] [CrossRef]
- Yang, Z.; Wang, S.; Guo, M.; Tian, J.; Zhang, Y. Spatiotemporal Differentiation of Territorial Space Development Intensity and Its Habitat Quality Response in Northeast China. Land 2021, 10, 573. [Google Scholar] [CrossRef]
- Yang, Y. Evolution of habitat quality and association with land-use changes in mountainous areas: A case study of the Taihang Mountains in Hebei Province, China. Ecol. Indic. 2021, 129, 107967. [Google Scholar] [CrossRef]
- Li, T.; Long, H.; Liu, Y.; Tu, S. Multi-scale analysis of rural housing land transition under China’s rapid urbanization: The case of Bohai Rim. Habitat Int. 2015, 48, 227–238. [Google Scholar] [CrossRef]
- He, X.; Chen, C.; He, M.; Chen, Q.; Zhang, J.; Li, G.; Wang, Z.; Mao, Y.; Dong, J. Landscape index for indicating water quality and application to master plan of regional lake cluster restoration. Ecol. Indic. 2021, 126, 107668. [Google Scholar] [CrossRef]
- Tang, J.; Li, Y.; Cui, S.; Xu, L.; Ding, S.; Nie, W. Linking land-use change, landscape patterns, and ecosystem services in a coastal watershed of southeastern China. Glob. Ecol. Conserv. 2020, 23, e01177. [Google Scholar] [CrossRef]
- Yu, Z.; Liu, L.; Zhang, H.; Liang, J. Exploring the Factors Driving Seasonal Farmland Abandonment: A Case Study at the Regional Level in Hunan Province, Central China. Sustainability 2017, 9, 187. [Google Scholar] [CrossRef] [Green Version]
- Zhang, L.; Lu, W.; Hou, G.; Gao, H.; Liu, H.; Zheng, Y. Coupled analysis on land use, landscape pattern and nonpoint source pollution loads in Shitoukoumen Reservoir watershed, China. Sustain. Cities Soc. 2019, 51, 101788. [Google Scholar] [CrossRef]
- Lou, Y.; Caruana, R.; Gehrke, J. Intelligible models for classification and regression. In Proceedings of the ACM SIGKDD International Conference on Knowledge Discovery and Data Mining, Beijing, China, 12–16 August 2012. [Google Scholar]
- Zhang, X.; Tan, S.; Koch, P.; Lou, Y.; Chajewska, U.; Caruana, R. Axiomatic Interpretability for Multiclass Additive Models. In Proceedings of the 25th ACM SIGKDD International Conference on Knowledge Discovery & Data Mining, Anchorage, AK, USA, 4–8 August 2019. [Google Scholar] [CrossRef] [Green Version]
- Friedman, J.; Hastie, T.; Tibshirani, R. Additive Logistic Regression: A Statistical View of Boosting. Ann. Stat. 2000, 28, 337–407. [Google Scholar] [CrossRef]
- Ma, L.; Dou, H.; Wu, S.; Shi, Z.; Li, Z. Rural development pressure and “three-stay” response: A case of Jinchang City in the Hexi Corridor, China. J. Rural. Stud. 2022, 91, 34–46. [Google Scholar] [CrossRef]
- Xu, D.; Deng, X.; Guo, S.; Liu, S. Labor migration and farmland abandonment in rural China: Empirical results and policy implications. J. Environ. Manag. 2018, 232, 738–750. [Google Scholar] [CrossRef]
- Chen, Z.; Liu, Y.; Feng, W.; Li, Y.; Li, L. Study on spatial tropism distribution of rural settlements in the Loess Hilly and Gully Region based on natural factors and traffic accessibility. J. Rural Stud. 2019, 93, 441–448. [Google Scholar] [CrossRef]
- Tian, Y.; Liu, Y.; Kong, X. Restructuring rural settlements based on mutualism at a patch scale: A case study of Huangpi District, central China. Appl. Geogr. 2018, 92, 74–84. [Google Scholar] [CrossRef]
- Han, Z.; Song, W. Abandoned cropland: Patterns and determinants within the Guangxi Karst Mountainous Area, China. Appl. Geogr. 2020, 122, 102245. [Google Scholar] [CrossRef]
- Liu, J.; Zhang, X.; Lin, J.; Li, Y. Beyond government-led or community-based: Exploring the governance structure and operating models for reconstructing China’s hollowed villages. J. Rural. Stud. 2019, 93, 273–286. [Google Scholar] [CrossRef]


| Decoupling Type | Decoupling Characteristics | |||
|---|---|---|---|---|
| Strong | ≤0 | >0 | ≤ 0 | The cultivated land area decreases, whereas the rural residential land area increases. |
| Weak | >0 | >0 | < 1 | Both cultivated land and rural residential land areas increase; the growth rate of the former is less than that of the latter. |
| Recessive | <0 | <0 | ≥ 1 | Both cultivated land and rural residential land areas decrease; the deceleration of the former is greater than that of the latter. |
| Expansive negative | >0 | >0 | ≥ 1 | Both cultivated land and rural residential land areas increase; the growth rate of the former is greater than that of the latter. |
| Weak negative | <0 | <0 | < 1 | Both cultivated land and rural residential land areas decrease; the deceleration of the former is less than that of the latter. |
| Strong negative | ≥0 | <0 | ≤ 0 | The cultivated land area increases, whereas the rural residential land area decreases. |
| Classification | Variable | Variable Description |
|---|---|---|
| Socioeconomic dimension | Gross domestic product (GDP) | GDP can measure the economic development status of a region in 2018. The GDP in a grid is represents the value of grid j in the grid i. |
| Gross domestic product variation (GDPV) | GDPV can measure the economic development status of a region from 2009 to 2018. The GDPV in a grid is represent 2009 and 2018, respectively. | |
| Number of population (NP) [56,57] | NP can reflect the degree of population aggregation in a region. The NP in a grid is represents the number of population of grid j in the grid i. | |
| Population variation (PV) | PV can measure the population migration of a region from 2009 to 2018. The PV in a grid is represent 2009 and 2018, respectively. | |
| Average grain product per cultivated land (AGP) [58] | AGP is a vital variable to measure the ability of cultivated land produce in a region. The AGP in a grid is represents the maximum and minimum NDVI values of grid i. | |
| Biophysical dimension | Habitat quality (HQ) [59,60] | HQ represents the impact of cultivated land and rural residential land changes on ecological environment. The HQ in a grid is represents the total threat level in grid x with land use j, and k is the half-saturation constant. |
| Distance to urban areas (DU) [57] | DU is the Euclidean distance to urban areas calculated by the kernel density value, which represents the location conditions of grid. | |
| Distance to the nearest county government site (DCG) | DCG is the Euclidean distance to county government site calculated by the kernel density value, which represents the location conditions of grid. | |
| Distance to the nearest township government site (DTG) | DTG is the Euclidean distance to township government site calculated by the kernel density value, which represents the location conditions of grid. | |
| Distance to river (DR) [61] | DR is the Euclidean distance to river calculated by the kernel density value, which represents the ecological environment of grid. | |
| Managerial dimension | Patch density (PD) [62,63,64] | PD represents the rural residential land density, indirectly reflecting the distribution of rural residential land. The PD in a grid is represents the area of grid i. |
| Mean of perimeter area ratio (PARA_MN) [65] | PARA_MN is the perimeter irregularity extent of rural residential land patches, which represents the construction status of rural residential land. | |
| Distance to provincial roads (DP) [61] | DP is the Euclidean distance to provincial roads calculated by the kernel density value, which indirectly reflects the transportation status of grid. | |
| Distance to county road (DC) [61] | DC is the Euclidean distance to county road calculated by the kernel density value, which indirectly reflects the transportation status of grid. | |
| Distance to village road (DV) [61] | DV is the Euclidean distance to village road calculated by the kernel density value, which indirectly reflects the transportation status of grid. |
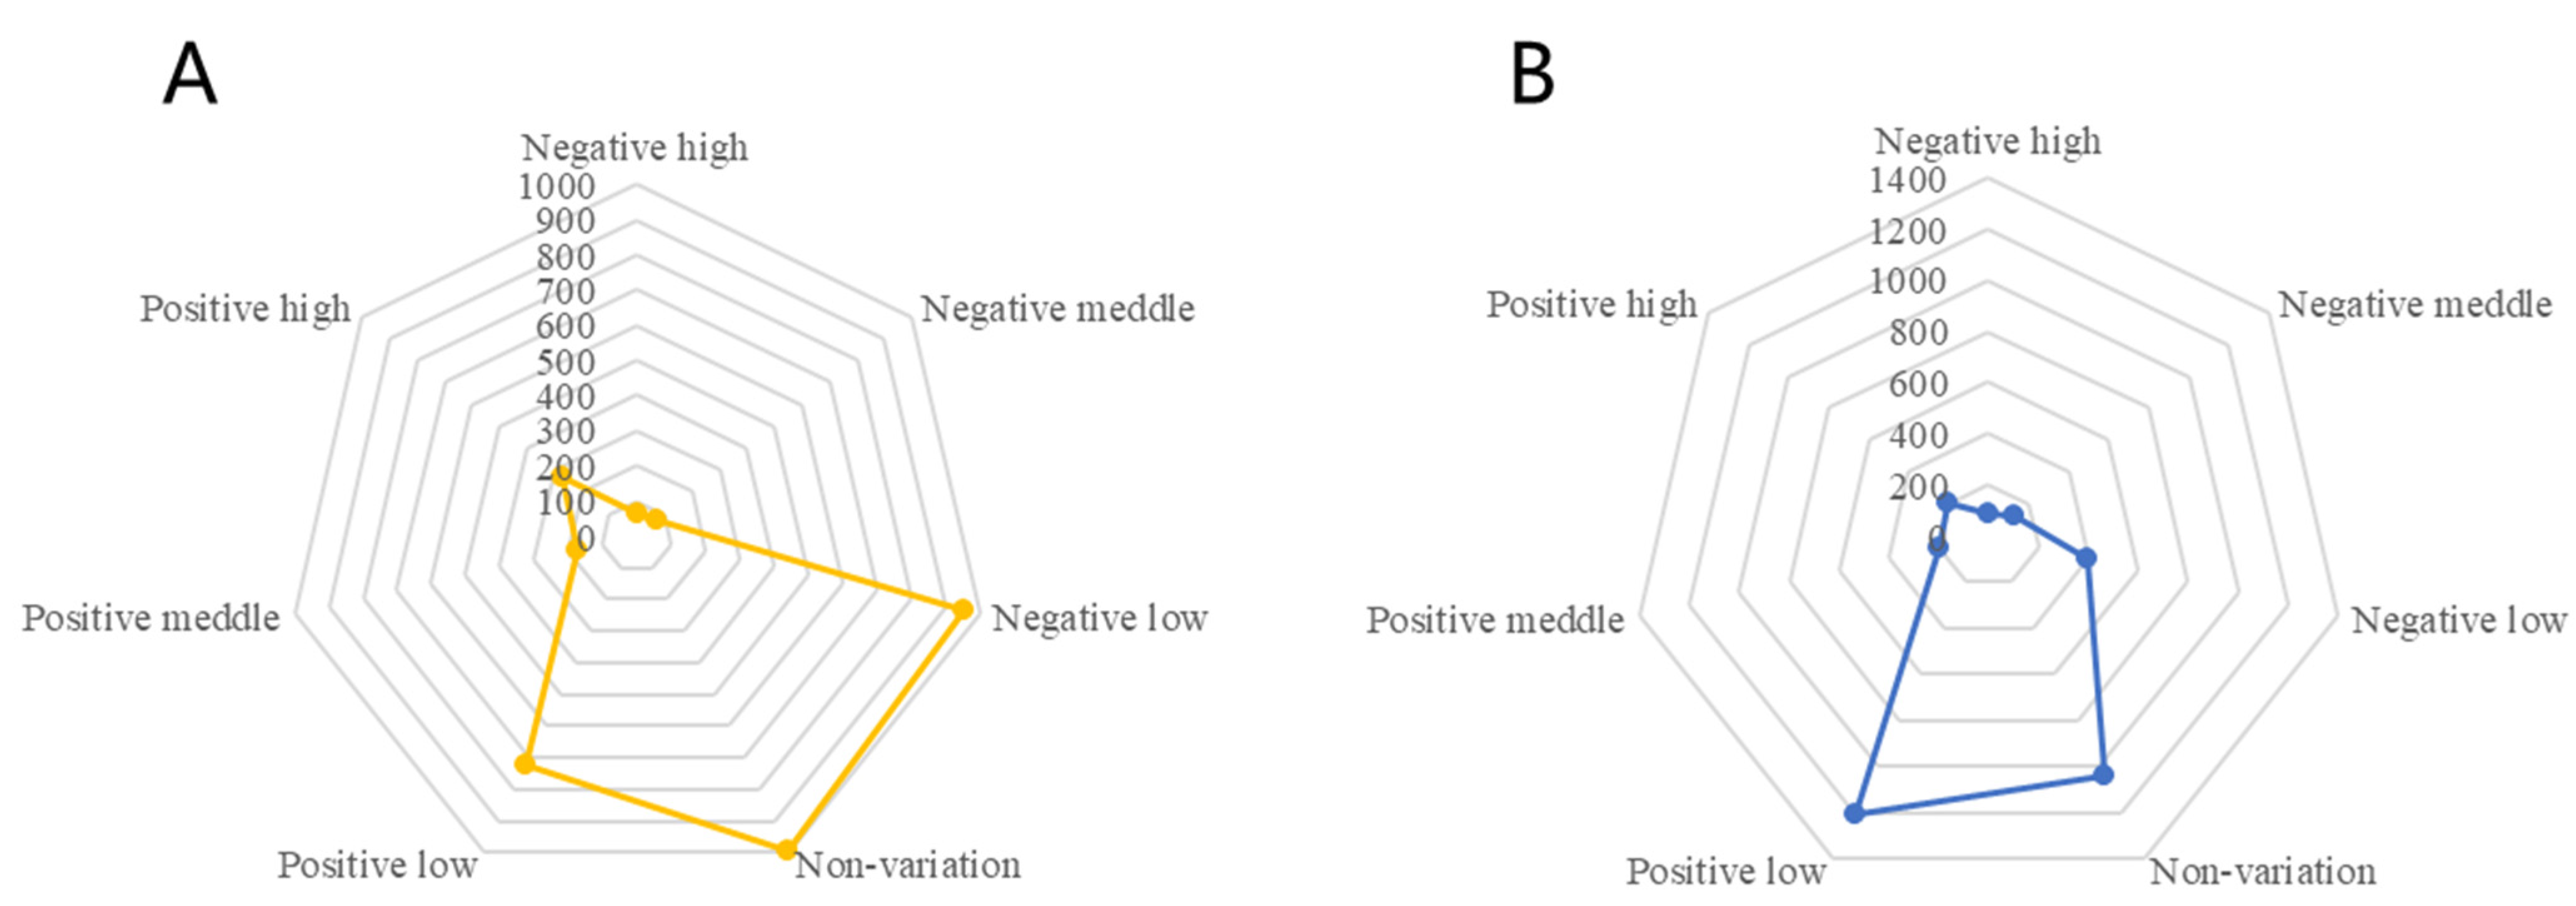
| Type | Negative High | Negative Middle | Negative Low | Non-Variation | Positive Low | Positive Middle | Positive High |
|---|---|---|---|---|---|---|---|
| Cultivated land | 64 | 74 | 951 | 992 | 726 | 175 | 273 |
| 1.97% | 2.27% | 29.22% | 30.48% | 22.30% | 5.38% | 8.39% | |
| Rural residential land | 86 | 129 | 397 | 1036 | 1208 | 195 | 204 |
| 2.64% | 3.96% | 12.20% | 31.83% | 37.11% | 5.99% | 6.27% |
| Terrain | Strong | Weak | Recessive | Expansive Negative | Weak Negative | Strong Negative |
|---|---|---|---|---|---|---|
| Plain | 10.20% | 3.41% | 0.80% | 4.85% | 1.63% | 8.17% |
| Hill | 10.20% | 2.92% | 1.29% | 5.93% | 1.01% | 4.39% |
| Mountain | 12.96% | 3.53% | 2.06% | 4.27% | 2.27% | 6.08% |
| Sum | 33.36% | 9.86% | 4.15% | 15.05% | 4.92% | 18.65% |
| Variables | Relative Importance (%) | Rank |
|---|---|---|
| Cultivated land to forest land (CL2FL) | 21.01 | 1 |
| Cultivated land to transportation land (CL2TL) | 12.84 | 2 |
| Cultivated land to rural residential land (CL2RL) | 11.01 | 3 |
| Cultivated land to water land (CL2WL) | 10.79 | 4 |
| Cultivated land to public management and service land (CL2PL) | 7.14 | 5 |
| Cultivated land to unused land (CL2UL) | 6.21 | 6 |
| Cultivated land to grass land (CL2GL) | 5.42 | 7 |
| Cultivated land to garden land (CL2G) | 4.76 | 8 |
| Cultivated land to industrial and mining storage land (CL2IL) | 3.12 | 9 |
Publisher’s Note: MDPI stays neutral with regard to jurisdictional claims in published maps and institutional affiliations. |
© 2022 by the authors. Licensee MDPI, Basel, Switzerland. This article is an open access article distributed under the terms and conditions of the Creative Commons Attribution (CC BY) license (https://creativecommons.org/licenses/by/4.0/).
Share and Cite
Luo, X.; Tong, Z.; Xie, Y.; An, R.; Yang, Z.; Liu, Y. Land Use Change under Population Migration and Its Implications for Human–Land Relationship. Land 2022, 11, 934. https://doi.org/10.3390/land11060934
Luo X, Tong Z, Xie Y, An R, Yang Z, Liu Y. Land Use Change under Population Migration and Its Implications for Human–Land Relationship. Land. 2022; 11(6):934. https://doi.org/10.3390/land11060934
Chicago/Turabian StyleLuo, Xuan, Zhaomin Tong, Yifan Xie, Rui An, Zhaochen Yang, and Yanfang Liu. 2022. "Land Use Change under Population Migration and Its Implications for Human–Land Relationship" Land 11, no. 6: 934. https://doi.org/10.3390/land11060934
APA StyleLuo, X., Tong, Z., Xie, Y., An, R., Yang, Z., & Liu, Y. (2022). Land Use Change under Population Migration and Its Implications for Human–Land Relationship. Land, 11(6), 934. https://doi.org/10.3390/land11060934