Article

The Competitiveness of Regional Urban System in Hubei Province of China

1
School of Resource and Environmental Sciences, Wuhan University, Wuhan 430079, China
2
School of Artificial Intelligence, Shenzhen Polytechnic, Shenzhen 518055, China
3
Key Laboratory of Urban Land Resources Monitoring and Simulation, Ministry of Natural Resources, Shenzhen 518060, China
4
Wuhan Geomatics Institute, Wuhan 430022, China
*
Author to whom correspondence should be addressed.
Land 2022, 11(6), 879; https://doi.org/10.3390/land11060879
Submission received: 19 April 2022 / Revised: 6 June 2022 / Accepted: 7 June 2022 / Published: 9 June 2022
(This article belongs to the Section Urban Contexts and Urban-Rural Interactions)

Abstract

:
Urban competitiveness is an indispensable topic for urban management. The purpose of this work was to study the status quo of urban system competitiveness in any region and explore the internal factors that affect urban competitiveness. In this study, 30 indicators were selected from six dimensions: population, economic strength, infrastructure, technology and culture, open exchange, and quality of life, and a two-level evaluation index system was constructed. The entropy weight method was used to calculate the weight, and 12 prefecture-level cities in Hubei Province were taken as the evaluation object. This study found that in Hubei province, (1) science, technology, and culture are the first driving forces of urban competitiveness; (2) the impact of the quality of life on urban competitiveness is deepening and obvious, especially the impact of residents’ consumption; and (3) Wuhan, the provincial capital city, is far ahead in terms of its competition and its position is unshakable, followed by Yichang and Xiangyang. Overall, the competitiveness gap between cities in the region is gradually narrowing.

1. Introduction

Urban competitiveness is a comprehensive subject which integrates systematization, dynamism, relativity, openness, and difference, and covers urban resource management, the urban industry, the urban environment and management, urban development strategy, etc. Research on urban competitiveness aims to solve urban diseases in the process of urbanization, such as traffic congestion, the aging population, the uneven distribution of resources, and inadequate urban emergency response and management capacity, with the ultimate goal of improving the quality of life. Since the 1990s, scholars have been conducting extensive studies on urban competitiveness in terms of competitive mechanisms, influencing factors, and the evaluation of urban competitiveness [1,2,3].
At present, the definition of urban competitiveness has not yet formed a set of general and mature theories, and the existing research on the definition of urban competitiveness can be summarized as follows: First, urban competitiveness is explained from the perspective of productivity. It is the production efficiency of industries, enterprises, and products at the micro level. For example, Porter’s diamond model conducted an in-depth analysis of six factors: resource elements, demand conditions, auxiliary industries, enterprise strategies, major opportunities, government functions, and industrial innovation, to obtain an overall evaluation of industrial competitiveness that led to a conclusion concerning city competitiveness. Douglas Webster and Larissa Muller believed that urban competitiveness refers to the ability of a city to produce and sell better products than other cities [4]. Second, from the perspective of the agglomeration and utilization of production factors, urban competitiveness is summarized as a city’s ability to attract, gather, and use various factors of production to create wealth and value. For example, Peter Karl Kresl believed that urban competitiveness referred to cities’ ability to create wealth and increase income [5]. At the conference on urban competitiveness held in Atlanta in 2001, many scholars believed that in the context of competition, attracting production factors such as talents, knowledge, technology, information, and investment were crucial for securing new competitive advantages. Pengfei Ni believed that urban competitiveness mainly referred to a city’s ability to attract, compete for, own, control, and transform resources; to compete for, occupy, and control the market; and to create value and provide welfare for its residents in the process of competition and development [6]. Third, from multiple dimensions, urban competitiveness is considered a comprehensive expression of multiple forces. For example, the research of the Shanghai Academy of Social Sciences posited that urban competitiveness reflected the comprehensive development ability of the urban economy, society, science and technology, the environment, etc. Taofang Yu proposed that urban competitiveness was a comprehensive reflection of urban productivity, quality of life, and social progress and its external influence [7]. The definition of urban competitiveness is, from simple to complex, proportionate to its resultant force, which generally meets the requirements of urban development at that time.
However, under the impact of economic globalization, cities have actively promoted themselves to obtain large investments, and the competition between cities has become more intense. At the same time, talent and technology have been playing an increasingly important role in urban competition. Florida proposed the “3T” theory of a creative city: technology, talent, and tolerance [8]. Tolerance means a creative city that attracts creative talent and tolerates ideas, and diverse cultural exchanges are more conducive to innovation. Such a culture can attract more creative people and companies and generate more innovation. Under such a positive cycle, cities are becoming more competitive. The creative city is an important innovation in the study of urban competitiveness, which creates a new perspective for its study. Later scholars have also studied how to improve urban competitiveness from the perspective of creative city construction [9,10,11]. Yuming Lian constructed the “urban value model theory” from the five aspects of urban strength, vitality, ability, potential, and charm, and carried out a multidimensional study on the development and changes of urban competitiveness [12]. It enriched the connotation of urban competitiveness from the perspective of urban value chain theory.
To measure the strength of urban competitiveness, it has become a popular strategy to formulate a set of detailed evaluation indicators based on a series of factors affecting urban competitiveness. In addition, it has become necessary to deal with indicators using appropriate mathematical models. Kangning Xu used the factor analysis method to evaluate the economic development environment of 30 cities in China, affirm the feasibility of the factor analysis method, and point out that in the case of a serious deviation of a single index, the expert scoring method can be used to correct it [13,14]. Xuejian Han took resource-based cities as the evaluation object, constructed multi-level indicators, and used data envelopment analysis (DEA) to comprehensively evaluate the competitiveness of resource-based cities from horizontal and vertical aspects [15]. The vertical evaluation method analyzed the changes with time to provide reference for the future development model; the horizontal evaluation method studied the competitiveness level of several resource-based cities in the same period of time and obtained the development status of resource-based cities in different regions, so as to provide corresponding decision-making support for policy-making. Sotarauta and Reija Linnamaa performed a qualitative and explanatory analysis of urban competitiveness through studying the correlation between various elements and studied the influence of regional development policies on regional development and progress [16,17]. It affirmed the importance of policy factors and set a precedent for the evaluation of non-quantitative factors. Nelson R. R. developed a quantitative index system based on principal component analysis (PCA) to quantitatively describe and analyze urban competitiveness [18]. Creswell J. W. used multiple indicators to conduct a quantitative and qualitative analysis of education research, and later, this method was gradually applied to the study of urban competitiveness and other aspects [19]. It is evident that the construction of the index system by scholars is diversified, the emphasis of urban competitiveness analysis is different, and the mathematical methods to deal with indicators are also varied. Urban competition is more about competition within a certain region, and existing studies on urban competitiveness are more about individual cities and multiple cities of the same type, such as resource-based cities, innovative cities, etc. However, the aim is to better understand the comprehensive competitiveness of any city in any region, not just resource-based, low-carbon, innovative and livable cities, and not just a one-sided assessment of the city’s economy, tourism, culture and environment. Competition entails the competition between cities, which is relative to other cities. Urban competitiveness is a relative value rather than an absolute value. To understand urban competitiveness, it is more important to explore the relative relationship between the elements and between the cities. The entropy weight method is a simple method to calculate the relative weight in multi-objective decision weight allocation [20]. Compared with subjective assignment methods such as expert scoring and analytic hierarchy process (AHP), the entropy weight method is based on historical data and is uninfluenced by human factors, and thus it leads to more accurate results. Compared with the principal component analysis and data envelopment analysis, which are also objective assignment methods, the entropy weight method is simpler and more adaptable when there are more indicators to be calculated. In addition, the entropy weight method takes the fluctuation between data as a type of information, which can better use the information of the original data and explain the relative relationship of the indicators.
The city is an organic entity in which economic, social, and material entities gather in a limited area, and this system is complex and dynamic [21]. This study designed a set of relatively comprehensive index systems, which covered six aspects: population, economy, sci-tech and culture, infrastructure, open communication, and quality of life. Index data mainly come from China Statistical Yearbook, China Urban Statistical Yearbook, and Hubei Statistical Yearbook for 2010, 2012, 2014, 2016, and 2018 (the 2010 yearbook records statistics from 2009, that is to say, this article actually uses statistics from 2009, 2011, 2013, 2015, and 2017). The entropy method was used to process the index data. In order to expose and analyze the strength and changes of urban competitiveness in the region, as well as the factors of urban competitiveness, this paper took Hubei Province as an example to conduct an empirical study.

2. Materials and Methods
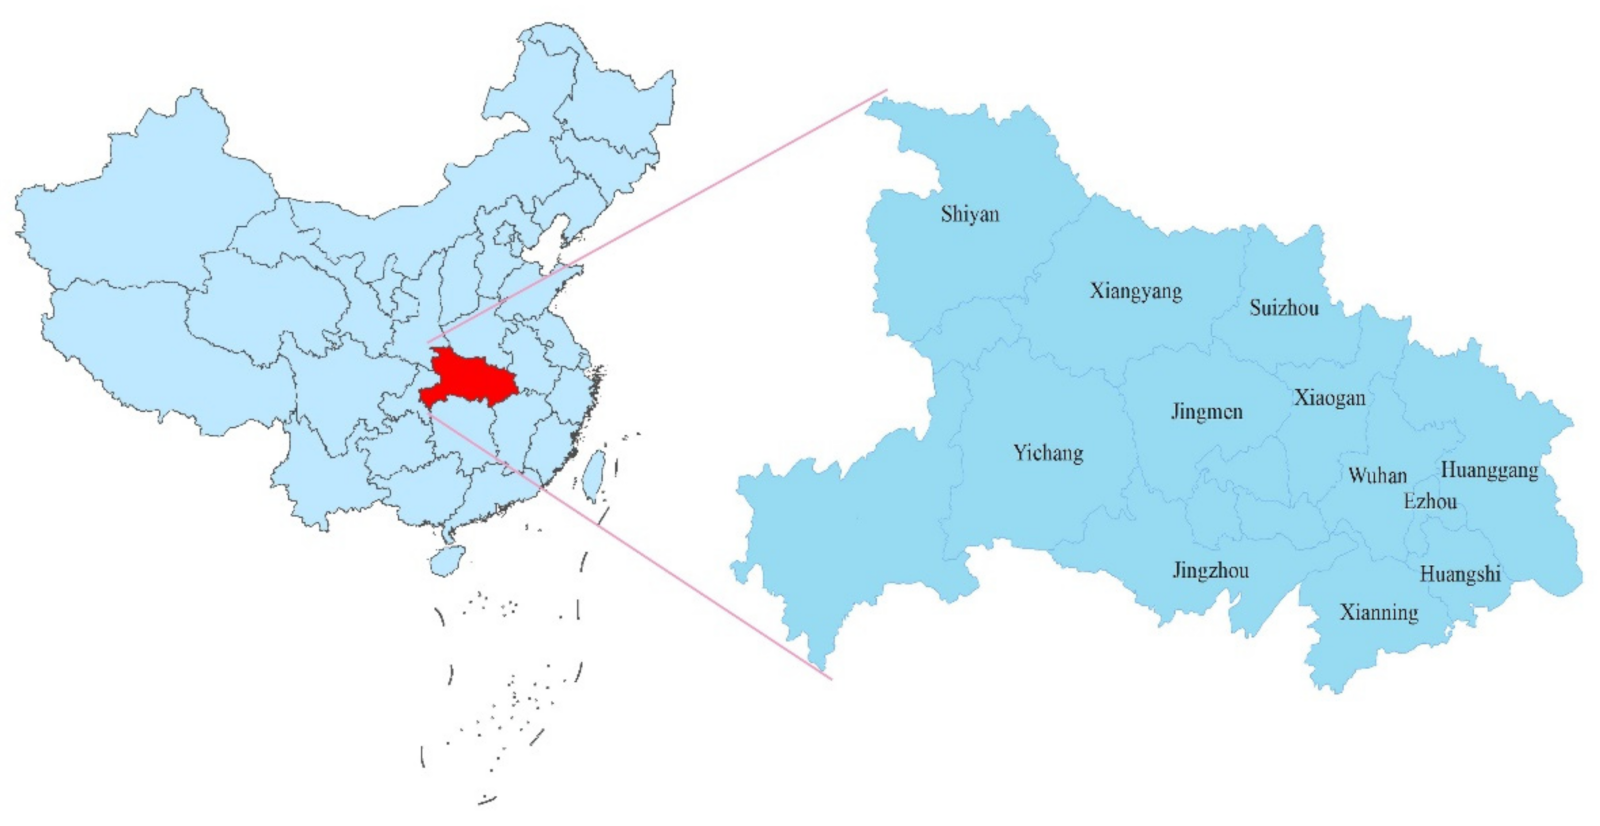
2.1. Study Area

Hubei Province was selected as the typical research object in this paper, including 12 prefecture-level cities, while 4 provincial-controlled divisions (Qianjiang, Xiantao, Tianmen, and Shennongjia Forest Region) and 1 autonomous prefecture (Enshi Tujia and Miao Autonomous Prefecture) were not included in the research scope (Figure 1).
Data used in this paper mainly includes data of administrative divisions of Hubei Province, data of public transport in China, statistics data of Chinese cities, and data of economic and social development in China. The vector data of China’s administrative divisions were obtained from the national 1:400,000 database of the National Basic Geographic Information Center, including the vector data of Hubei Province. Statistical data included economic data, population data, sci-tech and culture data, traffic flow data, import and export trade data, and local general public financial budget revenue and expenditure data, which were obtained from the China Statistical Yearbook, Hubei Statistical Yearbook, Chinese City Statistical Yearbook, and Wuhan Statistical Yearbook, etc, [22,23].

2.2. Methods

2.2.1. Evaluation Index System of Urban Competitiveness

Urban competitiveness is a comprehensive and systematic concept. A hierarchical, complete, and comparable evaluation index system must be constructed according to the connotation and influencing factors of urban competitiveness [24]. The main body of urban competitiveness is the city. The city is an organic whole with people as the main body, a highly concentrated population, activities, facilities, materials, culture, etc. The evaluation of city competitiveness should accordingly include population, economy, infrastructure, environment, science and technology, and culture. At the same time, the city is an open system, which will exchange and cooperate with other cities while competing with them, so the open exchange of cities should also be considered. Based on the urban competitiveness models [5,6,7,12,13,14,15,16,17,18,25], and referring to the index evaluation system constructed by Pengfei Ni [6] and other scholars [26,27,28,29], and following the principles of scientific, systematic, adaptable, and feasible analysis, this paper considered the influencing factors of urban competitiveness from six aspects: population, economic strength, infrastructure, sci-tech and culture, open communication, and quality of life, so as to construct the index system for urban competitiveness evaluation [30]. Detailed indicators are shown in Table 1.
The people are not only the main body of the city, but also the builders and owners of the city. All the activities of the city are inseparable from the people. The population size reflects the size of the city. It also reflects the attractiveness of the city to some extent.
With the development of the market economy, the role of the urban economy in the regional economy is increasingly prominent, and the development of the urban economy has become an important index to measure the comprehensive competitiveness of a region. Economic strength is the core of urban development [31]. Gross regional product (GRP) and per capita gross regional product are common economic indicators. Total value of industrial enterprises above scale and total output value of the construction industry describe the development of the secondary industry from industry and construction, while the added value of the tertiary industry describes the development of the tertiary industry. The secondary industry as a percentage of GRP and the tertiary industry as a percentage of GRP describe the economic industrial structure, which is important for good economic development. Local general public budget income refers to the income belonging to the local general public budget, including the profits of local enterprises, the tax for urban maintenance and construction (excluding the centralized payment by railway departments and the head offices of banks and insurance companies), property tax, the tax for town land use, land value-added tax, vehicle and vessel tax, cultivated land occupation tax, deed tax, tobacco leaf tax, stamp duty, 25% of value-added tax, 40% of corporate income tax included in the shared scope, 40% of personal income tax, 3% of securities transaction stamp tax, resource taxes other than offshore petroleum resources tax, and local non-tax income [22]. The budget is used to ensure and improve people’s livelihoods, promote economic and social development, safeguard national security, and maintain the normal operation of state institutions. At the same time, an improving economy should boost revenue. This indicator not only represents the strength of the local government, but also indirectly reflects the economic situation.
Urban infrastructure construction is an important process guaranteed to promote urbanization. It is an engineering facility that provides common conditions and public services for the direct production sector and urban livelihood. Engineering and social infrastructure provides for the survival and development of cities and allows for the smoother running of various economic and other social activities. It is the general material condition of social survival and development [32]. The World Bank divided infrastructure into economic infrastructure and social infrastructure. Economic infrastructure, such as transportation, post, telecommunications, and energy supply, as material capital, directly participate in the production process, which is beneficial to improving social production capacity and speeding up economic growth. The improvement of the level of social infrastructure, such as science, education, culture, and health and environmental protection, is conducive to the formation of human capital, social capital, and cultural capital, and is the basis for adjusting and optimizing the economic structure, improving the investment environment, and promoting economic development. Capital construction investment represents the level of capital construction and is used as a substitute for infrastructure construction in view of the fact that infrastructure investment data are not readily available. The area of paved roads in the city at year-end refers to the actual area of paved roads and the squares, bridges, and parking areas connected to the roads. This reflects the traffic capacity, and the road area per capita can best reflect the degree of traffic congestion in a city. Water supply and annual electricity consumption represent the energy supply capacity, and the number of beds in health institutions represents the accessibility of medical care.
Science, technology, and culture are the primary resources supporting urban development, and they are important driving forces of urban development and also a fundamental factor for evaluating urban advantages. With advanced science, technology, and culture, one can gain more initiative in the competition [33]. The number of students in higher education institutions is regarded as the number of talents, the amount of accepted patent applications indicates innovation ability, and the added value of the high-tech industry represents the impetus for sci-tech advancement in the economy. The number of books collected in public libraries reflects the public cultural atmosphere.
A city is a dynamic system of constant renewal and development [34]. Its development cannot only rely on local resources but must also rely on external exchanges and cooperation. The development of a modern city is inseparable from the mutual influence, support, and promotion among countries, regions, and cities. Cities develop dynamically, and the development trend always starts with the formation of a center that radiates to its surrounding areas. The strength of the various functions of a city is relative to the surrounding areas. The stronger the open communication ability of a city, the more resources and elements it will attract, and the higher the resulting level of urban development. On the contrary, the weaker the open communication ability of a city, the fewer resources it will attract and the lower the level of urban development [35,36]. The total import and export volume reflects the overall scale and development level of foreign trade. Freight (passenger) traffic refers to the weight of freight (number of passengers) transported by various means within a specific period of time. Here, passenger volume and freight volume represent the movement of people and goods in the city, respectively. Domestic (international) tourism earnings refer to the total expenditure of domestic (international) tourists on transportation, sightseeing, accommodation, catering, shopping, entertainment, etc. These two indicators represent the attractiveness of a city to both domestic and international tourists, respectively.
The ultimate goals of a city’s continuous development are to continuously improve the quality of life for its residents, to build a well-off society in an all-round way, to adhere to the people-oriented scientific concept of development, to build a harmonious socialist society, and to place a strategic emphasis on improving the people’s quality of life. The residents’ quality of life reflects the level of economic development and the degree of civilization of a region. The food, clothing, housing, and transportation of residents often reflect the changes in their income, consumption level, and quality of life [37]. The per capita disposable income (expenditure) of permanent urban residents is used to measure the income (expenditure) level and living standard of urban residents. The per capita urban housing area reflects living comfort. The total retail sales of consumer goods is used to represent the consumption power of residents. Green coverage area as a percentage of built-up areas reflects the quality of the living environment.

2.2.2. Comprehensive Index of Entropy Weight of Urban Competitiveness

The entropy weight method is an objective weighting method. It is used to determine index weight in multi-index comprehensive evaluations [38,39,40]. In the specific use process, the entropy weight method calculates the entropy weight of each index according to the degree of variation of each index, and then modifies the weight of each index using the entropy weight. Thus, a more objective index weight is obtained.
Assume that the selected m objects have n indicators to form the evaluation index value matrix [41]:
D = d ij m × n = d 11 d 12 d 1 n d 21 d 22 d 2 n d m 1 d m 2 d mn
where m is the number of evaluation objects, namely, the number of cities. Additionally, d ij represents the j th evaluation index value of i th evaluation objects.
The specific steps to determine the competitiveness evaluation value of the evaluation object are as follows:
  • Standardization of decision matrix.
To facilitate analysis and calculation, the dimensional value was transformed into the dimensionless value according to the selection formula. Recalling that the optimal value of each column in matrix D is d j * , all the elements of the matrix were standardized. The result after standardization was as follows [42,43]:
R = r ij m × n = r 11 r 12 r 1 n r 21 r 22 r 2 n r m 1 r m 2 r mn
Standardization   of   positive   indicators :   r ij = d ij min d ij max d ij min d ij
Standardization   of   negative   indicators :   r ij = max d ij d ij max d ij min d ij
The indicators selected in this paper are all positive indicators, and Formula (3) was used to standardize them. Considering subsequent calculations, when d ij = min d ij , make r ij = 0.0001.
2.
Calculation of the information entropy of each indicator [44,45].
The proportion of the j th index of the i th evaluation object p ij is as follows:
p ij = r ij i = 1 m r ij   ( i = 1 , 2 , , m )
If p ij = 0  then define lim p ij 0 p ij ln ( p ij )   = 0 .
The information entropy of the j th index is as follows:
e j = 1 ln (m) i = 1 m p ij ln ( p ij ) (       j = 1 , 2 , , n ) ,   e j 0 , 1
When r ij     i = 1 , 2 , , m is equal, e j is the largest, with a value of 1.
3.
Determine the weight of each indicator
The weight value of the j th index W j can be calculated as follows:
W j = 1 e j j = 1 n ( 1 e j )   (   j = 1 , 2 , , n ) ,   W j 0 , 1
And j = 1 n W j = 1 .
4.
Calculate the comprehensive evaluation score Z i :
Z i = j = 1 n W j · r ij   ,       i = 1 , 2 , , m
The larger the Z i is, the stronger the competitiveness is. On the contrary, the smaller the   Z i is, the worse the competitiveness is.
In this paper, the data used to calculate urban competitiveness are the five-year data of 30 indicators of 12 cities. The weights of 30 second-level indicators were obtained through steps 1, 2, and 3. After step 4, the scores of first-level indicators were calculated. This score was taken as the initial matrix, and steps 1, 2, 3, and 4 were performed again, finally obtaining the weight of the first-level indicators and the comprehensive competitiveness score of the city.

3. Results

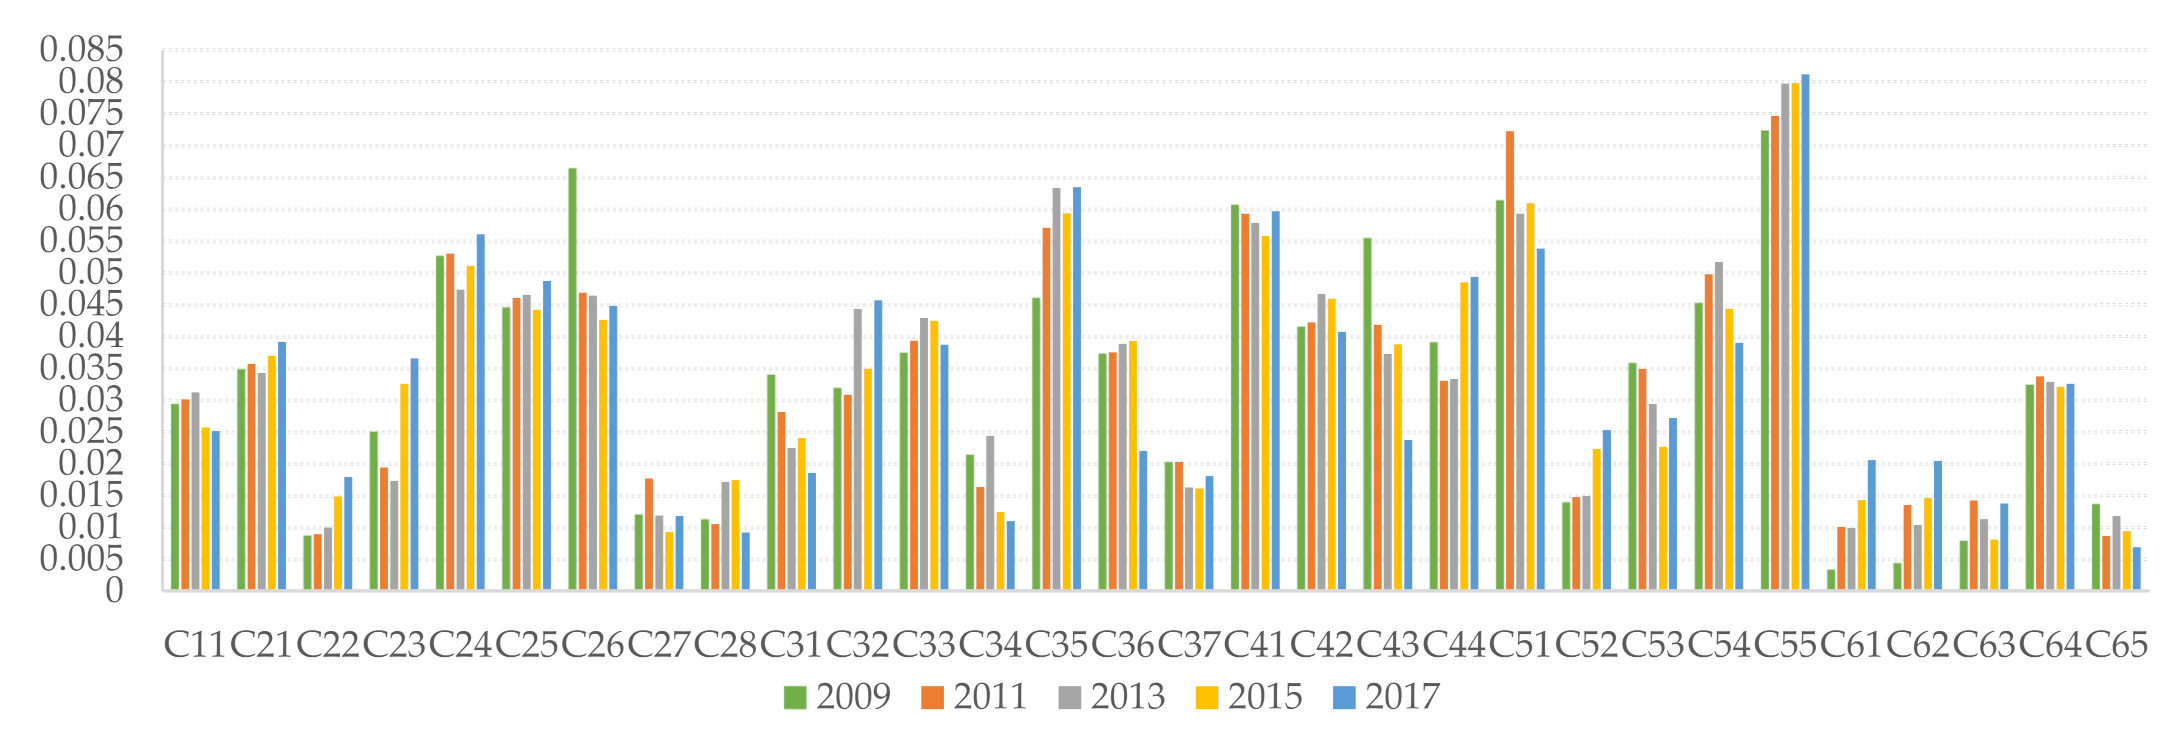
3.1. The Entropy Weight of the Index

According to the above content, the entropy weight coefficients of 30 second-level indicators from 2009 to 2017 were calculated as shown in Table 2 and Table 3 (and sorted in descending order). In order to facilitate observation, a histogram was constructed (Figure 2), and a weight distribution histogram of first-level indicators (Figure 3) was produced through the summation of the second-level indicators.
The higher the entropy weight is, the more intense the competition of each evaluation object in this index, and the more prominent the influence on the urban competitiveness. It is evident from the data above that the entropy weight of some indicators increased year by year, while that of others decreased year by year; some first increased and then decreased, and some first decreased and then increased. The entropy weights of indicators C21, C22, C25, C32, C35, C44, C52, C55, C61, and C62 basically increased year by year. Among them, the entropy weight of C55 increased every year and always ranked first. C21 experienced fluctuations, rising from 15th to 11th. Although the entropy weight of C22 increased every year, its ranking first dropped from 27th to 29th and then rose to 25th. C 25 did not change significantly, and the ranking advanced only 2 places, while C32, C35, C52, C61 and C62 advanced 10, 5, 5, 6, 9, and 7 places, respectively, and specifically, C35 came in second place in 2017. The entropy weight of C26, C31, C34, C43, C53, and C65 decreased, and the order was further behind, especially for C43, which dropped 14 places. C11, C33, C42, C51, and C54 first experienced an increase and then a decrease, with little change. C23, C24, C41, and C44 experienced a decrease and then an increase, with little change, while the order of C23 and C44 changed more than five places.
To further explore the relative relationship among indicators, the quartile method was used to divide the 30 indicators into four groups according to the sample mean, and their impact on urban competitiveness was defined as weak–sub-weak–sub-strong–strong. The corresponding relationship is shown in Table 4.
The degree of C11 (urban resident population) was sub-weak, and the entropy weight of C1 (population) changed little. The eight second-level indicators under the economic strength index were distributed across the four grades. The comprehensive weight of the economic strength index (C2) showed an overall upward trend. None of the second-level indicators under the infrastructure index (C3) were weak, and the entropy weight of infrastructure changed unsteadily. The four indicators under the sci-tech and culture (C4), except for C41, were strong, and the other three were sub-strong. The weight of C4 decreased year by year, which means that the contribution of science, technology, and culture to urban competitiveness is declining. Indicator C43, in particular, fell by more than half. The weight of the open communication index (C5) was high, and there was an upward trend. Two secondary indicators were sub-weak, one was sub-strong, and two were strong. The secondary indicators of C6 were weak, except C64, which was sub-weak. The weight of the quality of life was the smallest, and there was a significant upward trend.

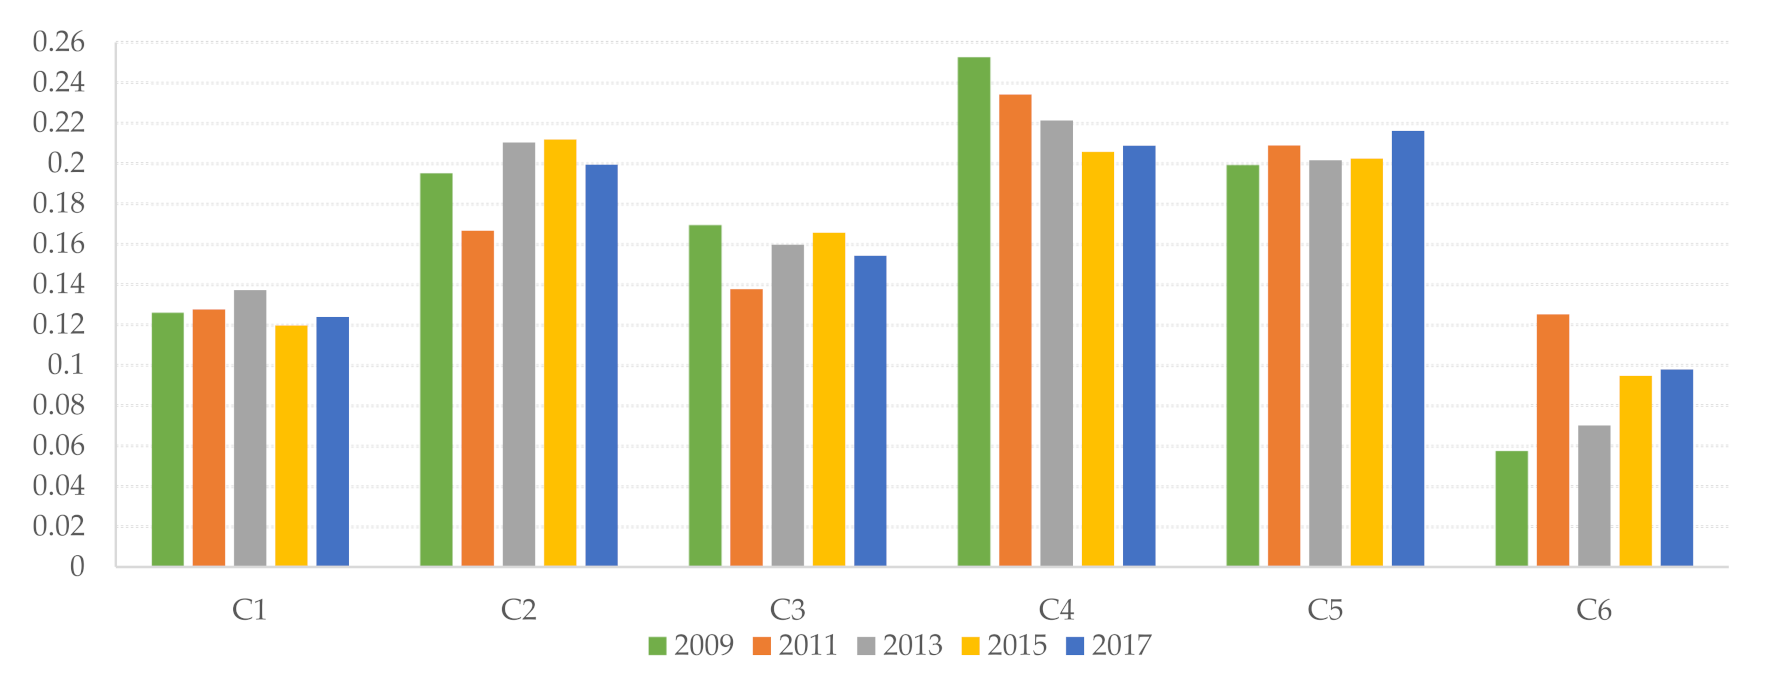
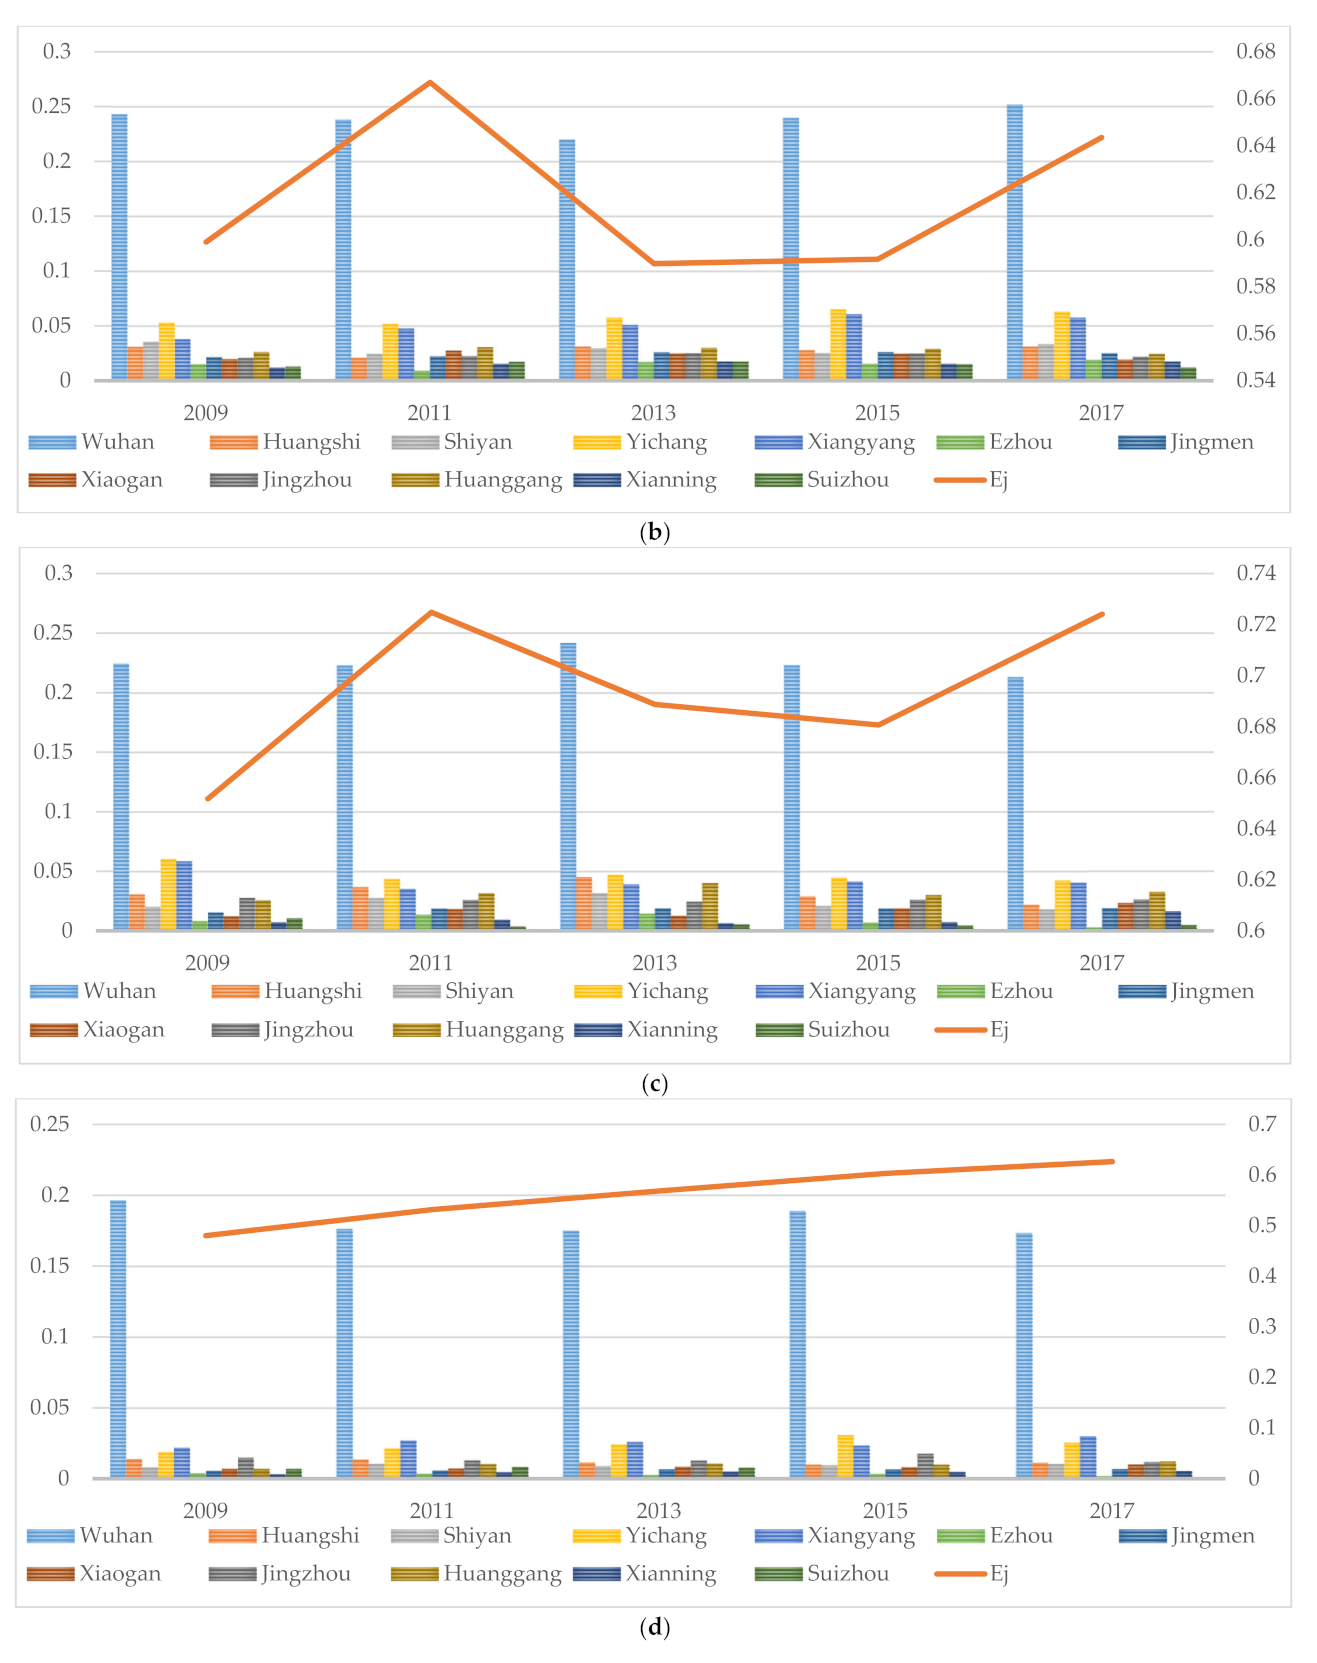
3.2. The Information Entropy of the First-Level Index

The information entropy of the first-level index and the city score were calculated using the entropy weight of the second-level index, and a line chart of the change in the information entropy of six first-level indices was drawn (Figure 4). The information entropy of the quality of life showed an obvious downward trend, which indicated that the degree of order among cities increased and the difference in urban competitiveness gradually expanded. The information entropy of the population index, economic strength index, infrastructure index, sci-tech and culture index, and open communication index increased, which indicated that the degree of order among cities decreased, and the difference in urban competitiveness decreased.

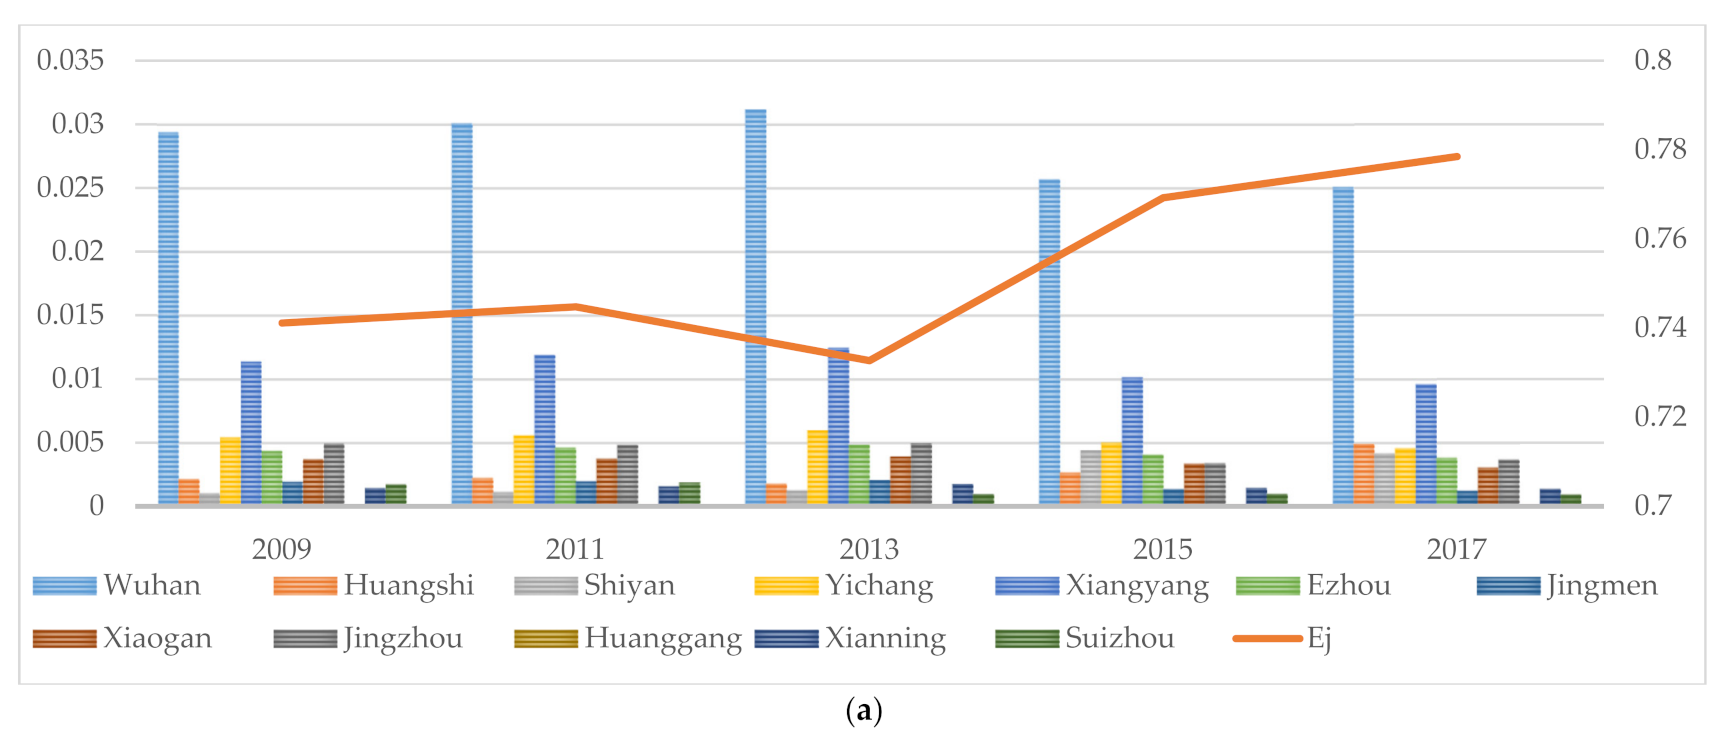
3.3. Evaluation and Analysis of Urban Comprehensive Competitiveness

Ranking the urban competitiveness scores in descending order (Table 5) and drawing a line graph (Figure 5). Wuhan was in the leading position in the regional development of Hubei Province, and its competitiveness was more than five times that of the second city. In second place was Xiangyang, which was only one point ahead of Yichang. In fourth place was Jingzhou, and in fifth place was Huangshi, the difference between which was one point. Xiaogan, Shiyan, and Huangshi were in sixth, seventh and eighth places, respectively, with an average difference of 0.2 in turn. Jingmen was in ninth place, with a very steady score. Ezhou was in tenth place, although the score fluctuated, but showed an overall increase. The score of Xianning increased significantly, and the ranking changed from first to third from the bottom, while the ranking of Suizhou changed from eleventh to twelfth. Overall, the competitiveness of cities improved, and the gap between cities gradually narrowed.

4. Discussion

4.1. Index System of Urban Competitiveness and the Entropy Weights of Indicators

Population indicators had a sub-weak impact on urban competitiveness, with the index weight increasing gradually from 2009 to 2013, and then decreasing year by year until 2017. This means that the impact of population on urban competitiveness is being reduced. At the same time, the information entropy of the population indicators increased, and the competitiveness gap between cities decreased. The continuing aging of the population and the shortage of newborns are issues that are now common worldwide [46,47]. Against the backdrop of intentionally low fertility rates among young people, promoting the shift from a demographic dividend to a talent dividend is a very important strategies [48,49].
Economic indicators are very complicated. This paper selected seven representative indicators to measure the local economic level, industrial structure, and government economic strength. Industry, the construction industry and the tertiary industry strongly contributed to the impact of urban competitiveness, while the secondary industry as a percentage of GRP and the tertiary industry as a percentage of GRP weakly contributed to urban competitiveness. It is necessary to further change the mode of economic growth and promote the adjustment, optimization, and development of the industrial structure. As the entropy weight of economic strength increased, so did the entropy information, which means that the competition between cities became increasingly fierce, while the gap between cities across the region narrowed. Wuhan, in particular, as the capital city of Hubei province, leads the way in the economic strength scores, and the gap between it and second place is gradually widening. The weight of economic strength is gradually increasing, and the contribution to the competitiveness of the city is becoming increasingly important [50].
Infrastructure refers to the material engineering facilities that provide public services for social production and residents’ lives and is a public service system used to ensure the normal conduct of national or regional social and economic activities. It is the general material condition for the survival and development of society. The seven indicators selected in this paper mainly covered transportation, post and telecommunications, water supply, and power supply and health. The entropy weight of infrastructure decreased as the information entropy increased, which means that the impact of infrastructure on urban competitiveness became smaller, the gap between cities narrowed, and infrastructure construction became increasingly optimal. The improvement of infrastructure will also enhance economic development [51].
The weight of science, technology, and culture was very prominent, although it declined year by year. Its information entropy increased steadily. In other words, in this index, the competition between cities eased, and the gap gradually narrowed. On the one hand, the growth rate of the top city, Wuhan, has slowed down, while on the other hand the other cities have moved closer to each other: Xiangyang and Yichang, in second and third place, have moved closer to Wuhan, and the other cities have moved closer to each other. Wuhan is one of the most important science and education bases in China, and the Wuhan East Lake High-Tech Development Zone is the second most intellectually intensive zone in China. Wuhan’s optical fiber communication, laser, bio-engineering, and computer software rank levels among the leading levels in China. Wuhan should take advantage of its advantages and further stimulate its ability to innovate in science and technology and transform scientific and technological achievements. It is also important to improve the education and learning indices, develop human assets, attract talent, and promote the flow of innovation and creativity [52].
The entropy weight of the open communication index was between 20% and 22%, with a small increase, while the information entropy increased. This means that this index increasingly contributed to the competitiveness of the cities, while the gap between the cities became increasingly smaller. The cities in the region should complement each other’s strengths and strengthen cooperation while competing.
The entropy weight of the quality of life index was the smallest, but it basically increased year by year. The quality of life increasingly contributed to the competitiveness of the cities, with a significant increase from 6% to 10%. At the same time, the information entropy of the quality of life index decreased; that is to say, the gap between the cities expanded. The provincial capital city of Wuhan, in particular, saw a particularly rapid increase in this rating.
The indicators selected in this paper are available and also applicable to other regions. Meanwhile, there are some other considerations in the selection process of the indicators. For example, the number of beds in health institutions is used as a public life service to assess infrastructure rather than the quality of life. It must be admitted that health affects the quality of life. At the same time, the better the infrastructure, the better the quality of life.
In the previous results, the weight of science, technology, and culture was very high, but it almost decreased year by year. The secondary indexes, C41 and C42, did not change obviously; C43 decreased significantly, and C44 decreased and then increased significantly. Whether the change in the weight of the primary index is affected by a sudden change in the secondary index, and how to eliminate this impact, is a problem that needs to be further considered in the future. In this case, it is also worth considering whether more indicators should be added, such as the expenditure on scientific and technological activities and the number of graduates of ordinary colleges and universities.
Urban competitiveness is a competition between cities as well as between factors. The weights calculated using the entropy weight method are relative weights and can only compare the strengths and weaknesses of each other. It is a relative value rather than an absolute value and cannot portray the true level of a city’s development.

4.2. Urban Competitiveness

This paper proposed urban competitiveness as a comprehensive force and analyzed it from six dimensions: population; economy; infrastructure; science, technology, and culture; open communication; and quality of life. The concept of competitiveness has multiple perspectives and multi-level meanings. The meaning of competitiveness is, in essence, a process of continuous development, revision, and perfection in correspondence to the development of society and its requirements. For example, in the home office environment, the internet and the internet economy are closely related to daily work and life, becoming an important part of future urban development. Government emergency measures will also become an important entry point to measure the competitiveness of cities.
Urban competitiveness is an extremely complex economic and social phenomenon, and its determinants include political, economic, social, and cultural components. Therefore, there are certain limitations to the use of solely quantitative methods for its analysis. Whereas in the establishment of an evaluation index system, some indicators are very important but difficult to quantify, such as residents’ happiness index, sense of belonging, government service efficiency, etc. For such non-quantitative indicators, expert marking or questionnaires may be a good method to employ.

5. Conclusions

Urban competitiveness is a comprehensive force. To explore the influence of multiple factors on urban competitiveness, this paper created a two-tier evaluation system covering 30 indicators from the dimensions of population; economic strength; infrastructure; science, technology and culture; open communication; and quality of life. The entropy weight method was used as the data processing model, and Hubei Province was taken as an example. This paper found that:
  • Science, technology, and culture were the most important influencing factors of urban competitiveness. However, their weight showed a downward trend after 2013 from first to second place, and its distance from the first indicator was very small. Economic strength and open communication were also found to be very important. Additionally, their weights increased.
  • The impact of the quality of life indicators on urban competitiveness increased rapidly. In particular, the growth weights of the per capita disposable income and consumption expenditure of permanent urban residents increased rapidly.
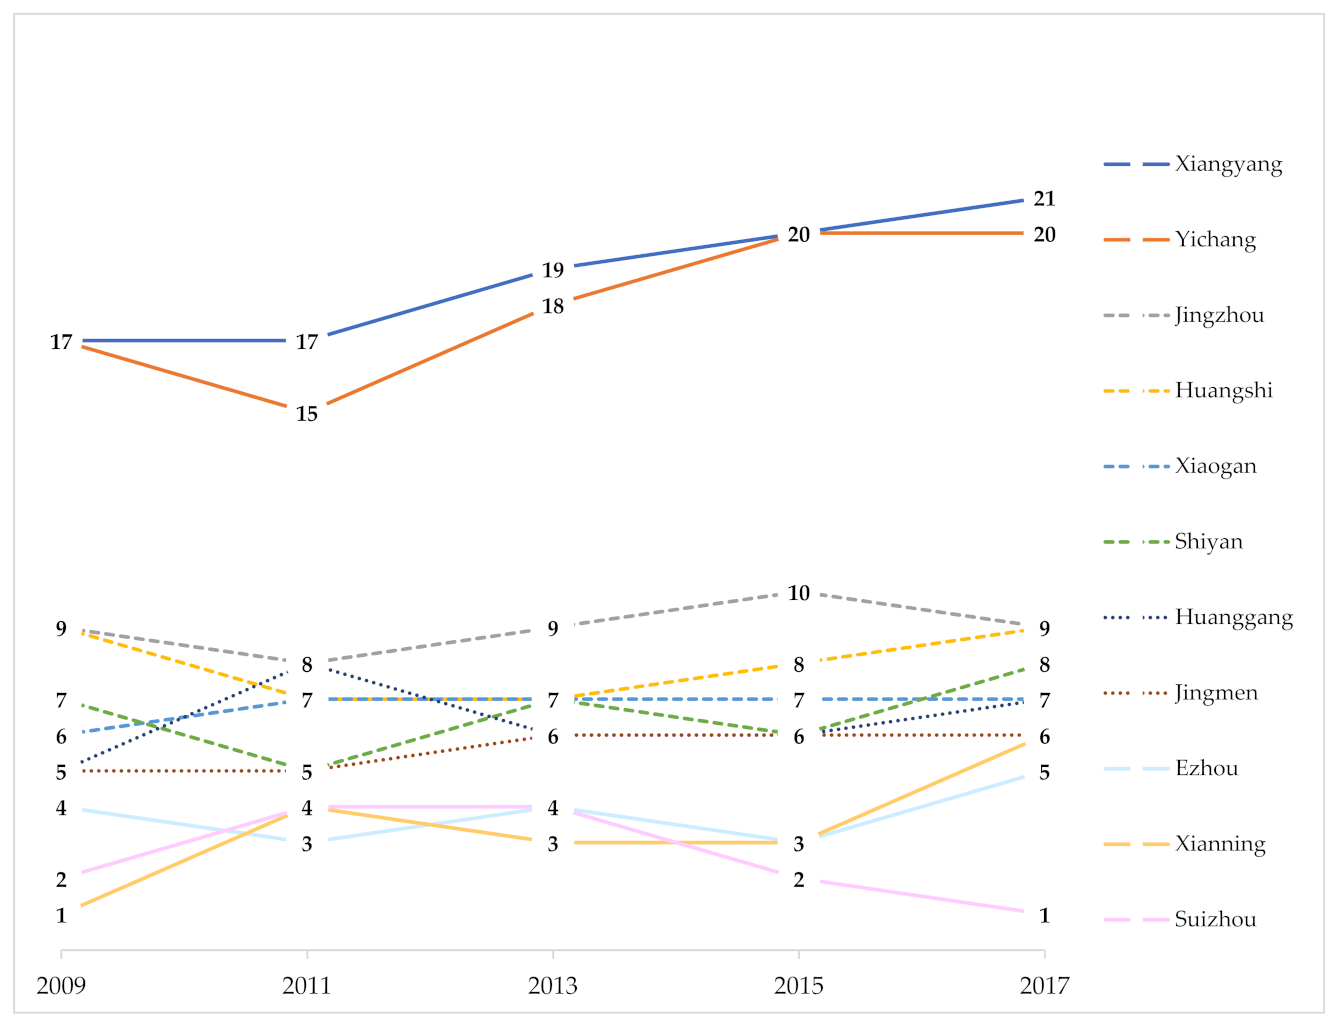
  • Wuhan is the most competitive city in Hubei Province, and has an unshakable position. The competitiveness of Yichang and Xiangyang was strong, while the competitiveness of other places was weak or even extremely weak.
In view of the above research results, this paper suggests the following actions:
  • The promotion of the adjustment of the industrial structure, as well as the steady and fast development of economy, and the promotion of cooperation between cities and the utilization of external funds. It is necessary to vigorously develop high-tech industries in order to enhance the competitiveness of science, technology, and culture.
  • Cities should further improve their infrastructure and residents’ quality of life and attract more talents to settle in the city.
  • Wuhan should play a leading role in driving the surrounding cities, as well as promoting the optimization and upgrading of industrial structure, so as to improve the development level of the whole region.
In the evaluation method of this paper, the index weight calculated by the difference between evaluation samples is called the objective weight. However, this objective weight relies too much on historical data, lacks foresight, and does not consider the subjective weight determined by experts based on the meaning of each indicator. In future studies, subjective weight methods, such as the analytic hierarchy process, can be considered for the synthesis of objective weights, so as to obtain more reliable evaluation results. However, a more in-depth understanding of the historical development of each city in Hubei province was gained, and the internal driving force and key elements of the development of and change in urban competitiveness were analyzed from the aspects of politics, economy, society, culture, science, and technology. The evaluation index data were mostly statistical data, which seem to be somewhat limited and hysteretic. In the future, the spatial analysis of terrain, resources, and humanity should be considered to make the expression design more comprehensive, vivid, and convincing.

Author Contributions

Conceptualization, X.Y., Y.F. and Z.H.; Data curation, X.Y.; Methodology, X.Y.; Resources, J.M.; Writing—original draft, X.Y.; Writing—review & editing, Y.F. and Z.H. All authors have read and agreed to the published version of the manuscript.

Funding

This research was funded by the Open Fund of the Key Laboratory of Urban Land Resources Monitoring and Simulation, Ministry of Natural Resources, grant numbers KF-2020-05-035.

Institutional Review Board Statement

Not applicable.

Informed Consent Statement

Not applicable.

Data Availability Statement

Not applicable.

Conflicts of Interest

The authors declare no conflict of interest.

References

  1. Tao, L.; Zhang, T.; Gan, Y.; Qiu, Q.; Zhang, T. The Review of Urban Competitiveness Study in Domestic and Abroad. Urban Plan. Int. 2015, 30, 7–15. [Google Scholar]
  2. Xue-Qiang, X.U.; Cheng, Y.H. Spatial-temporal Changes of Urban Competitiveness in Urban Cluster of Pearl River Delta. Sci. Geogr. Sin. 2006, 26, 257–265. [Google Scholar]
  3. Nasi, G.; Choi, H.; Cucciniello, M.; Christensen, R.K. A systematic literature review of city competitiveness: A 30-year assessment and future agenda for public administration. Public Manag. Rev. 2022, 1–25. [Google Scholar] [CrossRef]
  4. Webster, D.; Muller, L. Urban Competitiveness Assessment in Developing Country Urban Regions: The Road Ahead; John Wiley & Sons, Inc.: Hoboken, NJ, USA, 2000. [Google Scholar]
  5. Kresl, P.; Ietri, D. Urban Competitiveness: Theory and Practice; Routledge, Taylor & Francis Group: London, UK; New York, NY, USA, 2014. [Google Scholar]
  6. Pengfei, N. China Urban Competitiveness: Theoretical Hypotesis and Empirical Test; Economic Press China: Beijing, China, 2001. [Google Scholar]
  7. Yu, T.; Gu, C. Influential Factors Combination and Competitive Advantages in Stages of Urban Competitiveness—Case Study of Suzhou in China. Chin. Geogr. Sci. 2004, 14, 202–208. [Google Scholar] [CrossRef]
  8. Florida, R. Cities and the Creative Class. City Community 2003, 2, 3–19. [Google Scholar] [CrossRef]
  9. Li, W.; Wang, R.; Miao, Y. Proactively Cultivate and Support the Creative Industry to Upgrade the Forces of Comprehensive Competitiveness of City in Shanghai. J. Soc. Sci. 2005, 1, 5–14. [Google Scholar]
  10. Guo, R.; Lin, Z. Creative City: Urban Competitiveness in knowledge Economy. In Proceedings of the First Cross-Strait Management Science Forum, Fuzhou, China, 31 October 2006; pp. 531–538. [Google Scholar]
  11. Liu, L. Influence of creative city construction on urban competitiveness and countermeasures. Contemp. Econ. 2012, 000(022), 6–7. [Google Scholar]
  12. Yuming, L. Report on the Comprehensive Competitiveness of Chinese Cities; China Morden Economics Publishing House: Beijing, China, 2009. [Google Scholar]
  13. Xu, K. On City Competition and City Competitive Power. Soc. Sci. Nanjing 2002, 1–6. [Google Scholar]
  14. Xu, K. Civilization and Prosperity: A Comparative Study of Urban Economic Development Environment between China and Foreign Countries; Southeast University Press: Nanjing, China, 2003. [Google Scholar]
  15. Han, X.J.; Yuan, Y.; Wang, X.B.; Yi-Jun, L.I. Research on the Evaluation of Resource-Based Cities’ Competitiveness Based on DEA. China Soft Sci. 2013, 6, 127–133. [Google Scholar]
  16. Sotarauta, M.; Linnamaa, R. The Finnish Multi-Level Policy-Making and the Quality of Local Development Policy Process: The Cases of Oulu and Seinänaapurit Sub-regions. Eur. Plan. Stud. 1998, 6, 505–523. [Google Scholar] [CrossRef] [Green Version]
  17. Sotarauta, M. Power and influence tactics in the promotion of regional development: An empirical analysis of the work of Finnish regional development officers. Geoforum 2009, 40, 895–905. [Google Scholar] [CrossRef] [Green Version]
  18. Nelson, R.R. National Innovation Systems: A Comparative Analysis; Oxford University Press: New York, NY, USA; London, UK, 1993. [Google Scholar]
  19. Creswell, J.W. Qualitative Inquiry and Research Design: Choosing among Five Approaches [with CD-ROM], 2nd ed.; SAGE Publications (CA): Thousand Oaks, CA, USA, 2006. [Google Scholar]
  20. Kumar, R.; Singh, S.; Bilga, P.S.; Jatin; Singh, J.; Singh, S.; Scutaru, M.L.; Pruncu, C.I. Revealing the benefits of entropy weights method for multi-objective optimization in machining operations: A critical review. J. Mater. Res. Technol. 2021, 10, 1471–1492. [Google Scholar] [CrossRef]
  21. Hongchang, S.; Yufeng, W. Rearch on Nanjing City Social Economic Aggregation and Industrial Wave. Soc. Sci. Nanjing 2002, 139–146. [Google Scholar]
  22. National Bureau of Statistics. China Statistical Yearbook-2010; China Statistics Press: Beijing, China, 2011.
  23. National Bureau of Statistics. China City Statistical Yearbook-2010; China Statistics Press: Beijing, China, 2011.
  24. Yang, D.; Yan, Y. The Establishment of Synthetical Estimation Variables System and Evaluation Methods. Value Eng. 2006, 9, 4–7. [Google Scholar]
  25. Schwab, K.A.; Martin, X. The Global Competitiveness Report 2014–2015. World Econ. Forum 2014, 1, 2–51. [Google Scholar]
  26. Guojie, Z.; Hongmei, Z. Study on evaluation index System of urban competitiveness based on Network Analytic hierarchy Process. Sci. Technol. Prog. Policy 2006, 23, 126–128. [Google Scholar]
  27. Li, L.; Han, B.-L.; Li, Z.-H.; Zhang, S.-W. Evaluation Index System for The Competitiveness of Innovative Cities and Its Empirical Application—Comparative Analysis Among Changsha City and Some Other Major Cities in The Eastern. Econ. Geogr. 2011, 31, 224–229. [Google Scholar]
  28. Qiang, W. Study and Quantitative Analysis on Index System of Urban Competitiveness Evaluation; Xiamen University: Xiamen, China, 2009. [Google Scholar]
  29. Yuemin, N.; Lizhi, T. The Concept and Indicator System of Urban Competitive Capacity. Urban Res. 2001, 3, 19–22. [Google Scholar]
  30. Zhang, C.; Ding, L.I.; Zhang, J.; Wei, X. Urban competitiveness evaluation and the evolvement in Northwest China. J. Arid. Land Resour. Environ. 2015, 29, 8–13. [Google Scholar]
  31. Yuan, Z.; Zheng, X.; Zhang, L.; Zhao, G. Urban Competitiveness Measurement of Chinese Cities Based on a Structural Equation Model. Sustainability 2017, 9, 666. [Google Scholar] [CrossRef] [Green Version]
  32. Yang, Q.; Lin, A.; Zhao, Z.; Zou, L.; Sun, C. Assessment of Urban Ecosystem Health Based on Entropy Weight Extension Decision Model in Urban Agglomeration. Sustainability 2016, 8, 869. [Google Scholar] [CrossRef] [Green Version]
  33. Peng, G. Comprehensive Evaluation of Regional Science and Education Competitiveness of Provinces and Cities in Western China; Northwestern University: Xi’an, China, 2007. [Google Scholar]
  34. Ji, W.; Liu, X. The optimization and improvement of the urban function of Gulou old urban district in Nanjing city. Jiangsu Build. Mater. 2017, 2, 43–48. [Google Scholar]
  35. Qi, Y.E. Survey of the Evaluation Indexes System of Region Competition Ability Around the World. J. Fujian Norm. Univ. (Philos. Soc. Sci. Ed.) 2008, 1, 91–96. [Google Scholar]
  36. Wang, F.; Liu, W.H. Research on Economic Competitiveness of the Cities—Evidence from Fujian province. Sci. Technol. Ind. 2011, 11, 106–110. [Google Scholar]
  37. Taoling, Z. Research on the Relationship between the Quality of Life for Urban Residents and Economic Development; Southwestern University of Finance and Economics: Chengdu, China, 2007. [Google Scholar]
  38. Zhou, M. The Research about Method of Sustainable Consumption System Measure. Syst. Eng. Theory Pract. 2003, 23, 25–31. [Google Scholar]
  39. Li, X.; Li, Y.; Gu, Z.; Yang, W. Competitive situation analysis of regional logistics development based on AHP and entropy weight. J. Southeast Univ. Nat. Sci. Ed. 2004, 34, 4. [Google Scholar]
  40. Zou, Z.; Sun, J.; Ren, G. Study and Application on the Entropy method for Determination of Weight of evaluating indicators in Fuzzy Synthetic Evaluation for Water Quality Assessment. J. Environ. Sci. 2005, 18, 1020–1023. [Google Scholar] [CrossRef]
  41. Sun, L.; Miao, C.; Yang, L. Ecological-economic efficiency evaluation of green technology innovation in strategic emerging industries based on entropy weighted TOPSIS method. Ecol. Indic. 2017, 73, 554–558. [Google Scholar] [CrossRef]
  42. Li, Y.; Sun, M.; Yuan, G.; Zhou, Q.; Liu, J. Study on Development Sustainability of Atmospheric Environment in Northeast China by Rough Set and Entropy Weight Method. Sustainability 2019, 11, 3793. [Google Scholar] [CrossRef] [Green Version]
  43. Zhang, X.; Wang, C.; Li, E.; Xu, C. Assessment Model of Ecoenvironmental Vulnerability Based on Improved Entropy Weight Method. Sci. World J. 2014, 2014, 797814. [Google Scholar] [CrossRef] [Green Version]
  44. Sun, B.; Yang, X.; Zhang, Y.; Chen, X. Evaluation of Water Use Efficiency of 31 Provinces and Municipalities in China Using Multi-Level Entropy Weight Method Synthesized Indexes and Data Envelopment Analysis. Sustainability 2019, 11, 4556. [Google Scholar] [CrossRef] [Green Version]
  45. Li, M.; Wang, J.; Chen, Y. Evaluation and Influencing Factors of Sustainable Development Capability of Agriculture in Countries along the Belt and Road Route. Sustainability 2019, 11, 2004. [Google Scholar] [CrossRef] [Green Version]
  46. Harper, S. Economic and social implications of aging societies. Science 2014, 346, 587–591. [Google Scholar] [CrossRef] [PubMed]
  47. Lee, H.-H.; Shin, K. Nonlinear effects of population aging on economic growth. Jpn. World Econ. 2019, 51, 100963. [Google Scholar] [CrossRef] [Green Version]
  48. Lu, H. Study on Promoting “Demographic Dividend” to “Talent Dividend”. Thinking 2011, 37, 243–244. [Google Scholar]
  49. Ren, C. Accelerate the Transformation of the “Demographic Dividend” to the “Talent Dividend”. Chin. Talent. 2012, 1, 1. [Google Scholar]
  50. Sáez, L.; Periáñez, I.; Heras-Saizarbitoria, I. Measuring urban competitiveness: Ranking European large urban zones. J. Place Manag. Dev. 2017, 10, 479–496. [Google Scholar] [CrossRef]
  51. Yang, J. Theoretical evolution of the role of infrastructure on economic growth. Econ. Rev. 2000, 6, 7–10. [Google Scholar]
  52. Hu, T.-S.; Pan, S.-C.; Lin, H.-P. Development, Innovation, and Circular Stimulation for a Knowledge-Based City: Key Thoughts. Energies 2021, 14, 7999. [Google Scholar] [CrossRef]
Figure 1. The position of Hubei in China.
Land 11 00879 g001
Figure 2. The second-level indicators’ entropy weights from 2009 to 2017.
Land 11 00879 g002
Figure 3. The first-level indicators’ entropy weights from 2009 to 2017.
Land 11 00879 g003
Figure 4. The information entropy and city score of first-level indicators. (The vertical axis on the left is the score, while that on the right is information entropy). (a) Population index information entropy and city competitiveness score; (b) Economic strength index information entropy and city competitiveness score; (c) Infrastructure index information entropy and city competitiveness score; (d) Science, technology and culture index information entropy and city competitiveness score; (e) Open communication index information entropy and city competitiveness score; (f) The quality of life index information entropy and city competitiveness score.
Land 11 00879 g004aLand 11 00879 g004bLand 11 00879 g004c
Figure 5. Map of changes in urban competitiveness in Hubei Province (except Wuhan).
Land 11 00879 g005
Table 1. The evaluation index system of urban competitiveness.
First-Level IndicatorsSecond-Level IndicatorsIndex InterpretationCode Name
Population
C1
Urban Resident PopulationUrban sizeC11
economic strength
C2
GRP (gross regional product)Economic aggregateC21
per capita GRPPer capita economic development levelC22
Total value of industrial enterprises above scaleIndustrial development levelC23
Total output value of the construction industryDevelopment level of construction industryC24
Added value of the tertiary industryDevelopment level of tertiary industryC25
Local general public budget incomeGovernment strengthC26
Secondary industry as a percentage of GRPEconomic structureC27
Tertiary industry as a percentage of GRPEconomic structureC28
Infrastructure
C3
Investment in capital constructionCapital construction levelC31
Total amount of post and telecommunications businessCommunication frequency degreeC32
Area of paved roads in the city at year-endTraffic levelsC33
Road area per capitaUrban traffic congestion degreeC34
Water supplyEnergy supplyC35
Annual electricity consumptionEnergy supplyC36
Number of beds in health institutionsMedical facilitiesC37
Science, technology and culture C4Number of students in higher education institutionsTalents and education levelC41
The amount of patent application acceptedInnovative abilityC42
The number of books collected in public librariesUrban cultural levelC43
Added value of high-tech industryDevelopment level of scientific and technological innovationC44
Open communication
C5
Total import and export volumeForeign economyC51
Passenger trafficHuman flowC52
Freight trafficMaterial flowC53
Domestic tourism earningsTourism attracts incomeC54
International tourism foreign exchange earningsTourism attracts incomeC55
The quality of life
C6
Per capita disposable income of permanent urban residentsIncomeC61
Per capita consumption expenditure of permanent urban residentsExpenditureC62
Per capita housing area in urbanLiving comfortC63
Retail sales of consumer goodsConsumption levelC64
Green coverage area as a percentage of built-up areasQuality of environmentC65
Table 2. The second-level indicators’ entropy weights from 2009 to 2017.
2009Order2011Order2013Order2015Order2017Order
C1C110.0294190.0301180.0312170.0257180.025118
C2C210.0348150.0357130.0342140.037140.039111
C220.0087270.0089290.01290.0148240.017925
C230.025200.0194210.0173210.0326160.036514
C240.052760.05350.047360.051150.0564
C250.044590.04680.046580.044290.04877
C260.066420.046970.046490.0426100.04489
C270.012250.0177220.0118250.0092290.011827
C280.0112260.0105270.0172220.0174220.009229
C3C310.034160.0281190.0224200.024190.018623
C320.0319180.0308170.0443100.0349150.04578
C330.0374120.0393110.0429110.0424110.038713
C340.0214210.0163230.0243190.0124270.01128
C350.04670.05740.063320.059330.06342
C360.0373130.0375120.0388120.0392120.02220
C370.0202220.0203200.0162230.0161230.01824
C4C410.060740.059330.057840.055840.05963
C420.0415100.042290.046670.045970.040710
C430.055450.0418100.0372130.0387130.023719
C440.0391110.033160.0333150.048560.04936
C5C510.061430.072220.059230.060920.05385
C520.0139230.0147240.0149240.0223210.025217
C530.0358140.0349140.0294180.0226200.027116
C540.045280.049760.051750.044380.03912
C550.072310.074610.079710.079810.08111
C6C610.0033300.0101280.0099300.0142260.020521
C620.0044290.0135260.0104280.0146250.020422
C630.0078280.0142250.0112270.0081300.013726
C640.0324170.0337150.0328160.0321170.032615
C650.0137240.0087300.0117260.0094280.006830
Table 3. The first-level indicators’ entropy weights from 2009 to 2017.
2009Order2011Order2013Order2015Order2017Order
population0.125950.127750.137150.119750.12385
economic strength0.195130.166630.210420.211810.19933
infrastructure0.169440.137640.159640.165640.15424
sci-tech and culture0.252910.234110.221210.205720.20882
open communication0.199220.208820.201530.202430.21611
quality of life0.057560.125260.070160.094760.09786
Table 4. Index influence classification.
LevelWeightInfluence DegreeIndicators
1<0.016WeakC22C27C28C61C62C63C65
20.016–0.034Sub-weakC11C23C31C34C37C52C53C64
30.034–0.046Sub-strongC21C25C32C33C36C42C43C44C54
4>0.046StrongC24C26C35C41C51C55
Table 5. The urban competitiveness score in Hubei province (in descending order according to the average score).
City20092011201320152017Average
Wuhan100100100100100100
Xiangyang171719202118.8
Yichang171518202018
Jingzhou9891099
Huangshi977898
Xiaogan677776.8
Shiyan757686.6
Huanggang586676.4
Jingmen556665.6
Ezhou434353.8
Xianning143363.4
Suizhou244212.6
Publisher’s Note: MDPI stays neutral with regard to jurisdictional claims in published maps and institutional affiliations.

