
How Land Transactions Affect Carbon Emissions: Evidence from China


Abstract
1. Introduction
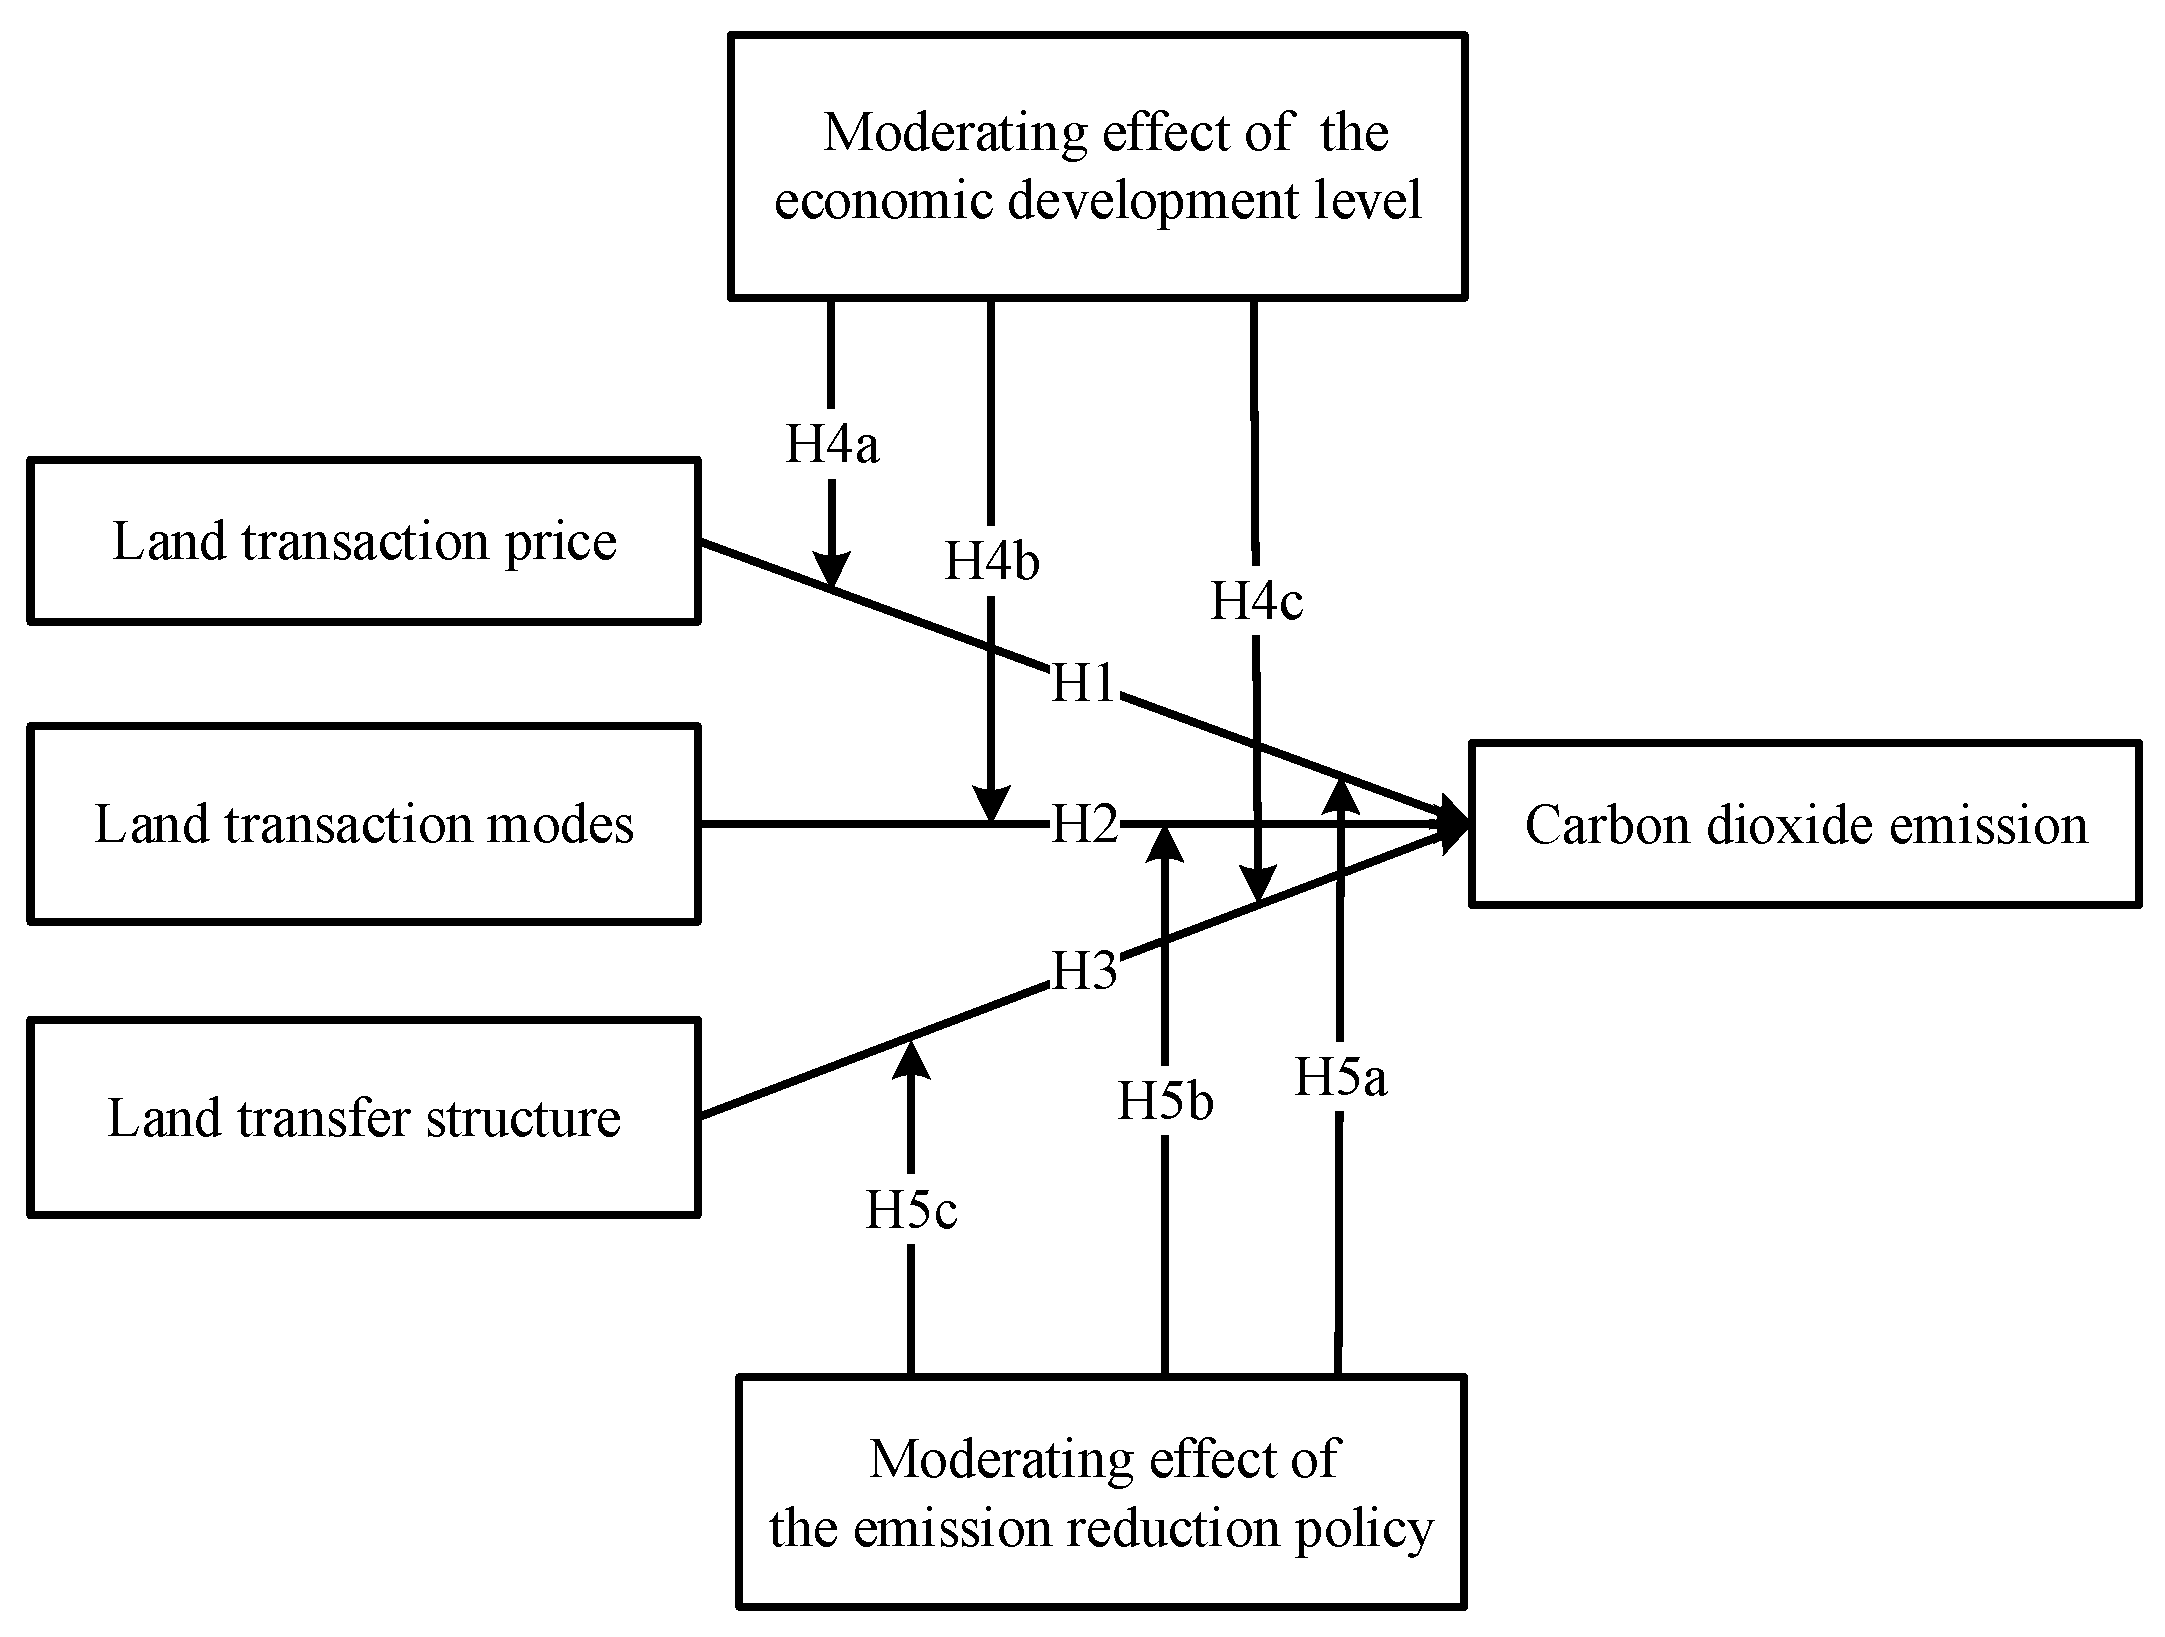
2. Literature Review and Hypotheses
2.1. Land Transaction Price and Carbon Emissions
2.2. Land Transaction Modes and Carbon Emissions
2.3. Land Transfer Structure and Carbon Emissions
2.4. The Moderating of the Level of Economic Development
2.5. The Moderating of the Emission Reduction Policy
3. Study Area, Data, and Methodology
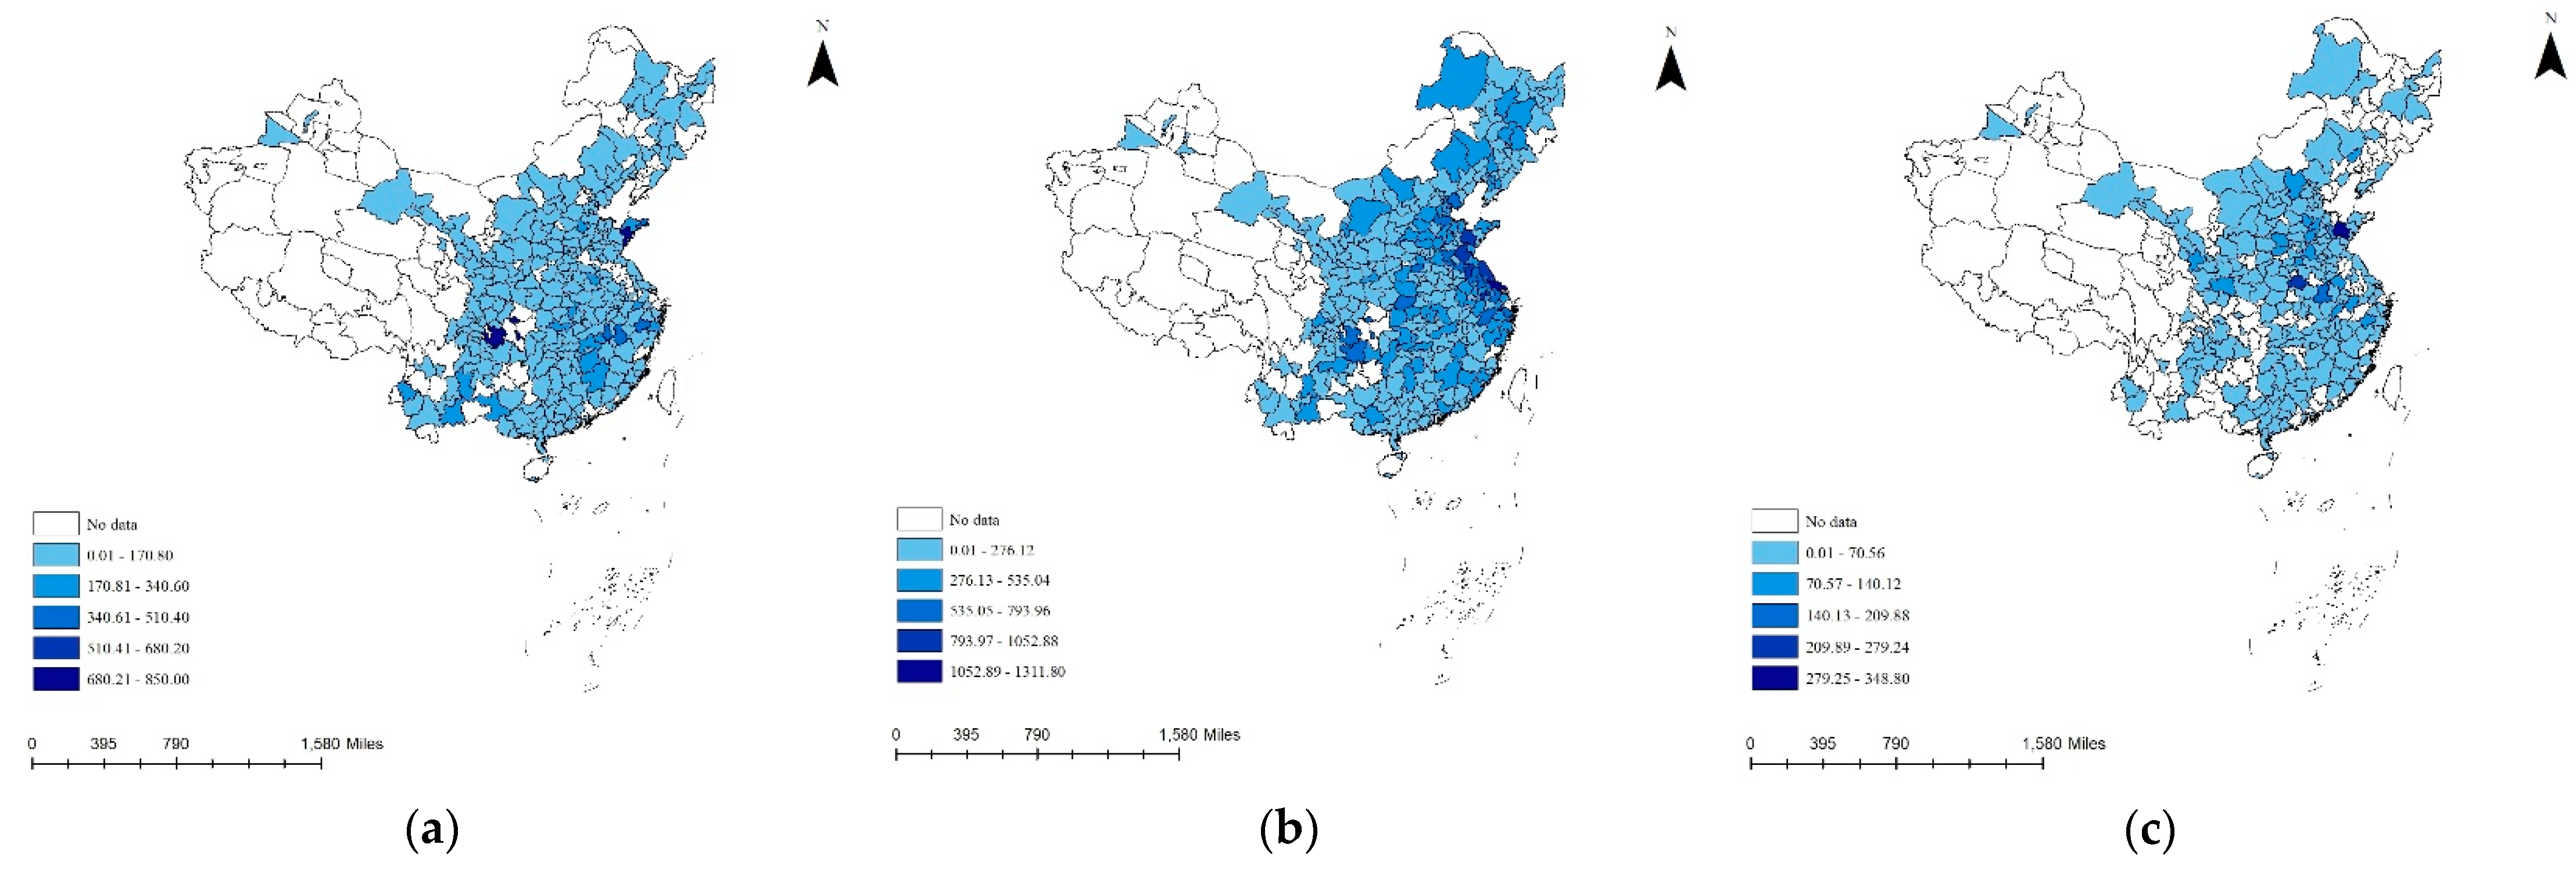
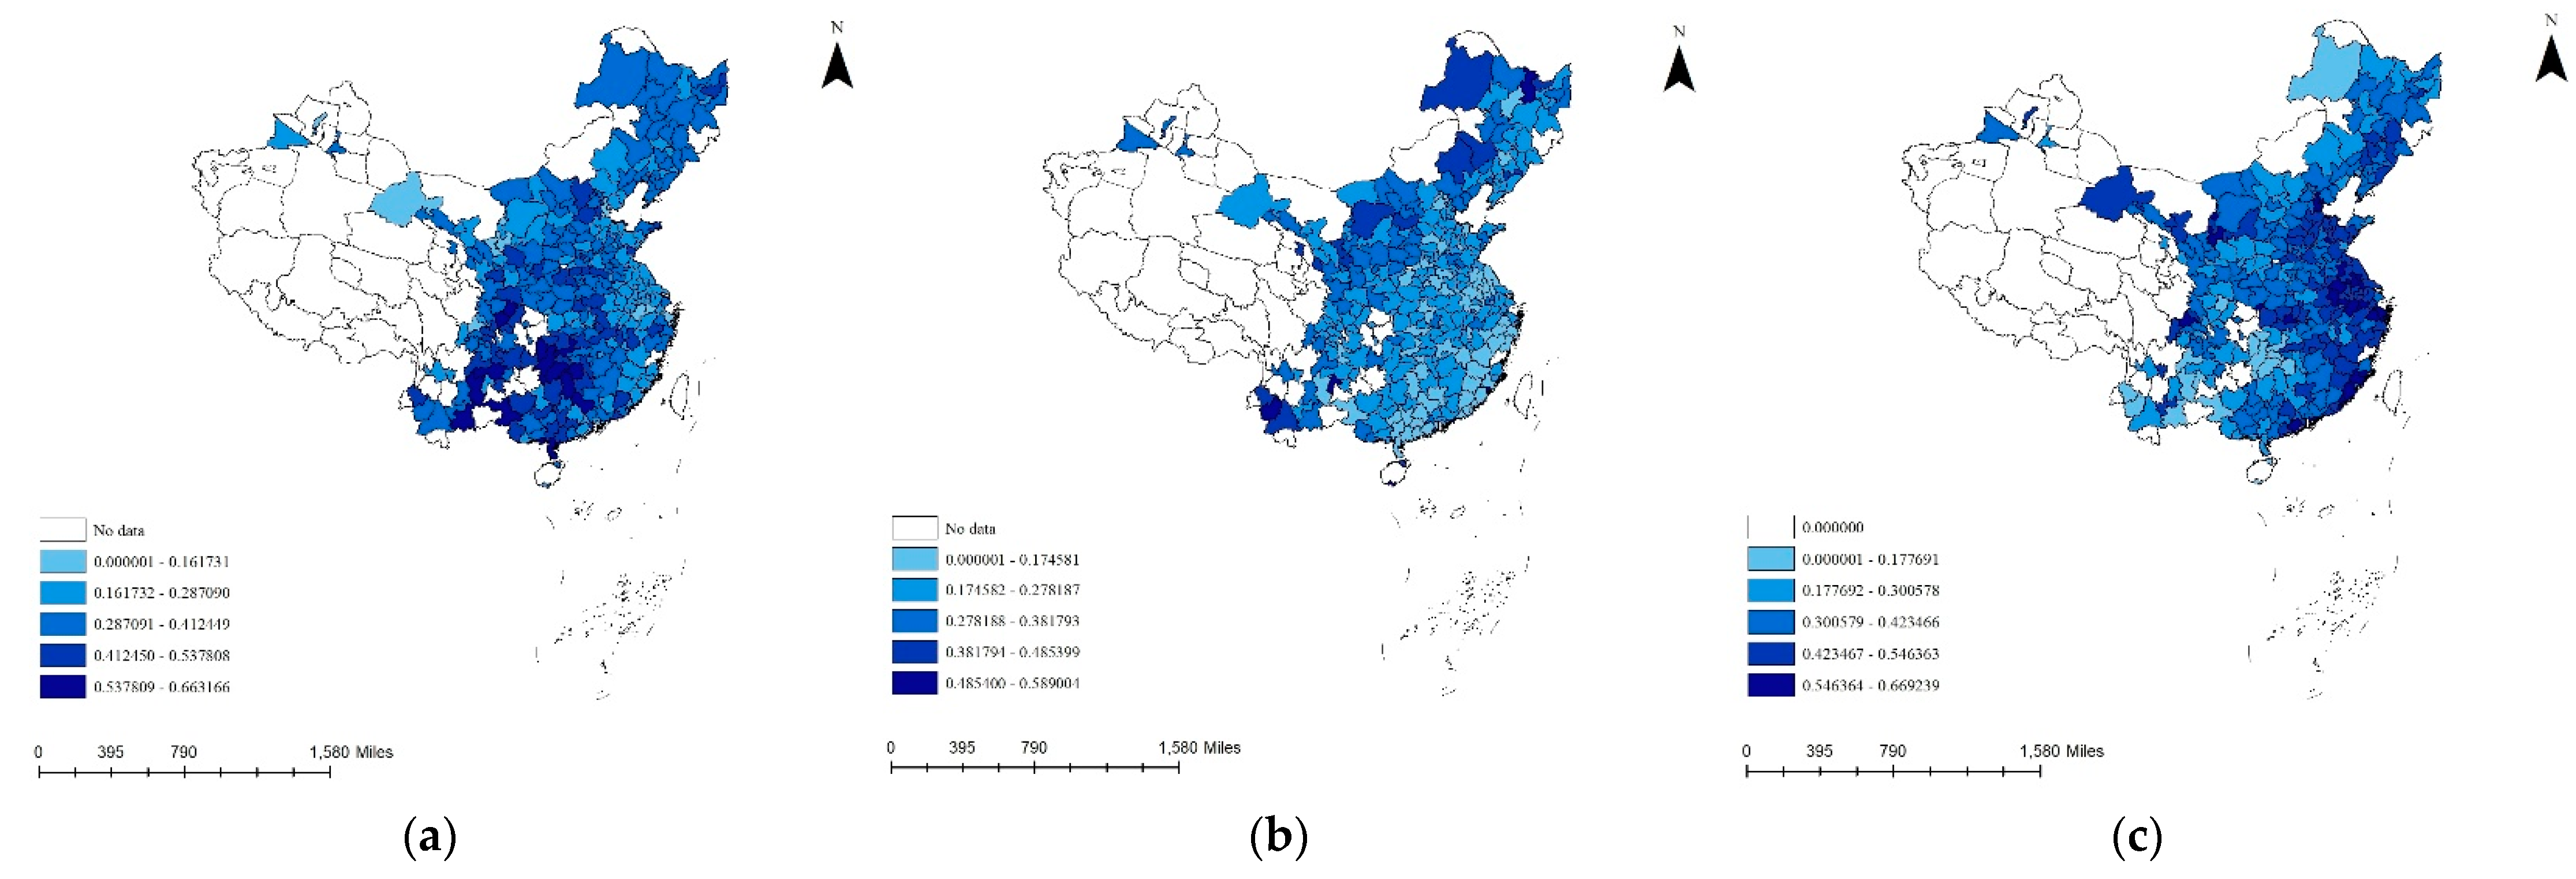
3.1. Study Area
3.2. Data and Sample
3.3. Variable Measurements
3.3.1. Dependent Variables
3.3.2. Independent Variable
- (1)
- Land Transaction Price
- (2)
- Land Transaction Modes
- (3)
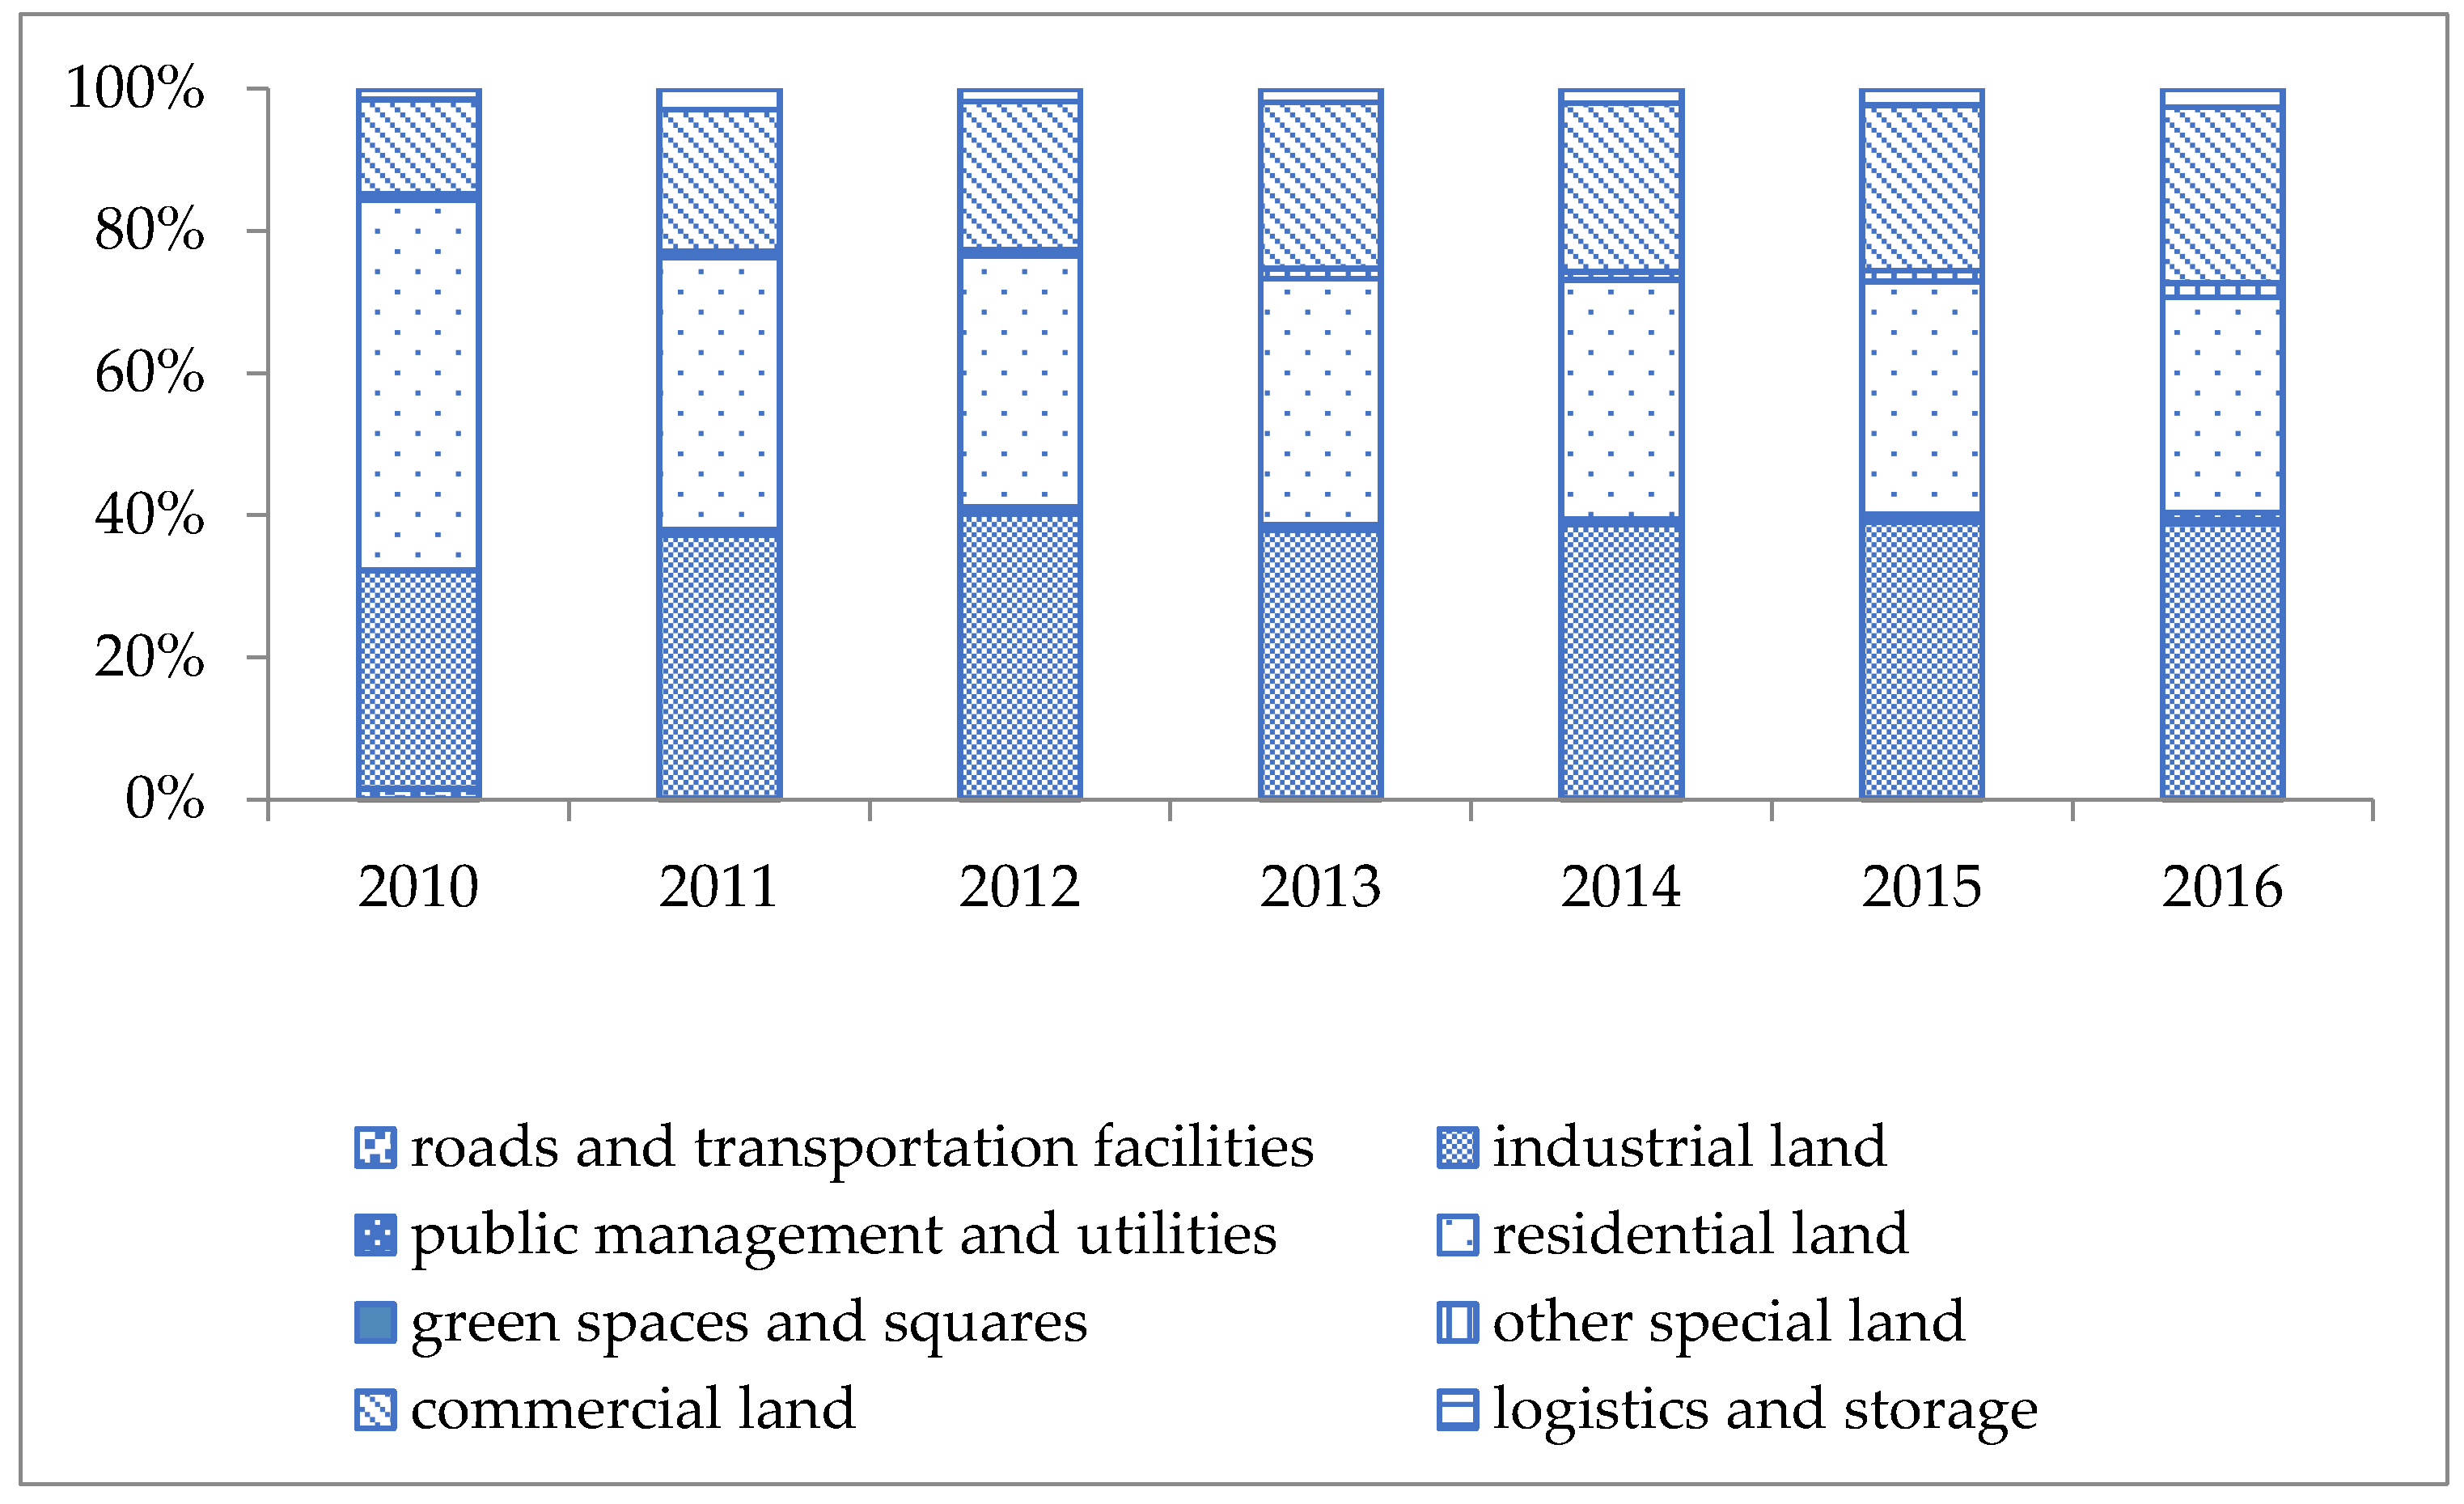
- Land Transfer Structure
- (4)
- Moderating Variables
3.3.3. Control Variables
3.4. Models
4. Empirical Results
4.1. Descriptive Analysis
4.2. Regression Results
4.2.1. Land Transaction Price and Carbon Emissions
4.2.2. Land Transaction Modes and Carbon Emissions
4.2.3. Land Transfer Structure and Carbon Emissions
4.2.4. The Moderation of Economic Development
4.2.5. The Moderation of Emission Reduction Policy
4.3. Robustness Test
5. Conclusions and Discussion
5.1. Conclusions
5.2. Discussion
5.3. Limitations and Future Considerations
Author Contributions
Funding
Institutional Review Board Statement
Informed Consent Statement
Data Availability Statement
Conflicts of Interest
References
- Cheng, S.L.; Fan, W.; Meng, F.X.; Chen, J.D.; Cai, B.F.; Liu, G.Y.; Liang, S.; Song, M.L.; Zhou, Y.; Yang, Z.F. Toward low-carbon development: Assessing emissions-reduction pressure among Chinese cities. J. Environ. Manag. 2020, 271, 111036. [Google Scholar] [CrossRef] [PubMed]
- Preston, B.J. The influence of the Paris agreement on climate litigation: Legal obligations and norms (Part I). J. Environ. Law 2021, 33, 1–32. [Google Scholar] [CrossRef]
- Talks, P.C. The 2 °C dream. Nature 2015, 527, 436–438. [Google Scholar]
- Guo, X.D.; Xiao, B.W.; Song, L.F. Emission reduction and energy-intensity enhancement: The expected and unexpected consequences of China’s coal consumption constraint policy. J. Clean. Prod. 2020, 271, 122691. [Google Scholar] [CrossRef]
- Yuan, Y.K.; Wang, Y.X.; Chi, Y.Y.; Jin, F. Identification of key carbon emission sectors and analysis of emission effects in China. Sustainability 2020, 12, 8673. [Google Scholar] [CrossRef]
- The Chinese Foreign Ministry Statement by Xi Jinping President of the People’s Republic of China at the General Debate of the 75th Session of the United Nations General Assembly. 2020. Available online: https://www.fmprc.gov.cn/mfa_eng/zxxx_662805/t1817098.shtml (accessed on 24 April 2022).
- Chen, J. Dynamic relationship between urban carbon dioxide emissions and economic growth. Glob. Nest J. 2020, 22, 632–641. [Google Scholar]
- Liu, W. EKC test study on the relationship between carbon dioxide emission and regional economic growth. Carbon Manag. 2020, 11, 415–425. [Google Scholar] [CrossRef]
- Wawrzyniak, D.; Doryn, W. Does the quality of institutions modify the economic growth-carbon dioxide emissions nexus? Evidence from a group of emerging and developing countries. Econ. Res. Ekon. Istraz. 2020, 33, 124–144. [Google Scholar] [CrossRef]
- Begum, R.A.; Pereira, J.J. The awareness, perception and motivational analysis of climate change and business perspectives in Malaysia. Mitig. Adapt. Strateg. Glob. Change 2015, 20, 361–370. [Google Scholar] [CrossRef]
- Wang, S.S.; Zhou, D.Q.; Zhou, P.; Wang, Q.W. CO2 emissions, energy consumption and economic growth in China: A panel data analysis. Energy Policy 2011, 39, 4870–4875. [Google Scholar] [CrossRef]
- Nie, H.; Xing, C. Education expansion, assortative marriage, and income inequality in China. China Econ. Rev. 2019, 55, 37–51. [Google Scholar] [CrossRef]
- Mushtaq, A.; Chen, Z.S.; Din, N.U.; Ahmad, B.; Zhang, X.L. Income inequality, innovation and carbon emission: Perspectives on sustainable growth. Econ. Res. Ekon. Istraz. 2020, 33, 769–787. [Google Scholar] [CrossRef]
- Falahatkar, S.; Rezaei, F. Towards low carbon cities: Spatio-temporal dynamics of urban form and carbon dioxide emissions. Remote Sens. Appl. Soc. Environ. 2020, 18, 100317. [Google Scholar] [CrossRef]
- Zhang, H.; Sun, X.M.; Wang, W.W. Study on the spatial and temporal differentiation and influencing factors of carbon emissions in Shandong province. Nat. Hazards 2017, 87, 973–988. [Google Scholar] [CrossRef]
- Zhang, Y.; Yu, Z.; Zhang, J. Research on carbon emission differences decomposition and spatial heterogeneity pattern of China’s eight economic regions. Environ. Sci. Pollut. Res. 2022, 29, 29976–29992. [Google Scholar] [CrossRef] [PubMed]
- Su, J.; Zhou, B.; Liao, Y.P.; Wang, C.S.; Feng, T. Impact mechanism of the urban network on carbon emissions in rapidly developing regions: Example of 47 cities in southwest China. Land 2022, 11, 458. [Google Scholar] [CrossRef]
- Pan, B.B.; Zhang, Y.L. Impact of affluence, nuclear and alternative energy on US carbon emissions from 1960 to 2014. Energy Strategy Rev. 2020, 32, 100581. [Google Scholar] [CrossRef]
- Wang, C.J.; Wang, F.; Zhang, X.L.; Deng, H.J. Analysis of influence mechanism of energy-related carbon emissions in Guangdong: Evidence from regional China based on the input-output and structural decomposition analysis. Environ. Sci. Pollut. Res. 2017, 24, 25190–25203. [Google Scholar] [CrossRef]
- Masson-Delmotte, V.; Zhai, P.; Pirani, A. IPCC Climate Change 2021: The physical science basis. In Contribution of Working Group I to the Sixth Assessment Report of the Intergovernmental Panel on Climate Change; Cambridge University Press: Cambridge, UK, 2021; Available online: https://www.ipcc.ch/report/ar6/wg1/downloads/report/IPCC_AR6_WGI_SPM_final.pdf (accessed on 13 December 2021).
- Houghton, R.A. The annual net flux of carbon to the atmosphere from changes in land use 1850–1990. Tellus Ser. B Chem. Phys. Meteorol. 1999, 51, 298–313. [Google Scholar] [CrossRef]
- Goldewijk, K.K.; Ramankutty, N. Land cover change over the last three centuries due to human activities: The availability of new global data sets. Geojournal 2004, 61, 335–344. [Google Scholar] [CrossRef]
- Dai, P.C.; Sheng, R.X.; Miao, Z.Z.; Chen, Z.X.; Zhou, Y. Analysis of spatial-temporal characteristics of industrial land supply scale in relation to industrial structure in China. Land 2021, 10, 1217. [Google Scholar] [CrossRef]
- Zhou, J.L.; Yu, X.F.; Jin, X.Z.; Mao, N.N. Government competition, land supply structure and semi-urbanization in China. Land 2021, 10, 1371. [Google Scholar] [CrossRef]
- Xiong, C.S.; Tan, R. Will the land supply structure affect the urban expansion form? Habitat Int. 2018, 75, 25–37. [Google Scholar] [CrossRef]
- Du, J.F.; Peiser, R.B. Land supply, pricing and local governments’ land hoarding in China. Reg. Sci. Urban Econ. 2014, 48, 180–189. [Google Scholar] [CrossRef]
- Zhou, L.; Tian, L.; Gao, Y.; Ling, Y.K.; Fan, C.J.; Hou, D.Y.; Shen, T.Y.; Zhou, W.T. How did industrial land supply respond to transitions in state strategy? An analysis of prefecture-level cities in China from 2007 to 2016. Land Use Policy 2019, 87, 29976–29992. [Google Scholar] [CrossRef]
- Lai, N.; Wang, K. Land-supply restrictions, developer strategies and housing policies: The case in Hong Kong. Int. Real Estate Rev. 1999, 2, 143–159. [Google Scholar] [CrossRef]
- Li, C.X.; Gao, X.; Wu, J.Y.; Wu, K.N. Demand prediction and regulation zoning of urban-industrial land: Evidence from Beijing-Tianjin-Hebei urban agglomeration, China. Environ. Monit. Assess. 2019, 191, 142. [Google Scholar] [CrossRef]
- Monkkonen, P. The demand for land regularisation: Theory and evidence from Tijuana, Mexico. Urban Stud. 2012, 49, 271–288. [Google Scholar] [CrossRef]
- Liao, C.; Jung, S.Y.; Brown, D.G.; Agrawal, A. Spatial patterns of large-scale land transactions and their potential socio-environmental outcomes in Cambodia, Ethiopia, Liberia, and Peru. Land Degrad. Dev. 2020, 31, 1241–1251. [Google Scholar] [CrossRef]
- Cacho, O.J.; Lipper, L.; Moss, J. Transaction costs of carbon offset projects: A comparative study. Ecol. Econ. 2013, 88, 232–243. [Google Scholar] [CrossRef]
- Zhu, E.; Deng, J.; Zhou, M.; Gan, M.; Jiang, R.; Wang, K.; Shahtahmassebi, A. Carbon emissions induced by land-use and land-cover change from 1970 to 2010 in Zhejiang, China. Sci. Total Environ. 2019, 646, 930–939. [Google Scholar] [CrossRef] [PubMed]
- Girod, B.; Stucki, T.; Woerter, M. How do policies for efficient energy use in the household sector induce energy-efficiency innovation? An evaluation of European countries. Energy Policy 2017, 103, 223–237. [Google Scholar] [CrossRef]
- Sakamoto, T.; Managi, S. New evidence of environmental efficiency on the export performance. Appl. Energy 2017, 185, 615–626. [Google Scholar] [CrossRef]
- Liu, Y.Q.; Zhao, G.H.; Zhao, Y.S. An analysis of Chinese provincial carbon dioxide emission efficiencies based on energy consumption structure. Energy Policy 2016, 96, 524–533. [Google Scholar] [CrossRef]
- Liu, Z.; Qin, C.X.; Zhang, Y.J. The energy-environment efficiency of road and railway sectors in China: Evidence from the provincial level. Ecol. Indic. 2016, 69, 559–570. [Google Scholar] [CrossRef]
- Zhu, X.H.; Zou, J.W.; Feng, C. Analysis of industrial energy-related CO2 emissions and the reduction potential of cities in the Yangtze River Delta region. J. Clean. Prod. 2017, 168, 791–802. [Google Scholar] [CrossRef]
- Muneer, T.; Celik, A.N.; Caliskan, N. Sustainable transport solution for a medium-sized town in Turkey-A case study. Sustain. Cities Soc. 2011, 1, 29–37. [Google Scholar] [CrossRef]
- Gregg, J.S.; Andres, R.J.; Marland, G. China: Emissions pattern of the world leader in CO2 emissions from fossil fuel consumption and cement production. Geophys. Res. Lett. 2008, 35. [Google Scholar] [CrossRef]
- Yang, H.; Flower, R.J.; Thompson, J.R. Pollution: China’s new leaders offer green hope. Nature 2013, 493, 163. [Google Scholar] [CrossRef]
- Chau, K.W.; Wong, S.K.; Yiu, C.Y.; Tse, M.K.; Pretorius, F.I. Do unexpected land auction outcomes bring new information to the real estate market? J. Real Estate Financ. Econ. 2010, 40, 480–496. [Google Scholar] [CrossRef][Green Version]
- Kumar, J.V.; Kumar, D.M.; Edukondalu, K. Strategic bidding using fuzzy adaptive gravitational search algorithm in a pool based electricity market. Appl. Soft Comput. 2013, 13, 2445–2455. [Google Scholar] [CrossRef]
- Zeng, D.; Yan, Z. Study of bidders’ bidding risk in financial transmission right markets of east China. East China Electr. Power 2010, 38, 150–155. [Google Scholar]
- Vickrey, W. Counterspeculation, auctions, and competitive sealed tenders. J. Financ. 1961, 16, 8–37. [Google Scholar] [CrossRef]
- Ding, C. Land policy reform in China: Assessment and prospects. Land Use Policy 2003, 20, 109–120. [Google Scholar] [CrossRef]
- Tao, R.; Su, F.; Liu, M.; Cao, G. Land Leasing and Local Public Finance in China’s Regional Development: Evidence from Prefecture-level Cities. Urban Stud. 2014, 47, 2217–2236. [Google Scholar]
- Huang, Z.H.; Du, X.J. Strategic interaction in local governments’ industrial land supply: Evidence from China. Urban Stud. 2017, 54, 1328–1346. [Google Scholar] [CrossRef]
- Wu, Y.Z.; Zhang, X.L.; Skitmore, M.; Song, Y.; Hui, E.C.M. Industrial land price and its impact on urban growth: A Chinese case study. Land Use Policy 2014, 36, 199–209. [Google Scholar] [CrossRef]
- LU, J.X.; Yu, L.L.; Chen, S.X. Industrial land conveyance, the investment quality race in the bottom line and environmental pollution. China Popul. Resour. Environ. 2017, 27, 90–98. [Google Scholar]
- Fan, J.Y.; Mo, J.W.; Zhang, J.P. Housing modes and urbanization in China-Emprical research from the perspective of land supply. Soc. Sci. China 2015, 36, 44–63. [Google Scholar]
- Du, W.J.; Li, M.J. The impact of land resource mismatch and land marketization on pollution emissions of industrial enterprises in China. J. Environ. Manag. 2021, 299, 113565. [Google Scholar] [CrossRef]
- Liu, J.J.; Jiang, Z.Q.; Chen, W.T. Land misallocation and urban air quality in China. Environ. Sci. Pollut. Res. 2021, 28, 58387–58404. [Google Scholar] [CrossRef] [PubMed]
- Meng, Y.J.; Wang, K.; Lin, Y.Y. The role of land use transition on industrial pollution reduction in the context of innovation-driven: The case of 30 provinces in China. Land 2021, 10, 353. [Google Scholar] [CrossRef]
- Tang, Z.H.; Bright, E.; Brody, S. Evaluating California local land use plan’s environmental impact reports. Environ. Impact Assess. Rev. 2009, 29, 96–106. [Google Scholar] [CrossRef]
- Zheng, Y.; Xie, X.L.; Lin, C.Z.; Wang, M.; He, X.J. Development as adaptation: Framing and measuring urban resilience in Beijing. Adv. Clim. Change Res. 2018, 9, 234–242. [Google Scholar] [CrossRef]
- Li, L.G.; Zhang, P.Y.; Li, X. Regional economic resilience of the old industrial bases in China: A case study of Liaoning province. Sustainability 2019, 11, 723. [Google Scholar] [CrossRef]
- Wu, Q.; Li, Y.L.; Yan, S.Q. The incentives of China’s urban land finance. Land Use Policy 2015, 42, 432–442. [Google Scholar]
- Yan, S.Q.; Ge, X.J.; Wu, Q. Government intervention in land market and its impacts on land supply and new housing supply: Evidence from major Chinese markets. Habitat Int. 2014, 44, 517–527. [Google Scholar] [CrossRef]
- Cai, H.B.; Henderson, J.V.; Zhang, Q.H. China’s land market auctions: Evidence of corruption? Rand J. Econ. 2013, 44, 488–521. [Google Scholar] [CrossRef]
- Feng, X.A.; Johansson, A.C. CEO incentives in Chinese state-controlled firms. Econ. Dev. Cult. Change 2017, 65, 223–264. [Google Scholar]
- Shi, T.; Zhang, W.; Zhou, Q.; Wang, K. Industrial structure, urban governance and haze pollution: Spatiotemporal evidence from China. Sci. Total Environ. 2020, 742, 139228. [Google Scholar] [CrossRef]
- Tang, P.; Shi, X.; Gao, J.; Feng, S.; Qu, F. Demystifying the key for intoxicating land finance in China: An empirical study through the lens of government expenditure. Land Use Policy 2019, 85, 302–309. [Google Scholar] [CrossRef]
- Coase, R.H. The problem of social cost. J. Law Econ. 1960, 3, 1–44. [Google Scholar] [CrossRef]
- Blair, B.F.; Hite, D. The impact of environmental regulations on the industry structure of landfills. Growth Change 2005, 36, 529–550. [Google Scholar] [CrossRef]
- Yu, B.; Xu, L.Y.; Yang, Z.F. Ecological compensation for inundated habitats in hydropower developments based on carbon stock balance. J. Clean. Prod. 2016, 114, 334–342. [Google Scholar] [CrossRef]
- Mi, Z.F.; Pan, S.Y.; Yu, H.; Wei, Y.M. Potential impacts of industrial structure on energy consumption and CO2 emission: A case study of Beijing. J. Clean. Prod. 2015, 103, 455–462. [Google Scholar] [CrossRef]
- Porter, M.E.; Van der Linde, C. Towards a new conception of the environment- competitiveness relationship. J. Econ. Perspect. 1995, 4, 97–118. [Google Scholar] [CrossRef]
- Shen, C.; Li, S.L.; Wang, X.P.; Liao, Z.J. The effect of environmental policy tools on regional green innovation: Evidence from China. J. Clean. Prod. 2020, 254, 120122. [Google Scholar] [CrossRef]
- Gong, M.Q.; You, Z.; Wang, L.T.; Cheng, J.H. Environmental regulation, trade comparative advantage, and the manufacturing industry’s green transformation and upgrading. Int. J. Environ. Res. Public Health 2020, 17, 2823. [Google Scholar] [CrossRef]
- Popp, D.; Newell, R.G.; Jaffe, A.B. Energy, the environment, and technological change. Handb. Econ. Innov. 2010, 2, 873–937. [Google Scholar]
- Costantini, V.; Mazzanti, M. On the green and innovative side of trade competitiveness? The impact of environmental policies and innovation on EU exports. Res. Policy 2012, 41, 132–153. [Google Scholar] [CrossRef]
- Mbanyele, W.; Wang, F.R. Environmental regulation and technological innovation: Evidence from China. Environ. Sci. Pollut. Res. 2022, 29, 12890–12910. [Google Scholar] [CrossRef]
- Du, W.; Li, M. Assessing the impact of environmental regulation on pollution abatement and collaborative emissions reduction: Micro-evidence from Chinese industrial enterprises—ScienceDirect. Environ. Impact Assess. Rev. 2020, 82, 106382. [Google Scholar] [CrossRef]
- Shapiro, J.S.; Walker, R. Why is pollution from us manufacturing declining? The roles of environmental regulation, productivity, and trade. Am. Econ. Rev. 2018, 108, 3814–3854. [Google Scholar] [CrossRef]
- Chen, J.D.; Gao, M.; Cheng, S.L.; Hou, W.X.; Song, M.L.; Liu, X.; Liu, Y.; Shan, Y.L. County-level CO2 emissions and sequestration in China during 1997–2017. Sci. Data 2020, 7, 1–13. [Google Scholar] [CrossRef]
- Huang, Z.H.; Du, X.J. Does air pollution affect investor cognition and land valuation? Evidence from the Chinese land market. Real Estate Econ. 2022, 50, 593–613. [Google Scholar] [CrossRef]
- Han, W.J.; Zhang, X.L.; Zheng, X. Land use regulation and urban land value: Evidence from China. Land Use Policy 2020, 92, 104432. [Google Scholar] [CrossRef]
- Deng, F.F. Public land leasing and the changing roles of local government in urban china. Ann. Reg. Sci. 2005, 39, 353–373. [Google Scholar] [CrossRef]
- Ho, S.P.; Lin, G.C. Emerging land markets in rural and urban China: Policies and practices. China Q. 2003, 175, 681–707. [Google Scholar]
- Xu, J.; Yeh, A.; Wu, F. Land commodification: New land development and politics in China since the late 1990s. Int. J. Urban Reg. Res. 2009, 33, 890–913. [Google Scholar] [CrossRef]
- Xu, J.; Yeh, A. Decoding urban land governance: State reconstruction in contemporary Chinese cities. Urban Stud. 2009, 46, 559–581. [Google Scholar]
- Mumtaz, F.; Tao, Y.; de Leeuw, G.; Zhao, L.; Fan, C.; Elnashar, A.; Bashir, B.; Wang, G.K.; Li, L.L.; Naeem, S.; et al. Modeling spatio-temporal land transformation and its associated impacts on land surface temperature (LST). Remote Sens. 2020, 12, 2987. [Google Scholar] [CrossRef]
- Huang, Z.H.; Du, X.J. Government intervention and land misallocation: Evidence from China. Cities 2017, 60, 323–332. [Google Scholar] [CrossRef]
- Zhou, B.; Zhang, C.; Wang, Q.W.; Zhou, D.Q. Does emission trading lead to carbon leakage in China? Direction and channel identifications. Renew. Sustain. Energy Rev. 2020, 132, 110090. [Google Scholar] [CrossRef]
- Li, H.A.; Wei, Y.M. Is it possible for China to reduce its total CO2 emissions? Energy 2015, 83, 438–446. [Google Scholar] [CrossRef]
- Dietz, T.; Rosa, E.A. Rethinking the environmental impacts of population, affluence and technology. Hum. Ecol. Rev. 1994, 1, 277–300. [Google Scholar]
- Martinez-Zarzoso, I.; Bengochea-Morancho, A. Pooled mean group estimation of an environmental Kuznets curve for CO2. Econ. Lett. 2004, 82, 121–126. [Google Scholar] [CrossRef]
- Chatterjee, S.; Price, B. Regression analysis by example. J. Am. Stat. Assoc. 1980, 75. [Google Scholar] [CrossRef]
- Li, F.; Su, Y.; Xie, J.P.; Zhu, W.J.; Wang, Y.H. The impact of High-Speed Rail opening on city economics along the Silk Road Economic Belt. Sustainability 2020, 12, 3176. [Google Scholar] [CrossRef]
- Chen, J. High-speed rail and energy consumption in China: The intermediary roles of industry and technology. Energy 2021, 230, 120816. [Google Scholar] [CrossRef]


| Variable Name | Measurement |
|---|---|
| Carbon dioxide emissions (CE) | Natural log of annual carbon dioxide emissions of cities |
| Land transaction price (Landprice) | Natural log of urban land transaction price per year divided by total land transaction area |
| Proportion of residential land (Residential) | Cities’ number of urban residential land transactions per year divided by land transactions |
| Proportion of commercial land (Commercial) | Cities’ number of commercial land transactions per year divided by land transactions |
| Proportion of industrial land (Industrial) | Cities’ number of industrial land transactions per year divided by land transactions |
| Auction | Natural log of land transactions in cities by auction every year |
| Listing | Natural log of land transactions in cities by listing every year |
| Bidding | Natural log of land transactions in cities by bidding every year |
| Economic development level (Rgdp) | Natural log of cities’ per capita GDP every year |
| Greenhouse gas emission reduction policy (Gerp) | 1 if the year is after 2010; otherwise, 0 |
| Industrial structure (Industry3) | Proportion of tertiary industry in urban GDP |
| Technical structure (Industry2) | Proportion of secondary industry in urban GDP |
| Manufacturing employment (Staff) | Natural log of urban annual manufacturing employment |
| Sulfur dioxide emissions (SE) | Natural log of annual sulfur dioxide emission of cities |
| Green area (Green) | Natural log of urban green space area |
| Government intervention (Gov) | Natural log of cities’ total fiscal expenditure at the end of the year |
| Population density (Pop) | Natural log of population per unit area in urban administrative area |
| Variables | Mean | S. D. | Min | Max |
|---|---|---|---|---|
| 1. CE | 29.344 | 25.188 | 0.464 | 230.710 |
| 2. Landprice | 5.453 | 1.286 | 0.000 | 12.084 |
| 3. Auction | 3.300 | 1.423 | 0.693 | 7.096 |
| 4. Listing | 4.976 | 0.966 | 0.693 | 7.340 |
| 5. Bidding | 2.446 | 1.398 | 0.693 | 6.555 |
| 6. Residential | 0.345 | 0.149 | 0.000 | 0.902 |
| 7. Commercial | 0.227 | 0.122 | 0.000 | 1.000 |
| 8. Industrial | 0.378 | 0.160 | 0.000 | 1.000 |
| 9. Rgdp | 10.525 | 0.731 | 6.639 | 13.135 |
| 10. Gerp | 0.857 | 0.350 | 0.000 | 1.000 |
| 11.Industry3 | 0.379 | 0.093 | 0.098 | 0.802 |
| 12.Industry2 | 0.494 | 0.103 | 0.150 | 0.898 |
| 13. Staff | 6.110 | 4.675 | 0.058 | 14.771 |
| 14. SE | 10.550 | 1.157 | 1.099 | 14.238 |
| 15. Green | 8.143 | 1.059 | 3.219 | 11.881 |
| 16. Gov | 13.647 | 1.042 | 11.028 | 18.050 |
| 17. Pop | 5.745 | 0.905 | 1.800 | 7.882 |
| Variables | 1 | 2 | 3 | 4 | 5 | 6 | 7 | 8 | 9 |
|---|---|---|---|---|---|---|---|---|---|
| 1. CE | 1.000 | ||||||||
| 2. Landprice | 0.093 | 1.000 | |||||||
| 3. Auction | 0.021 | 0.190 | 1.000 | ||||||
| 4. Listing | 0.370 | 0.100 | 0.177 | 1.000 | |||||
| 5. Bidding | 0.008 | −0.104 | 0.097 | 0.043 | 1.000 | ||||
| 6. Residential | −0.170 | 0.149 | 0.181 | −0.011 | −0.089 | 1.000 | |||
| 7.Commercial | 0.013 | −0.072 | −0.088 | −0.109 | −0.048 | −0.320 | 1.000 | ||
| 8. Industrial | 0.153 | −0.064 | −0.074 | 0.118 | 0.141 | −0.440 | −0.470 | 1.000 | |
| 9. Rgdp | 0.469 | 0.053 | −0.096 | 0.117 | −0.097 | −0.375 | 0.131 | 0.224 | 1.000 |
| 10. Gerp | 0.045 | −0.024 | 0.104 | 0.145 | −0.049 | −0.082 | 0.118 | −0.015 | 0.177 |
| 11. Industry3 | 0.343 | 0.119 | −0.116 | 0.015 | −0.128 | −0.161 | 0.167 | −0.014 | 0.332 |
| 12. Industry2 | 0.010 | −0.061 | 0.034 | 0.035 | 0.051 | −0.093 | −0.122 | 0.200 | 0.253 |
| 13. Staff | 0.162 | −0.018 | 0.106 | 0.194 | −0.107 | −0.180 | 0.113 | 0.050 | 0.319 |
| 14. SE | 0.437 | 0.040 | 0.006 | 0.205 | 0.035 | 0.016 | −0.082 | 0.071 | 0.208 |
| 15. Green | 0.591 | 0.125 | 0.049 | 0.194 | 0.005 | −0.222 | −0.060 | 0.250 | 0.644 |
| 16. Gov | 0.612 | 0.159 | 0.032 | 0.181 | −0.104 | −0.232 | −0.011 | 0.216 | 0.656 |
| 17. Pop | 0.261 | 0.196 | 0.149 | 0.037 | 0.022 | −0.042 | −0.248 | 0.250 | 0.160 |
| Variables | 10 | 11 | 12 | 13 | 14 | 15 | 16 | 17 | |
| 10. Gerp | 1.000 | ||||||||
| 11. Industry3 | 0.098 | 1.000 | |||||||
| 12. Industry2 | −0.060 | −0.676 | 1.000 | ||||||
| 13. Staff | 0.352 | 0.342 | −0.172 | 1.000 | |||||
| 14. SE | −0.018 | −0.089 | 0.351 | −0.115 | 1.000 | ||||
| 15. Green | 0.068 | 0.449 | 0.033 | 0.272 | 0.237 | 1.000 | |||
| 16. Gov | 0.180 | 0.536 | −0.063 | 0.379 | 0.161 | 0.826 | 1.000 | ||
| 17. Pop | 0.004 | 0.180 | 0.106 | 0.149 | 0.130 | 0.452 | 0.512 | 1.000 |
| Variables | Model (1) | Model (2) |
|---|---|---|
| Landprice | −0.123 ** | |
| (−2.233) | ||
| Industry3 | 11.164 | −3.569 |
| (1.525) | (−0.525) | |
| Industry2 | 16.295 *** | 3.075 |
| (2.788) | (0.582) | |
| Staff | −0.005 | 0.132 |
| (−0.226) | (0.585) | |
| SE | 0.534 *** | 0.227 ** |
| (4.558) | (1.974) | |
| Green | 1.081 *** | 0.207 |
| (3.889) | (0.889) | |
| Gov | 2.217 *** | −0.266 |
| (8.331) | (−0.984) | |
| Pop | 4.261 *** | 2.657 |
| (3.981) | (1.386) | |
| Constant | −51.872 *** | 10.332 |
| (−6.919) | (0.887) | |
| Year | NO | YES |
| City | NO | YES |
| Observations | 2037 | 2037 |
| R-squared | 0.291 | 0.315 |
| Variables | Model (3) | Model (4) | Model (5) |
|---|---|---|---|
| Auction | −0.210 *** | ||
| (−2.927) | |||
| Listing | −0.618 *** | ||
| (−5.257) | |||
| Bidding | −0.296 * | ||
| (−1.904) | |||
| Industry3 | −5.132 | −3.952 | −13.745 |
| (−0.768) | (−0.581) | (−0.997) | |
| Industry2 | −0.835 | 3.517 | −1.133 |
| (−0.160) | (0.669) | (−0.101) | |
| Staff | 0.747 *** | 0.235 | 0.523 |
| (3.217) | (1.043) | (1.108) | |
| SE | 0.204 * | 0.172 | 0.738 *** |
| (1.704) | (1.497) | (3.269) | |
| Green | 0.204 * | 0.229 | 1.005 |
| (1.704) | (0.990) | (1.619) | |
| Gov | −0.536 ** | −0.253 | −0.261 |
| (−2.153) | (−0.942) | (−0.488) | |
| Pop | 4.427 ** | 3.073 | 1.774 |
| (2.410) | (1.602) | (0.554) | |
| Constant | 4.117 | 10.801 | 13.569 |
| (0.364) | (0.928) | (0.595) | |
| Year | YES | YES | YES |
| City | YES | YES | YES |
| Observations | 2037 | 2037 | 2037 |
| R-squared | 0.442 | 0.327 | 0.350 |
| Variables | Model (6) | Model (7) | Model (8) |
|---|---|---|---|
| Residential | −2.005 *** | ||
| (−3.224) | |||
| Commercial | 0.291 | ||
| (0.405) | |||
| Industrial | 1.691 *** | ||
| (2.957) | |||
| Industry3 | −1.551 | −3.479 | −2.359 |
| (−0.228) | (−0.511) | (−0.347) | |
| Industry2 | 4.694 | 3.113 | 4.036 |
| (0.886) | (0.588) | (0.764) | |
| Staff | 0.141 | 0.122 | 0.100 |
| (0.627) | (0.540) | (0.447) | |
| SE | 0.248 ** | 0.231 ** | 0.243 ** |
| (2.154) | (2.005) | (2.117) | |
| Green | 0.187 | 0.199 | 0.202 |
| (0.807) | (0.852) | (0.871) | |
| Gov | −0.294 | −0.269 | −0.276 |
| (−1.088) | (−0.993) | (−1.023) | |
| Pop | 2.915 | 2.527 | 2.810 |
| (1.521) | (1.316) | (1.466) | |
| Constant | 8.334 | 11.043 | 7.937 |
| (0.715) | (0.946) | (0.679) | |
| Year | YES | YES | YES |
| City | YES | YES | YES |
| Observations | 2037 | 2037 | 2037 |
| R-squared | 0.317 | 0.312 | 0.317 |
| Variables | Model (9) | Model (10) | Model (11) | Model (12) | Model (13) | Model (14) |
|---|---|---|---|---|---|---|
| Landprice | −0.177 *** | |||||
| (−3.176) | ||||||
| Auction | −0.182 ** | |||||
| (−2.557) | ||||||
| Listing | −0.544 *** | |||||
| (−4.450) | ||||||
| Bidding | −0.322 ** | |||||
| (−2.063) | ||||||
| Residential | −2.154 *** | |||||
| (−3.445) | ||||||
| Industrial | 1.536 *** | |||||
| (2.680) | ||||||
| Rgdp× Landprice | −0.358 *** | |||||
| (−4.872) | ||||||
| Rgdp× Auction | −0.449 *** | |||||
| (−5.619) | ||||||
| Rgdp× Listing | −0.225 ** | |||||
| (−2.214) | ||||||
| Rgdp× Bidding | −0.297 * | |||||
| (−1.756) | ||||||
| Rgdp× Residential | −1.526 ** | |||||
| (−2.119) | ||||||
| Rgdp× Industrial | 1.868 *** | |||||
| (2.874) | ||||||
| Rgdp | 0.003 | 1.585 *** | 1.047 ** | 0.884 | 0.583 | −0.645 * |
| (0.014) | (4.412) | (2.009) | (1.545) | (1.528) | (−1.902) | |
| Constant | 5.911 | 3.703 | 9.595 | 10.967 | 8.813 | 7.300 |
| (0.509) | (0.331) | (0.823) | (0.480) | (0.755) | (0.625) | |
| Controls | YES | YES | YES | YES | YES | YES |
| Year | YES | YES | YES | YES | YES | YES |
| City | YES | YES | YES | YES | YES | YES |
| Observations | 2037 | 2037 | 2037 | 2037 | 2037 | 2037 |
| R-squared | 0.326 | 0.460 | 0.329 | 0.354 | 0.320 | 0.321 |
| Variables | Model (15) | Model (16) | Model (17) | Model (18) | Model (19) | Model (20) |
|---|---|---|---|---|---|---|
| Landprice | −0.178 *** | |||||
| (−3.139) | ||||||
| Auction | −0.210 *** | |||||
| (−2.923) | ||||||
| Listing | −0.510 *** | |||||
| (−4.404) | ||||||
| Bidding | −0.289 * | |||||
| (−1.852) | ||||||
| Residential | −2.068 *** | |||||
| (−3.305) | ||||||
| Industrial | 1.666 *** | |||||
| (2.891) | ||||||
| Gerp× Landprice | −0.348 *** | |||||
| (−3.728) | ||||||
| Gerp× Auction | −0.075 | |||||
| (−0.740) | ||||||
| Gerp× Listing | 1.106 *** | |||||
| (7.694) | ||||||
| Gerp× Bidding | −0.129 | |||||
| (−0.683) | ||||||
| Gerp× Residential | −0.857 | |||||
| (−0.924) | ||||||
| Gerp× Industrial | −0.320 | |||||
| (−0.375) | ||||||
| Gerp | 1.663 | −3.718 * | −3.317 | −2.265 | 1.776 | 1.976 |
| (0.800) | (−1.723) | (−1.568) | (−0.512) | (0.837) | (0.944) | |
| Constant | 9.442 | 0.492 | 10.378 | 10.038 | 10.232 | 9.343 |
| (0.812) | (0.043) | (0.910) | (0.428) | (0.875) | (0.798) | |
| Controls | YES | YES | YES | YES | YES | YES |
| Year | YES | YES | YES | YES | YES | YES |
| City | YES | YES | YES | YES | YES | YES |
| Observations | 2037 | 2037 | 2037 | 2037 | 2037 | 2037 |
| R-squared | 0.322 | 0.443 | 0.354 | 0.351 | 0.318 | 0.317 |
Publisher’s Note: MDPI stays neutral with regard to jurisdictional claims in published maps and institutional affiliations. |
© 2022 by the authors. Licensee MDPI, Basel, Switzerland. This article is an open access article distributed under the terms and conditions of the Creative Commons Attribution (CC BY) license (https://creativecommons.org/licenses/by/4.0/).
Share and Cite
Zeng, L.; Wang, Y.; Deng, Y. How Land Transactions Affect Carbon Emissions: Evidence from China. Land 2022, 11, 751. https://doi.org/10.3390/land11050751
Zeng L, Wang Y, Deng Y. How Land Transactions Affect Carbon Emissions: Evidence from China. Land. 2022; 11(5):751. https://doi.org/10.3390/land11050751
Chicago/Turabian StyleZeng, Longji, Yuandi Wang, and Yajuan Deng. 2022. "How Land Transactions Affect Carbon Emissions: Evidence from China" Land 11, no. 5: 751. https://doi.org/10.3390/land11050751
APA StyleZeng, L., Wang, Y., & Deng, Y. (2022). How Land Transactions Affect Carbon Emissions: Evidence from China. Land, 11(5), 751. https://doi.org/10.3390/land11050751