Article

Evaluation of Protected Areas in Côte d’Ivoire and Ghana, West Africa, Using a Remote Sensing-Based Approach

by
Minerva Singh
*,
Lorena M. Massimino
and
Catherine Matilda Collins
Centre for Environmental Policy, Imperial College London, London SW7 2BX, UK
*
Author to whom correspondence should be addressed.
Land 2022, 11(5), 720; https://doi.org/10.3390/land11050720
Submission received: 11 March 2022 / Revised: 20 April 2022 / Accepted: 4 May 2022 / Published: 10 May 2022
(This article belongs to the Special Issue Forest Ecosystems: Protection and Restoration)

Abstract

:
This study assesses the representation of defined ecoregions, slope profiles, and species richness of threatened mammals in the International Union for Conservation of Nature (IUCN)-listed protected areas in Ghana and Côte d’Ivoire. It also evaluates the exposure of protected area categories to the cumulative degree of human modification and their vulnerability to future agricultural expansion. Spatial gap and statistical analyses were performed using quantitative data from publicly available online global databases. Analyses indicated key conservation priorities for both countries: (1) to increase the protection of the Guinean forest–savanna mosaic, West Sudanian savanna, and Eastern Guinean forests, especially of the Eastern Guinean forests’ ecoregion associated with the Guinean forests of the West Africa biodiversity hotspot; (2) to increase the protected area coverage of flat lands and low slopes; and (3) to enhance the size and connectivity of existing protected areas, including restoring degraded habitats. The study emphasizes that improving the ability of tropical protected areas to conserve nature and mitigate anthropogenic threats should be a global conservation priority. Improving the data quality and detail within the World Database on Protected Areas and ground-truthing them are recommended urgently to support accurate and informative assessments.

1. Introduction

The varied West African ecoregions, from wooded savannas to tropical forests, are home to more than 2000 amphibian, bird, and mammal species [1]. The Guinean forests of West Africa are a global biodiversity hotspot with “high numbers of endemic species (>1000 endemic plants) and high levels of habitat loss (<30.0% of natural habitats remaining)” [2]. Protected areas (PAs) are “clearly defined geographical space, recognized, dedicated and managed, through legal or other effective means, to achieve the long-term conservation of nature with associated ecosystem services and cultural values” and are vital for biodiversity conservation [3]. They have six categories recognized by the International Union for Conservation of Nature (IUCN) (Table 1) ranging from Category I, which restricts human access, to Category VI, which allows some human activities [3]. Their primary management objective is to conserve nature and, though they can have other economic and development objectives, these must not interfere with the primary objective. However, most PAs in Africa are not located to provide suitable or sufficient coverage of ecoregions, threatened species, and topographic diversity [4,5]. As West Africa in particular has seen a severe decline in the populations of medium- to large-sized vertebrates [6], this presents an opportunity for strategic improvement.
Critics argue that “providing at the same time a sustainable flow of natural products and services to meet community needs” in PAs with multiple management objectives has negative impacts on species and ecosystem diversity [7,8,9]. However, supporters make the case that they can be just as effective, and sometimes even more effective, at conserving nature [10,11]. Multiuse PAs have been noted as having fewer forest fires than stricter PAs (I-IV), thus reducing deforestation, and Category VI may be essential for areas at high risk of losing relatively natural ecosystems due to economic development, as they may support socio-economic benefits and ecological objectives simultaneously [12]. Conservation planning must balance conservation and community and therefore a range of IUCN Categories is required to balance biodiversity and socioeconomic goals, especially in developing regions such as West Africa. An assessment of African PAs concluded that national parks (NP), usually Category II, have been most successful at habitat and species conservation [13]. Most West African PAs lack an assigned category, though there is slight evidence that, in those that do, strictness works, and the abundant V and VI Categories performed worse than the less-used Categories I–IV [2].
International agreements such as the 2011–2020 Aichi Biodiversity Targets and the 2015 United Nations Sustainable Development Goals (SDGs) are clear about the need to preserve biodiversity and have supported global coverage of terrestrial PAs increasing to 15.2% in 2020, mainly through the designation of less-strict, multiple-use reserves (Categories V and VI) [2,14]. Through the provision of ecosystem services, the decline of biodiversity affects both natural and human systems. Biodiversity and ecosystem loss thus hinders reaching SDGs on poverty, hunger, health, water, cities, climate, oceans, and land [15,16].
The representation approach aims to conserve species, distinct ecosystems, and ecological processes. It suggests that all ecosystems should be represented in PAs [17,18] and was developed to complement the biodiversity hotspot approach. Representation is thus a key consideration when selecting PAs to ensure the full range of ecosystems, and species are included, as highlighted by Aichi Target 11 which aims for ecologically representative PAs [19]. Almost twenty years ago, in 2002, the World Wildlife Fund (WWF) identified the “Global 200” ecoregions “where the Earth’s biological wealth is most distinctive and rich, where its loss will be most severely felt, and where we must fight the hardest for conservation” [20]. Subsequently, many fewer speciose ecoregions may have been overlooked by conservation efforts, and yet remain important due to their unique species and ecological processes [21,22]. Currently, the capacity of PAs to conserve biodiversity varies across different IUCN categories and regions [23]. It is considered crucial that PAs across West Africa are managed, modified, and expanded to improve their capacity to conserve biodiversity [24] and that representation analyses from similar contexts [25,26] may have something to contribute.
Gap analysis is a systematic approach for identifying the extent to which protected regions effectively represent habitats or species’ ranges by quantifying the proportion of coverage provided to the target habitat/species range/ecosystem [25]. Gap analyses of West African PAs indicate that the Central African mangrove and Guinean mangrove ecoregions are well represented, while montane areas are underrepresented as is Guinea’s West Sudanian savanna ecoregion [22,24,26]. Globally, the overall representation of ecoregions in PAs is significantly reduced among stricter PA categories [23]. An analysis of global protected forests concluded that “65% of the 670 ecoregions with forests have less than 10% of their forest cover protected IUCN I-IV” [27].
Topography also influences the accessibility of PAs, with steeper slopes being less suited for agriculture of lower economic value and often more distant from cities, which together may mitigate anthropogenic threats [4,28,29]. In Tanzania, PAs on the steepest terrain consistently experienced less habitat conversion relative to lower, flatter areas [30]. Globally, PAs are disproportionately located in areas with steeper slopes and higher elevations. Additionally, PA Categories I and II are located on significantly higher and steeper lands than PA Categories III to VI [4,28]. Topography also inversely correlates with the species richness pattern of terrestrial vertebrates as lower elevations have higher richness [31,32].
Species richness and the IUCN “Red List” of species threatened with extinction (i.e., those species that are critically endangered, endangered, or vulnerable) are widely used in conservation planning to identify where protection is needed [33]. Species richness, though, may be a blunt measure as it does not take into account species identity or interactions [34,35]. Many threatened species are poorly protected by PAs, with high percentages identified as a gap or partial gap species. Currently, West Africa’s PAs offer no protection to 6% of the known threatened amphibian, bird, and mammal species [36,37].
The principal threats facing West African PAs are agricultural expansion, logging, hunting (mainly for bushmeat), urban development, energy production, and mining. The pressure of cropland conversion has increased more within PAs than outside, especially in the Afro-tropics, and several African PAs have disappeared or greatly reduced in size because they were unable to mitigate anthropogenic threats. As small PAs are more vulnerable to threats, and West Africa has many small, highly fragmented PAs, their future efficacy is at risk [13].
Growing anthropogenic threats are affecting the efficacy of PAs across Africa. Agricultural expansion has already led to widespread deforestation in West Africa with 80.0% of original forests now forest–agriculture mosaics [6]. West African PAs have struggled to mitigate threats and maintain their species populations [38]. There is an ongoing debate on the capacity of different IUCN categories to deliver intended conservation outcomes, especially surrounding multiple-use PAs [39]. Despite the loss of species, the forests of West Africa are not as well-studied as other forested regions [40,41]. Ghana and Côte d’Ivoire were chosen for this study as remote spatial data exists and they face specific threats from further agricultural expansion which adds urgency to their wildlife [1].
PAs are the last strongholds of many mammal species, and their poor management can result in a decrease in mammal diversity. African PAs have seen a large mammal population decline, largely driven by anthropogenic pressures [42,43,44]. Previous studies have used mammals as a proxy for conservation and PA efficacy [45,46]. Hence, for this study, threatened mammal species were used for the analysis of the representation of endangered species in PAs.
In this study, the degree of representation of named ecoregions, varying slope profiles and mammal species richness was assessed within PAs of different categories in Ghana and Côte d’Ivoire. The exposure of PAs in different categories to human modification and their predicted vulnerability to future development were also estimated. Together, these can help identify priorities for future PA expansion and management in the two countries and the region more generally. This contributes to an assessment of the future developmental threat of agricultural expansion faced by the PAs of different countries and across different PA categories and is also required to develop data-driven conservation plans [47].

2. Materials and Methods

This study applies multiple measures: ecoregion representation, slope representation, species richness, human modification (HMc), and development threats faced by PAs. Spatial gap analysis via Geographic Information System (QGIS; GRASS GIS® version 3) and statistical analysis via RStudio (version 3.5.3) used data from online global databases (see Section 2.2). The increasing availability of such remotely sensed and spatial data enables more quantitative assessments of PAs [4,48].

2.1. Site Descriptions

Côte d’Ivoire and Ghana sit beside each other in the tropical belt of West Africa with Atlantic coastlines on the Gulf of Guinea. They are socio-culturally, geographically, and climatically diverse and both countries extend over 600 km from the coastal regions in the south to savanna regions in the north.

2.1.1. Ghana’s Protected Areas

Around 15% of Ghana’s land is protected, and the Wildlife Division of the Forestry Commission is responsible for PAs [47]. An IUCN assessment of management effectiveness for eight PAs concluded that there is a “fair representation” of all ecosystems from the Guinean savanna woodland to evergreen forests [49]. Steeper slope representation is limited, with only the Kyabobo PA located in a high montane range. There are gaps in biodiversity data for many taxa in Ghana [47] and across West Africa [50], though larger mammals may be the best recorded [51]. In Ghana, 23 mammal species are categorized as threatened on the IUCN “Red List” [13], and the chimpanzees in Ankasa Resource Reserve and lion populations in Mole NP are vulnerable [49]. The main anthropogenic threats facing PAs are agriculture (farming or grazing around and within PAs), poaching, extractive industry (logging, mining, oil, and gas), human settlement, and illegal extraction of natural resources [6,49,52], and these are exacerbated by a growing population of over 30 million people [53]. Most land surrounding PAs has been converted for agricultural use [13], and the principal driver in southwestern parts is cocoa farming. The complete clearance of tropical dry forests inside Kogyae (Category Ia) was due to arable farming and logging [54]. Some PAs have been able to mitigate threats; Bui NP has maintained its lion populations despite being in a highly agricultural area and Nini–Suhien NP remains unlogged [49]. Nevertheless, PAs across all categories in Ghana are increasingly vulnerable to human pressures [55].

2.1.2. Côte d’Ivoire’s Protected Areas

Approximately 23% of Côte d’Ivoire is protected, although only 15 PAs have an assigned IUCN category, with the majority classified as forest reserves [14]. There are 34 mammal species identified as threatened on the IUCN Red List [13]. Cavally, Goin-Débé, and Haute Dodo classified forests provide coverage for endangered species [6], and the Comoé NP is a “rare sanctuary” for West African species [1]. Chimpanzee populations are facing severe population decline within PAs, including Marahoué NP [56]. An IUCN study of ten PAs in Côte d’Ivoire concluded that the areas “were under so much pressure that their survival was jeopardized” [6]. The leading driver of deforestation is land conversion for farming, followed by poaching and logging, all fueled by a growing population of almost 26 million inhabitants [57,58]. The southern part of the country is a rich agricultural area, especially for cocoa. The savanna ecoregions are being degraded by rainfed agriculture [1] and illegal cocoa plantations, and years of civil conflict caused the forests in Marahoué NP to disappear by 2014. Comoé NP, which experiences some cattle grazing and poaching, has been successful at mitigating threats with little modification to its natural habitats [1].

2.2. Data Sources

Country boundaries: Country outlines were downloaded from the “Administrative Areas” (version 1) dataset of DIVA-GIS’s database [59]. The total area of Ghana (239,981 km2) and Côte d’Ivoire (322,216 m2) was calculated from these.
Protected areas: The PA data was taken from the World Database on Protected Areas (WDPA). The June 2020 polygon dataset was used for Côte d’Ivoire and the July 2020 polygon dataset for Ghana [14]. Data included IUCN categories I to VI, “Not Reported” (PAs without an assigned IUCN category or for which there is no information) and “Not Applicable” (PAs with other specific designation types: World Heritage Sites or UNESCO Man and Biosphere (MAB) Reserves) [14], see Table 2.
The WDPA is the most comprehensive dataset for PAs, however, there are recognized limitations. Firstly, the data is in two different formats: points and polygons [60]. Here, only polygon shapefiles were used and PAs added as points (a small proportion of PAs in the database) were excluded [14,24]. Secondly, the data is not always up-to-date and contains inaccuracies as it relies on country submissions [24]. Three categories of overlap were found: (1) between PAs with different IUCN categories including “Not Reported”, (2) between PAs with the same IUCN category, and (3) between areas with an IUCN category and specific designation type (World Heritage Sites or UNESCO MAB Reserves). This was addressed using the OECD Statistics Terrestrial Protected Area Indicator method [60]. Where PAs with different IUCN Categories overlap, the overlapped area was subtracted from the PA with the lower category (“Not Reported” being the lowest). For PAs in the same category, the overlapped area was split equally between the two. For PAs with specific designations that overlapped with IUCN category designations, the specific designations were removed. A detailed overview of what the different categorizations mean has been provided in Table 2.
Ecoregions: The Nature Conservancy (TNC) defines ecoregions as areas that are unified in climate, topography, geology, and vegetation [61]. The Terrestrial Ecoregions of the world dataset from TNC were used to identify ecoregions; this dataset includes 814 ecoregions [61].
Slope: Digital elevation models (DEM) at 90.0 m resolution (version 1.0) were sourced from DIVA-GIS’s database [59]. The data was originally produced by the National Aeronautics and Space Administration’s (NASA) Shuttle Radar Topographic Mission in 2003 and then processed by the Consortium for Spatial Information (CGIAR-CSI) [62]. The slope data were derived from the DEMs.
Species richness: Data was extracted from the “All Threat Categories Global Mammal Richness Grids 2015” (~1.0 km) dataset from the NASA Socioeconomic Data and Applications Center (SEDAC). The threat categories (critically endangered, endangered, and vulnerable) are based on the 2013 “Red List” status. The grid-cell values represent the number of species in the threat categories [63].
Human modification: The HMc data was obtained from the Global Human Modification of Terrestrial Systems 2016 (1.0 km) dataset from SEDAC. It uses a continuous 0–1 scale that represents the proportion of land that has been modified by five major human threats: human settlement, agriculture, transportation, mining, energy production, and electrical infrastructure. Data on threats have a median year of 2016.
Agricultural Expansion Potential: Data on future development threats from agricultural expansion were extracted from SEDAC’s “Development Threat Index: Agricultural Expansion 2015” (50.0 km2) dataset. The potential for future development is ranked from 0–100, where 100 represents the highest potential. The “threat scores are based on estimates of the fractional amount of agricultural expansion by 2030 extrapolated from 2000–2011 time series maps” [64].

2.3. Spatial Analyses

Representation within PAs of ecoregions, slope (four classes [65]: flat, low, medium, and high), and median species richness were assessed using gap analysis. By identifying “gaps’ in the coverage of geophysical features or species in the PA network, areas that should become conservation priorities are highlighted [19,22,36]. Using QGIS, the ecoregion, slope, and species richness maps were superimposed over the PA maps to identify the spatial resolution of the spatial distribution of HMc and agricultural expansion threat [64,66].

2.4. Comparison Index

To measure ecoregion and slope representation, the comparison index (CI) was calculated [67]. This divides the proportion of protected land in a given ecoregion or slope category by that category’s share of the country’s total land area. A CI index >1 indicates good representation, and an index <1 indicates poor representation [22,67]. The CI was calculated for all PAs (categories I to VI, “Not Reported” and “Not Applicable”) grouped and for each category (I to VI) [68] and is a useful approach to identify underrepresented areas and compare representation across PA categories.

2.5. Statistical Summaries

The median, mean, and CI of species richness, cumulative human modification (HMc,), and development threat from agricultural expansion values for each PA were estimated by using QGIS to sample these measures at 1000 random points within each PA. This provides a robust estimate for most PAs, though there may be some spatial confounding of samples within small PAs.

3. Results

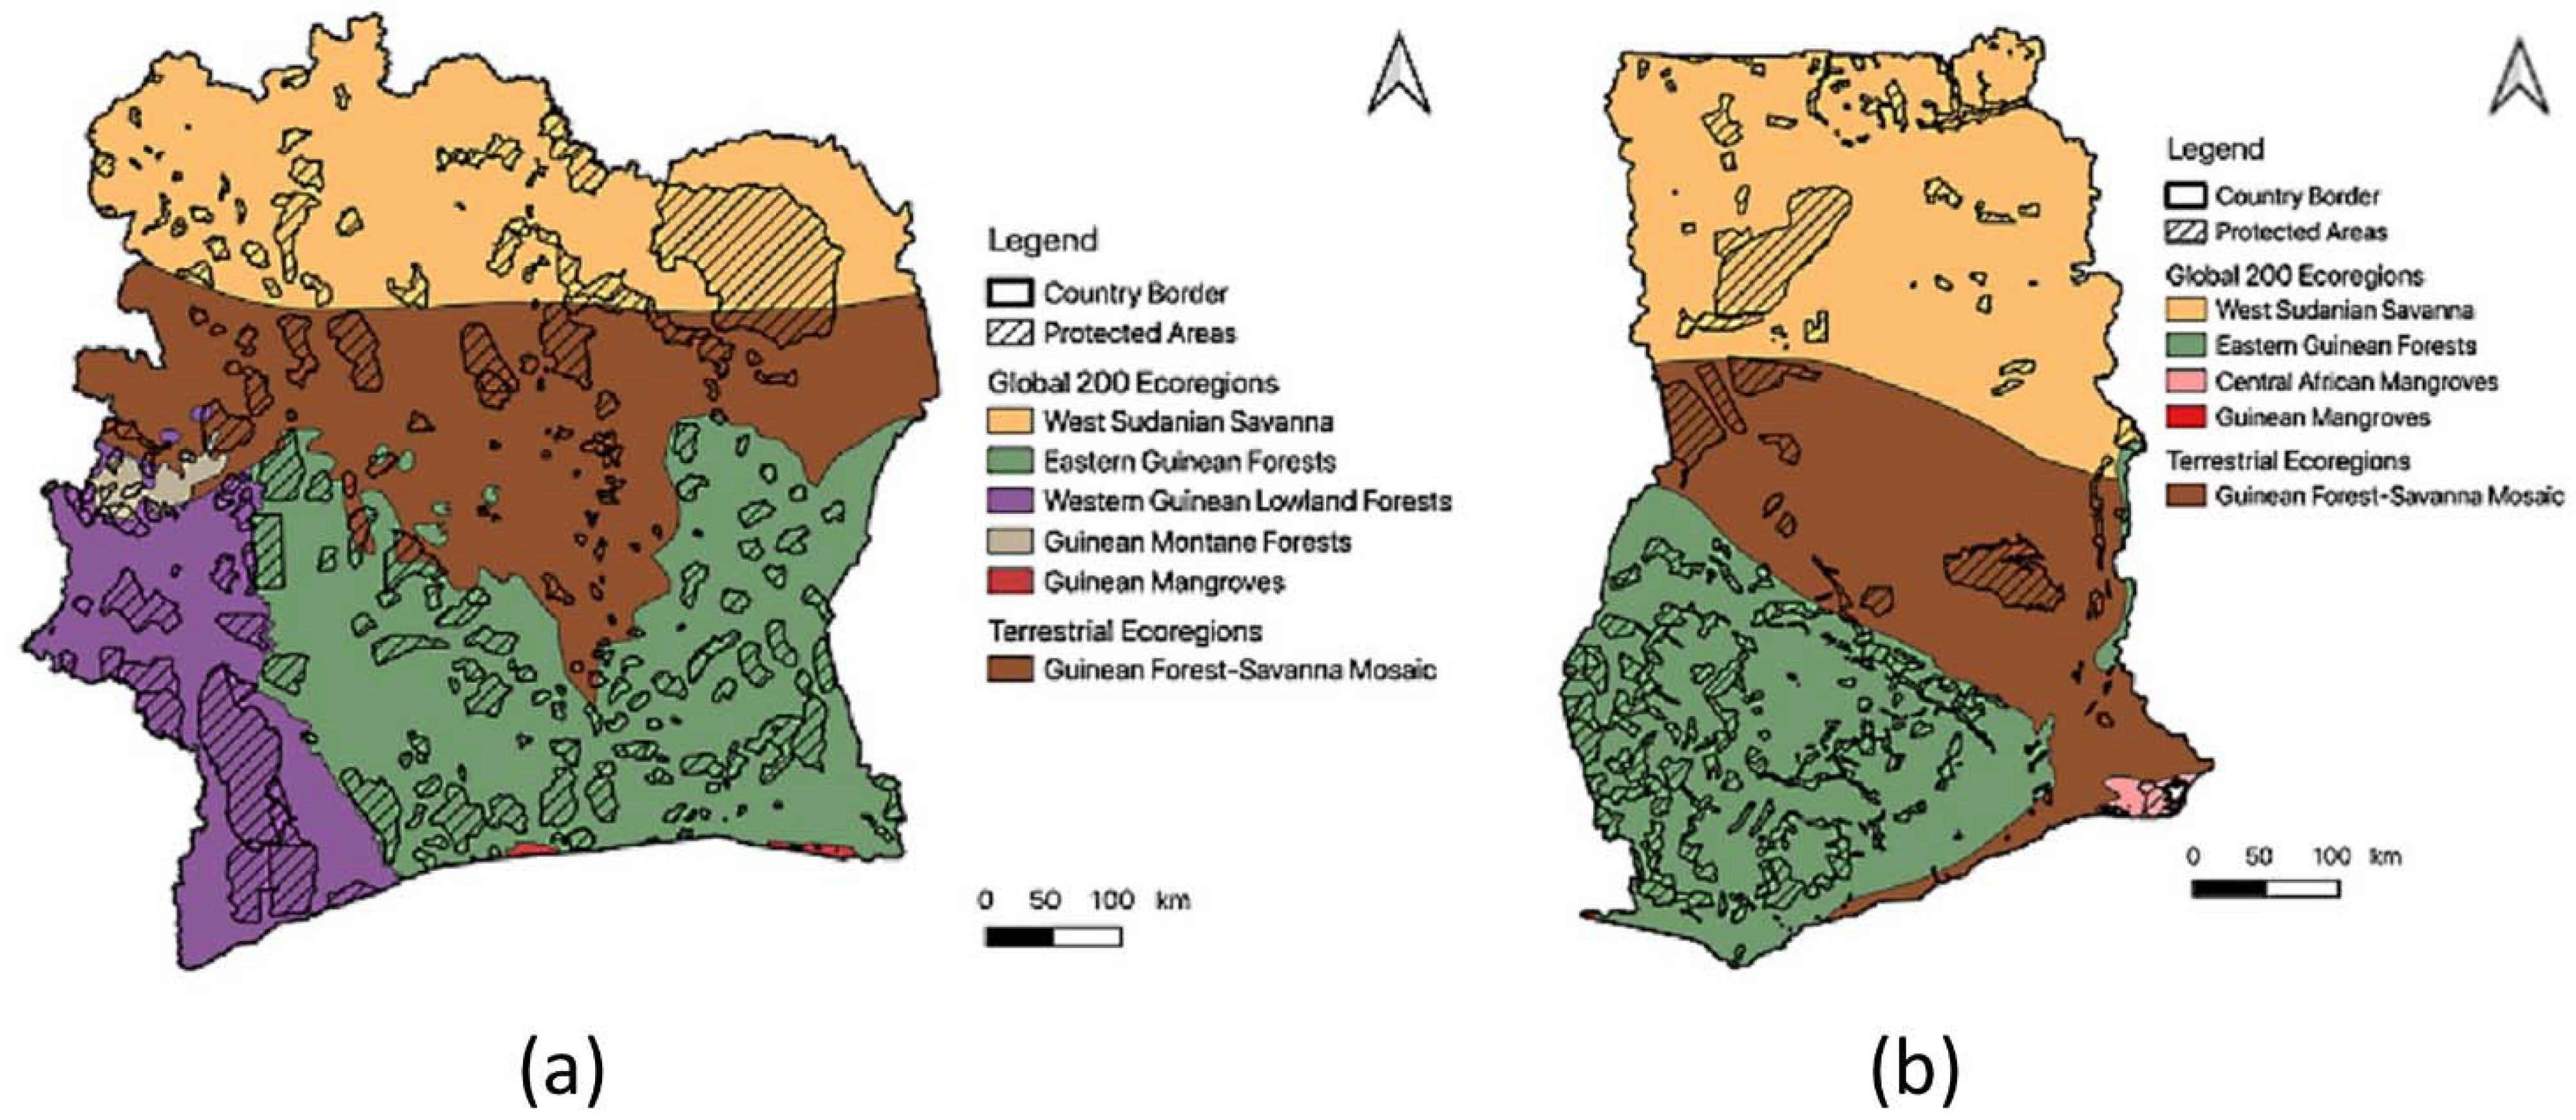
3.1. Ecoregion Representation

In Ghana, the Guinean mangroves are unprotected by terrestrial PAs, while the Central African mangroves have the highest representation. In Côte d’Ivoire, the Guinean montane forests have the highest representation and the Guinean forest–savanna mosaic the lowest. In both countries, the “Global 200” ecoregions, Eastern Guinean forests and West Sudanian savanna, were underrepresented. Ecoregions that occupy smaller percentages of land area (under 14.0%) are well-represented in PAs of both countries, except the Guinean mangroves in Ghana (Figure 1, Table 3).
Ecoregion representation across IUCN categories is low. In Ghana, the ecoregions were poorly represented in all categories, though in Côte d’Ivoire, IUCN Category II represents the Guinean mangroves and Guinean montane forests well (Table 3).

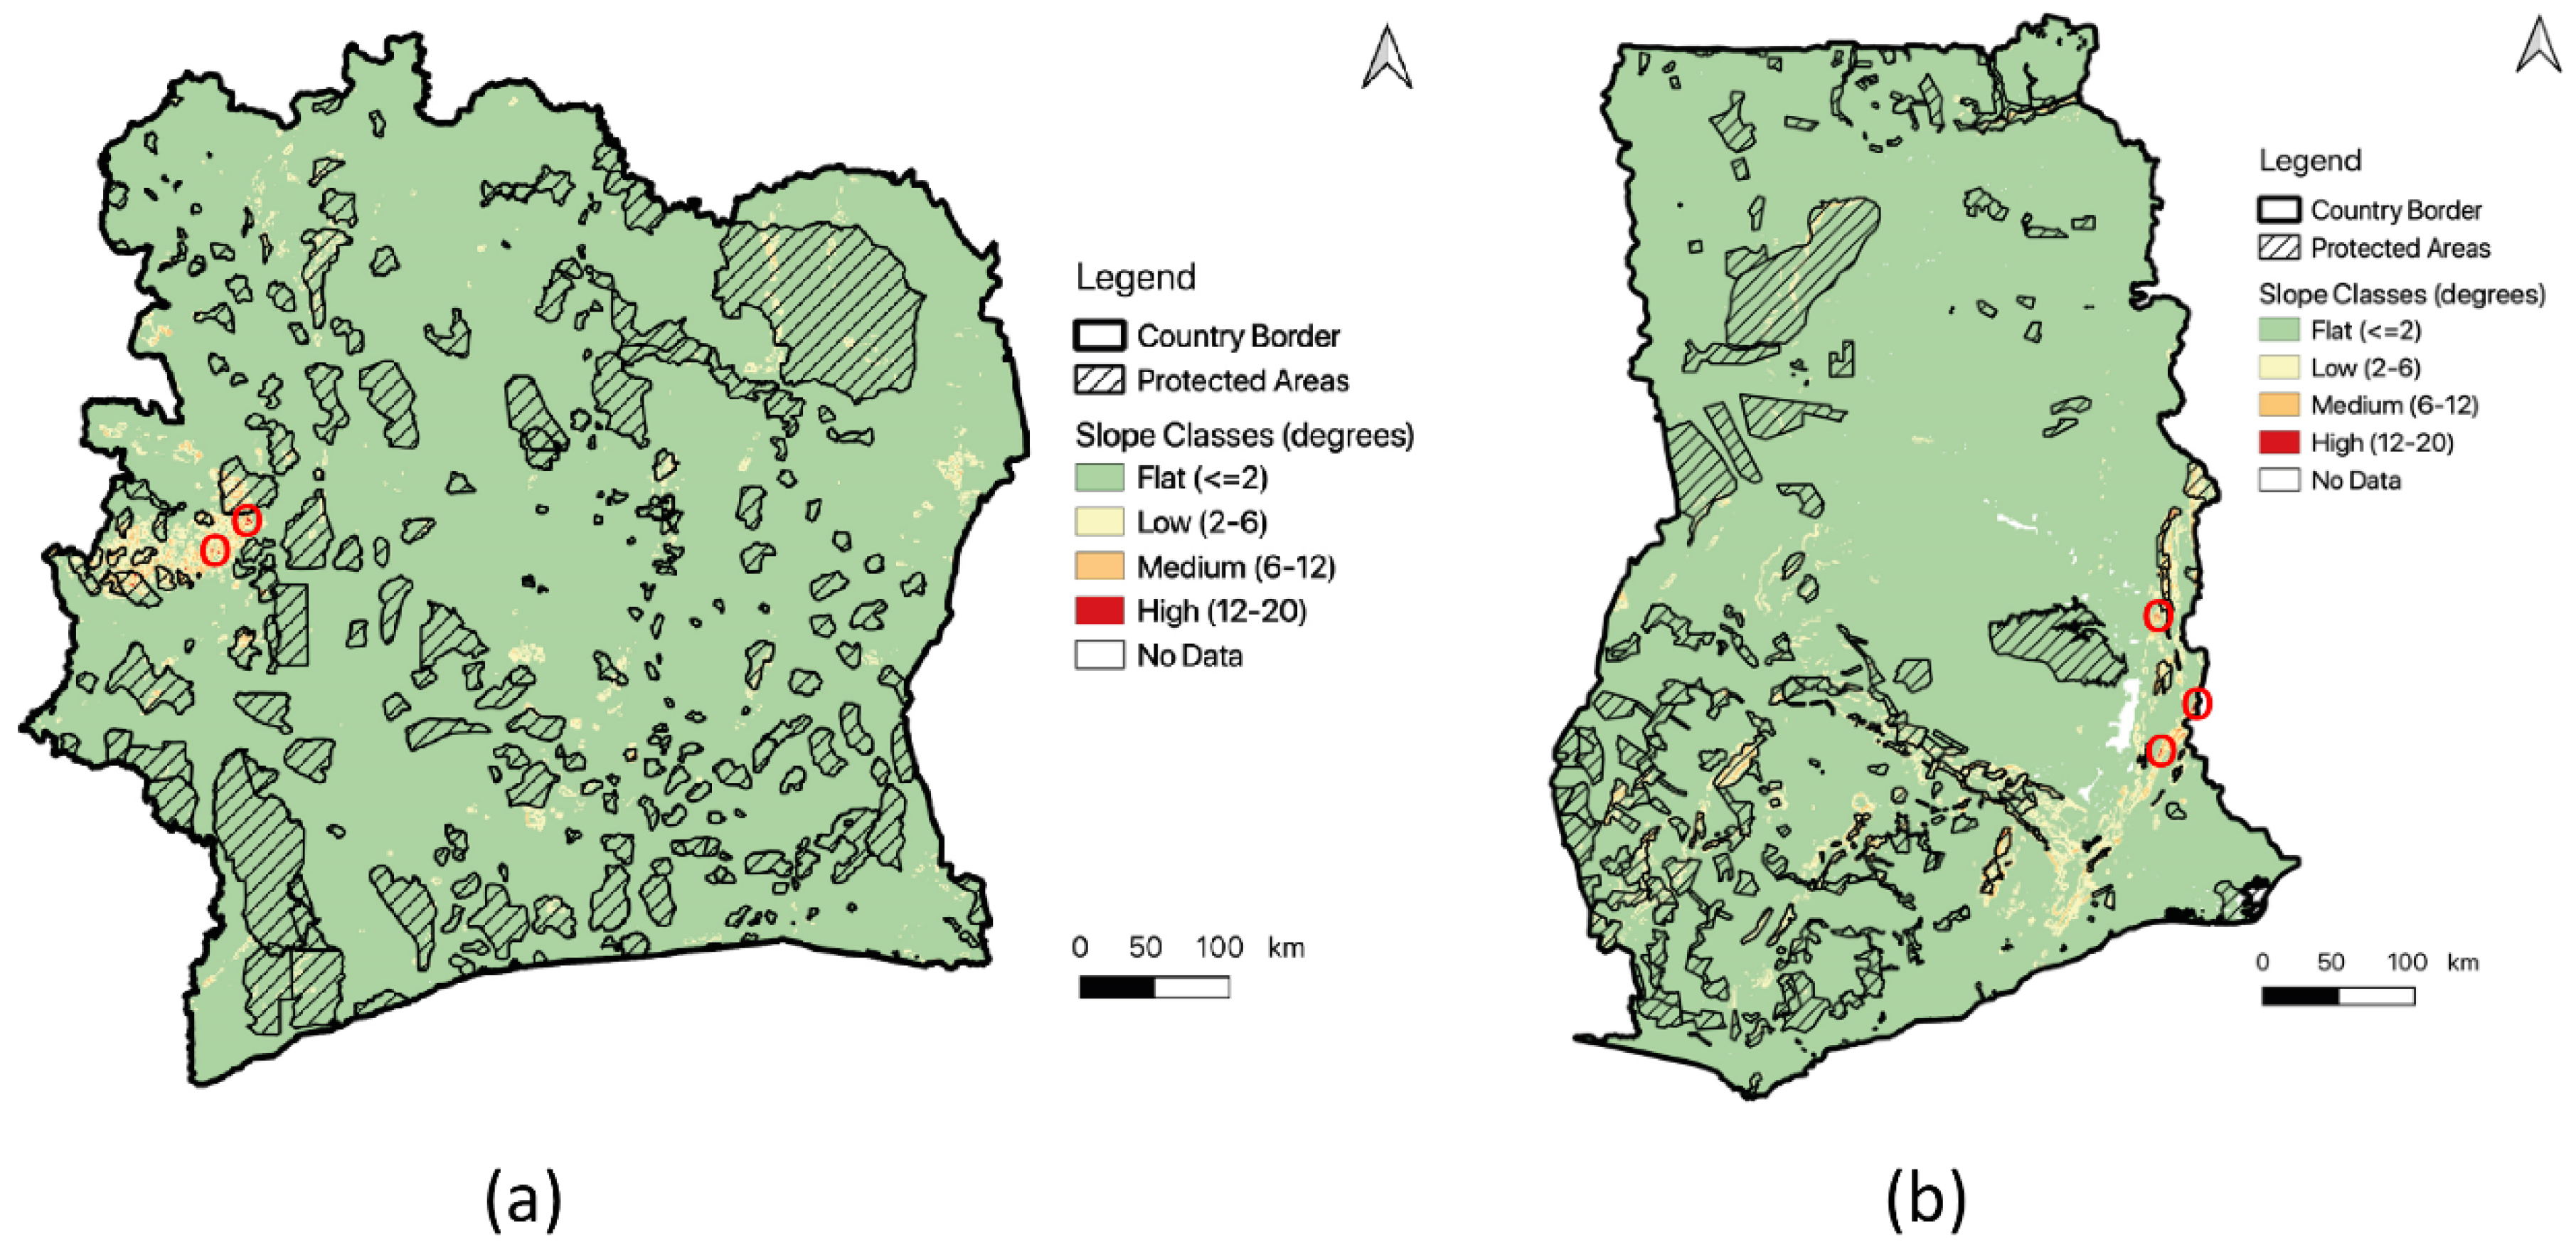
3.2. Slope Representation

Land with slope profiles steeper than two degrees is well-represented in the PAs of both countries, yet these makeup only 0.02% and 0.01% of land area, respectively. Flat lands occupy the majority of land in both countries but were severely underrepresented: protected area coverage favors steeper slopes (Figure 2, Table 4 and Table 5).
There is some variation in the representation of slope categories across the IUCN categories. Categories III and IV in Ghana, and Category II in Côte d’Ivoire, are well-protected across three different slope classes (low, medium, and high). High slopes are well-represented among stricter categories; Categories III and IV in Ghana and Categories Ia and II in Côte d’Ivoire have extremely large CI values. In both countries, flat slopes are poorly represented across all IUCN Categories (see Table 6).

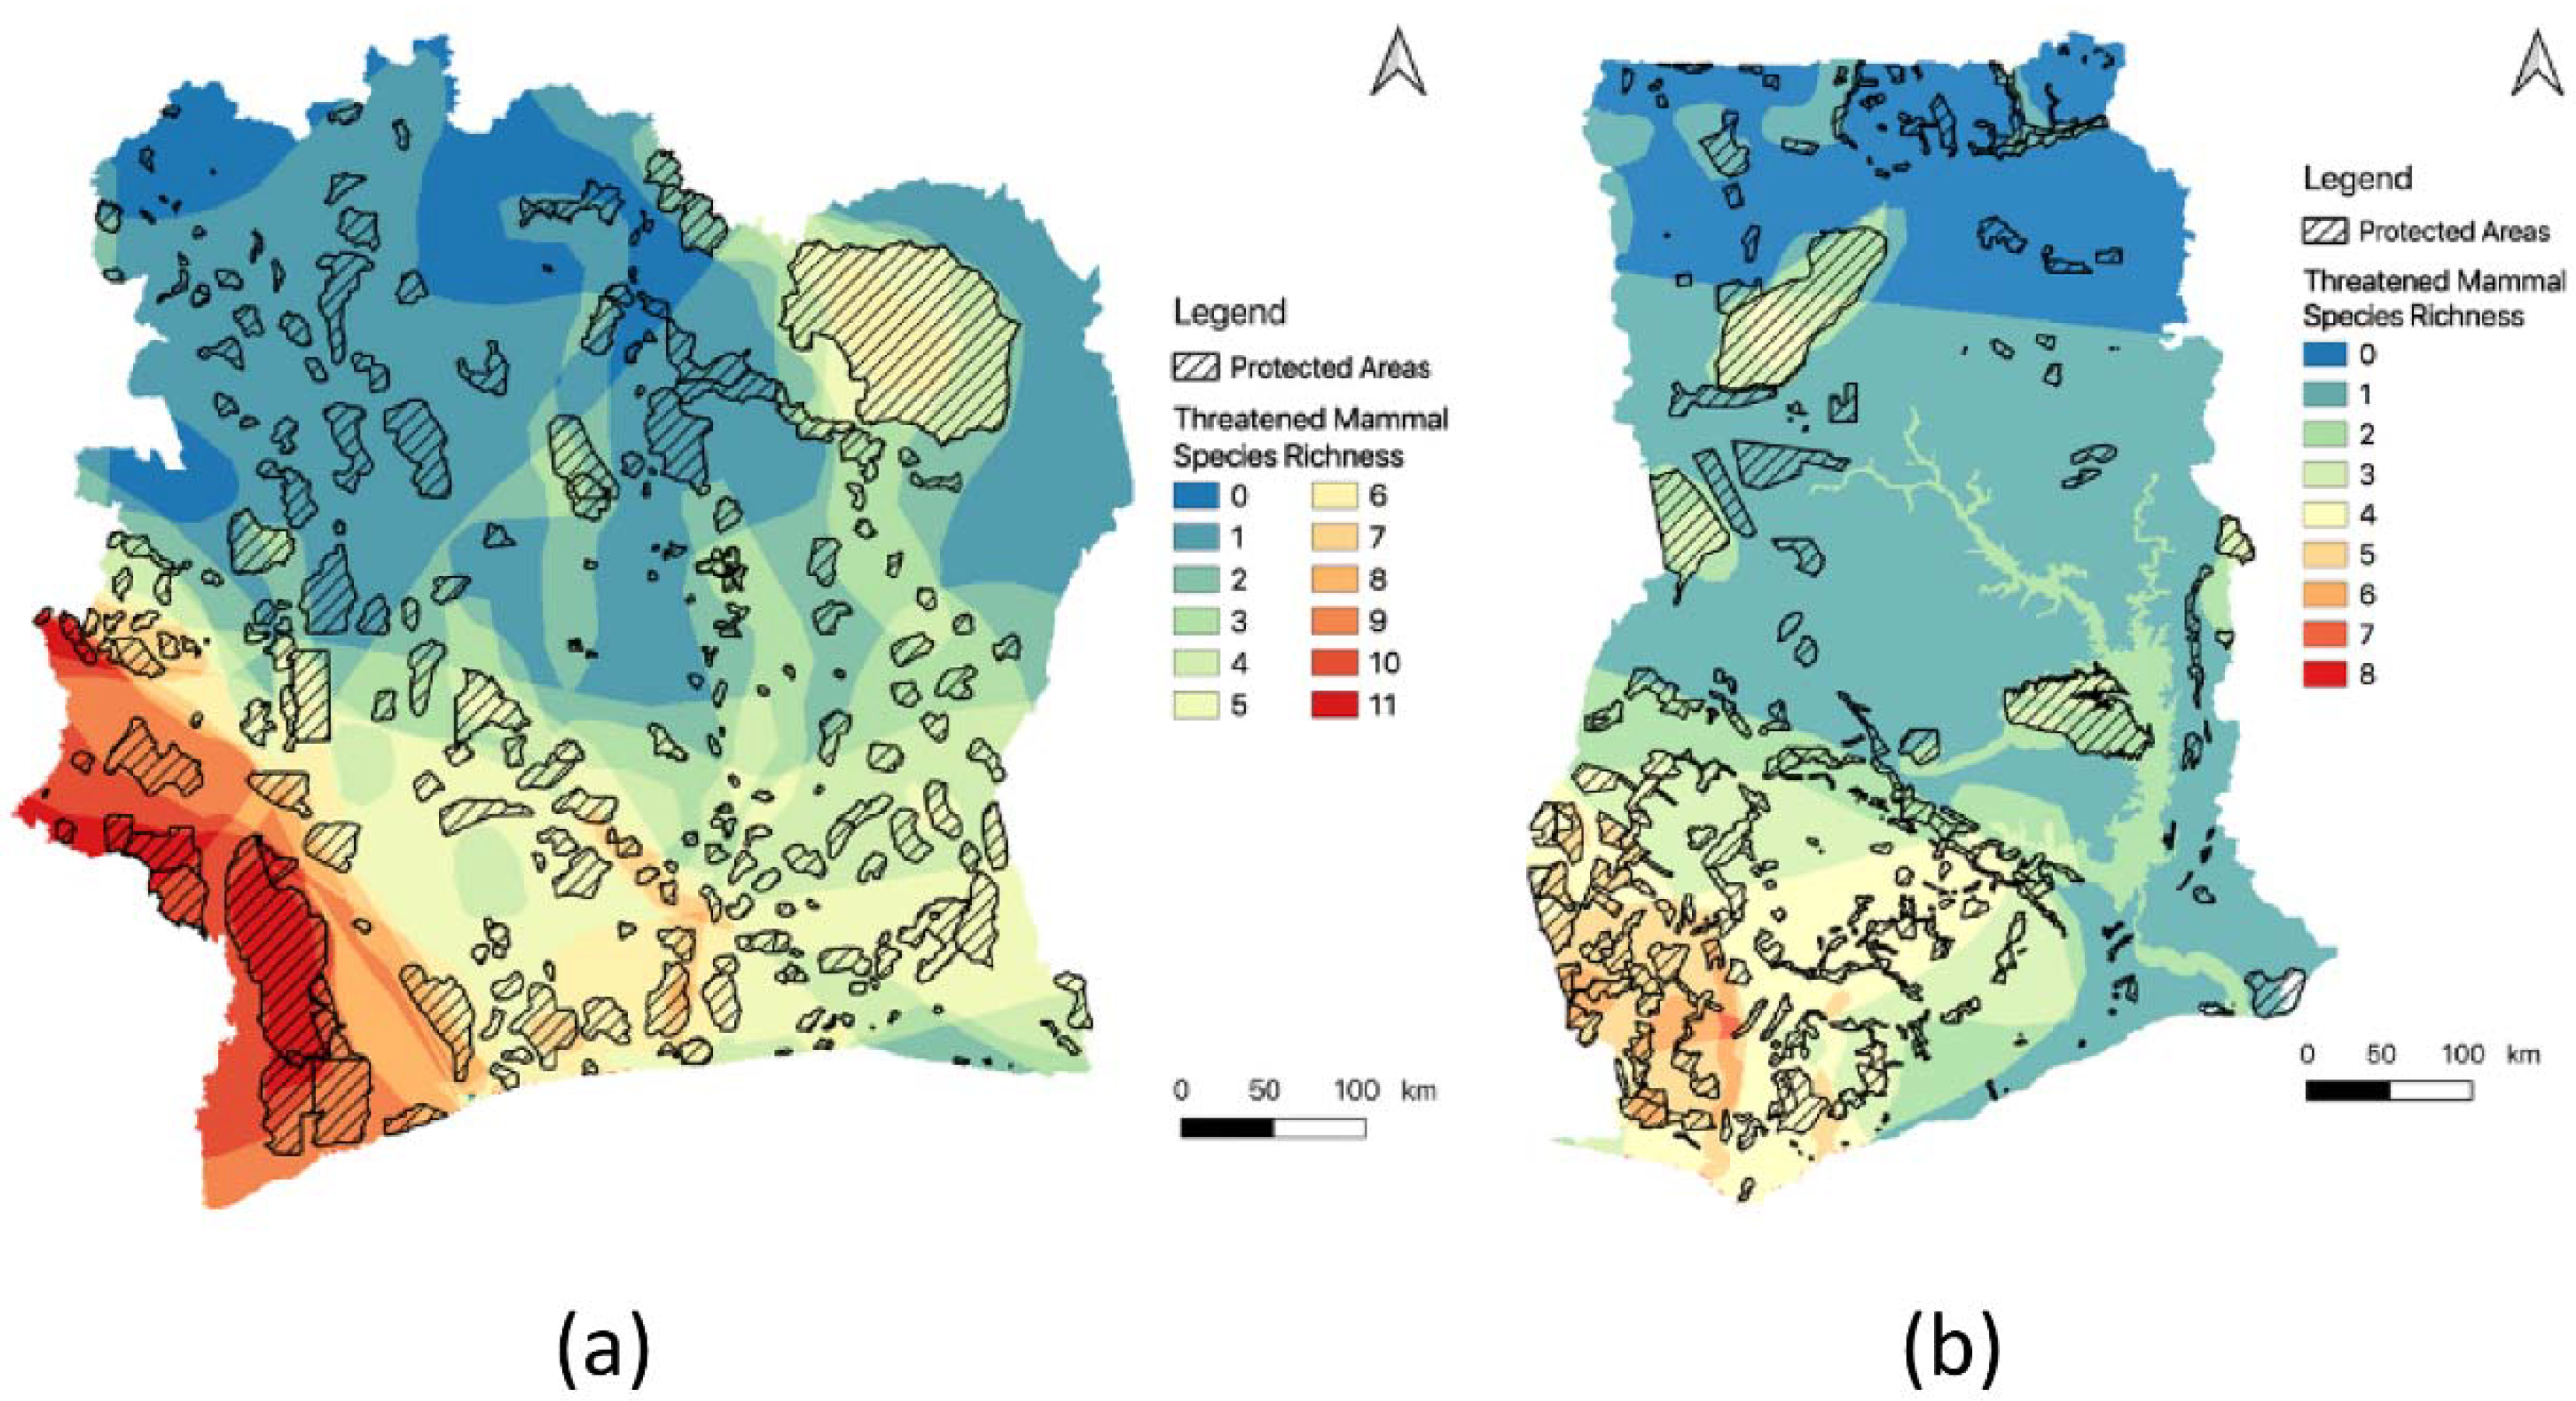
3.3. Representation of Threatened Mammal Species

Côte d’Ivoire’s PAs have more threatened mammal species than Ghana’s (Figure 3). Ghana’s PAs provide no coverage to areas with high numbers of threatened mammals (7 and 8), while Côte d’Ivoire’s PAs provide coverage for areas with the highest species richness values (11) (see Table 7). In Ghana, Category V had the highest median species richness, and Categories Ia and “Not Applicable” were the lowest. In Côte d’Ivoire, Category Ia had the highest species richness while “Not Reported” had the lowest.

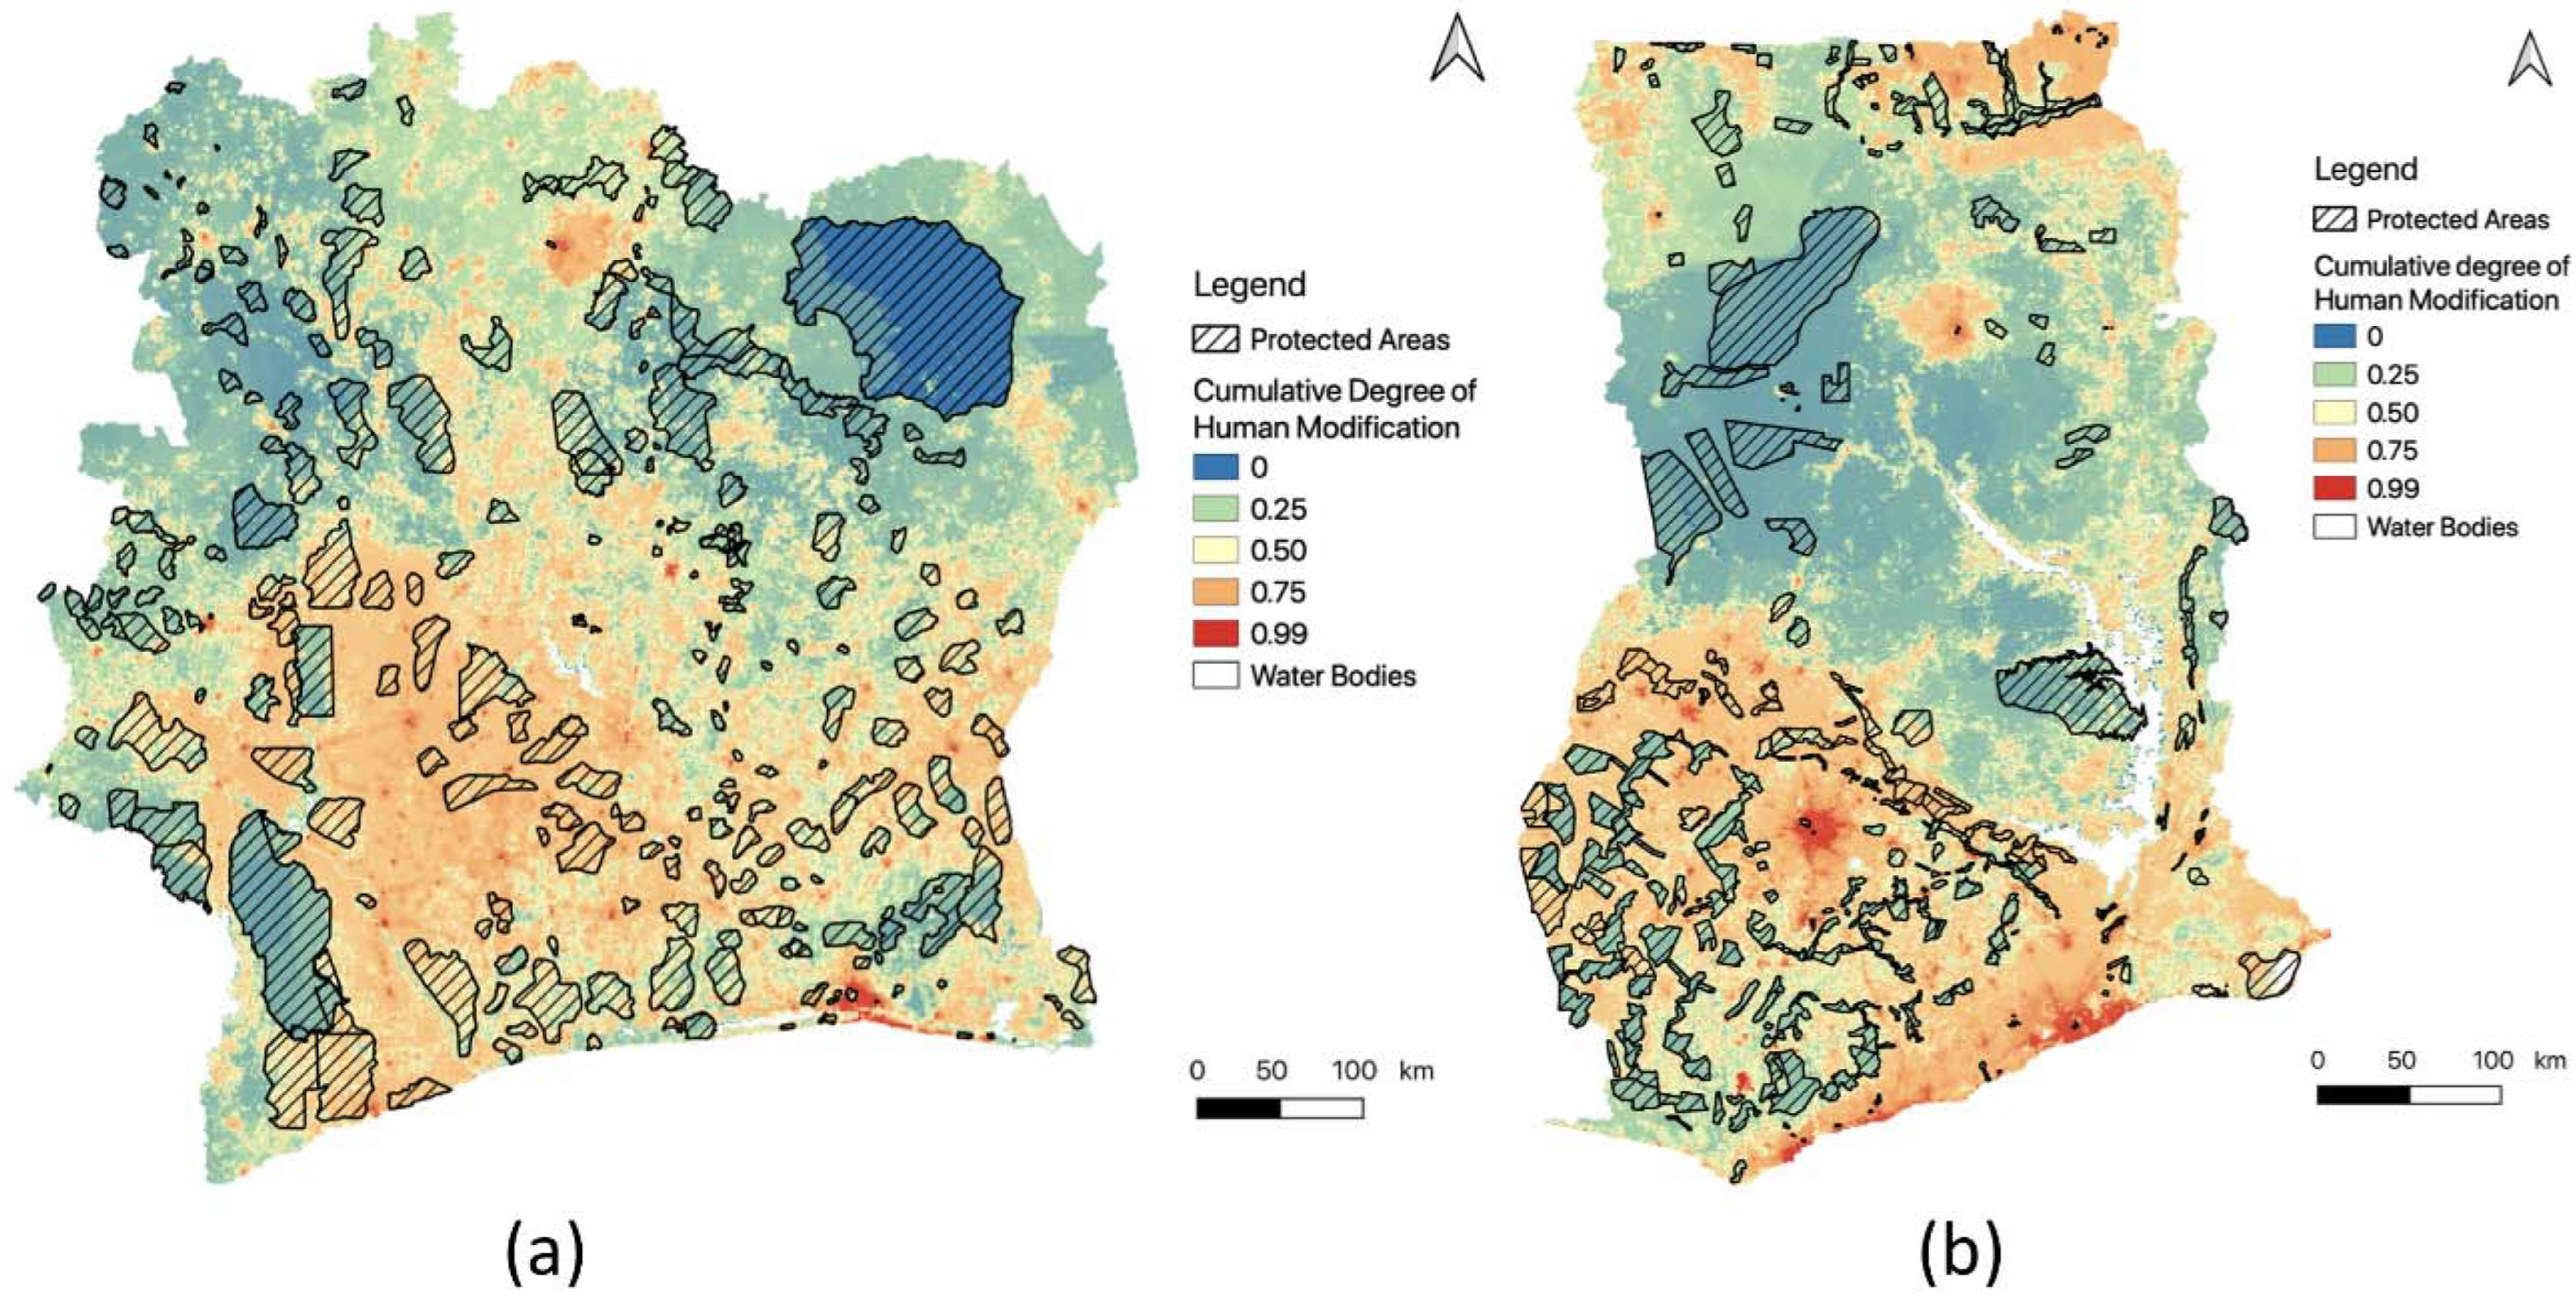
3.4. Human Modification

The boundaries of some PAs stand out from the more modified land surrounding them, suggesting they have been relatively successful at mitigating threats (Figure 4). Nevertheless, PAs in the Guinean forests of West Africa do still have measurable and substantial levels of modification. All IUCN Categories recorded are exposed to modification, higher in Ghana’s PAs than Côte d’Ivoire’s. In both countries, Category II had the lowest median HMc. In Ghana, Bui NP includes small areas with no recorded presence of modification, as does Comoé NP in Côte d’Ivoire. The “Not Reported” PAs, those without an assigned IUCN category, in both countries had the highest levels of human modification (Table 8).

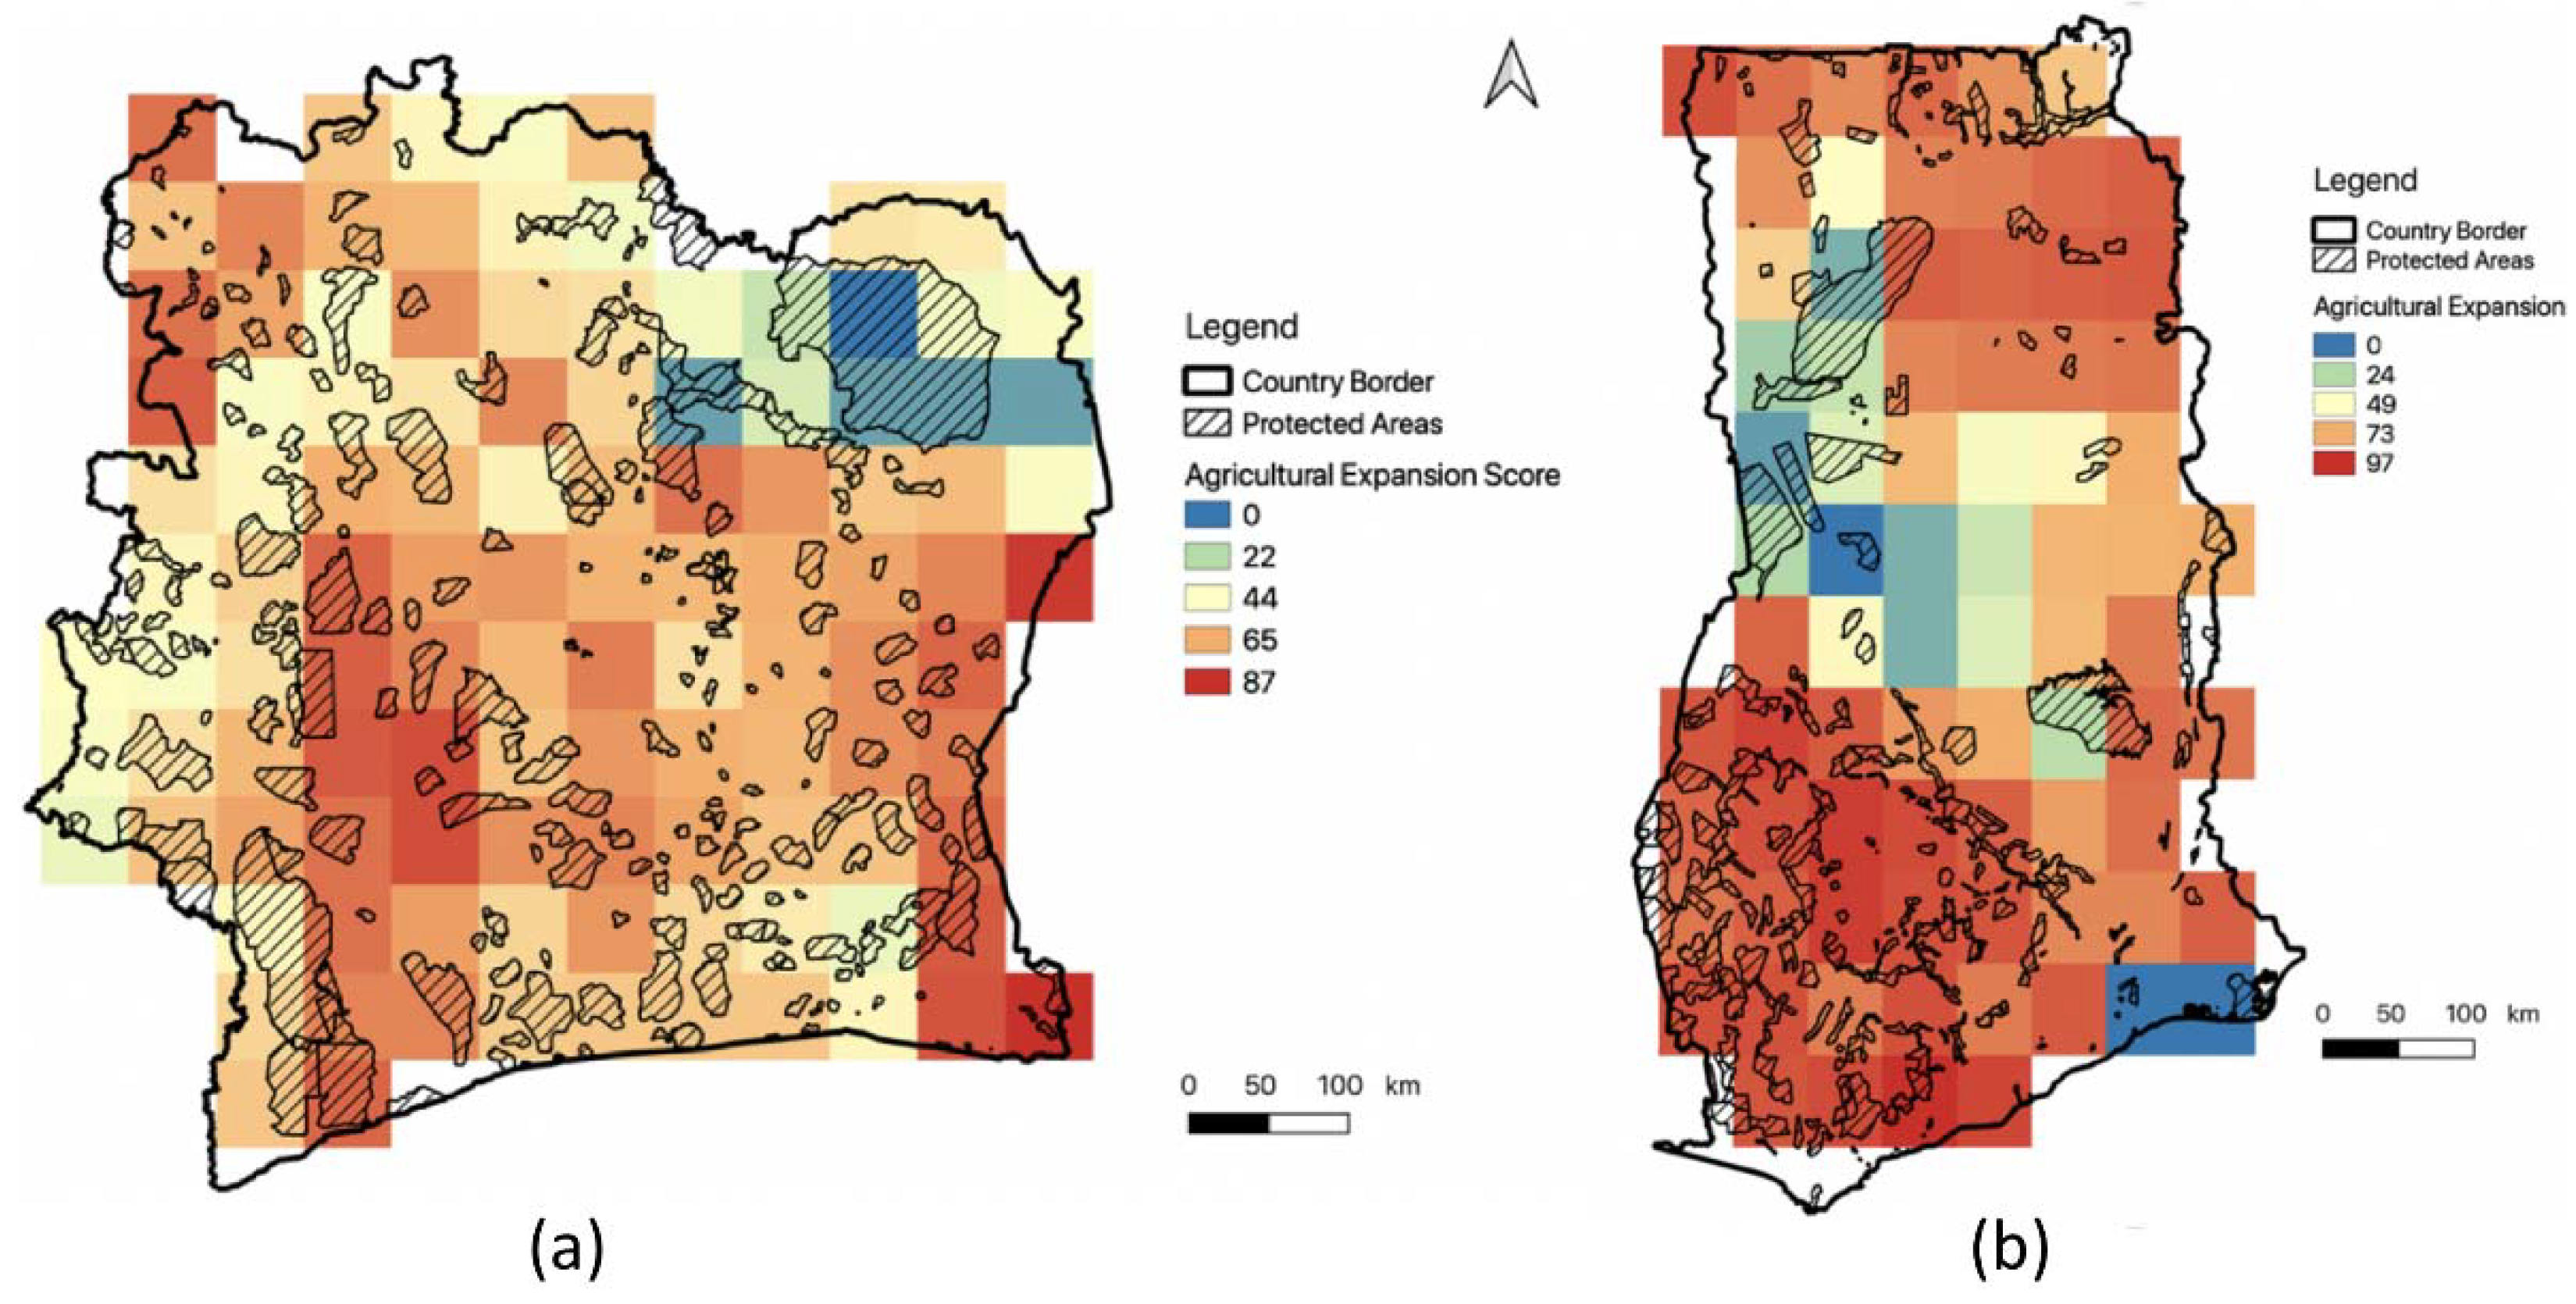
3.5. Agricultural Expansion Potential

The Nasa SEDAC data suggests that Ghana’s PAs generally have a greater potential for future agricultural development than Côte d’Ivoire’s, although category II PAs had relatively lower scores compared with other less-strict management categories (Table 9). In both countries, PAs located in the Guinean forests of the West African hotspot have the highest potential for future development (Figure 5).

4. Discussion

These observations and estimates based on remote sensing techniques emphasize that protected areas of Ghana and Côte d’Ivoire do not provide adequate levels of protection for all key ecoregions, slope profiles, or to their known threatened mammal species. As others have found, the West Sudanian savanna, Guinean forest–savanna mosaic and Eastern Guinean forest ecoregions are underrepresented in the PAs of both countries [26]. We add subtlety to previous findings [22] that all tropical forests are underrepresented in the Afrotropics, although some forests, including the Western Guinean lowland forests and Guinean montane forests, are well-represented in Côte d’Ivoire. These are less extensive in area than the underrepresented Eastern Guinean forests, thus high levels of proportional representation can be achieved with the protection of relatively small areas [22]. The low representation identified here of ecoregions with high global conservation priority (“Global 200” West Sudanian savanna and Eastern Guinean forests) and some ecoregions associated with the Guinean forests of the West African biodiversity hotspot (Eastern Guinean forests) in the PAs of both countries provide targeted guidance for future PA expansion.
This study provides further evidence that PAs are disproportionately located in areas with steeper slopes. In both countries, flatter lands were poorly represented and should become a priority for PA expansion, especially as both species richness and vulnerability to agricultural expansion are greater there [19]. This part of West Africa has few mountainous areas and low slope values characterize a large percentage of Ghana’s (93.88%) and Côte d’Ivoire’s (96.93%) land area. Proportional representation only on this basis would be impractical, and the selection strategy must be subtler to account for future agricultural development in tandem with conservation aims. Site selection and expansion must, thus, attempt to protect the remaining natural biodiversity and permit some sustainable agricultural use.
There are contrasts in the protection currently available to threatened mammal species between these countries. In Ghana, they lack adequate representation in Pas, while in Côte d’Ivoire, areas with high mammal richness are largely protected. This is most likely because the areas with highly threatened mammal species in Ghana are less suitable to be effective PA locations as these areas are small, dispersed along the southern coastline, and have high levels of human pressure [13]. In both countries, the biodiversity hotspot of the Guinean forests has the highest number of threatened mammal species. Conservation planning locally should prioritize the underrepresented Eastern Guinean forests ecoregion to increase coverage of threatened mammal species. Although not designated hotspots, the poorly represented West Sudanian savanna and Guinean forest–savanna mosaic should also be a priority for PA expansion, as these contain threatened mammal species which are unique to their ecoregions [69].
In both countries, all PA categories were exposed to anthropogenic modification, even Category Ia, which explicitly aims to limit human impacts and maintain a high degree of naturalness [3]. This observation is in line with the complete clearance of forests recorded inside Ghana’s Kogyae Strict Nature Reserve [54]. Bui NP contains areas with no recorded human modification, supporting other findings that Category II, which has the lowest levels of HMc in both countries here, may be better at mitigating threats [70,71]. Whether this effect arises because of the specific placement and size of Category II reserves, or because their regulations are better observed, remains difficult to assess. The broader lack of a systematic pattern in preventing human intervention may provide some qualified support for the greater application of multiple-use PAs in the IUCN categories, as these PAs can conserve biodiversity while supporting local livelihoods [9]. Reclassifying Categories V or VI PAs to stricter categories, however, would not automatically improve biodiversity protection because other attributes, such as size, affect the ability of PAs to deliver conservation outcomes [13]. Instead, these results may reflect that on-the-ground management is more important for the ability of specific PAs to conserve biodiversity and mitigate threats than global PA classifications [9]. The variation between countries in category allocation, interpretation, and enforcement blunts the use of IUCN categories as an analytical unit in determining PA.
The high agricultural expansion potential scores observed across all PA categories agrees with the current literature that agriculture is one of the main threats affecting West African PAs [6]. Ghana’s PAs are at greater risk of agricultural expansion than Côte d’Ivoire’s, very much in-line with the rapid population expansion observed there over the past 50 years and its continued political stability [23]. With a larger population than Côte d’Ivoire and a smaller land area, there are substantially extra human pressures on land use in Ghana [72].
The high HMc and agricultural expansion scores for PAs in the Eastern Guinean forests of both countries are expected, as these forests are rich agricultural areas for crops such as cocoa [1] and increasingly oil palm [73]. The PAs in this ecoregion are small, fragmented, and may be more vulnerable to anthropogenic threats as larger PAs reduce human–wildlife contact and human incursion and also enhance biological representation [13]. Conservation planning in both countries should theoretically focus on designating large PAs. In practice, however, establishing large PAs is challenging as so much of Ghana and Côte d’Ivoire’s land is already modified, agriculturally attractive, and under pressure from the growing human densities across West Africa [13].
An emphasis on improving the quality of existing PAs might be more effective at maintaining biodiversity and mitigating threats than increasing the number of PAs. Quality can encompass several aspects: the size, the nature of management support, and the integrity and connectivity of the site to name a few. Increasing their area may allow greater population viability and promote the interspecific interactions important for healthy ecosystems [13]. This is feasible for PAs in the West Sudanian savanna and Guinean forest–savanna mosaic but will be more challenging in the Eastern Guinean forests, as surrounding land has already been modified and is in established use by local communities. It is essential to involve local communities and stakeholders in processes to extend or modify current PAs. Voluntary community management has proven effective and community-based wildlife management and community resource management areas, supported by the government, have been successfully implemented in some PAs in Ghana [13,49,55]. Connecting forest fragments by restoring degraded habitats in gaps between forests may also improve biodiversity conservation by increasing connectivity and thus the opportunity for species with larger ranges [2]. The IUCN recognizes connectivity conservation as complementary to PAs [74].
Ultimately, improving the representation of ecoregions, topography, and threatened mammal species that currently lack adequate protection in Ghana and Côte d’Ivoire will mean protecting and restoring degraded landscapes, and this will “require readjustment of the mental image of protected area for many” [22]. These analyses suggest that West African countries such as Libera, which have larger areas of natural land, should protect these areas before they become dramatically modified [1] and place emphasis on creating large PAs rather than establishing many small highly fragmented PAs, which is common practice across the region. Expanding or improving PAs, however, requires financial resources and strategic enforcement, which are currently lacking across West Africa; international funding from foundations, nongovernmental organizations, private corporations, and intergovernmental organizations will be essential [37,71].
The lack of data, and more importantly of reliable, ground-truthed data, across West Africa is a challenge to reliable analyses. Accurate data is vital in order to develop robust recommendations to inform conservation planning [75,76]. Here, estimations of the performance of different IUCN categories are limited as most PAs in Côte d’Ivoire lack an assigned category, and in Ghana there is only one PA assigned as Category Ia. On-the-ground management of PAs does not always reflect their reported IUCN category and local experts are essential to verifying this [12]. There are also substantial gaps in biodiversity data, and we were obliged to drop an analysis of threatened amphibian species as much of Ghana and Côte d’Ivoire had zero recorded species [77]. This emphasizes a data deficiency as there is an observed increase in harvesting of amphibians and rising demand for these as bush-meat in West Africa [6].
The protected areas of tropical West Africa are vital to conserving the region’s rare and threatened biodiversity; to achieve the goals of the Convention on Biological Diversity and an ecologically representative global PA network (Aichi Target 11), it is crucial that the remaining wildlife and the forests in these regions are effectively protected. Improving the ability of PAs to conserve nature and mitigate threats in the tropics should be a global conservation priority [10].
Global action will have to be more ambitious to ensure the future efficacy of PAs. This study demonstrates that global conservation priorities such as, the “Global 200” ecoregions and biodiversity hotspots are insufficiently translated into effective national conservation priorities. The focus of conservation efforts needs to move towards practical on-the-ground implementation. Additionally, data quality must be improved, and countries must be supported to collect and publish ecological data to inform PA expansion and track progress towards global conservation targets. Future biodiversity targets are likely to include more quantitative measures at the ecosystem level, and methods will be developed to measure these using remote sensing and modelling supported by local verification [78].

5. Conclusions

We found remote sensing techniques were useful for assessing the degree of representation of important ecoregions which have varying slope profiles and mammal species richness, and a range of protected areas categories. Exposure of protected area categories to human modification and to future agricultural expansion can also be estimated in this way.
In Ghana and Côte d’Ivoire, West Africa, we found that PAs are disproportionately located in areas with steeper slopes, and the flatter lands were poorly represented. In both countries, all PA categories were exposed to anthropogenic modification, and the ability of tropical protected areas to conserve nature and mitigate anthropogenic threats should be improved in these regions. Ghana lacks adequate representation of its threatened mammal species in PAs, while in Côte d’Ivoire, areas with high mammal richness are largely protected. Conservation planning should prioritise the underrepresented Eastern Guinean forests ecoregion in order to increase coverage of threatened mammal species.
The study was limited by the lack of finer spatial and temporal scale species richness data to enable a deeper understanding of species richness variation and the ability of protected areas to cover these. Finer-scale ecosystem mapping would involve detailed field data collection in the target location and using geostatistical models (such as kriging) to develop landscape scale estimates of species richness distribution patterns [79]. The paucity of field data in the study areas prevents such as an undertaking at the present. Future data collection efforts will benefit from undertaking rigorous field data collection in our study areas. Protected-area efficacy studies will benefit from a deeper understanding of spatio-temporal changes in species richness across West Africa’s protected area networks. Additionally, the role of transboundary parks in achieving conservation objectives need to be evaluated for the region.

Author Contributions

M.S.; conceptualization, methodology, software support, writing; L.M.M.; data sourcing, data curation, analysis, and draft preparation; C.M.C.; oversight, analysis, support and guidance, writing, and editing. All authors have read and agreed to the published version of the manuscript.

Funding

The research received no external funding.

Institutional Review Board Statement

Not applicable.

Informed Consent Statement

Not applicable.

Data Availability Statement

The data used in this research can be accessed from: https://github.com/Jojo666/WestAfrica (accessed on 1 January 2022).

Acknowledgments

We are grateful to the Centre for Environmental Policy (CEP) for granting us permission to undertake the research.

Conflicts of Interest

The authors declare that they have no known competing financial interests or personal relationships that could have appeared to influence the work reported in this paper.

References

  1. Cotillon, S.E.; Tappan, G.G. Landscapes of West Africa: A Window on a Changing World; USGS: Garretson, SD, USA, 2016. [Google Scholar]
  2. Joppa, L.N.; Loarie, S.R.; Pimm, S.L. On the protection of “protected areas”. Proc. Natl. Acad. Sci. USA 2008, 105, 6673–6678. [Google Scholar] [CrossRef] [PubMed] [Green Version]
  3. Dudley, N. Guidelines for Applying Protected Area Management Categories; IUCN: Gland, Switzerland, 2008. [Google Scholar]
  4. Nelson, A.; Chomitz, K.M. Effectiveness of strict vs. multiple use protected areas in reducing tropical forest fires: A global analysis using matching methods. PLoS ONE 2011, 6, e22722. [Google Scholar] [CrossRef] [PubMed]
  5. Bradshaw, C.J.A.; Craigie, I.; Laurance, W.F. National emphasis on high-level protection reduces risk of biodiversity decline in tropical forest reserves. Biol. Conserv. 2015, 190, 115–122. [Google Scholar] [CrossRef]
  6. Mallon, D.P.; Hoffmann, M.; Grainger, M.J.; Hibert, F.; Van Vliet, N.; McGowan, P.J.K. An IUCN situation analysis of terrestrial and freshwater fauna in West and Central Africa. Occas. Pap. IUCN Species Surviv. Comm. 2015, 54, 40. [Google Scholar]
  7. Locke, H.; Dearden, P. Rethinking protected area categories and the new paradigm. Environ. Conserv. 2005, 32, 1–10. [Google Scholar] [CrossRef]
  8. Gardner, C.J. IUCN management categories fail to represent new, multiple-use protected areas in Madagascar. Oryx 2011, 45, 336–346. [Google Scholar] [CrossRef] [Green Version]
  9. Shafer, C.L. Arguments for and against IUCN protected area management category VI with a review of state versus community governance. J. Nat. Conserv. 2020, 53, 125697. [Google Scholar] [CrossRef]
  10. Geldmann, J.; Manica, A.; Burgess, N.D.; Coad, L.; Balmford, A. A global-level assessment of the effectiveness of protected areas at resisting anthropogenic pressures. Proc. Natl. Acad. Sci. USA 2019, 116, 23209–23215. [Google Scholar] [CrossRef]
  11. Porter-Bolland, L.; Ellis, E.A.; Guariguata, M.R.; Ruiz-Mallén, I.; Negrete-Yankelevich, S.; Reyes-García, V. Community managed forests and forest protected areas: An assessment of their conservation effectiveness across the tropics. For. Ecol. Manag. 2012, 268, 6–17. [Google Scholar] [CrossRef]
  12. Leroux, S.J.; Krawchuk, M.A.; Schmiegelow, F.; Cumming, S.G.; Lisgo, K.; Anderson, L.G.; Petkova, M. Global protected areas and IUCN designations: Do the categories match the conditions? Biol. Conserv. 2010, 143, 609–616. [Google Scholar] [CrossRef]
  13. Chardonnet, B. Reconfiguring the protected areas in Africa. Int. Union Conserv. Nat. Nat. Resour. 2019. Available online: https://conservationaction.co.za/wp-content/uploads/2019/03/etudesAP_configAP_EN.pdf (accessed on 1 January 2022).
  14. Juffe-Bignoli, D.; Burgess, N.D.; Bingham, H.; Belle, E.M.S.; De Lima, M.G.; Deguignet, M.; Bertzky, B.; Milam, A.N.; Martinez-Lopez, J.; Lewis, E.; et al. Protected Planet Report 2018; UNEP-WCMC, IUCN NGS: Cambridge, UK, 2018. [Google Scholar]
  15. Grooten, M.; Almond, R.E. Living Planet Report; World Wide Fund for Nature: Gland, Switzerland, 2018. [Google Scholar]
  16. Brondizio, E.S.; Settele, J.; Díaz, S.; Ngo, H.T. Global Assessment Report on Biodiversity and Ecosystem Services of the Intergovernmental Science-Policy Platform on Biodiversity and Ecosystem Services. 2019. Available online: https://ipbes.net/sites/default/files/2020-02/ipbes_global_assessment_report_summary_for_policymakers_en.pdf (accessed on 1 January 2022).
  17. Austin, M.P.; Margules, C.R. Assessing representativeness. In Wildlife Conservation Evaluation; Usher, M.B., Ed.; Chapman and Hall: London, UK, 1986; pp. 45–67. [Google Scholar]
  18. Olson, D.M.; Dinerstein, E. The Global 200: A representation approach to conserving the Earth’s most biologically valuable ecoregions. Conserv. Biol. 1998, 12, 502–515. [Google Scholar] [CrossRef] [Green Version]
  19. Trisurat, Y. Applying gap analysis and a comparison index to evaluate protected areas in Thailand. Environ. Manag. 2007, 39, 235–245. [Google Scholar] [CrossRef] [PubMed]
  20. Malcolm, J.R.; Liu, C.; Miller, L.B.; Allnutt, T.; Hansen, L. Habitats at Risk. Global Warming and Species Loss in Globally Significant Terrestrial Ecosystems. World Wide Fund for Nature. 2002. Available online: https://digital.library.unt.edu/ark:/67531/metadc226787/ (accessed on 1 January 2022).
  21. Kareiva, P.; Marvier, M. Conserving biodiversity coldspots: Recent calls to direct conservation funding to the world’s biodiversity hotspots may be bad investment advice. Am. Sci. 2003, 91, 344–351. [Google Scholar] [CrossRef]
  22. Hazen, H.D.; Anthamatten, P.J. Representation of ecological regions by protected areas at the global scale. Phys. Geogr. 2004, 25, 499–512. [Google Scholar] [CrossRef]
  23. Sayre, R.; Karagulle, D.; Frye, C.; Boucher, T.; Wolff, N.H.; Breyer, S.; Wright, D.; Martin, M.; Butler, K.; Van Graafeiland, K.; et al. An assessment of the representation of ecosystems in global protected areas using new maps of World Climate Regions and World Ecosystems. Glob. Ecol. Conserv. 2020, 21, e00860. [Google Scholar] [CrossRef]
  24. Smith, R.J. West Africa Gap Analysis and Spatial Conservation Prioritisation. UNEP-WCMC Technical Report. Cambridge, UK. 2015. Available online: http://parcc.protectedplanet.net/system/comfy/cms/files/files/000/000/047/original/PARCC_DICE_Regional_Planning_System_Report_FINAL_EN.pdf (accessed on 1 January 2022).
  25. Singh, M.; Griaud, C.; Collins, C.M. An evaluation of the effectiveness of protected areas in Thailand. Ecol. Indic. 2021, 125, 107536. [Google Scholar] [CrossRef]
  26. Brugiere, D.; Kormos, R. Review of the protected area network in Guinea, West Africa, and recommendations for new sites for biodiversity conservation. Biodivers. Conserv. 2009, 18, 847–868. [Google Scholar] [CrossRef]
  27. Schmitt, C.B.; Burgess, N.D.; Coad, L.; Belokurov, A.; Besançon, C.; Boisrobert, L.; Campbell, A.; Fish, L.; Gliddon, D.; Humphries, K.; et al. Global analysis of the protection status of the world’s forests. Biol. Conserv. 2009, 142, 2122–2130. [Google Scholar] [CrossRef]
  28. Joppa, L.N.; Pfaff, A. High and far: Biases in the location of protected areas. PLoS ONE 2009, 4, e8273. [Google Scholar] [CrossRef]
  29. Venter, O.; Fuller, R.A.; Segan, D.B.; Carwardine, J.; Brooks, T.; Butchart, S.H.M.; Di Marco, M.; Iwamura, T.; Joseph, L.; O’Grady, D.; et al. Targeting global protected area expansion for imperiled biodiversity. PLoS Biol. 2014, 12, e1001891. [Google Scholar] [CrossRef] [PubMed] [Green Version]
  30. Green, J.M.H.; Larrosa, C.; Burgess, N.D.; Balmford, A.; Johnston, A.; Mbilinyi, B.P.; Platts, P.J.; Coad, L. Deforestation in an African biodiversity hotspot: Extent, variation and the effectiveness of protected areas. Biol. Conserv. 2013, 164, 62–72. [Google Scholar] [CrossRef]
  31. Badgley, C. Tectonics, topography, and mammalian diversity. Ecography 2010, 33, 220–231. [Google Scholar] [CrossRef]
  32. Tallowin, O.; Allison, A.; Algar, A.C.; Kraus, F.; Meiri, S. Papua New Guinea terrestrial-vertebrate richness: Elevation matters most for all except reptiles. J. Biogeogr. 2017, 44, 1734–1744. [Google Scholar] [CrossRef] [Green Version]
  33. Myers, N.; Mittermeier, R.A.; Mittermeier, C.G.; Da Fonseca, G.A.B.; Kent, J. Biodiversity hotspots for conservation priorities. Nature 2000, 403, 853–858. [Google Scholar] [CrossRef]
  34. Ernst, R.; Linsenmair, K.E.; Thomas, R.; Rödel, M.-O. Amphibian Communities in Disturbed Forests: Lessons from the Neo-and Afrotropics; Springer: Berlin/Heidelberg, Germany, 2007. [Google Scholar]
  35. Veach, V.; Di Minin, E.; Pouzols, F.M.; Moilanen, A. Species richness as criterion for global conservation area placement leads to large losses in coverage of biodiversity. Divers. Distrib. 2017, 23, 715–726. [Google Scholar] [CrossRef] [Green Version]
  36. Rodrigues, A.S.L.; Akcakaya, H.R.; Andelman, S.J.; Bakarr, M.I.; Boitani, L.; Brooks, T.M.; Chanson, J.S.; Fishpool, L.D.C.; Da Fonseca, G.A.B.; Gaston, K.J.; et al. Global gap analysis: Priority regions for expanding the global protected-area network. Bioscience 2004, 54, 1092–1100. [Google Scholar] [CrossRef]
  37. Rodrigues, A.S.L.; Andelman, S.J.; Bakarr, M.I.; Boitani, L.; Brooks, T.M.; Cowling, R.M.; Fishpool, L.D.C.; Da Fonseca, G.A.B.; Gaston, K.J.; Hoffmann, M.; et al. Effectiveness of the global protected area network in representing species diversity. Nature 2004, 428, 640–643. [Google Scholar] [CrossRef]
  38. Craigie, I.D.; Baillie, J.E.M.; Balmford, A.; Carbone, C.; Collen, B.; Green, R.E.; Hutton, J.M. Large mammal population declines in Africa’s protected areas. Biol. Conserv. 2010, 143, 2221–2228. [Google Scholar] [CrossRef]
  39. Shafer, C.L. Cautionary thoughts on IUCN protected area management categories V–VI. Glob. Ecol. Conserv. 2015, 3, 331–348. [Google Scholar] [CrossRef] [Green Version]
  40. Malhi, Y.; Adu-Bredu, S.; Asare, R.A.; Lewis, S.L.; Mayaux, P. The past, present and future of Africa’s rainforests. Philos. Trans. R. Soc. B Biol. Sci. 2013, 368, 20120293. [Google Scholar] [CrossRef] [PubMed] [Green Version]
  41. Abiem, I.; Arellano, G.; Kenfack, D.; Chapman, H. Afromontane forest diversity and the role of grassland-forest transition in tree species distribution. Diversity 2020, 12, 30. [Google Scholar] [CrossRef] [Green Version]
  42. Pacifici, M.; Di Marco, M.; Watson, J.E.M. Protected areas are now the last strongholds for many imperiled mammal species. Conserv. Lett. 2020, 13, 1–7. [Google Scholar] [CrossRef]
  43. Rija, A.A.; Critchlow, R.; Thomas, C.D.; Beale, C.M. Global extent and drivers of mammal population declines in protected areas under illegal hunting pressure. PLoS ONE 2020, 15, e0227163. [Google Scholar] [CrossRef]
  44. Oberosler, V.; Tenan, S.; Zipkin, E.F.; Rovero, F. Poor management in protected areas is associated with lowered tropical mammal diversity. Anim. Conserv. 2020, 23, 171–181. [Google Scholar] [CrossRef]
  45. Brum, F.T.; Graham, C.H.; Costa, G.C.; Hedges, S.B.; Penone, C.; Radeloff, V.C.; Rondinini, C.; Loyola, R.; Davidson, A.D. Global priorities for conservation across multiple dimensions of mammalian diversity. Proc. Natl. Acad. Sci. USA 2017, 114, 7641–7646. [Google Scholar] [CrossRef] [Green Version]
  46. González-Maya, J.F.; Víquez-R, L.R.; Belant, J.L.; Ceballos, G. Effectiveness of protected areas for representing species and populations of terrestrial mammals in Costa Rica. PLoS ONE 2015, 10, e0124480. [Google Scholar] [CrossRef] [PubMed] [Green Version]
  47. Hackman, K.O. The state of biodiversity in Ghana: Knowledge gaps and prioritization. Int. J. Biodivers. Conserv. 2014, 6, 681–701. [Google Scholar] [CrossRef]
  48. Kerr, J.T.; Ostrovsky, M. From space to species: Ecological applications for remote sensing. Trends Ecol. Evol. 2003, 18, 299–305. [Google Scholar] [CrossRef]
  49. IUCN/PACO. Parks and Reserves of Ghana: Management Effectiveness Assessment of Protected Areas; IUCN/PACO: Ouagadougou, Burkina Faso, 2010. [Google Scholar]
  50. Norris, K.; Asase, A.; Collen, B.; Gockowksi, J.; Mason, J.; Phalan, B.; Wade, A. Biodiversity in a forest-agriculture mosaic–The changing face of West African rainforests. Biol. Conserv. 2010, 143, 2341–2350. [Google Scholar] [CrossRef]
  51. Dyer, M. Ornithological Perspectives, Annex 4 in Ankasa Conservation Area Management Plan; ULG Northumbrian Ltd.: Durham, NC, USA, 1997; p. 62. [Google Scholar]
  52. Obour, R.; Amankwaa, D.; Asare, A. Illegal rattan extraction trends in the Ankasa Conservation Area in Ghana. J. Energy Nat. Resour. Manag. 2015, 2. [Google Scholar] [CrossRef]
  53. Population Total Ghana 2020. Available online: https://data.worldbank.org/indicator/SP.POP.TOTL?locations=GH (accessed on 5 January 2022).
  54. Janssen, T.A.J.; Ametsitsi, G.K.D.; Collins, M.; Adu-Bredu, S.; Oliveras, I.; Mitchard, E.T.A.; Veenendaal, E.M. Extending the baseline of tropical dry forest loss in Ghana (1984–2015) reveals drivers of major deforestation inside a protected area. Biol. Conserv. 2018, 218, 163–172. [Google Scholar] [CrossRef]
  55. Ayivor, J.S.; Gordon, C.; Tobin, G.A.; Ntiamoa-Baidu, Y. Evaluation of management effectiveness of protected areas in the Volta Basin, Ghana: Perspectives on the methodology for evaluation, protected area financing and community participation. J. Environ. Policy Plan. 2020, 22, 239–255. [Google Scholar] [CrossRef]
  56. Campbell, G.; Kuehl, H.; Kouamé, P.N.; Boesch, C. Alarming decline of West African chimpanzees in Côte d’Ivoire. Curr. Biol. 2008, 18, R903–R904. [Google Scholar] [CrossRef] [Green Version]
  57. Ehuitché, B.T. An analysis of dynamics of deforestation and agricultural productivity in Côte d’Ivoire. Int. Res. J. Agric. Sci. Soil Sci. 2015, 5, 103–111. [Google Scholar] [CrossRef]
  58. Population Total Cote D’Ivoire. Available online: https://data.worldbank.org/indicator/SP.POP.TOTL?locations=CI (accessed on 5 January 2022).
  59. Download Data by Country. Available online: https://diva-gis.org/gdata (accessed on 1 January 2022).
  60. Analysing Data on Protected Areas. Available online: https://www.oecd.org/environment/indicators-modelling-outlooks/OECD-Protected-Areas-Brochure-2019-web.pdf (accessed on 1 January 2022).
  61. Ecoregional Conservation: A Comprehensive Approach to Conserving Biodiversity. Available online: https://www.conservationgateway.org/ConservationByGeography/NorthAmerica/UnitedStates/edc/Documents/ED_terrestrial_ERAs_ecoregconserve.pdf (accessed on 1 January 2022).
  62. SRTM 90m DEM Digital Elevation Database. Available online: http://srtm.csi.cgiar.org (accessed on 1 January 2022).
  63. SEDAC. Gridded Species Distribution: Global Amphibian Richness Grids. Part A; NASA Socioeconomic Data and Applications Center (SEDAC): Palisades, NY, USA, 2015.
  64. Kennedy, C.M.; Oakleaf, J.R.; Theobald, D.M.; Baruch-Mordo, S.; Kiesecker, J. Global Human Modification of Terrestrial Systems; NASA Socioeconomic Data and Applications Center (SEDAC): Palisades, NY, USA, 2020; Volume 10. [CrossRef]
  65. Reis, M.; Bolat, N.; Dutal, H.; Abız, B. Producing Erosion Risk Map Using Remote Sensing Techniques and RUSLE Method in Halfalı Stream Watershed of Kahramanmaras. Kastamonu Univ. J. For. Fac. 2017, 17, 176–185. [Google Scholar] [CrossRef] [Green Version]
  66. Oakleaf, J.R.; Kennedy, C.M.; Baruch-Mordo, S.; West, P.C.; Gerber, J.S.; Jarvis, L.; Kiesecker, J. Development Threat Index; NASA Socioeconomic Data and Applications Center (SEDAC): Palisades, NY, USA, 2019. [CrossRef]
  67. Shrestha, U.B.; Shrestha, S.; Chaudhary, P.; Chaudhary, R.P. How representative is the protected areas system of Nepal? Mt. Res. Dev. 2010, 30, 282–294. [Google Scholar] [CrossRef]
  68. van Breugel, P.; Kindt, R.; Lillesø, J.-P.B.; van Breugel, M. Environmental gap analysis to prioritize conservation efforts in eastern Africa. PLoS ONE 2015, 10, e0121444. [Google Scholar] [CrossRef]
  69. Carr, J.; Adeleke, A.; Angu Angu, K.; Belle, E.; Burgess, N.; Carrizo, S.; Choimes, A.; Coulthard, N.; Darwall, W.; Foden, W.; et al. Ecosystem Profile Guinean Forests of West Africa Biodiversity Hotspot; Critical Ecosystem Partnership Fund: Arlington, VA, USA, 2015. [Google Scholar] [CrossRef]
  70. Naughton-Treves, L.; Holland, M.B.; Brandon, K. The role of protected areas in conserving biodiversity and sustaining local livelihoods. Annu. Rev. Environ. Resour. 2005, 30, 219–252. [Google Scholar] [CrossRef] [Green Version]
  71. Bruner, A.G.; Gullison, R.E.; Rice, R.E.; Fonseca, G.A.B. Da Effectiveness of parks in protecting tropical biodiversity. Science 2001, 291, 125–128. [Google Scholar] [CrossRef] [Green Version]
  72. Eshag, E.; Richards, P.J. A comparison of economic developments in Ghana and the Ivory Coast since 1960. Bull. Oxford Univ. Inst. Econ. Stat. 1967, 29, 353–372. [Google Scholar] [CrossRef]
  73. Savolainen, V.; Clottey, V.A.; Bi, T.S.D.; Konan, J.L.; Quain, M.; Bezeng, B.S.; Logah, V.; Kena, A.W.; Osekre, E.A.; Atuah, L.; et al. Systems thinking creates opportunities for a circular economy and sustainable palm agriculture in Africa. Curr. Res. Environ. Sustain. 2020, 1, 31–34. [Google Scholar] [CrossRef]
  74. Hilty, J.; Worboys, G.L.; Keeley, A.; Woodley, S.; Lausche, B.; Locke, H.; Carr, M.; Pulsford, I.; Pittock, J.; White, J.W.; et al. Guidelines for conserving connectivity through ecological networks and corridors. Best Pract. Prot. Area Guidel. Ser. 2020, 30, 30. [Google Scholar]
  75. Margules, C.R.; Pressey, R.L.; Williams, P.H. Representing biodiversity: Data and procedures for identifying priority areas for conservation. J. Biosci. 2002, 27, 309–326. [Google Scholar] [CrossRef] [PubMed]
  76. Egloff, W.; Agosti, D.; Patterson, D.; Hoffmann, A.; Mietchen, D.; Kishor, P.; Penev, L. Data policy recommendations for biodiversity data. EU BON Project Report. Res. Ideas Outcomes 2016, 2, e8458. [Google Scholar] [CrossRef] [Green Version]
  77. Howard, S.D.; Bickford, D.P. Amphibians over the edge: Silent extinction risk of Data Deficient species. Divers. Distrib. 2014, 20, 837–846. [Google Scholar] [CrossRef]
  78. Watson, J.E.M.; Keith, D.A.; Strassburg, B.B.N.; Venter, O.; Williams, B.; Nicholson, E. Set a global target for ecosystems. Nature 2020, 578, 360–362. [Google Scholar] [CrossRef] [Green Version]
  79. Peyre, G.; Balslev, H.; Font, X.; Tello, J.S. Fine-scale plant richness mapping of the Andean páramo according to macroclimate. Front. Ecol. Evol. 2019, 377. [Google Scholar] [CrossRef] [Green Version]
Figure 1. The ecoregions and protected areas of (a) Côte d’Ivoire and (b) Ghana, West Africa.
Land 11 00720 g001
Figure 2. The protected areas and slope classes in (a) Côte d’Ivoire and (b) Ghana, West Africa. Red circles indicate high–slope areas.
Land 11 00720 g002
Figure 3. The threatened mammal species richness overlaid with the protected area network of (a) Côte d’Ivoire and (b) Ghana, West Africa.
Land 11 00720 g003
Figure 4. Protected areas and cumulative degree of human modification in (a) Côte d’Ivoire and (b) Ghana, West Africa.
Land 11 00720 g004
Figure 5. The protected areas and future development threat for agricultural expansion in (a) Côte d’Ivoire, and (b) Ghana, West Africa.
Land 11 00720 g005
Table 1. Summary of the six PA categories recognized by IUCN (Adapted from Ref. [3]. Copyright 2006).
CategoryDescription
Ia: Strict nature reserveStrictly protected areas are set aside to protect biodiversity and also possibly geological/geomorphological features where human visitation, use, and impacts are strictly controlled and limited to ensure the protection of the conservation values. Such protected areas can serve as indispensable reference areas for scientific research and monitoring.
Ib: Wilderness areaUsually, large unmodified or slightly modified areas, retaining their natural character and influence, without permanent or significant human habitation, are protected and managed to preserve their natural condition.
II: National parkLarge natural or near-natural areas are set aside to protect large-scale ecological processes, along with the complement of species and ecosystems characteristic of the area, which also provide a foundation for environmentally and culturally compatible spiritual, scientific, educational, recreational, and visitor opportunities.
III: Natural monument or featureSet aside to protect a specific natural monument, which can be a landform, sea mount, submarine cavern, geological feature such as a cave, or even a living feature such as an ancient grove. They are generally quite small, protected areas and often have high visitor value.
IV: Habitat/species managementAim to protect particular species or habitats and management reflects this priority. Many Category IV protected areas will need regular, active interventions to address the requirements of particular species or to maintain habitats, but this is not a requirement of the category.
V: Protected landscape or seascapeThe interaction of people and nature over time has produced an area of distinct character with significant ecological, biological, cultural, and scenic value, where safeguarding the integrity of this interaction is vital to protecting and sustaining the area, its associated nature conservation, and other values.
VI: Protected area with sustainable use of natural resourcesConserve ecosystems and habitats, together with associated cultural values and traditional natural resource management systems. They are generally large, with most of the area in natural condition, where a proportion is under sustainable natural resource management and where low-level nonindustrial use of natural resources compatible with nature conservation is seen as one of the main aims of the area.
Table 2. Protected area (PA) IUCN classification, protection type, and human access grouping with the number and total area of each identified in Côte d’Ivoire and Ghana.
IUCN CategoryProtection/Use TypeSimplified Human Access GroupingCôte d’Ivoire,
238 PAs
Ghana,
284 PAs
Number of PAs Area (km2)Number of PAs Area (km2)
IaStrict protection (Ia: Strict nature reserve, Ib: Wilderness area)Low
Human access is strictly limited except for low visitation of areas with religious/spiritual significance
313221376
IIEcosystem conservation and protectionMedium
Permits for cultural, scientific, educational, recreational, and visitation purposes)
919,7101010,928
IIIConservation of natural features--565312
IVConservation through active management3492819063
VLandscape/seascape conservation and recreationHigh
Categories V and VI (multiple-use categories where human intervention is expected; allows sustainable natural resource management and extraction)
--6349
VISustainable use of natural resources--12710,987
Not ReportedLocal PAs such as forest reservesN/A22350,242283
Not ApplicableOther specific designations: World Heritage Sites or UNESCO Man and Biosphere (MAB) ReservesN/A--1720
Table 3. The comparison index (CI) for all protected areas (IUCN PA categories, those without assigned categorizations (not reported) and World Heritage Sites or UNESCO MAB reserves (not applicable) and their percentage land areas of the ecoregions in Ghana and Côte d’Ivoire. Blue highlighting indicates good representation (CI > 1), * = Global 200.
CountryCôte d’IvoireGhana
Terrestrial Ecoregion% of Land Area% of PACI% of Land Area% of PACI
West Sudanian Savanna *26.5221.520.8237.7811.970.32
Guinean Forest–Savanna Mosaic27.8815.100.5429.1912.020.41
Eastern Guinean Forests *32.2722.460.7033.3922.110.66
Central African Mangroves * 0.5936.9062.84
Guinean Mangroves *0.194.9125.550.010Not represented
Western Guinean Lowland Forests * 13.6236.012.64
Guinean Montane Forests * 0.9224.4326.62
Table 4. The comparison index (CI) for IUCN protected area categories and their percentage land areas of the ecoregions in Côte D’Ivoire and Ghana. Blue highlighting indicates good representation (CI > 1), * = Global 200.
CountryCôte d’IvoireGhana
Terrestrial EcoregionIUCN Category% of PACI% of PACI
West Sudanian Savanna *II11.760.445.640.15
III 0.910.02
V 0.140.004
IV 2.630.07
VI 2.660.07
Guinean Forest–Savanna MosaicIa1.380.050.540.02
II3.590.136.720.23
III 0.370.01
IV0.230.012.410.08
VI 1.970.07
Eastern Guinean Forests *Ia0.030.001
II0.830.031.370.04
III 5.270.16
IV0.000.006.200.19
V 0.280.01
VI 8.970.27
Western Guinean Lowland Forests *Ia0.050.003
II12.550.92
IV0.640.05
Guinean Montane Forests *Ia0.850.92
II2.022.20
Guinean Mangroves *II1.186.14
Table 5. The comparison index (CI) for all protected areas (IUCN PA categories, those without assigned categorizations (not reported) and World Heritage Sites or UNESCO MAB reserves (not applicable)) and their percentage land areas of slope classes in Ghana and Côte d’Ivoire. Blue highlighting indicates good representation (CI > 1).
CountryCôte d’IvoireGhana
Slope Classification (Degrees)% of Land Area% of PACI% of Land Area% of PACI
Flat (0–2)96.9313.810.1493.8819.700.21
Low (>2–6)2.6522.318.424.3430.957.13
Medium (>6–12)0.4032.4880.740.7451.2669
High (>12–20)0.0158.494439.480.0250.662389.14
Table 6. The comparison index (CI) for IUCN protected area categories and their percentage land areas of the slope classes in Côte d’Ivoire and Ghana.
CountryCôte d’IvoireGhana
Slope Classification
(Degrees)
IUCN Category% of PACI% of PACI
Flat (0–2)Ia0.410.0040.170.002
II0.630.0070.970.01
III 4.950.05
IV0.060.0016.190.07
V 0.260.003
VI 7.120.08
Low (>2–6)Ia0.210.08
II6.362.405.341.23
III 5.791.33
IV0.250.108.301.91
V 0.120.03
VI 11.392.63
Medium (>6–12)Ia1.393.44
II11.3028.024.165.60
24.5933.10
13.3017.90
9.2112.40
High (>12–20)Ia20.141529.05
II10.10766.42
III 37.1717.52
IV 13.49636.25
Table 7. Summary statistics (median, mean, and CI for mean value) for threatened mammal species richness in Ghana and Côte d’Ivoire’s protected areas (IUCN PA categories, those without assigned categorizations (not reported) and World Heritage Sites or UNESCO MAB reserves (not applicable)).
Côte d’IvoireGhana
IUCN CategoryThreatened Mammal Species Richness
MedianMeanCIMedianMeanCI
Ia66.3810.5111.420.03
II44.662.0433.861.17
III 32.740.44
IV46.039.9622.430.35
V 43.571.66
VI 32.530.29
Not Reported33.550.332212.71
Not Applicable 11.160.03
Table 8. Summary statistics (median, mean, and CI for mean value) for the cumulative degree of human modification estimated in protected areas in Côte d’Ivoire and Ghana’s (IUCN PA categories, those without assigned categorizations (not reported) and World Heritage Sites or UNESCO MAB reserves (not applicable)).
CountryCôte d’IvoireGhana
IUCN CategoryNo of PAsTotal Area (km2)Human Modification
(0–1 Summary Scale)
No of PAsTotal Area (km2)Human Modification
(0–1 Summary Scale)
MedianMeanCIMedianMeanCI
Ia313220.300.350.5013760.400.410.01
II919,7100.260.300.151010,9280.210.240.10
III 5653120.280.370.05
IV34920.330.460.838190630.340.400.05
V 63490.270.280.07
VI 12710,9870.380.430.03
Not Reported22350,2420.380.400.022830.690.691.53
Not Applicable 17200.640.590.01
Table 9. Summary statistics (median, mean, and CI for mean value) for the future development threat of agricultural expansion in Côte d’Ivoire and Ghana’s protected areas (IUCN PA categories, those without assigned categorizations (not reported) and World Heritage Sites or UNESCO MAB reserves (not applicable)).
CountryCôte d’IvoireGhana
IUCN
Category
No of PAs Total Area (km2)Agricultural Expansion Score
(0–100 Summary Scale)
No of PAs Total Area (km2)Agricultural Expansion Score
(0–100 Summary Scale)
MedianMeanCIMedianMeanCI
Ia313225946.3873.8113767374.540.12
II919,7105956.2013.921010,9288364.4124.60
III 5653128776.797.19
IV34926659.8429.778190638778.475.15
V 63499087.833.66
VI 12710,9878780.393.60
Not Reported22350,2426057.741.912834747597.19
Not Applicable 1720000
Publisher’s Note: MDPI stays neutral with regard to jurisdictional claims in published maps and institutional affiliations.

