
Impact of Urban Form on CO2 Emissions under Different Socioeconomic Factors: Evidence from 132 Small and Medium-Sized Cities in China


Abstract
:1. Introduction
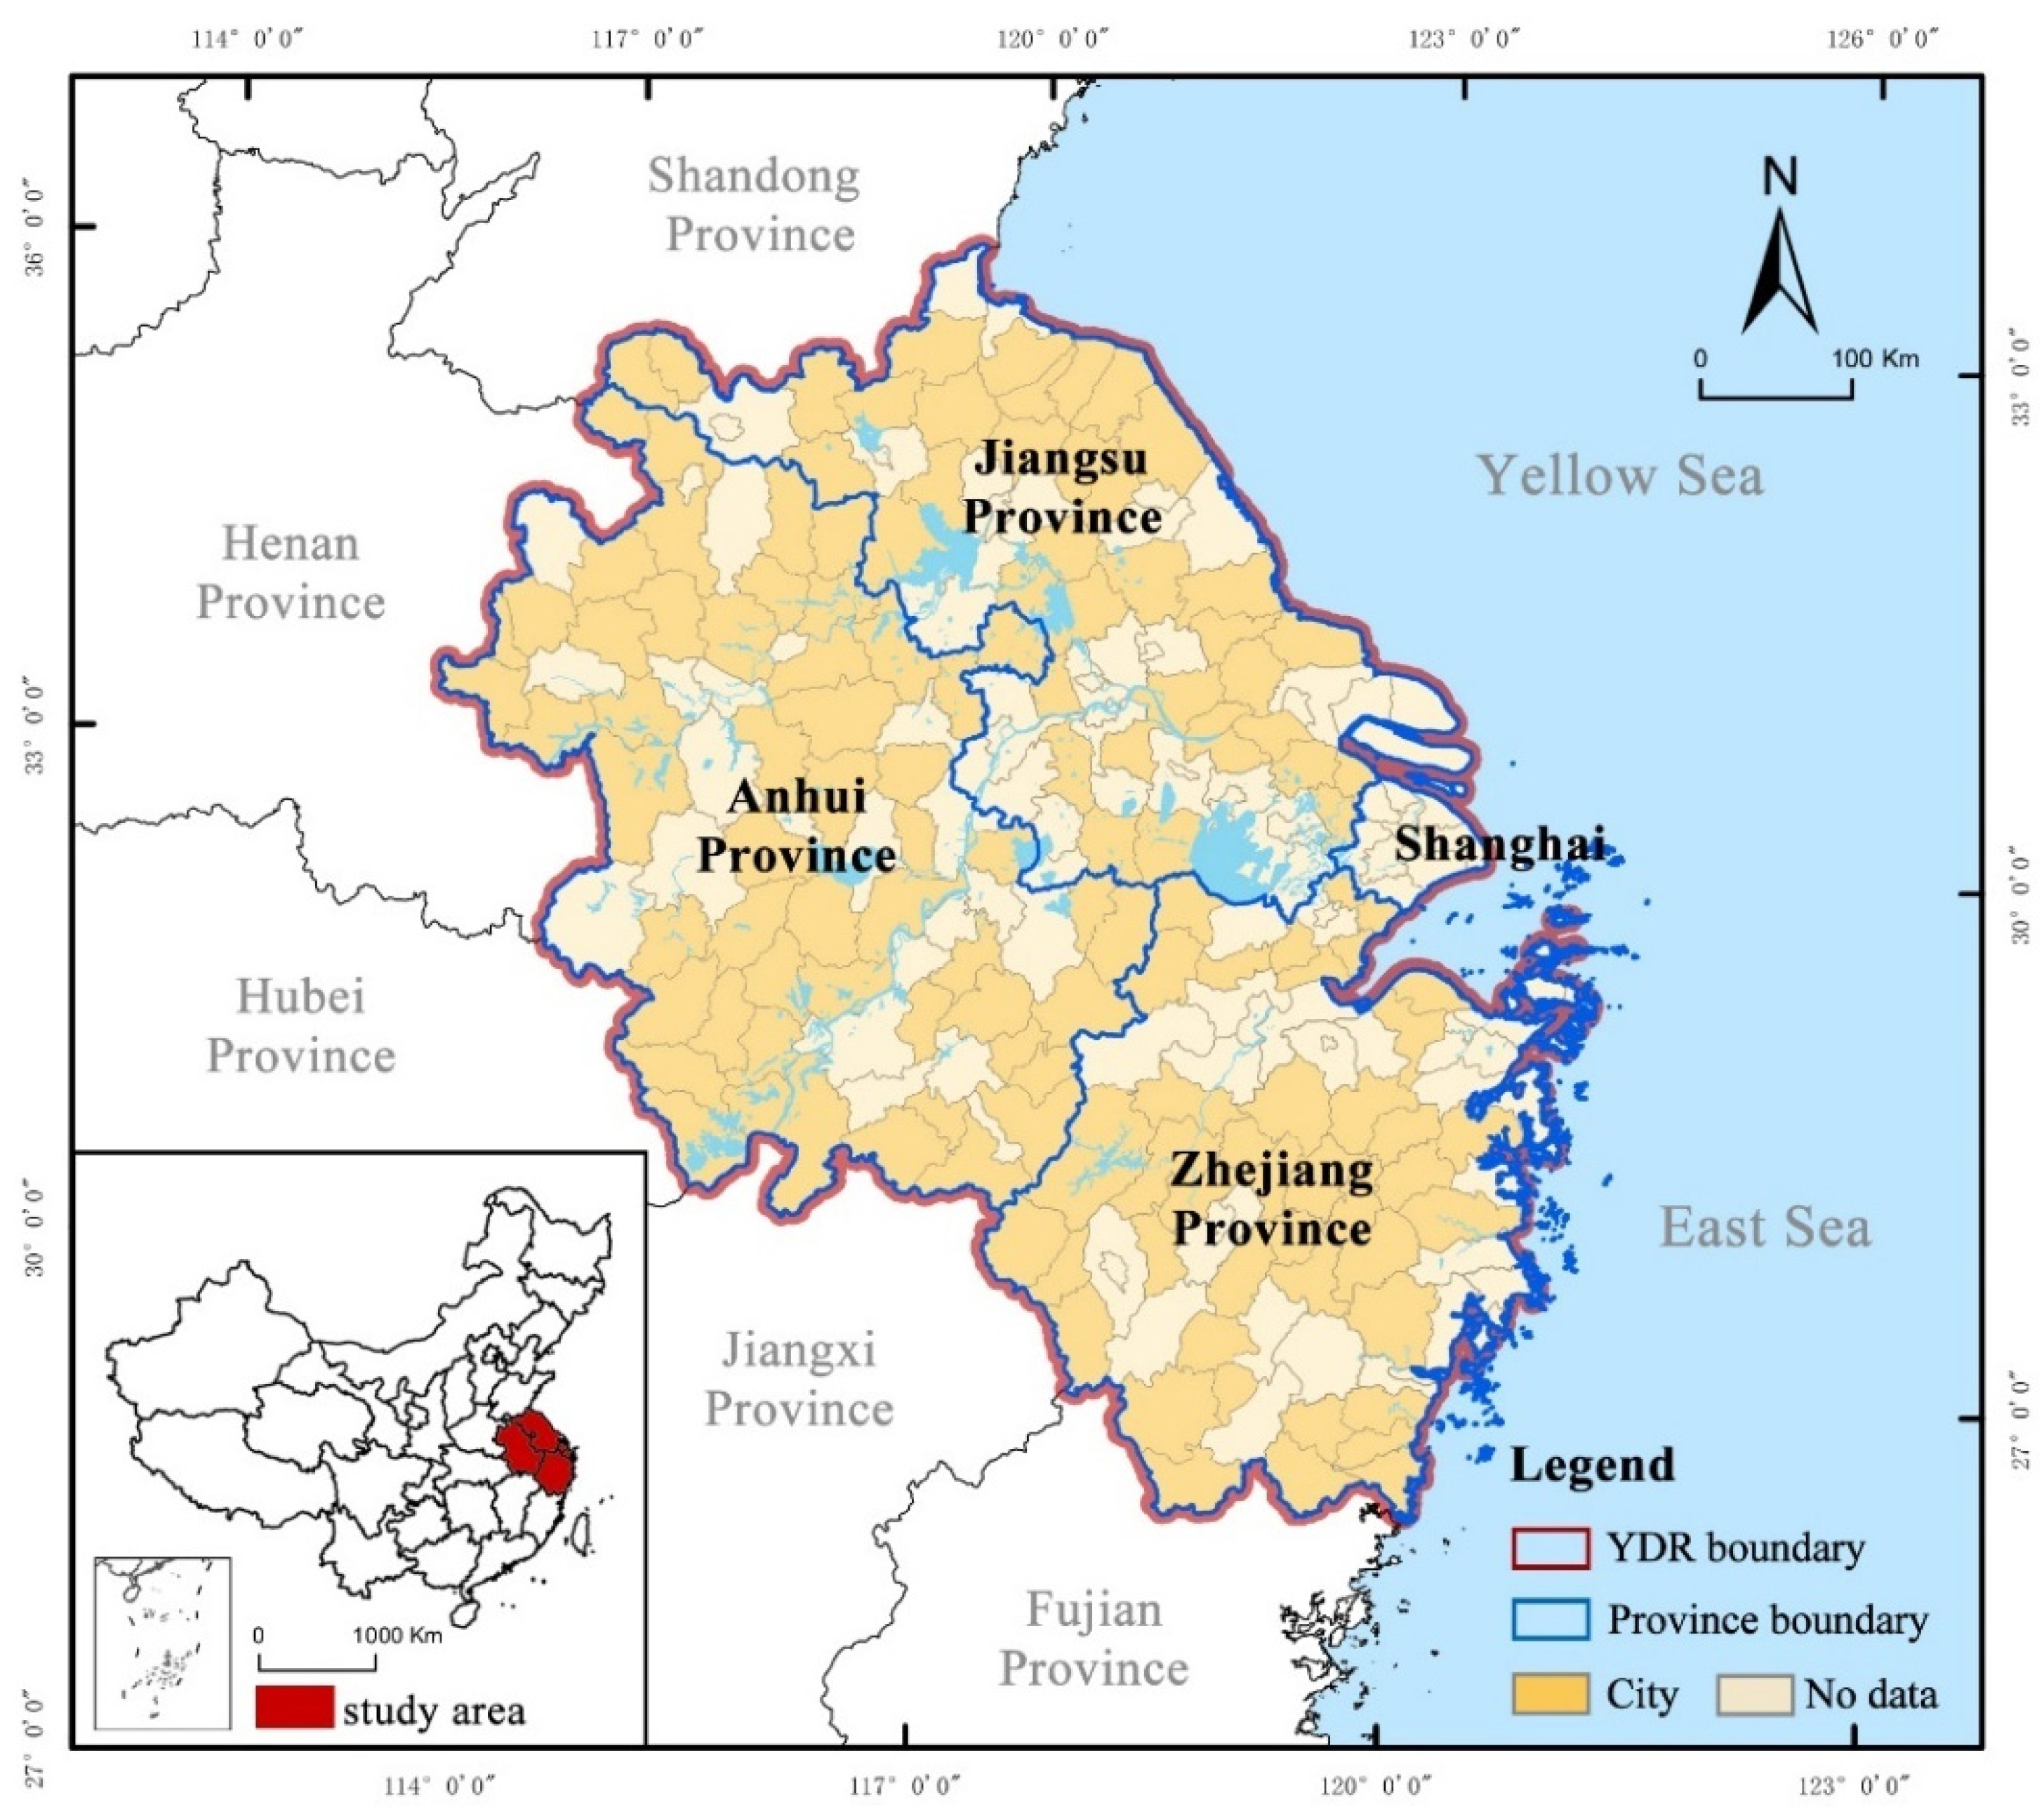
2. Study Areas
3. Data and Method
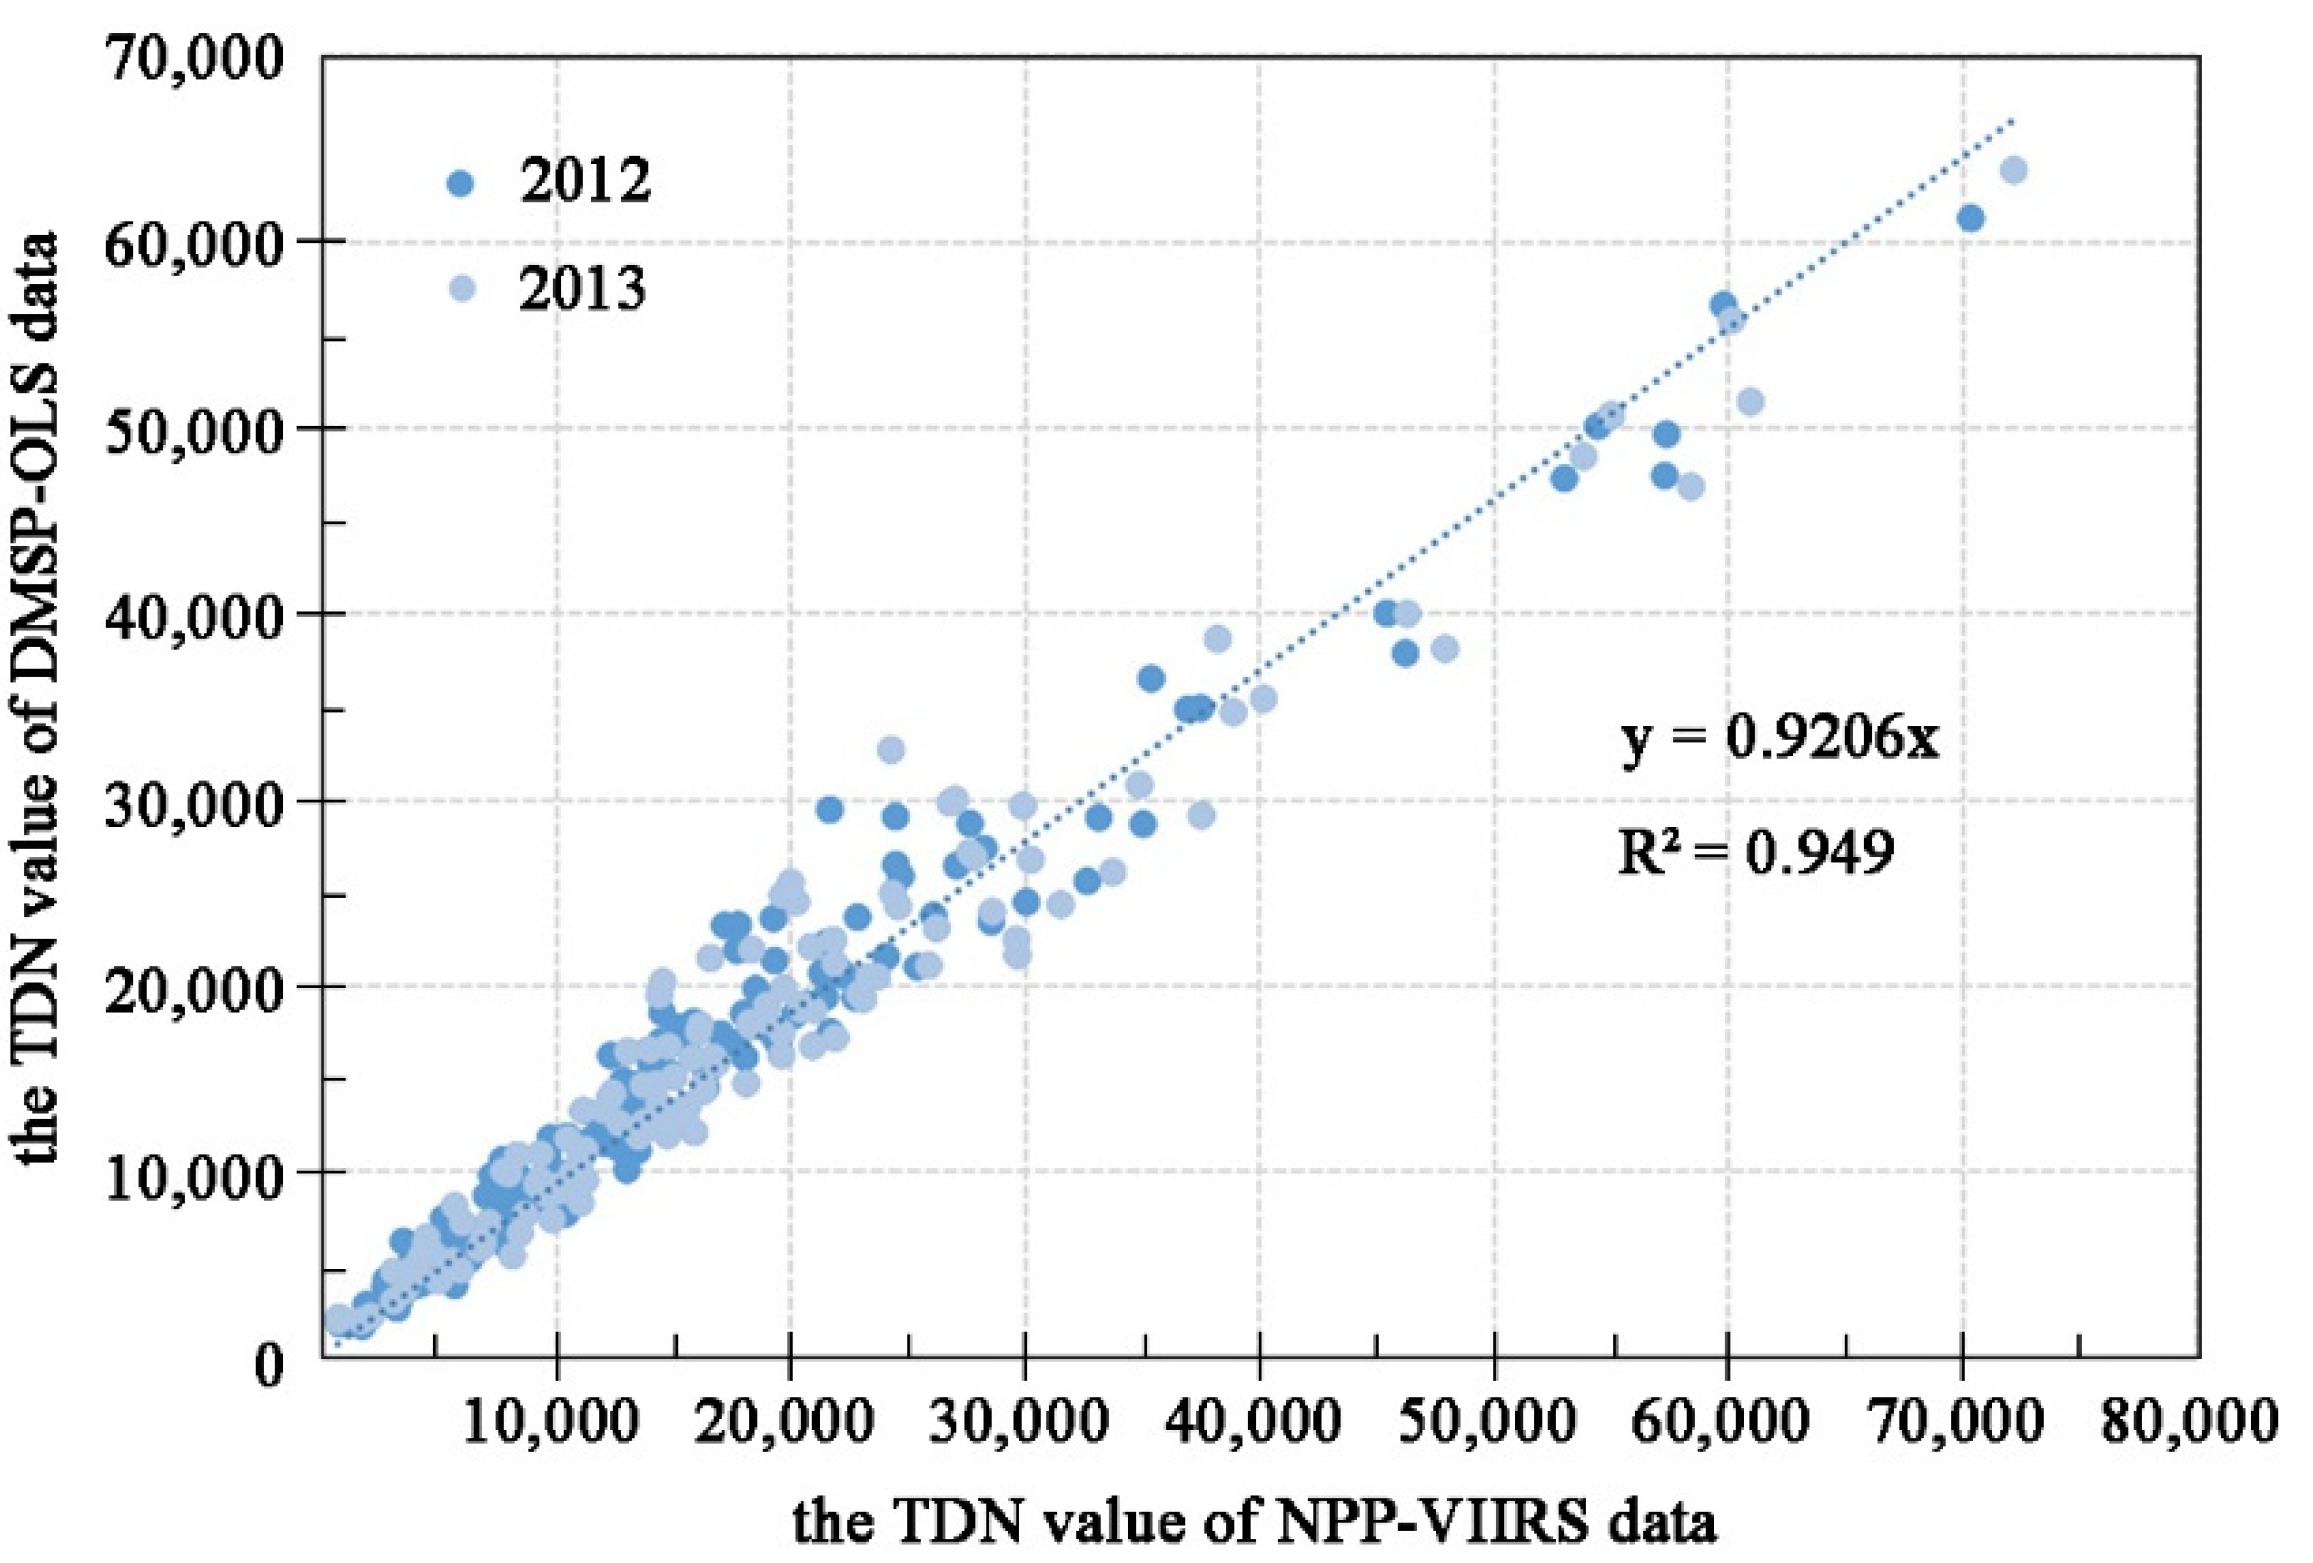
3.1. Calculating CO2 Emissions
3.2. Quantifying Urban Form
3.3. Measuring Socioeconomic Factors
3.4. Panel Data Modeling
4. Results
4.1. Variations in Urban Form and CO2 Emissions
4.2. Interaction Effects between Socioeconomic Factors and Urban Form
4.3. Impact of Socioeconomic Factors on the Relationship between Urban Forms and CO2 Emissions
5. Discussion
6. Conclusions
- (1)
- Per-capita CO2 emissions increased in small and medium-sized cities in the YRD between 2005 and 2020 but showed a slight declining trend after 2015.
- (2)
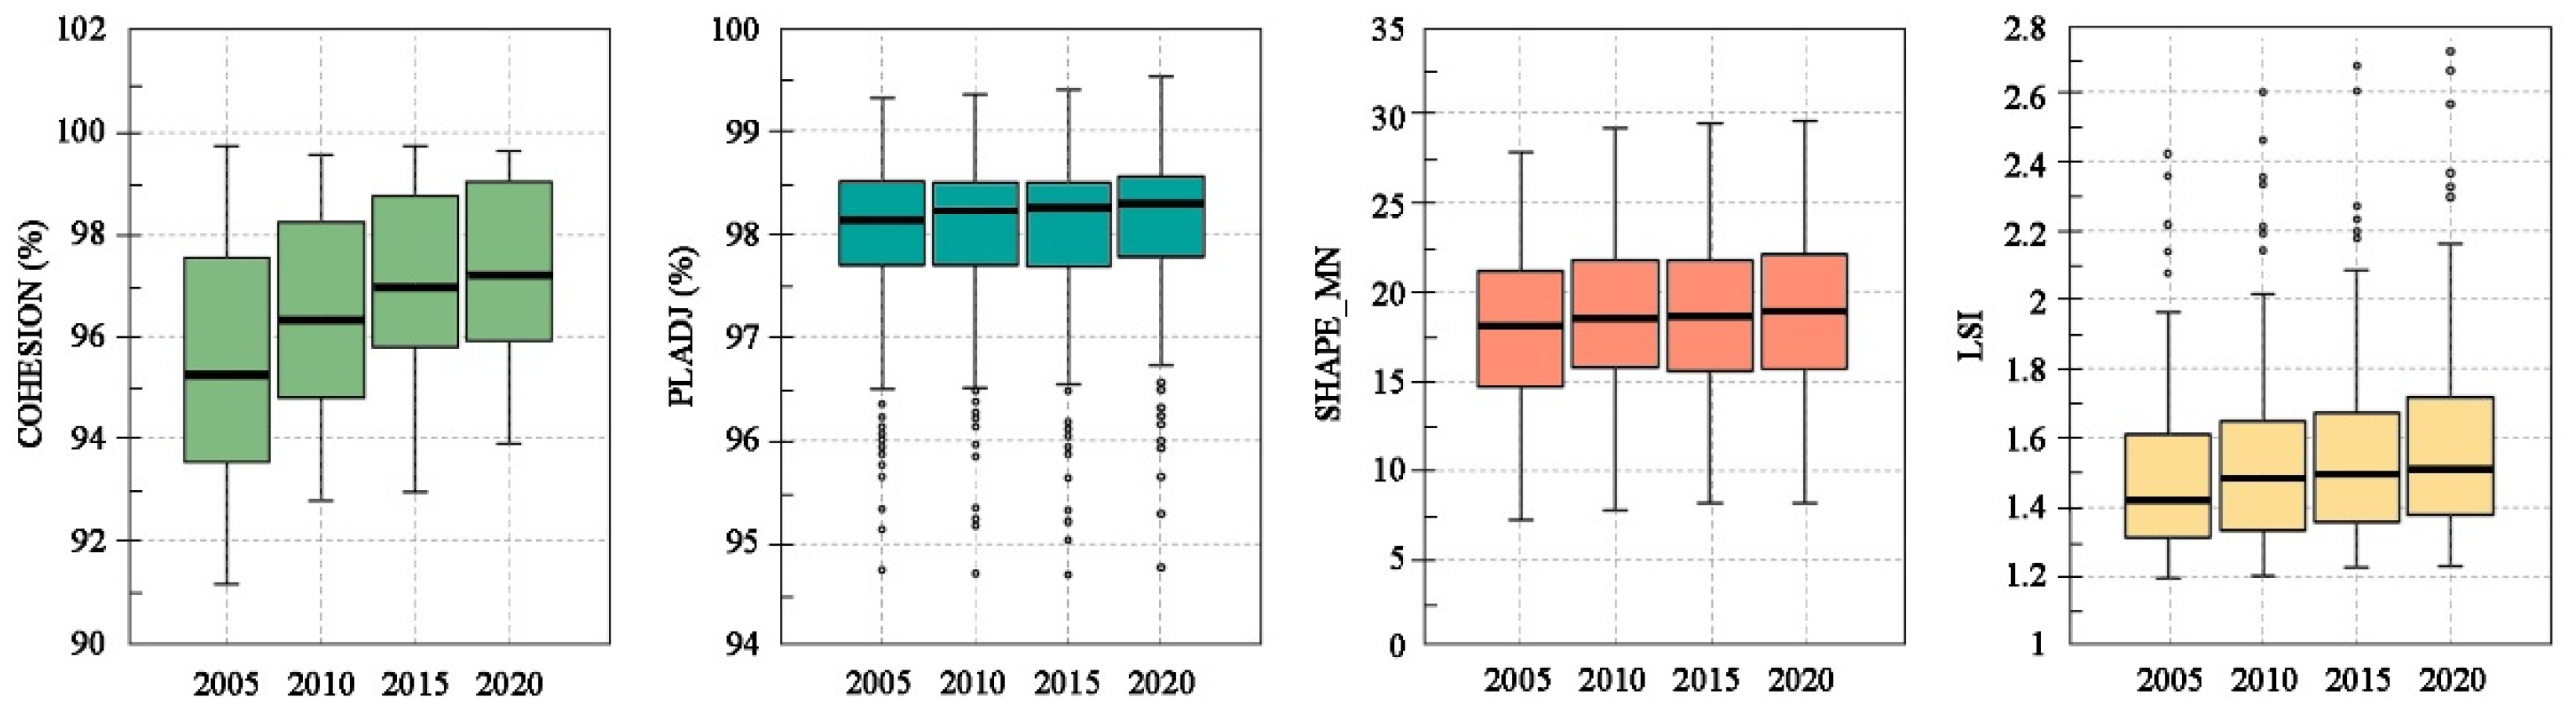
- The patch cohesion index, percentage of like adjacencies, landscape shape index, and mean patch shape index increased, demonstrating that the urban form of the small and medium-sized cities in this study became more compact and complex.
- (3)
- The comparison of the three socioeconomic factors showed that the relationship between urban form and per-capita CO2 emissions was more significantly affected by the level of economic development, followed by population density and industrial structure.
- (4)
- From the analysis of interactive effects, we found that the negative impact of compactness on per-capita CO2 emissions increased as the proportion of the tertiary industry, population density, and per-capita GDP rose. The positive impact of complexity on per-capita CO2 emissions only increased with a rise in population density.
- (5)
- The sub-sample regression analysis demonstrates that the impact of compactness on per-capita CO2 emissions was significant in service cities and industrially balanced cities, while there was no obvious correlation in industrial cities. Urban form compactness and complexity had a significant correlation with PCO2 in all cities with different population densities, and the levels both rose with an increase in population density. The impact of the urban compactness on per-capita CO2 emissions was most significant in cities with a high development level, followed by medium-development-level cities, while the impact was insignificant in low-development-level cities.
- (1)
- Policies and planning strategies should aim to increase urban compactness, especially for small and medium-sized cities with a higher proportion of the tertiary industry, higher population density, and higher per capita GDP. Small and medium-sized cities should promote urban growth via infilling rather than outlying. This is also consistent with the land-use policies of cities in the YDR in recent years [101,102]. Decision-makers should seek to redevelop underutilized land and brownfields within cities to reduce mobility requirements and vehicle dependency by increasing efficient land use and combining the benefits of the centralization of various functions. In this process, the occupation of natural space should be avoided and interspersed with blue–green spaces as much as possible to counteract the negative effects of highly compact cities (i.e., urban island effects and lower quality of life) [103].
- (2)
- Consummating urban public transportation networks, especially between the main urban areas and suburban areas, is a method of compensating for the long-distance travel problem of private cars caused by the unbalanced allocation of public resources.
- (3)
- Minimizing complexity should be regarded as a supplementary method for optimizing urban form to mitigate CO2 emissions. However, removing and modifying urban built-up patches is unrealistic and expensive. Thus, decreasing urban complexity by adjusting the road system (i.e., adding or removing urban branch roads and one-way streets) to avoid unnecessary vehicle detours whenever possible may be a more economically feasible way to reduce the negative effects on transport CO2 emissions caused by urban complexity.
- (4)
- For industrial cities, although the role of urban form in reducing CO2 emissions is not as significant as it is in other cities, the overall CO2 emissions of industrial cities are usually high. Therefore, CO2 emission reduction in industrial cities can be implemented not only by improving energy efficiency and adjusting the industrial structure but also by long-term spatial optimization measures, such as improving compactness and reducing complexity.
Author Contributions
Funding
Institutional Review Board Statement
Informed Consent Statement
Data Availability Statement
Acknowledgments
Conflicts of Interest
References
- Pachauri, R.K.; A, M.R.; Barros, V.R.; Broome, J.; Cramer, W.; Christ, R.; Church, J.A.; Clarke, L.; Dahe, Q.; Dasgupta, P. Climate Change 2014: Synthesis Report. Contribution of Working Groups I, II and III to the Fifth Assessment Report of the Intergovernmental Panel on Climate Change 2014; Cambridge University Press: Cambridge, UK, 2015. [Google Scholar]
- Cai, M.; Shi, Y.; Ren, C.; Yoshida, T.; Yamagata, Y.; Ding, C.; Zhou, N. The need for urban form data in spatial modeling of urban carbon emissions in China: A critical review. J. Clean. Prod. 2021, 319, 128792. [Google Scholar] [CrossRef]
- Netherlands Environmental Assessment Agency (NEAA). China Now No. 1 in CO2 Emissions, USA in Second Position. Available online: http://www.mnp.nl/en/dossiers/Climatechange/moreinfo/Chinanowno1inCO2emissionsUSAinsecondposition.html (accessed on 28 September 2020).
- State Council. Work Plan of Controlling Greenhouse Gas Emissions During the 13th Five-Year Plan. Available online: http://www.gov.cn/zhengce/content/2016-11/04/content_5128619.htm (accessed on 15 October 2020).
- State Council. Comprehensive Work Plan of Energy Conservation and Emission Reduction During the 13th Five-Year Plan. Available online: http://www.gov.cn/zhengce/content/2017-01/05/content_5156789.htm (accessed on 25 January 2021).
- Department of Rural Surveys, National Bureau of Statistics of China. China Statistical Yearbook (County-Level); China Statistics Press: Beijing, China, 2017. [Google Scholar]
- Ou, J.; Liu, X.; Wang, S.; Xie, R.; Li, X. Investigating the differentiated impacts of socioeconomic factors and urban forms on CO2 emissions: Empirical evidence from Chinese cities of different developmental levels. J. Clean. Prod. 2019, 226, 601–614. [Google Scholar] [CrossRef]
- Zhang, H.; Peng, J.; Wang, R.; Zhang, J.; Yu, D. Spatial planning factors that influence CO2 emissions: A systematic literature review. Urban Clim. 2021, 36, 100809. [Google Scholar] [CrossRef]
- Salat, S.; Bourdic, L. Urban complexity, efficiency and resilience. In Energy Efficiency—A Bridge to Low Carbon Economy; Morvaj, Z., Ed.; Intechopen: London, UK, 2012; pp. 25–44. [Google Scholar]
- Creutzig, F.; Agoston, P.; Minx, J.C.; Canadell, J.G.; Andrew, R.M.; Quéré, C.L.; Peters, G.P.; Sharifi, A.; Yamagata, Y.; Dhakal, S. Urban infrastructure choices structure climate solutions. Nat. Clim. Change 2016, 6, 1054–1056. [Google Scholar] [CrossRef]
- Seto, K.C.; Dhakal, S.; Bigio, A.; Blanco, H.; Delgado, G.C.; Dewar, D.; Huang, L.; Inaba, A.; Kansal, A.; Lwasa, S. Human Settlements, Infrastructure and Spatial Planning; Cambridge University Press: Cambridge, UK, 2014. [Google Scholar]
- Chen, Y.; Li, X.; Zheng, Y.; Guan, Y.; Liu, X. Estimating the relationship between urban forms and energy consumption: A case study in the Pearl River Delta, 2005–2008. Landsc. Urban Plan. 2011, 102, 33–42. [Google Scholar] [CrossRef]
- Camagni, R.; Gibelli, M.C.; Rigamonti, P. Urban mobility and urban form: The social and environmental costs of different patterns of urban expansion. Ecol. Econ. 2002, 40, 199–216. [Google Scholar] [CrossRef]
- Fang, C.; Wang, S.; Li, G. Changing urban forms and carbon dioxide emissions in China: A case study of 30 provincial capital cities. Appl. Energy 2015, 158, 519–531. [Google Scholar] [CrossRef]
- Ou, J.; Liu, X.; Li, X.; Chen, Y. Quantifying the relationship between urban forms and carbon emissions using panel data analysis. Landsc. Ecol. 2013, 28, 1889–1907. [Google Scholar] [CrossRef]
- Sharifi, A. Resilient urban forms: A macro-scale analysis. Cities 2019, 85, 1–14. [Google Scholar] [CrossRef]
- Cui, S.; Xu, L.; Huang, Y.; Wang, J.; Li, Y.; Li, Y.; Yang, Y.; Zhou, Y. Progress and prospect of study on urban spatial patterns to cope with climate change. Prog. Geogr. 2015, 34, 1209–1218. [Google Scholar]
- Sharifi, A. Urban form resilience: A meso-scale analysis. Cities 2019, 93, 238–252. [Google Scholar] [CrossRef]
- Horowitz, C. Looking up: How green roofs and cool roofs can reduce energy use, address climate change, and protect water resources in southern California. UCLA Emmett Cent. Clim. Change Environ. NRDC Rep. 2012, 12, 12–18. [Google Scholar]
- Wang, F. Modelling sheltering effects of trees on reducing space heating in office buildings in a windy city. Energy Build. 2006, 38, 1443–1454. [Google Scholar] [CrossRef]
- Littlefair, P. Passive solar urban design: Ensuring the penetration of solar energy into the city. Renew. Sustain. Energy Rev. 1998, 2, 303–326. [Google Scholar] [CrossRef]
- Huang, Q.; Xu, C.; Jiang, W.; Yue, W.; Rong, Q.; Gu, Z.; Su, M. Urban compactness and patch complexity influence PM2.5 concentrations in contrasting ways: Evidence from the Guangdong-Hong Kong-Macao Greater Bay Area of China. Ecol. Indic. 2021, 133, 108407. [Google Scholar] [CrossRef]
- She, Q.; Jia, W.; Pan, C.; Zhu, X.; Yang, F.; Liu, M.; Xiang, W. Spatial and temporal variation characteristics of urban forms’ impact on regional carbon emissions in the Yangtze River Delta. China Popul. Resour. Environ. 2015, 25, 44–51. [Google Scholar]
- Shi, K.; Wang, H.; Yang, Q.; Wang, L.; Sun, X.; Li, Y. Exploring the relationships between urban forms and fine particulate (PM2.5) concentration in China: A multi-perspective study. J. Clean. Prod. 2019, 231, 990–1004. [Google Scholar] [CrossRef]
- Sha, W.; Chen, Y.; Wu, J.; Wang, Z. Will polycentric cities cause more CO2 emissions? A case study of 232 Chinese cities. J. Env. Sci. 2020, 96, 33–43. [Google Scholar] [CrossRef]
- Liu, X.; Wang, M. How polycentric is urban China and why? A case study of 318 cities. Landsc. Urban Plan. 2016, 151, 10–20. [Google Scholar] [CrossRef]
- Wu, W.; Zhao, S.; Zhu, C.; Jiang, J. A comparative study of urban expansion in Beijing, Tianjin and Shijiazhuang over the past three decades. Landsc. Urban Plan. 2015, 134, 93–106. [Google Scholar] [CrossRef]
- Shi, K.; Xu, T.; Li, Y.; Chen, Z.; Gong, W.; Wu, J.; Yu, B. Effects of urban forms on CO2 emissions in China from a multi-perspective analysis. J. Env. Manag. 2020, 262, 110300. [Google Scholar] [CrossRef] [PubMed]
- Wang, S.; Liu, X.; Zhou, C.; Hu, J.; Ou, J. Examining the impacts of socioeconomic factors, urban form, and transportation networks on CO2 emissions in China’s megacities. Appl. Energy 2017, 185, 189–200. [Google Scholar] [CrossRef]
- Wang, M.; Madden, M.; Liu, X. Exploring the Relationship between Urban Forms and CO2 Emissions in 104 Chinese Cities. J. Urban Plan. Dev. 2017, 143, 04017014. [Google Scholar] [CrossRef]
- Song, Y.; Shao, G.; Song, X.; Liu, Y.; Pan, L.; Ye, H. The Relationships between Urban Form and Urban Commuting: An Empirical Study in China. Sustainability 2017, 9, 1150. [Google Scholar] [CrossRef] [Green Version]
- Li, Y.; Xiong, W.; Wang, X. Does polycentric and compact development alleviate urban traffic congestion? A case study of 98 Chinese cities. Cities 2019, 88, 100–111. [Google Scholar] [CrossRef]
- Ye, H.; He, X.; Song, Y.; Li, X.; Zhang, G.; Lin, T.; Xiao, L. A sustainable urban form: The challenges of compactness from the viewpoint of energy consumption and carbon emission. Energy Build. 2015, 93, 90–98. [Google Scholar] [CrossRef]
- Fragkias, M.; Lobo, J.; Strumsky, D.; Seto, K.C. Does size matter? Scaling of CO2 emissions and US urban areas. PLoS ONE 2013, 8, e64727. [Google Scholar] [CrossRef]
- Wang, S.; Zeng, J.; Huang, Y.; Shi, C.; Zhan, P. The effects of urbanization on CO2 emissions in the Pearl River Delta: A comprehensive assessment and panel data analysis. Appl. Energy 2018, 228, 1693–1706. [Google Scholar] [CrossRef]
- Liu, X.; Wang, M.; Qiang, W.; Wu, K.; Wang, X. Urban form, shrinking cities, and residential carbon emissions: Evidence from Chinese city-regions. Appl. Energy 2020, 261, 114409. [Google Scholar] [CrossRef]
- Su, H.; Han, G.; Li, L.; Qin, H. The impact of macro-scale urban form on land surface temperature: An empirical study based on climate zone, urban size and industrial structure in China. Sustain. Cities Soc. 2021, 74, 103217. [Google Scholar] [CrossRef]
- Research Institute of Development Strategy for Small-Medium Cities. Annual Report on Development of Small and Medium-Sized Cities in China (2019); Social Sciences Academic Press: Beijing, China, 2019. [Google Scholar]
- Rui, W.; He, Z.; Lanmeng, F. Impact of China’s County Scale and Structure on Household Carbon Emissions: Key Elements and Representative Indicators. Mod. Urban Res. 2021, 02, 126–132. [Google Scholar] [CrossRef]
- Research Institute of Development Strategy for Small-Medium Cities. Annual Report on Development of Small and Medium-Sized Cities in China (2020); Social Sciences Academic Press: Beijing, China, 2020. [Google Scholar]
- Wang, Z.; Yang, L. Indirect carbon emissions in household consumption: Evidence from the urban and rural area in China. J. Clean. Prod. 2014, 78, 94–103. [Google Scholar] [CrossRef]
- Liu, Y.; Kang, H.; Sun, S.; Zhou, Y.; Zhang, H. A study on the variation of building climate zones and heating conditions in China. J. Meteorol. Environ. 2020, 36, 97–104. [Google Scholar] [CrossRef]
- Rui, W.; He, Z.; Wenli, Q.; Fan, L.; Jingyi, P. Spatial characteristics and influencing factors of carbon emissions in county-level cities of China based on urbanization. Prog. Geogr. 2021, 4, 1999–2010. [Google Scholar] [CrossRef]
- Department of Rural Surveys, National Bureau of Statistics of China. China Statistical Yearbook (County-Level); China Statistics Press: Beijing, China, 2019. [Google Scholar]
- Shaojian, W.; Zihan, X.; Zehong, W. The spatiotemporal pattern evolution and influencing factors of CO2 emissions at the county level of China. Acta Geogr. Sin. 2021, 76, 3103–3118. [Google Scholar] [CrossRef]
- Fang, C.; Li, G.; Wang, S. Changing and Differentiated Urban Landscape in China: Spatiotemporal Patterns and Driving Forces. Env. Sci Technol 2016, 50, 2217–2227. [Google Scholar] [CrossRef] [PubMed]
- Shanghai Statistics Bureau. Shanghai Statistical Yearbook; China Statistics Press: Beijing, China, 2019. [Google Scholar]
- Yuyan, Z.; Weixin, L.; Hui, W.; Yu, M. Influence of Urban Core Built-up Area on Neighbouring Newly-increased Construction Land of the Yangtze River Delta. Resour. Environ. Yangtze Basin 2018, 27, 2172–2181. [Google Scholar] [CrossRef]
- Department of energy statistics, National Bureau of Statistics. China Energy Statistical Yearbook; China Statistics Press: Beijing, China, 2018. [Google Scholar]
- Xu, G.; Ren, X.; Xiong, K.; Li, L.; Bi, X.; Wu, Q. Analysis of the driving factors of PM2.5 concentration in the air: A case study of the Yangtze River Delta, China. Ecol. Indic. 2020, 110, 105889. [Google Scholar] [CrossRef]
- National Development and Reform Commission. Development Plan of the City Cluster in the Yangtze River Delta Region. Available online: http://www.ndrc.gov.cn/xxgk/zcfb/ghwb/201606/W020190905497826154295.pdf (accessed on 20 August 2021).
- Center for Yangtze River Delta and Ecnomic Belt Research. Economic Growth Report for 41 Cities in the Yangtze River Delta Region. Available online: https://cyrdebr.sass.org.cn/2021/0520/c6129a105415/page.htm (accessed on 20 August 2021).
- China Committee for Development of Medium and Small Cities (CCDMSC). China Small and Medium-Sized City Development Report (2010): The Development Path of Chinese Small and Medium-Sized City; Social Science Academic Press: Beijing, China, 2010. [Google Scholar]
- Zhancheng, L.; Anjian, W.; Wenjia, Y.; Ming, L. Research on regional carbon emissions in China. Diqiu Xuebao (Acta Geosci. Sin.) 2010, 31, 727–732. [Google Scholar]
- Su, Y.; Chen, X.; Ye, Y.; Wu, Q.; Zhang, H.; Huang, N.; Kuang, Y. The characteristics and mechanisms of carbon emissions from energy consumption in China using DMSP/OLS night light imageries. Acta Geogr. Sin. 2013, 68, 1513–1526. [Google Scholar]
- Wang, S.; Liu, X. China’s city-level energy-related CO2 emissions: Spatiotemporal patterns and driving forces. Appl. Energy 2017, 200, 204–214. [Google Scholar] [CrossRef]
- Meng, L.; Graus, W.; Worrell, E.; Huang, B. Estimating CO2 (carbon dioxide) emissions at urban scales by DMSP/OLS (Defense Meteorological Satellite Program’s Operational Linescan System) nighttime light imagery: Methodological challenges and a case study for China. Energy 2014, 71, 468–478. [Google Scholar] [CrossRef]
- Shi, K.; Chen, Y.; Yu, B.; Xu, T.; Chen, Z.; Liu, R.; Li, L.; Wu, J. Modeling spatiotemporal CO2 (carbon dioxide) emission dynamics in China from DMSP-OLS nighttime stable light data using panel data analysis. Appl. Energy 2016, 168, 523–533. [Google Scholar] [CrossRef]
- Haibo, D.; Wei, W.; Xueyuan, Z.; Xuepeng, J. Spatio-temporal evolution and influencing factors of energy-related carbon emissions in the Yellow River Basin: Based on the DMSP/OLS and NPP/VIIRS nighttime light data. Geogr. Res. 2021, 40, 2051–2065. [Google Scholar] [CrossRef]
- Lv, Q.; Liu, H.; Wang, J.; Liu, H.; Shang, Y. Multiscale analysis on spatiotemporal dynamics of energy consumption CO2 emissions in China: Utilizing the integrated of DMSP-OLS and NPP-VIIRS nighttime light datasets. Sci. Total Env. 2020, 703, 134394. [Google Scholar] [CrossRef]
- Zhao, J.; Ji, G.; Yue, Y.; Lai, Z.; Chen, Y.; Yang, D.; Yang, X.; Wang, Z. Spatio-temporal dynamics of urban residential CO2 emissions and their driving forces in China using the integrated two nighttime light datasets. Appl. Energy 2019, 235, 612–624. [Google Scholar] [CrossRef]
- Liu, Z.; He, C.; Zhang, Q.; Huang, Q.; Yang, Y. Extracting the dynamics of urban expansion in China using DMSP-OLS nighttime light data from 1992 to 2008. Landsc. Urban Plan. 2012, 106, 62–72. [Google Scholar] [CrossRef]
- Shi, K.; Yu, B.; Huang, Y.; Hu, Y.; Yin, B.; Chen, Z.; Chen, L.; Wu, J. Evaluating the Ability of NPP-VIIRS Nighttime Light Data to Estimate the Gross Domestic Product and the Electric Power Consumption of China at Multiple Scales: A Comparison with DMSP-OLS Data. Remote Sens. 2014, 6, 1705–1724. [Google Scholar] [CrossRef] [Green Version]
- Zhu, X.; Ma, M.; Yang, H.; Ge, W. Modeling the Spatiotemporal Dynamics of Gross Domestic Product in China Using Extended Temporal Coverage Nighttime Light Data. Remote Sens. 2017, 9, 626. [Google Scholar] [CrossRef] [Green Version]
- Artmann, M.; Inostroza, L.; Fan, P. Urban sprawl, compact urban development and green cities. How much do we know, how much do we agree? Ecol. Indic. 2019, 96, 3–9. [Google Scholar] [CrossRef]
- Chen, H.; Jia, B.; Lau, S.S.Y. Sustainable urban form for Chinese compact cities: Challenges of a rapid urbanized economy. Habitat Int. 2008, 32, 28–40. [Google Scholar] [CrossRef]
- Li, W.; Xie, S.; Wang, Y.; Huang, J.; Cheng, X. Effects of urban expansion on ecosystem health in Southwest China from a multi-perspective analysis. J. Clean. Prod. 2021, 294, 126341. [Google Scholar] [CrossRef]
- Schumaker, N.H. Using landscape indices to predict habitat connectivity. Ecology 1996, 77, 1210–1225. [Google Scholar] [CrossRef] [Green Version]
- He, S.; Yu, S.; Li, G.; Zhang, J. Exploring the influence of urban form on land-use efficiency from a spatiotemporal heterogeneity perspective: Evidence from 336 Chinese cities. Land Use Policy 2020, 95, 104576. [Google Scholar] [CrossRef]
- Wang, M.; Debbage, N. Urban morphology and traffic congestion: Longitudinal evidence from US cities. Comput. Environ. Urban Syst. 2021, 89, 101676. [Google Scholar] [CrossRef]
- Wang, S.; Wang, J.; Fang, C.; Li, S. Estimating the impacts of urban form on CO2 emission efficiency in the Pearl River Delta, China. Cities 2019, 85, 117–129. [Google Scholar] [CrossRef]
- Sun, T.; Liu, T.; Chu, L.; Li, Z.; Wang, T.; Cai, C. Effects of temporal and spatial variations in source-sink landscape patterns on soil erosion and sediment yield from typical watershed in the Three Gorges Reservoir area, China. Acta Ecol. Sin. 2019, 30, 7476–7492. [Google Scholar]
- Tian, X.; Bai, F.; Jia, J.; Liu, Y.; Shi, F. Realizing low-carbon development in a developing and industrializing region: Impacts of industrial structure change on CO2 emissions in southwest China. J. Env. Manag. 2019, 233, 728–738. [Google Scholar] [CrossRef]
- Liu, Y.; Zhou, Y.; Wu, W. Assessing the impact of population, income and technology on energy consumption and industrial pollutant emissions in China. Appl. Energy 2015, 155, 904–917. [Google Scholar] [CrossRef]
- Zhou, Y.; Liu, Y. Does population have a larger impact on carbon dioxide emissions than income? Evidence from a cross-regional panel analysis in China. Appl. Energy 2016, 180, 800–809. [Google Scholar] [CrossRef]
- Xie, H.; He, Y.; Zou, J.; Wu, Q. Spatio-temporal difference analysis of cultivated land use intensity based on emergy in the Poyang Lake Eco-economic Zone of China. J. Geogr. Sci. 2016, 26, 1412–1430. [Google Scholar] [CrossRef]
- Liu, C.; Shen, Q. An empirical analysis of the influence of urban form on household travel and energy consumption. Comput. Environ. Urban Syst. 2011, 35, 347–357. [Google Scholar] [CrossRef]
- Seto, K.C.; Kaufmann, R.K. Modeling the drivers of urban land use change in the Pearl River Delta, China: Integrating remote sensing with socioeconomic data. Land Econ. 2003, 79, 106–121. [Google Scholar] [CrossRef] [Green Version]
- Du, Y.; Wan, Q.; Liu, H.; Liu, H.; Kapsar, K.; Peng, J. How does urbanization influence PM2.5 concentrations? Perspective of spillover effect of multi-dimensional urbanization impact. J. Clean. Prod. 2019, 220, 974–983. [Google Scholar] [CrossRef]
- Harris, R.D.; Tzavalis, E. Inference for unit roots in dynamic panels where the time dimension is fixed. J. Econom. 1999, 91, 201–226. [Google Scholar] [CrossRef]
- Pedroni, P. Panel cointegration: Asymptotic and finite sample properties of pooled time series tests with an application to the PPP hypothesis. Econom. Theory 2004, 20, 597–625. [Google Scholar] [CrossRef] [Green Version]
- Huang, G.; Ouyang, X.; Yao, X. Dynamics of China’s regional carbon emissions under gradient economic development mode. Ecol. Indic. 2015, 51, 197–204. [Google Scholar] [CrossRef]
- Holden, E.; Norland, I.T. Three challenges for the compact city as a sustainable urban form: Household consumption of energy and transport in eight residential areas in the greater Oslo region. Urban Stud. 2005, 42, 2145–2166. [Google Scholar] [CrossRef]
- Makido, Y.; Dhakal, S.; Yamagata, Y. Relationship between urban form and CO2 emissions: Evidence from fifty Japanese cities. Urban Clim. 2012, 2, 55–67. [Google Scholar] [CrossRef] [Green Version]
- Feng, Y.; Wang, X.; Du, W.; Liu, J.; Li, Y. Spatiotemporal characteristics and driving forces of urban sprawl in China during 2003–2017. J. Clean. Prod. 2019, 241, 118061. [Google Scholar] [CrossRef]
- Guan, D.; He, X.; He, C.; Cheng, L.; Qu, S. Does the urban sprawl matter in Yangtze River Economic Belt, China? An integrated analysis with urban sprawl index and one scenario analysis model. Cities 2020, 99, 102611. [Google Scholar] [CrossRef]
- Liu, Z.; Liu, S.; Qi, W.; Jin, H. Urban sprawl among Chinese cities of different population sizes. Habitat Int. 2018, 79, 89–98. [Google Scholar] [CrossRef]
- Liu, H.; Huang, B.; Zhan, Q.; Gao, S.; Li, R.; Fan, Z. The influence of urban form on surface urban heat island and its planning implications: Evidence from 1288 urban clusters in China. Sustain. Cities Soc. 2021, 71, 102987. [Google Scholar] [CrossRef]
- Huang, Q.; Lu, Y. The Effect of Urban Heat Island on Climate Warming in the Yangtze River Delta Urban Agglomeration in China. Int. J. Environ. Res. Public Health 2015, 12, 8773–8789. [Google Scholar] [CrossRef] [Green Version]
- He, Z.; Jianxun, Z.; Rui, W.; Meng, Y.; Jingyi, P. The Impact Mechanism of the Built Environment of Small Cities on Residents’ Travel and Traffic Carbon Emission. Urban Probl. 2020, 7, 4–10+20. [Google Scholar] [CrossRef]
- Lin, T.; Yu, Y.; Bai, X.; Feng, L.; Wang, J. Greenhouse gas emissions accounting of urban residential consumption: A household survey based approach. PLoS ONE 2013, 8, e55642. [Google Scholar] [CrossRef] [Green Version]
- Li, S.; Zhou, C.; Wang, S.; Hu, J. Dose urban landscape pattern affect CO2 emission efficiency? Empirical evidence from megacities in China. J. Clean. Prod. 2018, 203, 164–178. [Google Scholar] [CrossRef]
- Yeh, A.G.-O.; Li, X. A constrained CA model for the simulation and planning of sustainable urban forms by using GIS. Environ. Plan. B Plan. Des. 2001, 28, 733–753. [Google Scholar] [CrossRef] [Green Version]
- Yuan, Q.; Guo, R.; Leng, H.; Song, S. Research on the Impact of Urban Form of Small and Medium-Sized Cities on Carbon Emission Efficiency in the Yangtze River Delta. J. Hum. Settl. West China 2021, 3, 8–15. [Google Scholar] [CrossRef]
- Vallance, S.; Perkins, H.C.; Moore, K. The results of making a city more compact: Neighbours’ interpretation of urban infill. Environ. Plan. B Plan. Des. 2005, 32, 715–733. [Google Scholar] [CrossRef]
- Xia, C.; Yeh, A.G.-O.; Zhang, A. Analyzing spatial relationships between urban land use intensity and urban vitality at street block level: A case study of five Chinese megacities. Landsc. Urban Plan. 2020, 193, 103669. [Google Scholar] [CrossRef]
- Zhou, S.; Yang, L.; Deng, L. The Spatial-Temporal Pattern of People’s Daily Activities and Transportation Demand Analysis-A Case Study of Guangzhou, China. In Proceedings of the 2010 International Conference on Management and Service Science, Wuhan, China, 24–26 August 2010; pp. 1–4. [Google Scholar]
- Dieleman, F.M.; Dijst, M.; Burghouwt, G. Urban form and travel behavior: Micro-level household attributes and residential context. Urban Stud. 2002, 39, 507–527. [Google Scholar] [CrossRef]
- Wang, D.; Lin, T. Residential self-selection, built environment, and travel behavior in the Chinese context. J. Transp. Land Use 2014, 7, 5–14. [Google Scholar] [CrossRef] [Green Version]
- Yang, W.; Li, T.; Cao, X. Examining the impacts of socio-economic factors, urban form and transportation development on CO2 emissions from transportation in China: A panel data analysis of China’s provinces. Habitat Int. 2015, 49, 212–220. [Google Scholar] [CrossRef]
- Xia, C.; Li, Y.; Xu, T.; Chen, Q.; Ye, Y.; Shi, Z.; Liu, J.; Ding, Q.; Li, X. Analyzing spatial patterns of urban carbon metabolism and its response to change of urban size: A case of the Yangtze River Delta, China. Ecol. Indic. 2019, 104, 615–625. [Google Scholar] [CrossRef]
- Tian, G.; Jiang, J.; Yang, Z.; Zhang, Y. The urban growth, size distribution and spatio-temporal dynamic pattern of the Yangtze River Delta megalopolitan region, China. Ecol. Model. 2011, 222, 865–878. [Google Scholar] [CrossRef]
- Haaland, C.; van den Bosch, C.K. Challenges and strategies for urban green-space planning in cities undergoing densification: A review. Urban For. Urban Green. 2015, 14, 760–771. [Google Scholar] [CrossRef]


| Indicators | Abbreviation | Equation | Description |
|---|---|---|---|
| Patch cohesion index (units: %) | COHESION | Z = total number of cells in the landscape. | |
| Percentage of like adjacencies (units: %) | PLADJ | ||
| Landscape shape index (units: none) | LSI | = total length of edge in landscape between classes i and k. TA = total landscape area (m2). | |
| Mean patch shape index (units: none) | SHAPE_MN |
| Socioeconomic Characteristics | Types | Description | Amount |
|---|---|---|---|
| Industrial structure (IP) (units: %) | Industrial cities | GDP (secondary industry) ≥ 50% | 45 |
| Service cities | GDP (tertiary industry) ≥ 50% | 36 | |
| Industrially balanced cities | Relatively balanced proportions of secondary and tertiary industries | 51 | |
| Population density (POD) (units: person/KM2) | Low population density cities | <500 | 30 |
| Medium population density cities | 500–1500 | 66 | |
| High population density cities | >1500 | 36 | |
| Economic development level (PGDP)*Per capita GDP (units: 10,000 yuan) | Low-development-level cities | <5 | 47 |
| Medium-development-level cities | 5–9 | 49 | |
| High-development-level cities | >9 | 36 |
| Variable | Mean | Std.Dev. | Min | Max | Median |
|---|---|---|---|---|---|
| 2005 | 3.714 | 2.946 | 0.198 | 16.412 | 3.09 |
| 2010 | 4.840 | 3.784 | 0.383 | 20.672 | 4.10 |
| 2015 | 4.951 | 3.846 | 0.422 | 20.731 | 4.19 |
| 2020 | 4.855 | 3.769 | 0.376 | 20.265 | 4.17 |
| Variable | Model 1 | Model 2 | Model 3 | Model 4 |
|---|---|---|---|---|
| per-capita CO2 emissions (PCO2) | −8.180 *** | −8.180 *** | −8.180 *** | −8.180 *** |
| COHESION | −3.480 *** | −3.480 *** | −3.480 *** | −3.480 *** |
| PLADJ | −12.057 *** | −12.057 *** | −12.057 *** | −12.057 *** |
| SHAPE_MN | −10.661 *** | −10.661 *** | −10.661 *** | −10.661 *** |
| LSI | −8.399 *** | −8.399 *** | −8.399 *** | −8.399 *** |
| IP | −11.636 *** | |||
| POD | −3.846 *** | |||
| PGDP | −0.667 * | |||
| COHESION × IP | −11.639 *** | |||
| PLADJ × IP | −11.642 *** | |||
| SHAPE_MN × IP | −10.979 *** | |||
| LSI × IP | −12.001 *** | |||
| COHESION × POD | −3.778 *** | |||
| PLADJ × POD | −3.852 *** | |||
| SHAPE_MN × POD | −9.539 *** | |||
| LSI × POD | −3.924 *** | |||
| COHESION × PGDP | −0.750 * | |||
| PLADJ × PGDP | −0.654 * | |||
| SHAPE_MN × PGDP | −8.331 *** | |||
| LSI × PGDP | −3.370 *** |
| Model | F-Test |
|---|---|
| Model 1 | F (38.955) > F0.05 (1.253) |
| Model 2 | F (34.806) > F0.05 (1.254) |
| Model 3 | F (32.883) > F0.05 (1.254) |
| Model 4 | F (33.467) > F0.05 (1.254) |
| Model | Chi-Sq Statistic | Prob. |
|---|---|---|
| Model 1 | 29.86 | 0.000 |
| Model 2 | 44.00 | 0.000 |
| Model 3 | 11.99 | 0.062 |
| Model 4 | 30.83 | 0.000 |
| Independent Variable | Dependent Variable: Per-Capita CO2 Emissions (PCO2) | |||
|---|---|---|---|---|
| Model 1 | Model 2 | Model 3 | Model 4 | |
| COHESION | −7.041 ** | −7.056 *** | −17.068 *** | −12.270 *** |
| PLADJ | −9.365 * | −11.623 * | −26.261 *** | −23.428 *** |
| SHAPE_MN | 1.253 *** | −0.254 | 1.041 *** | −0.517 |
| LSI | 1.628 *** | 0.615 | 0.776 * | 0.108 |
| IP | - | 32.019 ** | - | - |
| POD | - | - | 15.778 * | - |
| PGDP | - | - | - | 21.040 *** |
| COHESION × IP | - | −3.091 *** | - | - |
| PLADJ × IP | - | −3.081 *** | - | - |
| SHAPE_MN × IP | - | 0.023 | - | - |
| LSI × IP | - | 0.013 | - | - |
| COHESION × POD | - | - | 2.533 *** | - |
| PLADJ × POD | - | - | 2.364 *** | - |
| SHAPE_MN × POD | - | - | 0.201 ** | - |
| LSI × POD | - | - | 0.175 *** | - |
| COHESION × PGDP | - | - | - | 1.050 ** |
| PLADJ × PGDP | - | - | - | 1.061 *** |
| SHAPE_MN × PGDP | - | - | - | 0.045 |
| LSI × PGDP | - | - | - | 0.007 |
| Constant | 10.739 | 21.054 | −20.172 | −177.913 ** |
| N | 528 | 528 | 528 | 528 |
| R2 | 0.554 | 0.593 | 0.615 | 0.707 |
| Independent Variable | Dependent Variable: Per-Capita CO2 Emissions (PCO2) | ||
|---|---|---|---|
| Industrial Cities | Industrially Balanced Cities | Service Cities | |
| lnCOHESION | 4.799 | −5.974 *** | −5.981 *** |
| lnPLADJ | −23.371 | −45.897 * | −47.314 *** |
| Constant | 86.748 | 194.024 | 90.501 ** |
| N | 176 | 175 | 177 |
| R2 | 0.303 | 0.513 | 0.329 |
| Independent Variable | Dependent Variable: Per-Capita CO2 Emissions (PCO2) | ||
|---|---|---|---|
| Low Population Density | Medium Population Density | High Population Density | |
| lnCOHESION | −32.587 | −3.693 | −6.512 |
| lnPLADJ | −3.999 *** | −6.403 *** | −12.367 *** |
| lnSHAPE_MN | 0.040 *** | 0.352 *** | 0.596 *** |
| lnLSI | 0.732 | −0.726 | 0.235 * |
| Constant | 130.524 | −12.587 | −23.853 |
| N | 176 | 176 | 176 |
| R2 | 0.610 | 0.670 | 0.680 |
| Independent Variable | Dependent Variable: Per-Capita CO2 Emissions (PCO2) | ||
|---|---|---|---|
| Low Development Level | Medium Development Level | High Development Level | |
| lnCOHESION | −1.615 | −0.036 | −7.209 ** |
| lnPLADJ | 19.947 | −17.205 ** | −65.032 ** |
| Constant | −81.948 | 80.418 ** | 266.783 |
| N | 179 | 173 | 176 |
| R2 | 0.617 | 0.691 | 0.649 |
Publisher’s Note: MDPI stays neutral with regard to jurisdictional claims in published maps and institutional affiliations. |
© 2022 by the authors. Licensee MDPI, Basel, Switzerland. This article is an open access article distributed under the terms and conditions of the Creative Commons Attribution (CC BY) license (https://creativecommons.org/licenses/by/4.0/).
Share and Cite
Guo, R.; Leng, H.; Yuan, Q.; Song, S. Impact of Urban Form on CO2 Emissions under Different Socioeconomic Factors: Evidence from 132 Small and Medium-Sized Cities in China. Land 2022, 11, 713. https://doi.org/10.3390/land11050713
Guo R, Leng H, Yuan Q, Song S. Impact of Urban Form on CO2 Emissions under Different Socioeconomic Factors: Evidence from 132 Small and Medium-Sized Cities in China. Land. 2022; 11(5):713. https://doi.org/10.3390/land11050713
Chicago/Turabian StyleGuo, Ran, Hong Leng, Qing Yuan, and Shiyi Song. 2022. "Impact of Urban Form on CO2 Emissions under Different Socioeconomic Factors: Evidence from 132 Small and Medium-Sized Cities in China" Land 11, no. 5: 713. https://doi.org/10.3390/land11050713
APA StyleGuo, R., Leng, H., Yuan, Q., & Song, S. (2022). Impact of Urban Form on CO2 Emissions under Different Socioeconomic Factors: Evidence from 132 Small and Medium-Sized Cities in China. Land, 11(5), 713. https://doi.org/10.3390/land11050713