Article

Identification of Priority Areas for Improving Urban Ecological Carrying Capacity: Based on Supply–Demand Matching of Ecosystem Services

1
CMA Public Meteorological Service Centre, Beijing 100081, China
2
CMA Wind and Solar Energy Centre, Beijing 100081, China
3
State Key Joint Laboratory of Environment Simulation and Pollution Control, School of Environment, Beijing Normal University, Beijing 100875, China
4
Development Research Center of Surveying and Mapping, Ministry of Natural Resources of the People’s Republic of China, Beijing 100830, China
5
Beijing Engineering Research Center for Watershed Environmental Restoration & Integrated Ecological Regulation, Beijing 100875, China
6
Key Laboratory for City Cluster Environmental Safety and Green Development of the Ministry of Education, Institute of Environmental and Ecological Engineering, Guangdong University of Technology, Guangzhou 510006, China
7
Department of Economics and Management, University of Florence Via delle Pandette 9, 50121 Florence, Italy
*
Author to whom correspondence should be addressed.
Land 2022, 11(5), 698; https://doi.org/10.3390/land11050698
Submission received: 22 March 2022 / Revised: 29 April 2022 / Accepted: 1 May 2022 / Published: 7 May 2022

Abstract

:
As the most concentrated area of human activities, cities consume many natural resources and discharge a large amount of waste into the natural environment, which has a huge environmental impact. Most of the ecological and environmental problems, such as environmental pollution, global climate change, and loss of biodiversity, are related to urban systems. How to coordinate urban development with the urban ecological carrying capacity is related to the destiny of the city itself, and also to whether its surrounding areas can successfully achieve the goal of high environmental quality and sustainable development. At present, the theory and methods of urban ecological carrying capacity research are relatively new, which has caused problems for policy makers in practical applications. This paper proposes a theoretical framework for urban ecological carrying capacity assessment based on the analysis of ecosystem services supply and demand. Combined with multi-source spatial data and spatial model methods, the supply and demand of ecosystem services were spatially quantified. The capital city of China, Beijing, was the case study area for this research. The spatial differentiation of the supply–demand relationship of ecosystem services is formed. The priority areas for ecological carrying capacity improvement at pixel scale and at the administrative level are obtained, respectively. The results show that the first priority area is concentrated in the center of the urban area, accounting for 31.11% of the total area of Beijing. According to the secondary zone and the specific ecosystem service type, the ecological carrying capacity improvement strategy of different zones is proposed. This study provides a new perspective for investigating urban ecological carrying capacity and for identifying the priority areas for ecological carrying capacity improvement, and helps the policy-makers to design tailored policy actions.

1. Introduction

1.1. Taking Ecosystem Services as the End of Evaluation Is the Core Idea of Urban Ecological Carrying Capacity Evaluation

Global population growth and rapid social and economic development have made urbanization an inevitable trend in human society. As the most concentrated area of human activities, cities consume a large amount of natural resources and discharge a lot of waste into the environment, with great impact in terms of sustainability. Various negative effects have emerged during the rapid urbanization process, such as traffic congestion, housing shortage, energy shortage, water shortage, air pollution, inadequate public services and urban unemployment, along with resources, environment, ecological and social problems. The carrying capacity of cities are unable to support the scale of urban growth, posing great challenges to the sustainability of urban development [1]. Enhancing the urban carrying capacity for maintaining population quality of life, allowing sustainable urban development, and for meeting the growing demand of urban areas, has been a research hotspot at national and international level [2].
The concept of carrying capacity was introduced into the field of ecology in the 1920s. In order to meet the needs of the largest livestock capacity management and wildlife population protection, in the western United States, ranchers and researchers began to use the term “carrying capacity”. The term indicates the maximum number of livestock that a pasture can support in a certain area at a given time without compromising the productivity of the pastures for the future [3,4].
Since the 1930s, with the development of agricultural technology and the invention of antibiotics and vaccines, human society has broken away from the population model that had been largely coordinated with food supply. Explosive population growth has caused increasingly prominent problems, such as environmental pollution and resource shortages. People have gradually realized that the land available for food production, the resources available for extraction, and the ability to dilute and absorb pollution are limited and cannot support the limitless growth of human society. The concern of scientists was reflected in the publication of the Club of Rome, “The Limits to Growth” [5,6], and research related to carrying capacity began to shift from biological populations to the pressing resource and environmental problems facing human society [6,7]. Research has focused on exploring different aspects of carrying capacity, such as population, environmental and resource availability, etc. [8,9,10].
However, as one of the research strands of carrying capacity studies, there is not a unique definition of ecological carrying capacity (ECC) among scholars. In the Chinese context in particular, there has been a more and more extended meaning of “ecology” or “ecological”, and there is confusion around the definition of ECC. Most scholars assess that ECC is the carrying and supporting capacity of resources and environmental subsystems needed for social and economic activities within a certain period of time [11]. Some others believe that it should be the combination of resource carrying capacity for social and economic development and for ecological and environmental functions [12]. The unclear definitions may cause semantic confusion in these studies, and difficulty in defining unified standards and indicators of ecological, resource, and environmental carrying capacity, which prevents a simple, easy and problem-oriented approach when formulating policies and actions for sustainable resource use.
The confusion may come from the introduction of the ecological footprint theory. Rees and Wackernagel [13] first put forward the ecological footprint theory. From the perspective of Earth’s natural resource carrying capacity, it is believed that the carrying capacity is the sum of all the different kinds of ecologically productive land space that can supply the daily production and living of the interior population. This is the symbol of the shift from a single-element research objective to a comprehensive research approach in ecosystem carrying capacity studies. However, when Rees [14] first proposed the ecological footprint theory, he did not use the term “ecological carrying capacity”. Instead, he used “carrying capacity”, emphasizing the focus on the occupation and consumption of natural capital by humans. Later, in the Living Planet Report [15,16], published every two years by World Wildlife Fund (WWF), which mainly applied the ecological footprint approach, the term “biological capacity” or “biocapacity” was used to represent the production and regeneration capacity of the ecosystems, and the corresponding “ecological footprint” represented human consumption of natural capital. In the “China Ecological Footprint Report 2012” [17] jointly released by China, the corresponding carrying capacity was termed as “biocapacity”. The comparation of “biocapacity” and “ecological footprint” was used to draw a conclusion of ecological deficit or surplus. However, due to the existence of “ecology” in the term of “ecological footprint”, the corresponding carrying capacity was translated into “ecological carrying capacity” by many scholars in China when it was first introduced to China. It then became a method that later generations of researchers had to mention when studying ecological carrying capacity.
In the past few years, Chinese scientists have carried out a series of studies on “ecological carrying capacity” with different focuses and different methods. From the perspective of the succession of natural ecosystems, Wang et al. [18] believed that ECC is an objective reflection of the adjustment ability of the natural system, and it is the limit of the maintenance and adjustment ability of the ecosystem. Beyond this limit, the natural system will lose its resilience and be destroyed, degrading from a highly complex natural system (such as an oasis) to a lower-level very simplified natural system (such as a desert). From the perspective of sustainable development, Gao [8] believes that the most basic and most important condition for system and regional sustainable development is to keep human activities within the ecological carrying capacity boundaries. He defined ECC as the self-sustaining and self-regulating ability of the ecosystem, the supply capacity of resources and environmental subsystems, the intensity of social and economic activities and the number of people with a certain standard of living that it can sustain. It is arguably the most widely accepted definition. From then on, many studies have followed this definition or adjusted and supplemented it on this basis, such as Jin et al. [19], focusing on the urban ecosystem, who recognized that ECC is an important criterion for measuring the sustainable development capacity of a certain area. He divided the urban ecosystem into four sub-systems of resources, environment, society, and economy, and considered that ECC includes three levels: the self-sustaining and self-regulating ability of the ecosystem, the supply capacity of the environmental and resource subsystems in the ecosystem, and the pressure on the environment and resource subsystems caused by human activities and social economic production activities; Yang and Sui [20] proposed the concept of ECC based on ecosystem health, which refers to the potential capacity of natural ecosystems to maintain their service functions and their own health under certain social and economic conditions. Shen et al. [21] focused on the structure and function of the ecosystem, and defined the ECC as the ability of the ecosystem to withstand external disturbances, especially human activities, on the premise that the structure and function of the ecosystem are not damaged.
In recent years, some scholars have argued that the theory of ecosystem services (ES) provides new ideas for ECC research. Ecosystem services are the benefits that people obtain directly or indirectly from the ecosystem [22], and are the bridge between human society and nature. The advantages of applying ecosystem services theory to ECC study include: (1) ecosystem services have the characteristic of being “systemic”—ecosystem services are the characteristics of ecosystems, which are manifested through the interaction of multiple ecosystem structures and processes. However, the use of one or several physical, chemical, and biological indicators, (such as the environmental quality status or natural biodiversity conservation), makes it difficult to detect the changes in the structure and function of the ecosystem. (2) Ecosystem services refer to the benefits that humans get from ecosystems, which have an important impact on human well-being, and humans usually intuitively perceive their changes [23]. Using ecosystem services to characterize ecological carrying capacity is the current trend in ecological carrying capacity research. Based on the theory of ecosystem services, Cao et al. [24] proposed that ECC is the population and economic scale with a certain level of development that can be supported by ecosystem services determined by the structure, process and spatial pattern of a regional ecosystem; Xu et al. [25] emphasized that ECC refers to the ability of ecosystems to provide services and functions, prevent ecological problems, and ensure regional ecological security. Cao et al. [24], Jiao et al. [26] and Wang et al. [27] have made attempts to evaluate ECC by using ecosystem services from different perspectives or combining different methods.
Compared with resource carrying capacity, environmental carrying capacity and regional carrying capacity, ecological carrying capacity should be more stressed on the carrying capacity of the ecosystem. An ecosystem is a unified whole system formed by the continuous circulation of material and energy flow processes between all living things (i.e., biocenose) that live together in a certain space and environment [28]. The supply of ecosystem services depends on its structure, process and function. Its existence is objective and cannot be transferred by human will. It is a measure of the potential ability of the ecosystem to provide products and services under the current natural environmental conditions [29,30].
Therefore, the ecosystem services theory contributes to the construction of an independent concept of “ecological carrying capacity”, which has the characteristics of linking natural systems and human social systems. It leads to a more practical method to study ECC in urban areas where the interactions between human and nature are more intense.

1.2. Existing Studies on the Supply and Demand of Ecosystem Services Have Laid the Foundation for Identifying Areas with Improved ECC

We approve of the definition of ecological carrying capacity as the ecosystem services supply capacity of the ecosystem. In the context of the urban ecosystem, it needs to be stressed that humans and human activities are the carrying targets of the urban ecosystem. The relationship between the supply and demand of ecosystem services reflects the carrying state of the urban ecosystem, which is the basis of identifying the spots and the urgency to improve ECC. The supply is characterized by the ecosystem services that the ecosystem can provide, and the demand can be indicated by the demand for ecosystem services by humans. If the supply of ecosystem services is small where the demands for those services by humans are also small, the carrying state of the urban ecosystem may be within a relatively reasonable range. On the contrary, if the supply of ecosystem services is large where the demands of these services are also high, the carrying state of the urban ecosystem may be poor. Therefore, when studying urban ECC, the carrying states can be judged more scientifically by combining the supply and demand of ecosystem services. The demand for ecosystem services is affected by multiple factors such as the level of social and economic development, education and culture, policies and regulations, reflecting human needs and preferences for different types of ecosystem services [31]. Exploring the temporal and spatial changes and matching characteristics of the supply and demand of different ecosystem services typology is a prerequisite for promoting ecosystem services conservation, enhancing scientific research to provide support for strengthening ecosystem management and for formulating efficient ECC improvement plans [32]. However, at the practical level, existing ECC research has mainly focused on quantitative measurement in the research area, while less attention has been paid to how and where to apply the research results to enhance the ECC in more detail. Studying and mapping the supply and demand of urban ecosystem services can clearly reflect the carrying capacity of the ecosystem and the magnitude of human disturbance, and provide the basis for making practical, integrated decisions that simultaneously meet the different ecological, social, and economic needs of urban communities and socio-ecological systems. It can not only provide a priority map for decision-making but also helps planners to find and analyze the distribution of ecological services around the city in order to better achieve environmental justice, and it is of great significance in promoting the sustainable development of societies [33,34].
Our research objective is to analyze urban ecological carrying capacity by the matching of the supply and demand of ecosystem services in a case study of the Beijing area. This approach allows us to assess the imbalance between ecosystem service supply and demand in the different urban areas, addressing the priority improvement urban areas in terms of urban ECC, offering a new research perspective for the study of urban ecological carrying capacity.

2. Methods

2.1. Framework for Improving ECC Based on the Supply and Demand of Ecosystem Services

To assess the matching of supply and demand of ecosystem services, in order to zone the priority improvement areas of urban ECC, the research followed five main steps. The first step is the selection of the key ecosystem services based on the city’s characteristics. The second step deals with the selection of appropriate methods for the evaluation and mapping of the supply and demand of ecosystem services. The third focuses on the selection of the appropriate methods for matching the ecosystems services supply and demand. The fourth step consists of identifying the areas needing improvements in ECC on the basis of the matching results of supply and demand. In the fifth step, ECC efficient management and policy actions are addressed.
Ecosystem services include supply services (e.g., raw material, fiber and fuel, etc.), regulation services (e.g., carbon storage and climate regulation), supportive services (e.g., nutrient cycling and erosion control), and entertainment and cultural services (e.g., aesthetic value and historical recognition) [22,35]. For the evaluation of ecological carrying capacity by the matching of ecosystem supply and demand in urban areas, it is necessary to consider the main ecological problems faced by cities, the ecosystem services that have prominent contradictions between supply and demand, and data availability, to select the key ecosystem services. In this study, we chose urban flood regulation, soil conservation, temperature and humidity regulation, pollutant purification, and carbon sequestration, according to Beijing’s geographical location, climate characteristics, ecological conditions, population status and future development plans. The demands in terms of food, water, and energy are far greater than the available supply by the local ecosystem and, given that it is impossible to achieve self-sufficiency locally, most of these demands are solved by external inputs. This belongs to the research category of resource carrying capacity. Therefore, these supply services are not considered in this study. Cultural services provide humans with abstract benefits, such as entertainment, science, and aesthetics, and are often affected by multiple factors, such as people’s preferences, economic conditions, and education levels, which are difficult to quantify, and so are not considered in this study either.
ES supply can be assessed using biophysical models, participatory questionnaires, expert knowledge, monetary valuation, ecological footprint methods, or other techniques [36]. This research uses the Urban InVEST model developed by the US Natural Capital Project Group, which is based on a biophysical model, and is suitable for urban scale and ecological issues that meet urban concerns. InVEST models are jointly developed by Stanford University, The Nature Conservancy (TNC) and the World Wildlife Fund (WWF), aiming to help decision makers weigh human trade-offs by simulating changes in the quantity and value of ecosystem services under different land cover scenarios. These models can provide spatially-explicit assessment results, using maps as information sources and producing maps as outputs with flexible spatial resolutions. They have been updated by many versions since their release. Urban InVEST is a set of newly developed models, which has been released since early 2020. It especially suits multiple urban ecosystem services, and aims to help the decision makers integrate urban ecosystem services in city design and spatial planning (https://naturalcapitalproject.stanford.edu/software/urban-invest, accessed on 21 March 2022).
ES demand evaluation mainly includes risk evaluation, human preference, direct use, consumption, and other methods. Indicators may include social standards (e.g., poverty line, water quality standards, average food or water consumption), and empirical knowledge (e.g., tolerance of soil loss), along with others [37]. Among them, risk assessment is mainly used in those services for which scarcity may cause disasters, economic losses and health threats to people. Preferences, values and direct use methods are mainly used for cultural services, while water, energy and other supply services are mainly based on consumption assessments [36]. Each selected key ecosystem service supply and demand at a local level are quantified as follows.
The technical route is shown as Figure 1.

2.2. Methods of ES Supply Quantification

2.2.1. Flood Mitigation Service Supply Quantification

The capacity of the city’s flood control and mitigation plays an important role in reducing urban waterlogging [38,39]. The latest version of the InVEST model added the Urban Flood Risk Mitigation model and the Urban Cooling Model, which are more suitable for finer assessment of urban ecosystem services on a smaller scale, and relevant to the ecological problems of the city’s concern. This paper uses the Urban Flood Risk Mitigation, as shown in Equations (1)–(4).
Q p , i = { ( P s 0.2 S m a x , i ) 2 P s + 0.8 S m a x , i ,   i f   P s > 0.2 S m a x , i 0                 ,   otherwise
S m a x , i = 25 , 400 C N i 254
R f m i = 1 Q p , i P s
R f m i ( m 3 ) = R f m i × P s = P s Q p , i
The curve number method was used in the model to calculate the flood runoff (Qp,i), in the function of the land use and soil characteristic of each pixel. The runoff retention volume R f m i ( m 3 ) (P − Qp,i) and runoff retention index R f m i (1 − Qp,i/P) represent the capacity of flood risk mitigation. With reference to the previous literature [39], this paper uses runoff retention volume as the supply of flood mitigation services. Specifically, the input parameter P s adopts the definition of a rain storm in China’s meteorological standards, which is 50 mm rain within 24 h. (http://www.cma.gov.cn/2011xzt/kpbd/rainstorm/2018050901/201805/t20180509_468007.html, accessed on 9 February 2021). CN values that correspond closely to land cover type and soil characteristics are obtained from the NRCA-USDA guidelines. S m a x , i is the potential water retention of the soil.

2.2.2. Soil Retention Service Supply

Generally, soil retention as a service is quantified by using the difference between potential soil loss and actual soil loss. Potential soil loss is the amount of soil loss that is simulated without land cover and human activities. The actual amount of soil loss is the amount of soil loss with the actual land cover and under human management activities, which can be calculated using the universal or revised soil loss equation (USLE/RUSLE). In this section, the InVEST Sediment Retention model, which is based on RUSLE, is used to calculate soil retention services. This model takes into account the ability of the block itself to intercept upstream sediments, so that the calculation results are more accurate [40]. The equations are shown in Equations (5)–(12). This paper uses sediment retention output to evaluate the supply of soil retention services.
S e d i m e n t   R e t e n t i o n = R i × K i × L S i × S D R i b a r e   s o i l R i × K i × L S i × C i × P i × S D R i
where R i is the rainfall erosivity of pixel i, K i is the soil erodibility of pixel i, L S i is a slope length gradient factor of pixel i, C i is a crop-management factor of pixel i, which is closely related to vegetation coverage, P i is a support practice factor of pixel i,, S D R i b a r e   s o i l is the sediment delivery ratio of bare soil and S D R i is the actual sediment delivery ratio of pixel i.
In this equation, the monthly rainfall erosivity function that is suitable for Beijing was used to calculate R [41].
R m = 0.689 × P m 1.474
R = k = 1 12 R m k
where P m is monthly precipitation and R m is monthly rainfall erosivity.
Soil erodibility K is an index representing the sensitivity to erosion of soil, which is calculated by the following equations [42]:
K = f c s a n d × f c l s i × f o r g c × f h i s a n d
f c s a n d = 0.2 + 0.3 e x p [ 0.0256 m s ( 1 m s i l t / 100 )   ]
f c l s i = [ m s i l t m c + m s i l t ] 0.3
f o r g c = 1 0.25 o r g C / [ o r g C + e x p ( 3.72 2.95 o r g C ) ]
f h i s a n d = 1 0.7 ( 1 m s / 100 )   / { ( 1 m s / 100 ) + e x p [ 5.51 + 22.9 ( 1 m s / 100 )   ] }
where m s , m s i l t , m c and o r g C represent sand (%), silt (%), clay (%), and organic matter (%) of the soil, respectively.
LS factor and S D R i are automatically calculated based on DEM data in the model. C and P are referenced from the relevant literature of the Beijing–Tianjin–Hebei area [43].

2.2.3. Temperature and Humidity Regulation Service Supply

The InVEST Urban Cooling model is used to evaluate temperature and humidity regulation service supply. This model calculates an index of heat mitigation based on shade, evapotranspiration, and albedo, as well as distance from cooling islands (e.g., parks). The equations are as follows:
H M i = 0.6 × s h a d e + 0.2 × a l b e d o + 0.2 × E T I
E T I = K c × E T 0 E T m a x
where H M i is heat mitigation capacity which implies the temperature and humidity regulation service, s h a d e represents the proportion of tree canopy (≥2 m in height) associated with each land use/land cover (LULC) category, E T I represents a normalized value of potential evapotranspiration, K c is crop coefficient associated with the pixel’s LULC type, E T 0 is reference evapotranspiration, and E T m a x is the maximum value of the E T 0 in the area of interest.

2.2.4. Air Purification Service Supply

The ecosystem has the capacity to purify air pollutants. The absorption and sedimentation of pollutants by vegetation is closely related to Leaf Area Index (LAI) [44]. LAI can be simulated based on NDVI data (Equations (15) and (16)).
For forest,
L A I i = 9.7471 × N D V I i + 0.3718
For grassland, cropland and other land use types,
L A I i = 3.227 × N D V I i / N D V I a v g
where N D V I i is NDVI of i pixel, N D V I a v g is the average NDVI of other land use types except forest in the research area.

2.2.5. Carbon Sequestration Service Supply

Net ecosystem productivity (NEP) can be used to estimate the carbon sequestration capacity of the ecosystem [45]. NEP is calculated from net primary productivity (NPP) minus heterotrophic respiration (soil respiration), or according to the conversion coefficient of NPP and NEP, where the equation is:
N E P = α × N P P ( R , E )
MODIS17A3HGF006 NPP [46] data were used, and for wetlands and urban area, where MODIS data were rare, data from the literature were used to supplement it [47,48]. α was referenced from the literature [49].

2.3. Methods of ES Demand Quantification

Risk assessment is used for services where a lack may cause disasters, economic losses and health threats to people, e.g., flood mitigation services can reduce hydrogeological disaster, soil retention services can slow down soil erosion, temperature and humidity regulation can reduce the impacts of high temperature and heat waves in the city, and air purification services can decrease air pollution. While carbon sequestration services are related to the human need to reduce carbon emissions, which is a long-term goal of human society and difficult to quantify in terms of specific disasters, it is generally evaluated by the consumption method (carbon emitted) [50,51,52,53].
The HEV risk assessment framework is one of the most comprehensive and widely used risk assessment methods, proposed by the Intergovernmental Panel on Climate Change (IPCC). The framework is expressed as Equation (18),
R = H × E × V
where H represents the hazard (or coerciveness), E represents exposure, and V represents vulnerability (including vulnerability and coping capacity/resilience) [53,54,55]. A hazard mainly refers to the severity and impact of disaster events that may cause loss or destruction of life, health, property, infrastructure, or ecosystem. Exposure refers to the affected people, ecological resources, infrastructure, assets, or economic activities, etc., which is the bridge connecting hazard and vulnerability. Vulnerability refers to the tendency to be affected, including the sensitivity to damages and the ability to respond and adapt to damages, e.g., gender, age, class structure, economic development level, medical and health services, etc. [54].
H, E or V may be quantified by one or more indexes. The indexes are normalized in order to eliminate the influence of dimension and magnitude of each index (Equation (19)).
{ X i = X i m i n { X } m a x { X } m i n { X } ,   positive   index X i = m a x { X } X i m a x { X } m i n { X } ,   negetive   index
where X i is the original value of the index, and X i is the normalized value.
For those characterized by multiple indexes, the corresponding H, E or V is calculated using the equal-weight weighting method after normalization.

2.3.1. Flood Mitigation Service Demand

The risk of urban populations and assets encountering floods is used to assess the demand of flood mitigation service.
The hazard of urban floods mainly involves factors including flow velocity, flow quantity, submerge area, depth and time, etc. [53]. According to the availability of data, this study considers two indicators, the runoff caused by storms and the depth of sinks, to evaluate the hazard of floods. One of the outputs of the InVEST Urban Flood Risk Mitigation model, Q_mm, refers to the flood runoff, while the depth of sinks can be simulated by the hydrologic analysis tools in ArcGIS [56].
The exposure to urban flood includes urban assets, road density and population density, where urban assets are expressed by housing price [54,55].
The vulnerability is expressed by the population ratio of the elderly and children, which represents sensitivity, and GDP per capita and number of hospital beds per thousand people, which represent coping capacity.

2.3.2. Soil Retention Service Demand

The demand on the soil retention service is assessed by the risk of soil erosion. The main risks of soil erosion are the decline of soil fertility and productivity, the destruction of the ecosystem, etc., which affects local agricultural production and farmers’ income [57]. The hazard of soil erosion is expressed by actual soil loss, which is one of the outputs of the InVEST SDR model. The exposure is expressed by the combination of population density, the proportion of employees in the primary sector and the output value per unit area of agriculture [58].
The vulnerability is expressed by the combination of the proportion of rural poor population, the proportion of soil erosion exposure area and per capita GDP, where the proportion of rural poor population represents risk sensitivity, and the proportion of soil erosion treatment area and per capita GDP represent resilience capacity.

2.3.3. Temperature and Humidity Regulation Service Demand

Temperature and humidity regulation service demand is assessed by the risk of urban heat islands. Urban high-temperature and heat-wave disasters threaten human health.
The hazard of urban heat is expressed by the surface temperature in summer. The exposure is expressed by population density, and the vulnerability is expressed by the population ratio of the elderly and children, GDP per capita and number of hospital beds per thousand people [54,55,59].

2.3.4. Air Purification Service Demand

Air purification service demand is assessed using air pollution health risks. The hazard is indicated by air pollutant density. The exposure is expressed by population density, and the vulnerability is expressed by the population ratio of the elderly and children, GDP per capita and number of hospital beds per thousand people [54,55,59].

2.3.5. Carbon Sequestration Service Demand

Carbon sequestration service demand is evaluated by the consumption method (carbon emitted) [50,51,52,53]. The carbon emissions by humans can be spatialized by nighttime lights data [60] and gridded population density data [61]. This study refers to the combination of Suomi-NPP VIIRS nighttime lights data and population distribution data to simulate the spatial characteristics of carbon emissions and indicate the demand for carbon sequestration services [62,63]. Suomi-NPP is an earth-observing satellite launched by NASA and NOAA at the end of 2011. It is equipped with five earth observation sensors, include the Visible Infrared Imaging Radiometer Suite (VIIRS), whose Day/Night Band (DNB) allows nighttime light observations [64].
The nighttime lights data are used for spatialization in light areas, while in the areas without lights, the population distribution data are substituted. It is considered that the carbon emission per capita in the dark area is half of that in the light area. The equation is as (20)–(22).
C L = S P L × a
C D = S P D × a 2
T C = C L + C D
So we can derive that:
a = T C S P L + S P D / 2
where T C is the total carbon emissions in the study area, C L is the total carbon emissions in all light areas in the study area, S P L is the total population in the light areas, C D is the total carbon emissions in all dark areas in the study area, S P D is the total population in the dark area, a is the carbon emission per capita in the light area, and a 2 is the carbon emission per capita in the dark area.
According to the above equations, the carbon emission of each grid in the light area C L j and in the dark area C D j can be obtained, as Equations (24) and (25) show. The carbon emissions distribution is calculated by ArcGIS tools.
C L j = L j T L j × S P L × a
C D j = P D j S P D × S P D × a 2 = P D j × a 2

2.4. ECC Improve Priority Area Identification Method Based on Ecosystem Services Supply and Demand

The (mis)matches of ecosystem services supply and demand can be used to classify the states of the urban carrying capacity. In the assessment of the supply/demand of ecosystem services, the Z-Score normalization method (Equations (26)–(28)) is applied to study the spatial differentiation and imbalance of ES supply and demand [37], which can eliminate the influence of dimension, observe the changes in ecosystem services more clearly, and intuitively compare the supply and demand matching [65].
x = x i x ¯ s
x ¯ = 1 n i = 1 n x i
s = 1 n i = 1 n ( x i x ¯ )   2
where x is the normalized supply/demand of ecosystem services, x i is the supply/demand of ecosystem services of the i-th grid, and x ¯ and s are the average value and the standard deviation of the supply/demand of ecosystem services of the study area.
When the normalization result of the ES supply is greater than 0, and the result of the ES demand is less than 0 at the same time, it indicates high supply and low demand (H–L); an ES supply and demand both greater than 0 indicates high supply and high demand (H–H); an ES supply and demand both less than 0 indicates low supply and low demand (L–L); an ES supply less than 0, and an ES demand greater than 0, indicates low supply and high demand (L–H) [66]. L–H indicates that the relationship between human and land is relatively tense, the supply of the ES cannot meet the demand of residents in the limited space, and the ecosystem is in a weak carrying state, which is defined as the first priority when considering the improvement needed in urban ECC. L–L indicates that the ecology system service is relatively low, but the ES demand is not that intense, and the ecosystem is in a relatively weak carrying state, which is the second priority for ECC improvement. H–H indicates that ecological protection and economic activities are in coordinated development, and the ecosystem shows a relatively strong carrying capacity, which is the third priority for ECC improvement; H–L indicates that the ecosystem services are relatively sufficient, and the ecosystem is in a strong carrying capacity, which is in the last priority of ECC improvement.
Zoning of the states of ECC provides the basis for managing ecosystem services and enhancing ECC strategies. Since the various management tasks to improve ECC must be carried out by various departments and governments at different levels, in addition to identifying the priority areas at pixel-level, administrative boundaries should also be considered. This study used the zoning statistics method to match the relationship between ES supply and demand, and then formed the ECC improvement zones related to administrative units.

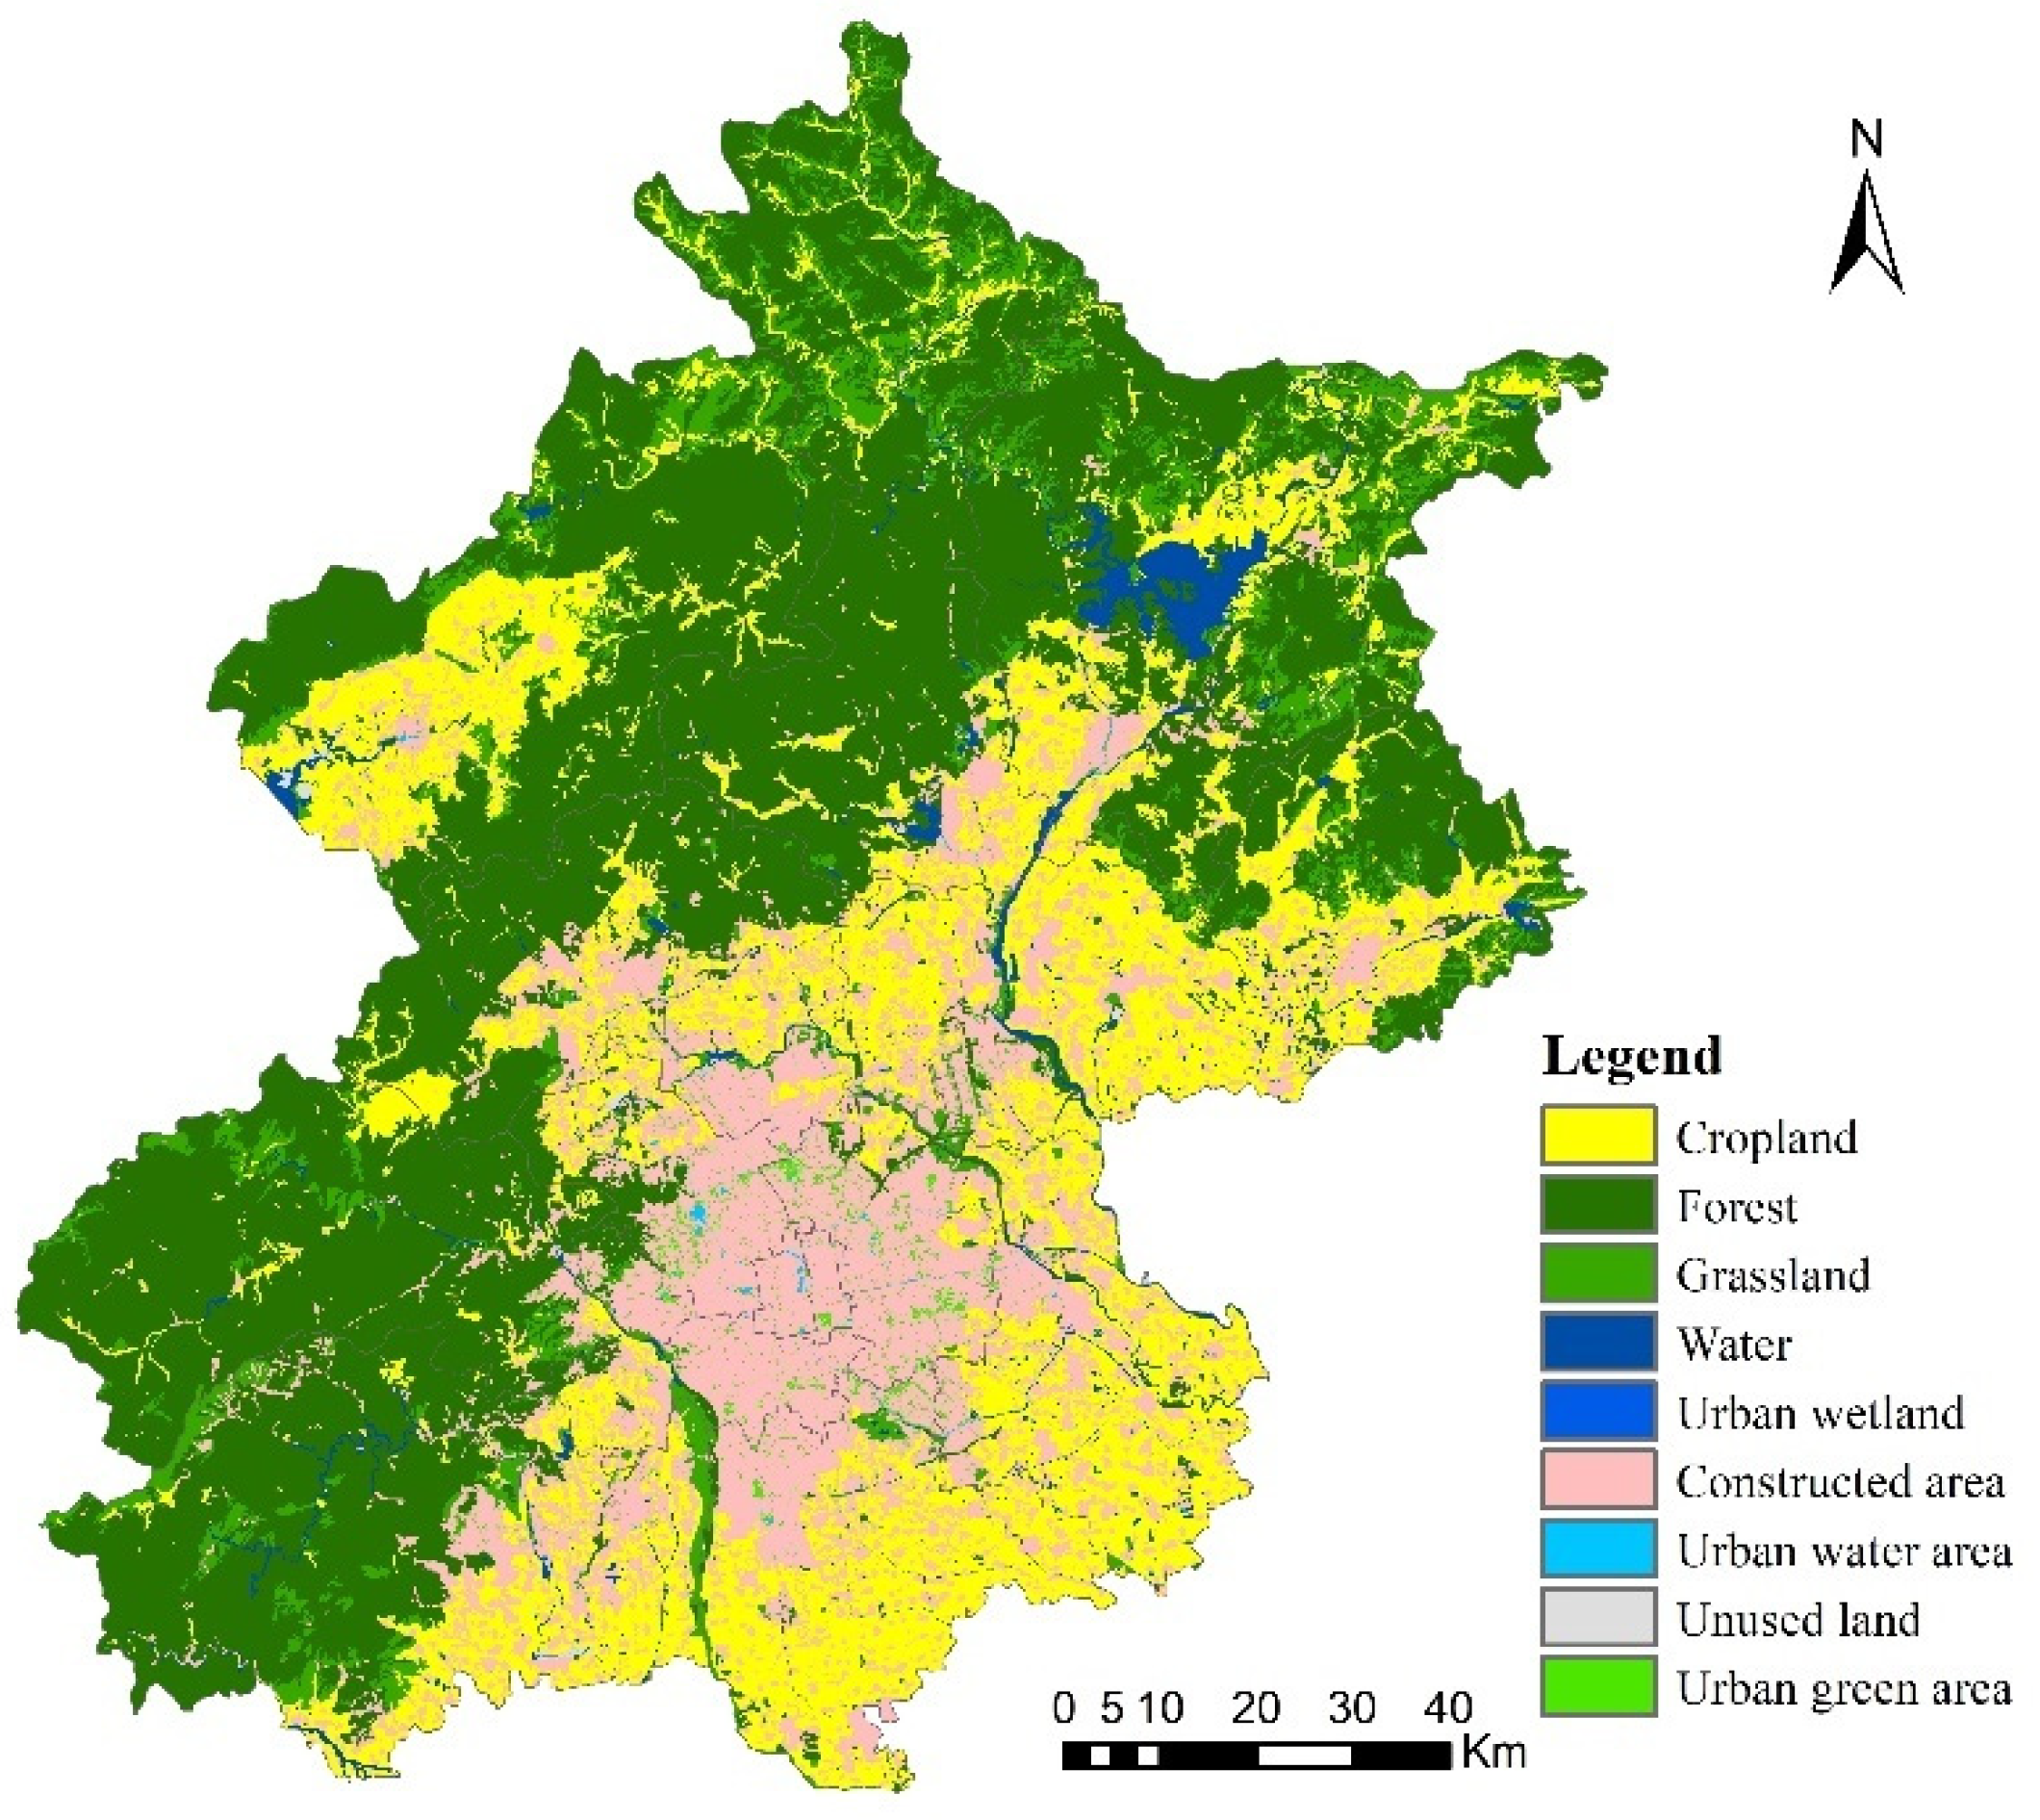
2.5. The Case Study Area and the Data Source

The capital city of China, Beijing, is the study area of this research. Beijing is located in the northern part of China and the northern part of the North China Plain. It has 16 districts with a total area of 16,410.54 square kilometers. At the end of 2019, the permanent population was 21.536 million, the urban population was 18.65 million, the urbanization rate was 86.6%, and the permanent migrant population reached 7.943 million. The terrain of Beijing is high in the northwest and low in the southeast. The west, north and northeast are surrounded by mountains, and the southeast is dominated by plains, where the urban construction is concentrated. Figure 2 shows the land use map of Beijing for the year 2018.
Beijing is located within semi-humid and semi-arid regions in the temperate zone. The vegetation is temperate deciduous broad-leaved forest and warm coniferous forest. There are many soil types, of which Cinnamon Soil is the main, followed by Alluvial Soil, Mountain Brown Soil, and Paddy Soil, etc. There are four distinct seasons with obvious temperature changes. The average temperature is about 28 °C in July and −3 °C in January. The relative humidity outdoors in Beijing is about 58% in summer and 37% in winter. The annual precipitation is about 470–660 mm, of which more than 90% occurs mainly in summer from April to September. Sometimes there will be heavy rain that causes serious disasters.
As the capital, Beijing is China’s political, cultural, diplomatic, and technological innovation center. Constructing and managing Beijing is an important part of the modernization of the national governance system and governance capabilities. Due to long-term interference and destruction by human activities in history, Beijing has many ecological and environmental problems, such as serious air pollution, a shortage of water resources, and fragile ecosystems. At present, the shortage of water and soil resources, the little room for urban development, and the contradiction between the supply and demand of ecosystem services are very prominent in Beijing. Studying the improvement in Beijing’s ecological carrying capacity will help set a model for other cities in China and the world.
Multi-source data are used in this study, including spatial data, literature data and statistical data, as shown detailed in Table 1.

3. Results

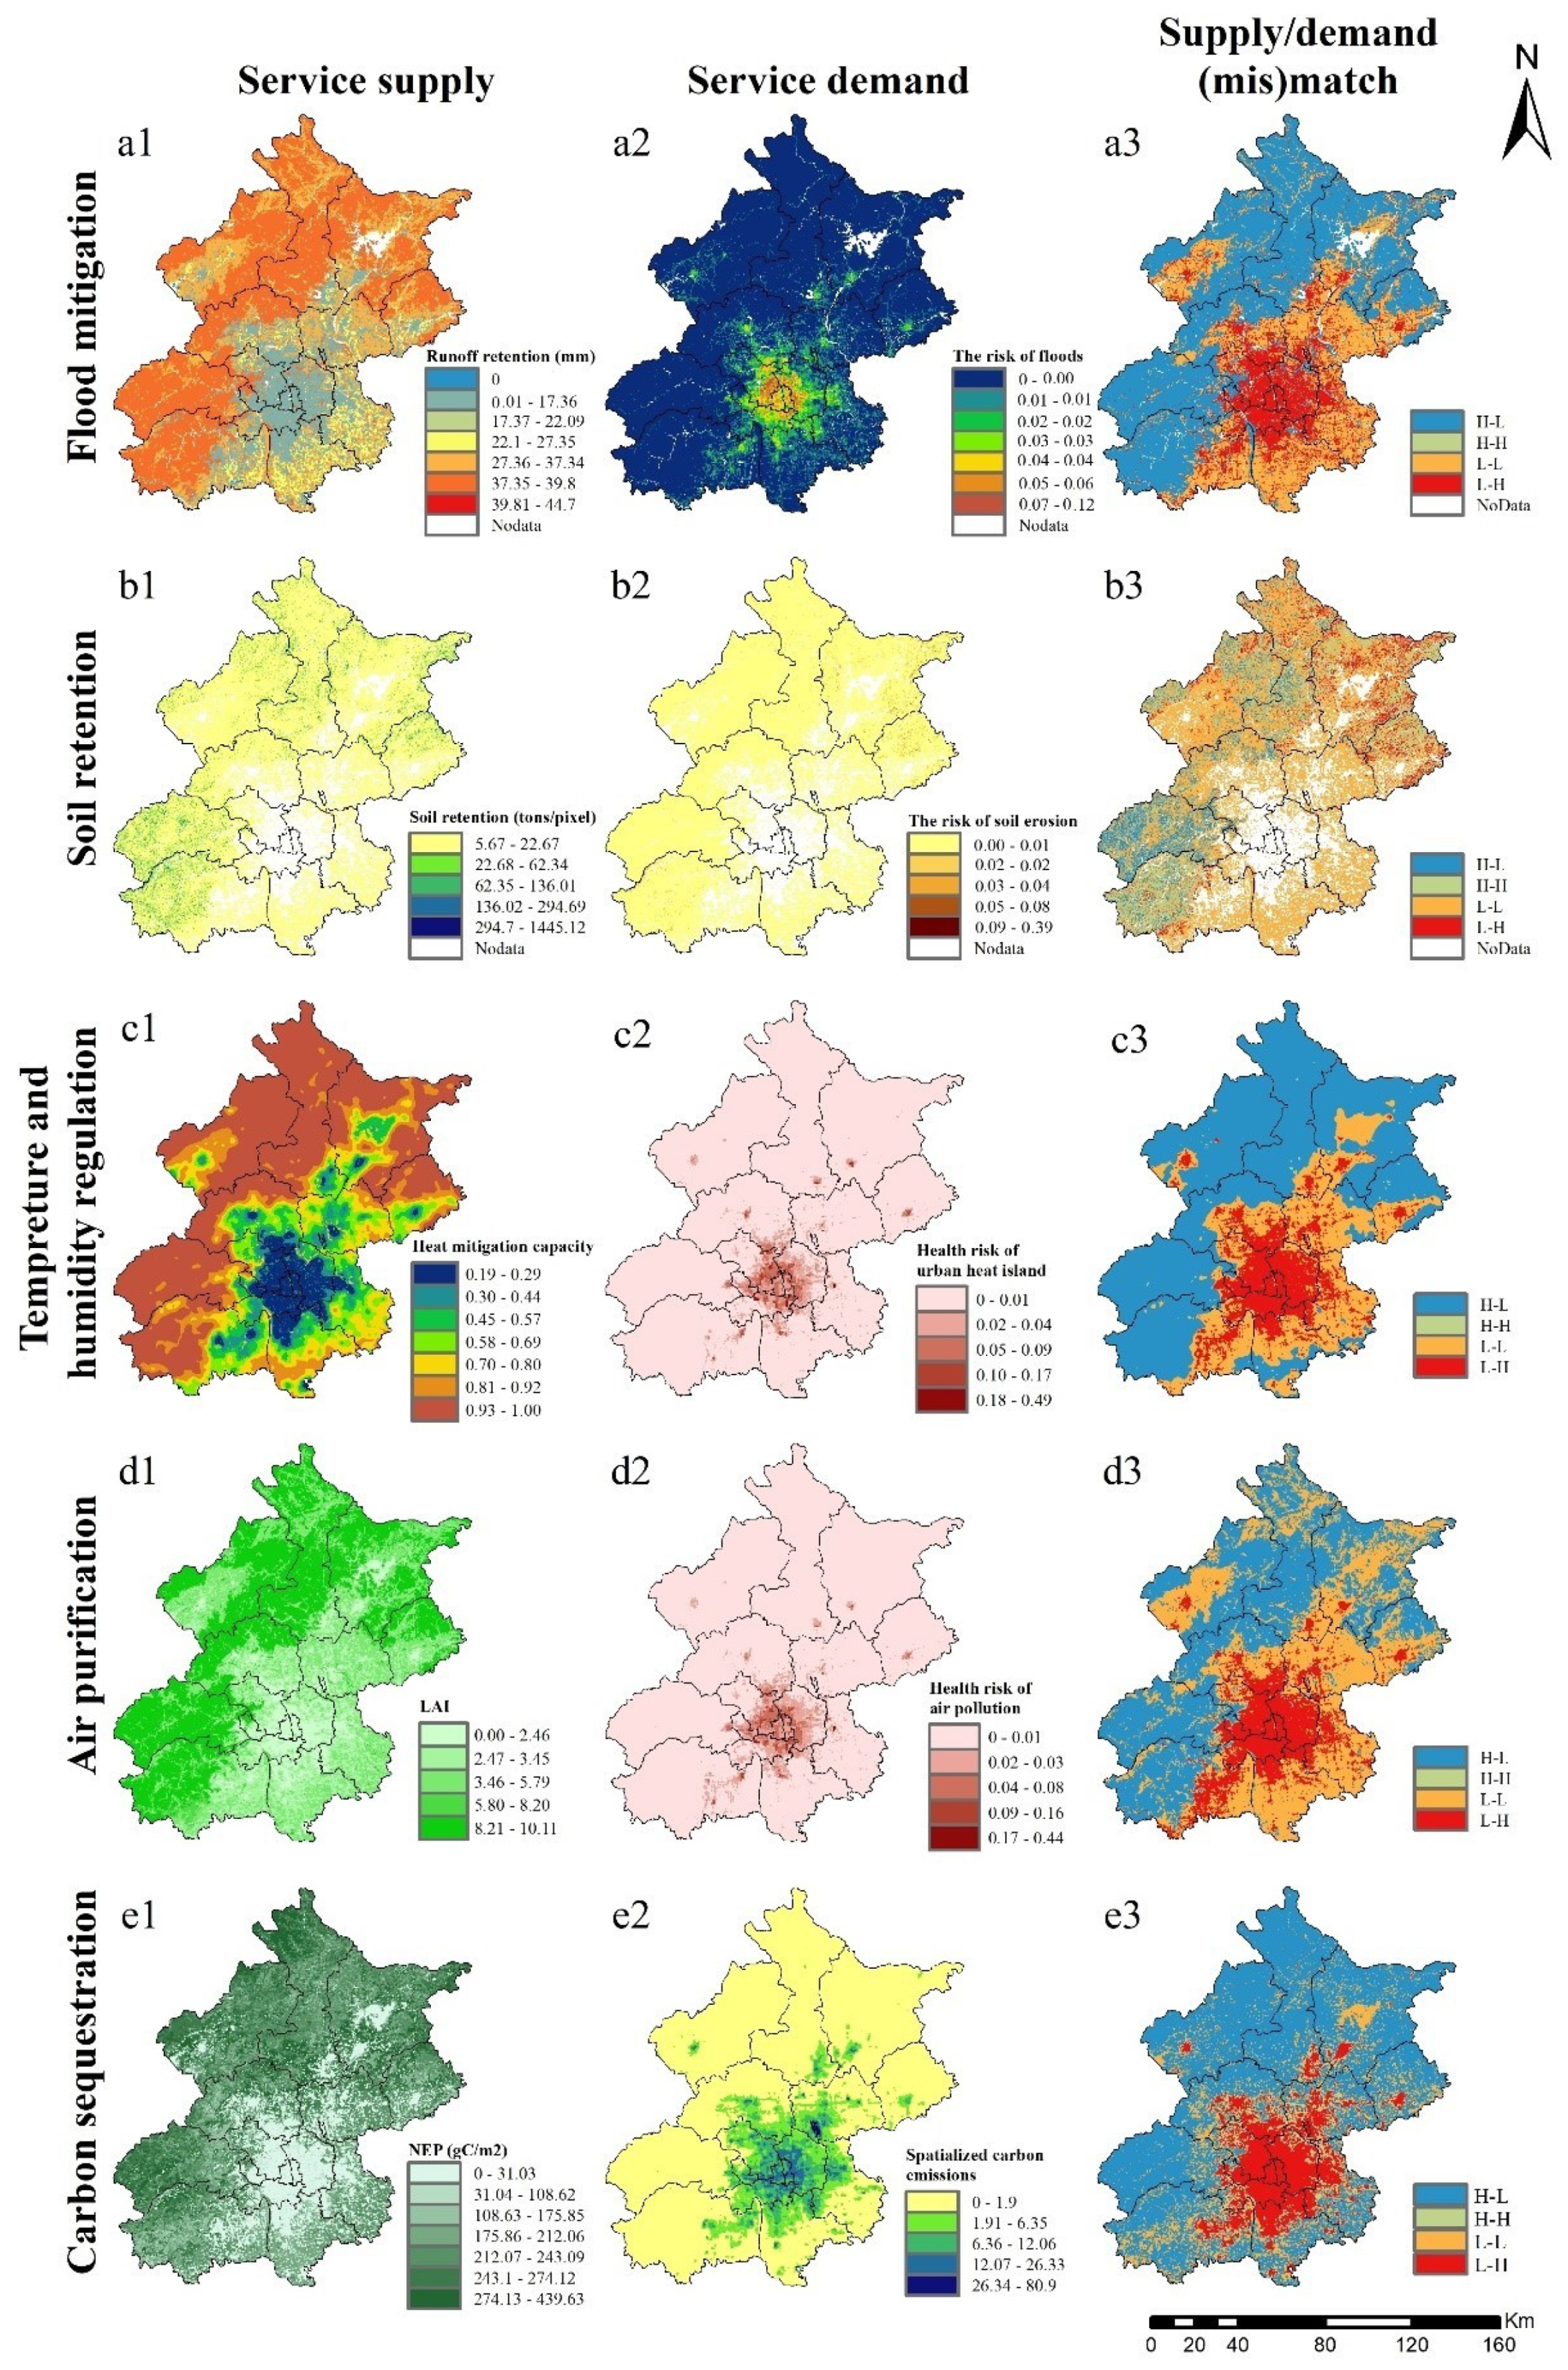
3.1. ES Supply/Demand Evaluation and the Matching Results of Supply/Demand Relationship

The spatial distribution of the supply and demand of the five ecosystem services are shown as Figure 3(a1,a2,b1,b2,c1,c2,d1,d2,e1,e2). The legends are divided by the natural breaks method and appropriate categories to present natural color differentiation and transitions. The spatial matching of supply and demand after Z-Score normalization based on the grid scale was carried out, and the results are shown in Figure 3(a3,b3,c3,d3,e3). It can be seen that the spatial distribution of the relationship between supply and demand of the four services of flood mitigation, temperature and humidity regulation, air purification, and carbon sequestration are similar. There are large areas of L–H in the city center, which are in a state of weak carrying capacity and need to be improved urgently. In the suburbs of the city, there are large areas of H–L areas, and the ECC is very strong. The soil retention service has relatively scattered L–H areas in the eastern, northern and southwestern mountainous areas. Because most of the urban centers are impervious surfaces of construction land, we consider that there is no demand on soil retention services in these areas, and there is no corresponding supply–demand carrying capacity relationship.

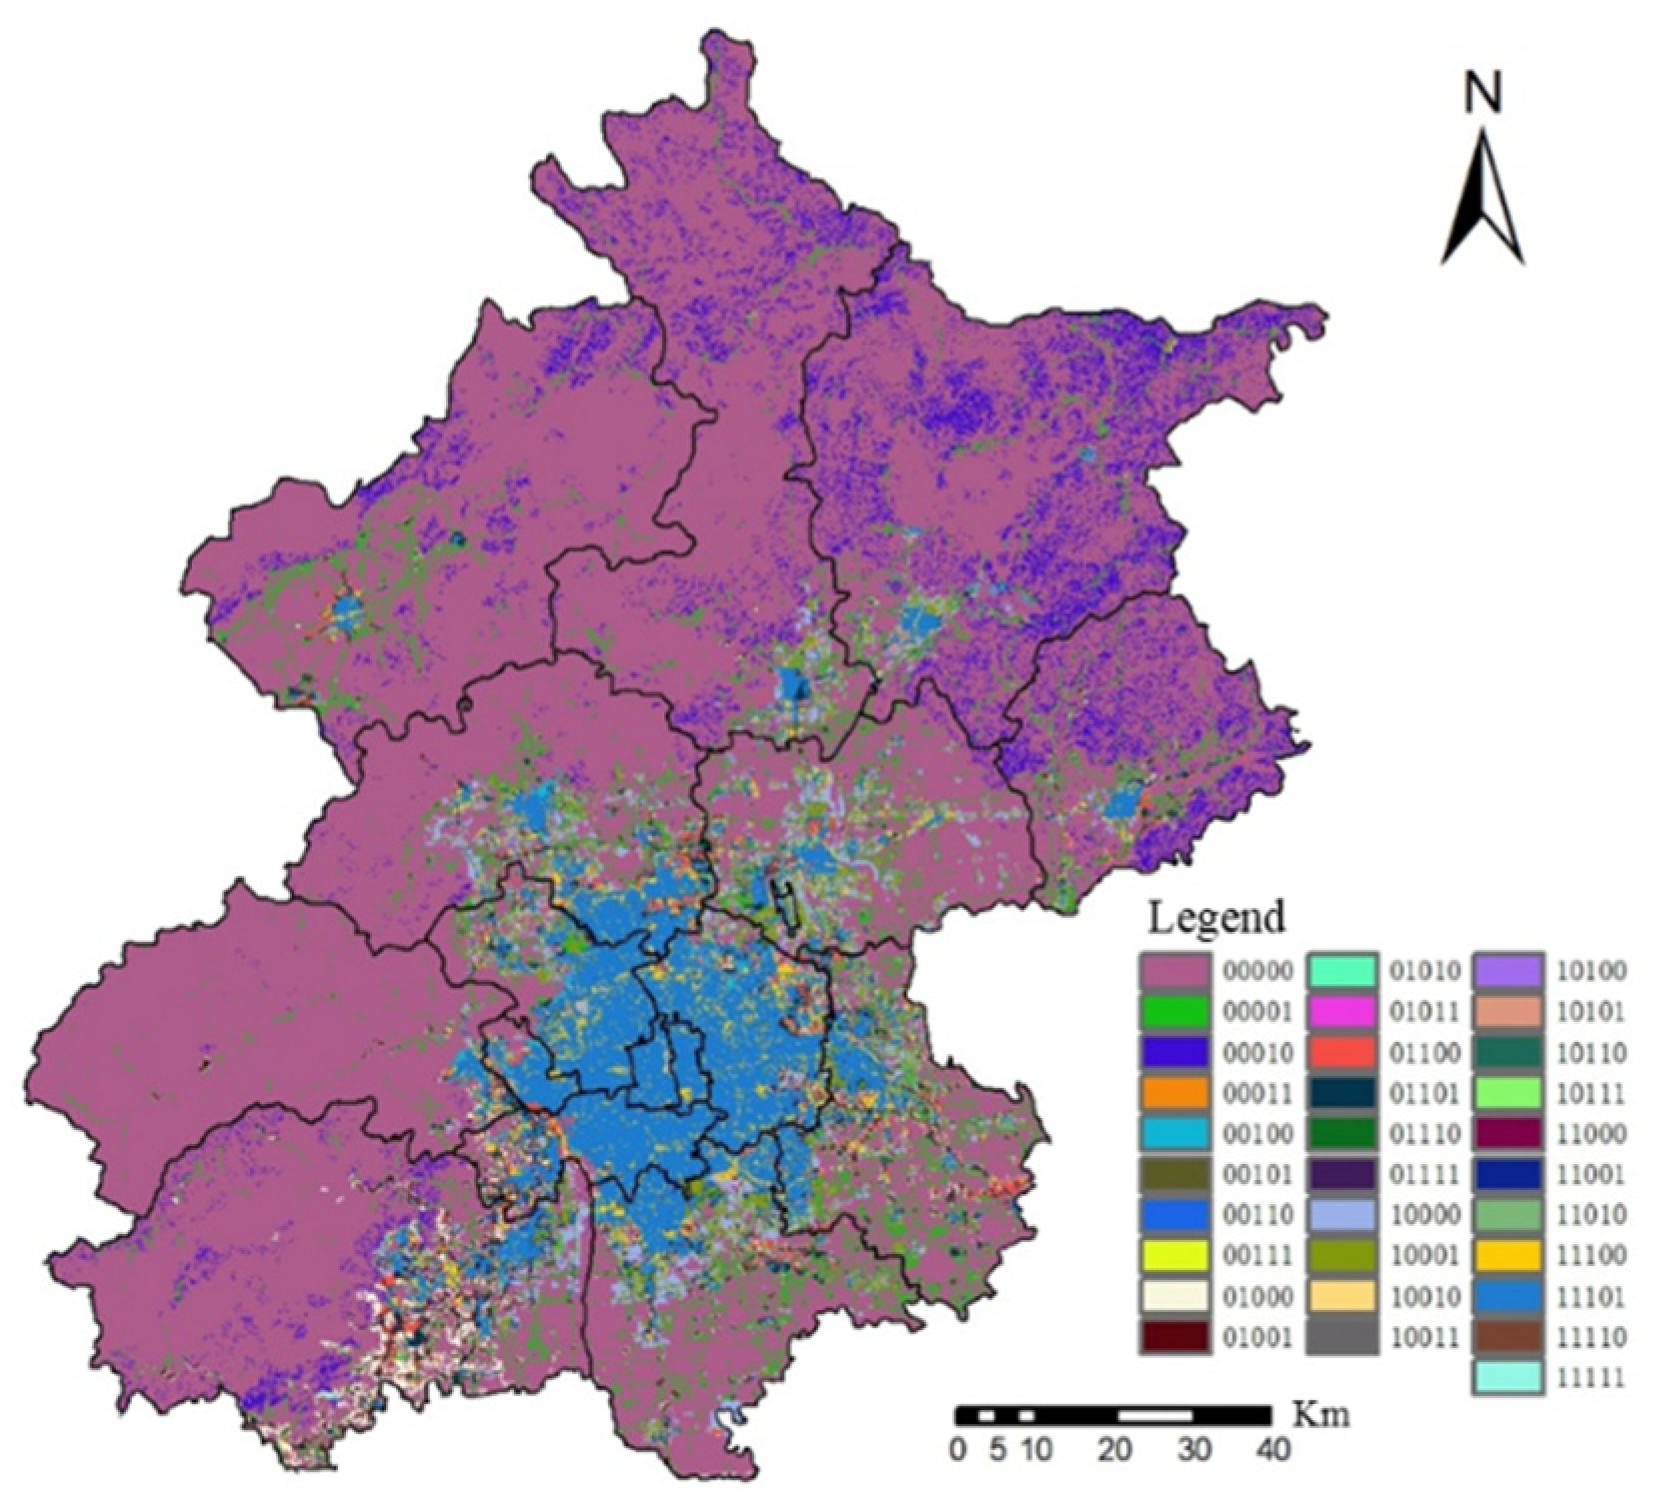
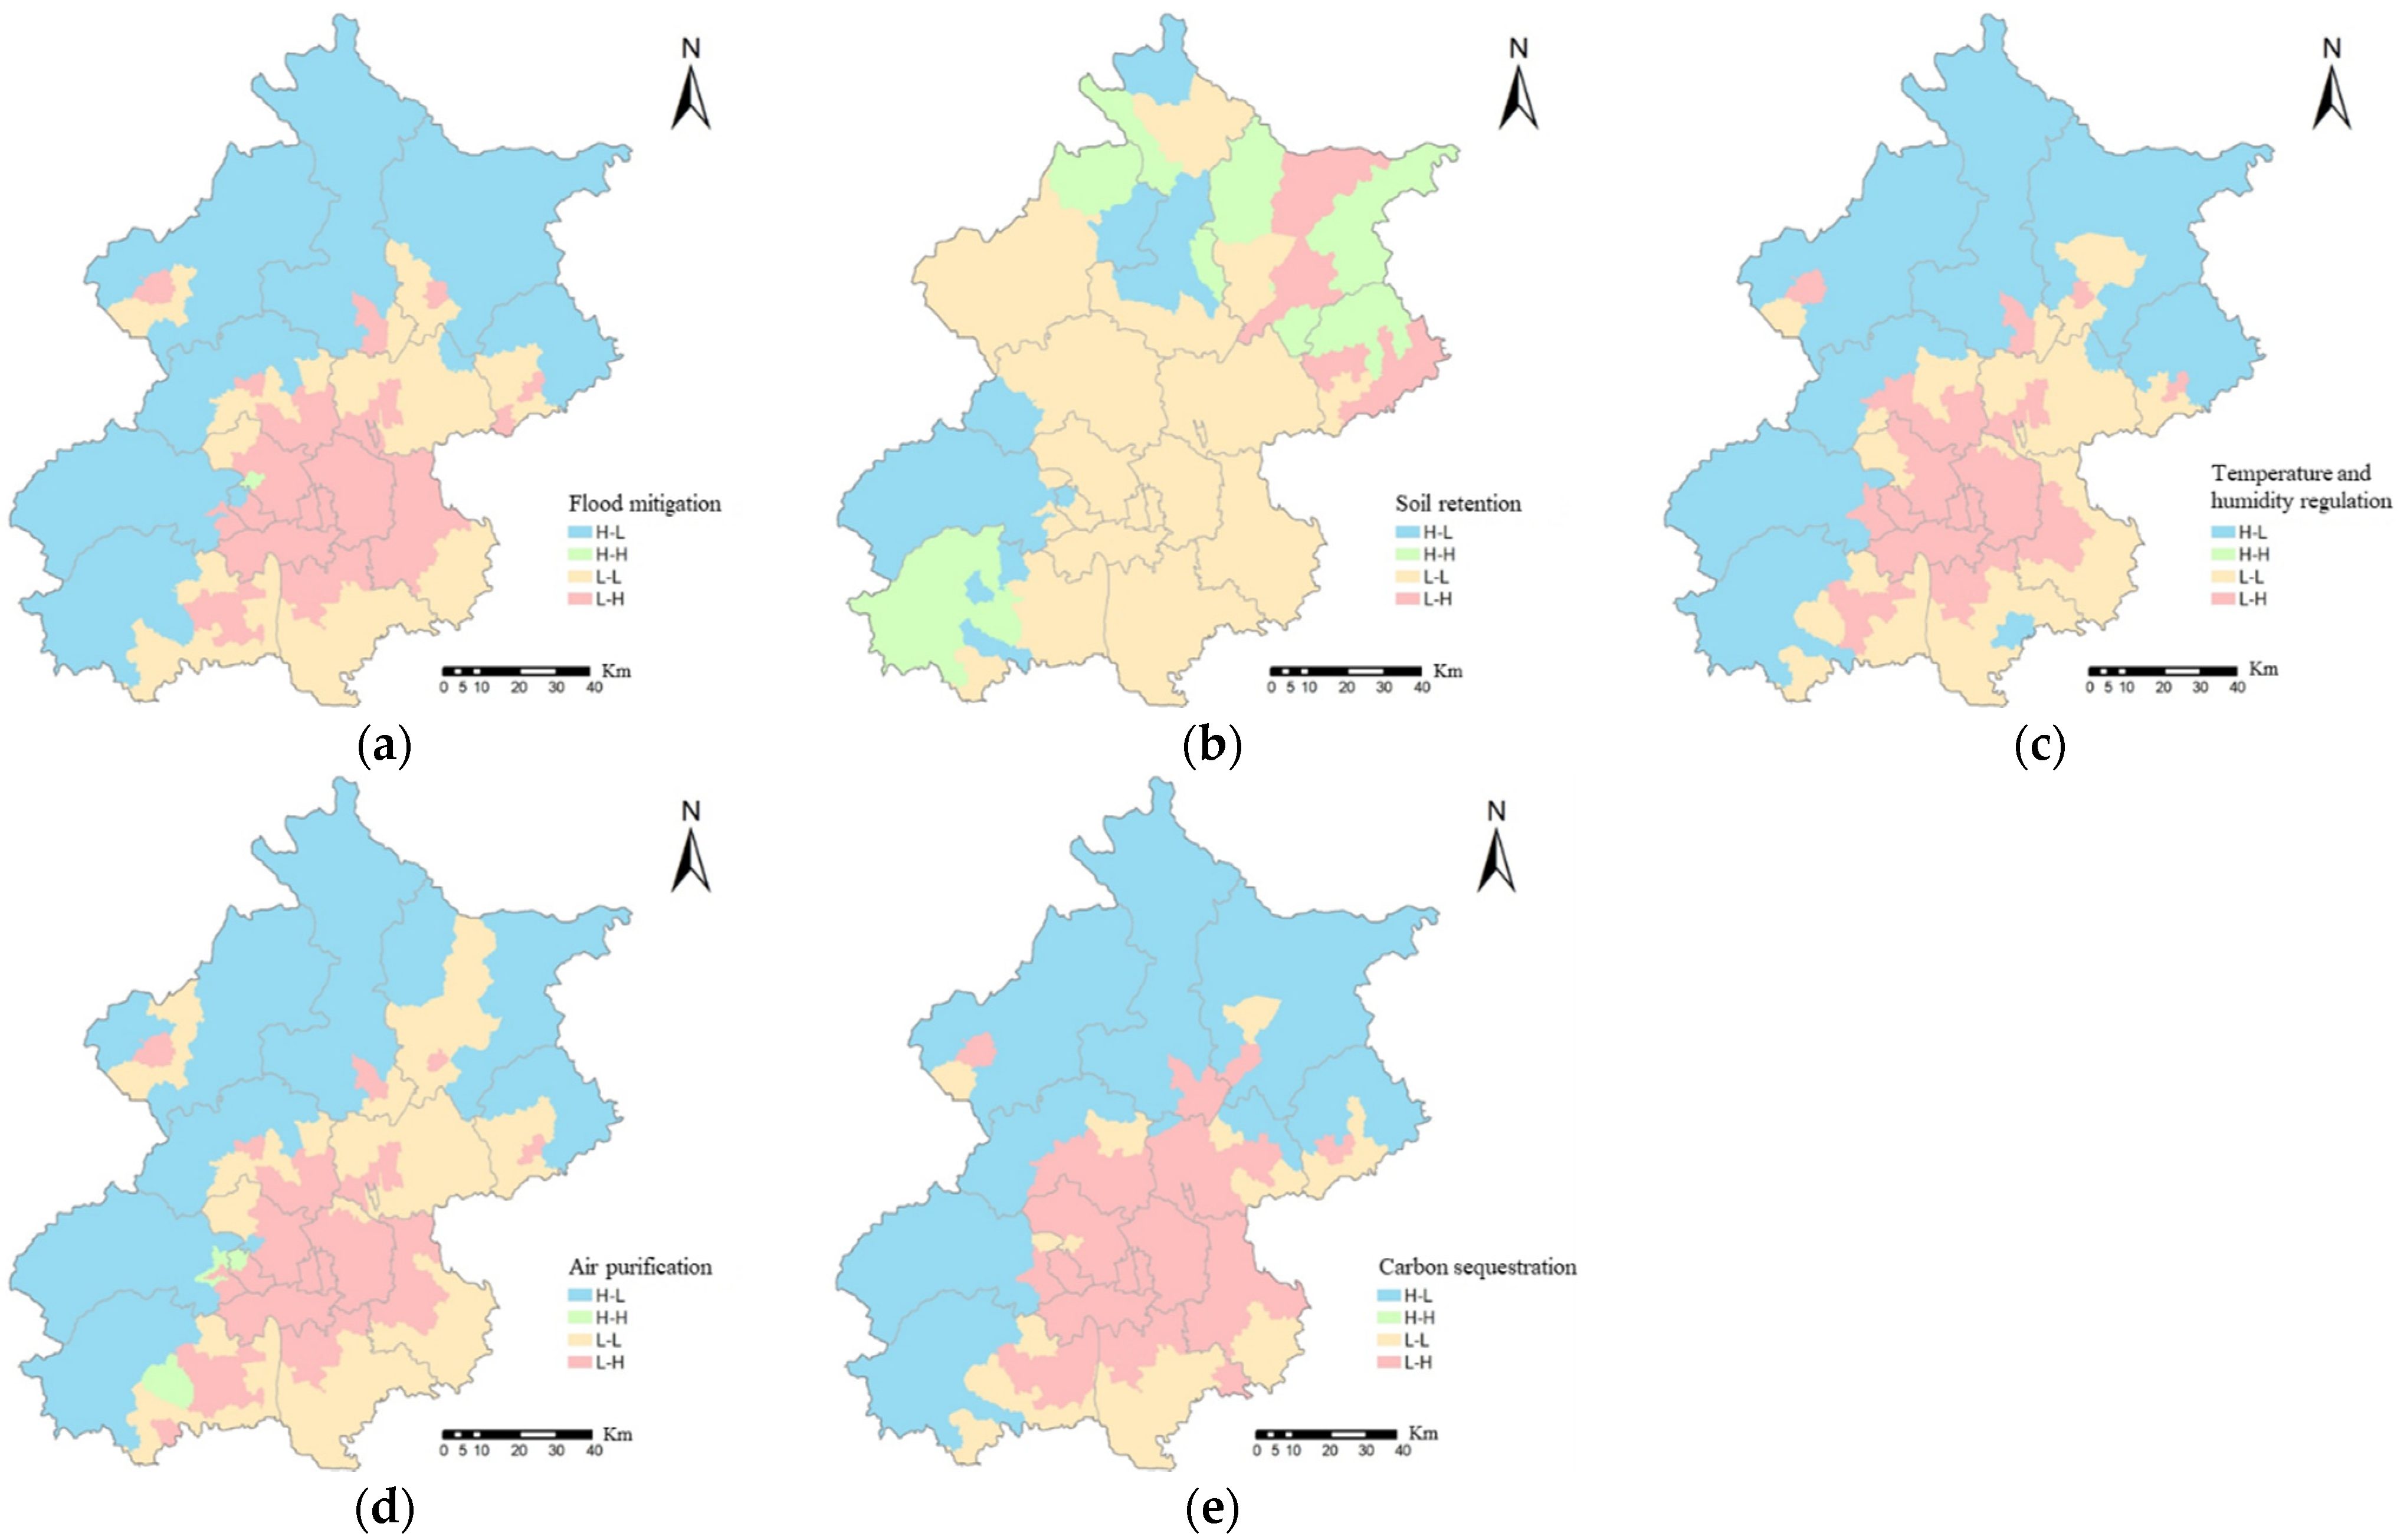
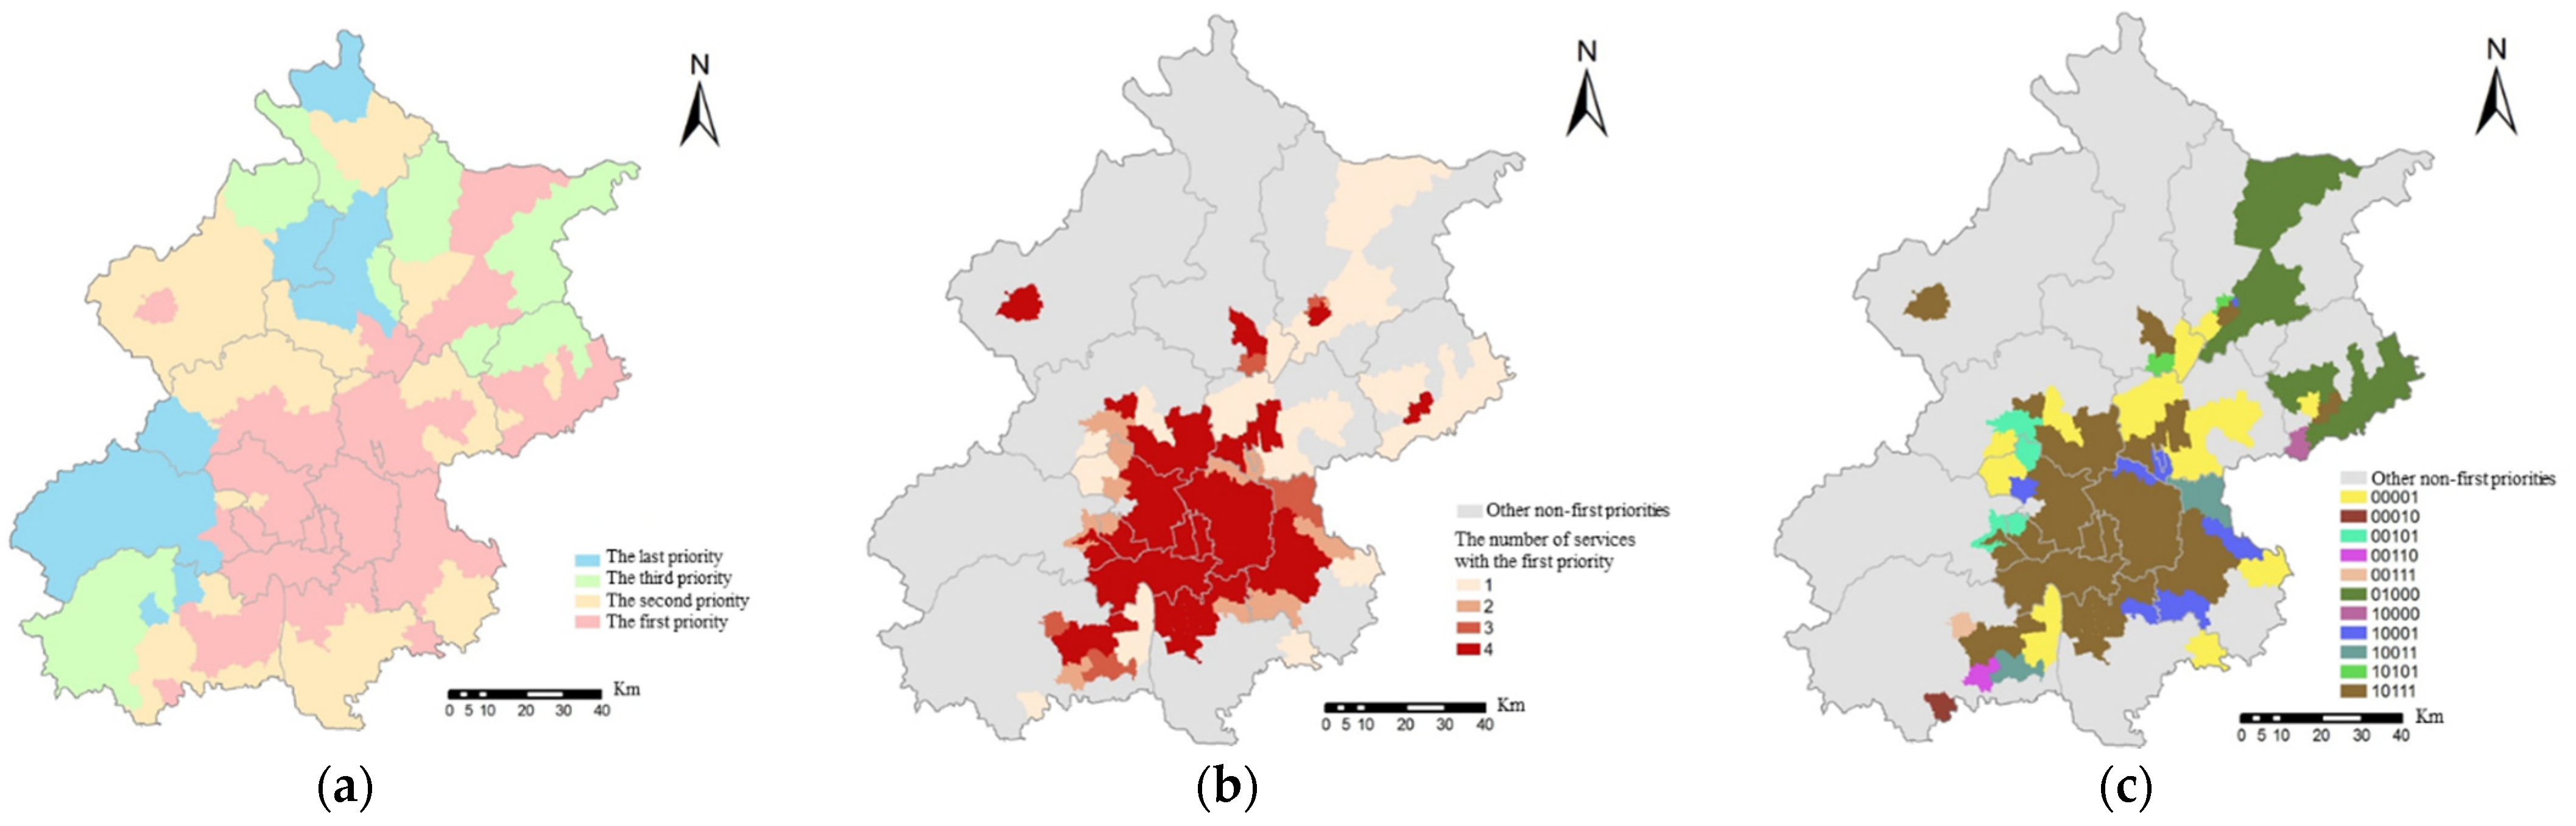
3.2. The Identification of ECC Improvement Priority Area

H–L, H–H, L–L and H–L represent the fourth, third, second and first priority of ECC improvement, respectively. The priority of ECC improvement on each pixel is represented by the highest priority of the five services, which can be worked out by the grid-based pixel statistics tools. The results are shown in Figure 4, where the first priority is concentrated in the center of the urban area, accounting for 31.11% of the total in Beijing.
In the first priority area, there may be priorities for multiple services. In order to more intuitively identify the types of services that need to be improved in each plot, the binary bit method is used to number the five ES types. From right to left, digits 1–5 represent flood mitigation, soil retention, temperature and humidity regulation, air purification, and carbon sequestration. Pixels categorized as 1 means that the service is the first priority for that pixel, and 0 means other priorities (as Table 2). The results are shown in Figure 5 (a total of 31 types, excluding 11011).
According to zonal statistics (Table 3), there are fewer overlapping areas where all five types of ES are in first priority. Dongcheng and Xicheng have four services in the first priority at the same time, accounting for a relatively large proportion, as high as 90.20% and 91.51%. The contradiction between human need and what the ecosystem can provide is the most intense. Chaoyang, Fengtai, Haidian, and Shijingshan also account for a relatively large proportion of four first priority areas. More than 80% of the areas in Mentougou, Huairou, and Yanqing are not in the first priority area of any service, and the carrying states are less tense. There is 45.97% of Tongzhou that is not in the first priority improvement area of any service, and the carrying state is only second to Daxing and Changping. Tongzhou has nearly half of the area that has a certain degree of carrying potential.
The spatial statistics of the first priority areas for improving the carrying capacity of each ecosystem service in each district are shown in Table 4. Dongcheng, Xicheng, Chaoyang, Fengtai, Shijingshan, and Haidian have more priority areas for the improvement of flood mitigation, temperature and humidity regulation, air purification, and carbon sequestration services, while in mountainous areas such as Huairou, Pinggu, and Miyun, there are more priority areas for soil retention service.
Based on the boundaries of towns and subdistricts in Beijing, the match of supply and demand for each service at the administrative boundary scale (Figure 6) and the priority zones for improvement in ECC are obtained (Figure 7a). According to the number of services with the first priority in each town and subdistrict, Figure 7b shows that more ecosystem services must be improved in the darker color, and more comprehensive improvement is required. The binary code is also used to see which services need to be improved more intuitively (Figure 7c).

4. Discussions

4.1. Results Interpretation and Policy Recommendations

The supply–demand map not only provides a priority map for planning, but also leads planners to make the proper decision for each district according to their local and regional needs. Utilizing the match relationship between the supply and demand of ecosystem services to evaluate the states of ECC and divide the area into different zones, targeted strategies can be proposed to enhance the ECC and improve the carrying states of the ecosystem to meet the sustainability targets of the urban ecosystem.
For the first priority (H–L), as shown in Table 5, strategies can be raised from both the supply and demand side targets. Flood mitigation service carrying states can be improved by low impact development (LID) and flood control facilities, e.g., permeable bricks, rainwater storage tanks, sunken green spaces, green roofs, pipe network transformation, etc., especially in low-lying areas, roads, buildings, and densely populated areas that are prone to flooding problems. Soil retention service carrying states can be improved by increasing vegetation coverage, carrying out engineering measures of soil support practice, and adjusting the industrial structure of areas prone to soil erosion to reduce exposure to soil erosion disasters. Temperature and humidity regulation service carrying states can be improved by planting tall arbor trees and increasing water area, or we can evacuate the vulnerable people in the heat area to reduce their exposure to the risk of urban heat waves. It is recommended to prohibit the construction of large residential areas in the central urban area. For the densely populated areas in the central urban area, consideration should be given to relocating the population to the plain areas of Changping, Yanqing, Huairou, Pinggu and Miyun districts. Air purification service carrying states can be improved by growing plants that absorb air pollutants, and by reducing the emission of air pollutants to lower the great damage to society. Carbon sequestration service carrying states can be enhance both by increasing carbon sequestration by enlarging vegetation coverage, and by reducing emissions.
The areas belonging to the second and the third priority correspond to the match type of L–L and H–H. The supply and demand of ecosystem services in these areas are relatively coordinated. In these areas, the coordination should be maintained. For the areas in the second priority (L–L), the construction of ecological economy can be promoted, and the functions of the natural ecosystem need to be improved, while ensuring the balanced development of the regional society and economy. For the areas in the third priority (H–H), the decision maker can radiate the high-quality development of the ecosystem services and the social economy in the surrounding areas, simultaneously.
The last priority belongs to the last order of ECC improvement, which corresponds to the types of high supply and low demand (H–L). It can develop ecological economy under the premise of protecting the existing high-quality ecosystem services. The infrastructure of small towns and countryside should be strengthened to appropriately attract the population of the surrounding area, and explore the development demands within the area.
The message to come out of this study is that when making urban planning, we should pay attention to the objective conditions of the city’s economic and social development level, location, natural endowment, resource, environmental and ecological foundations. Traditional urban planning in China often focuses on the share of maintained green/blue areas or permeable spaces, but ignores the different ecological services provided by different ecological components [78]. As the concept of ecological civilization has taken root in recent years, plenty of urban planning has attempted to go beyond traditional indicators and advocate for the matching conditions of ecosystem services supply and demand in decision-making. However, in actual decision making, planners usually opt for easier ways to enhance the ES supply, but still do not necessarily try to target minimizing mismatches between the supply and demand of ES through land use planning, especially in old downtown or densely populated areas [78,79]. Based on our findings, the development scales and plans should be coordinated to the matching conditions of the supply and demand of ecosystem services to optimize the local ECC. Potential intervention points for improving ECC should be identified to be integrated into frameworks. Our methods can spatially quantify how much a given ES needs to be increased, and identify where demand needs to be adjusted to achieve a regional equilibrium of ECC. Our method is an innovative and potentially highly useful tool for urban planning, since the ES supply depends on biophysical models to avoid the subjective bias, while the ES demand depends on human need. It therefore increases the magnitude of the contributions to their security, health, and wellbeing by linking ES to local conditions.

4.2. The Limitations and Future Prospects

The assessment of ecosystem service demand in this study is relative, and the results cannot be accurately quantitatively compared with the supply results. In the future, we can further develop and explore unified ecosystem service supply and demand evaluation indicators and calculation methods, so that the results of supply and demand are comparable in quantity units, and we can obtain more accurate and detailed assessment results on the states of ecological carrying capacity. Additionally, the demand side assessment is highly influenced by population density and other socio-economic data. The precision of the results depends highly on the quality of these data. Studies discussing higher quality data or different data sources can be considered in the future.
Based on the focus and length considerations of the research, the quantitative analysis of ecosystem service supply and demand are referred to the existing literature and the IPCC framework, with representative indicators selected, combining the consideration of data availability. The supply and demand calculation method of a certain service can be refined and calibrated according to the actual situation of the specific research area.

5. Conclusions

The evaluation framework of the urban ecological carrying capacity is constructed based on the perspective of matching the supply and demand of ecosystem services. Multi-source spatial data, literature data and statistical data are integrated, using spatial models and methods. The case study of Beijing has identified the areas and priority that need to be improved in terms of ecological carrying capacity. The first priority area is mainly in the urban area, with larger and contiguous areas, accounting for 31.11% of Beijing. According to the zoning method of specific types, different levels and types of ecological carrying capacity improvement plans can be proposed. Compared with the traditional method of studying the specific numerical value of ecological carrying capacity, identifying the priority of ecological carrying capacity improvement and the specific types that need to be improved is more realistic for guiding planning and formulating improvement plans. When the budget for improving ecological carrying capacity is limited in cities, we can start with the higher priorities and some specific aspects to maximize effectiveness and efficiency.

Author Contributions

Conceptualization and methodology, G.L., X.W. and S.W.; formal analysis, X.W.; investigation, N.Y., Q.Y., B.C., J.B., Y.Z. and G.V.L.; resources and data curation, X.W. and S.W.; writing—original draft preparation, X.W. and G.L.; writing—review and editing, X.W. and G.V.L.; supervision, project administration and funding acquisition G.L., X.W. and S.W. share the co-first and equal authorship on this paper. All authors have read and agreed to the published version of the manuscript.

Funding

This work is supported by the Fund for the National Natural Science Foundation of China (No. 52070021), Joint Fund Project of Guangdong Basic and Applied Basic Research Fund (2019A1515110816) and the 111 Project (No. B17005).

Data Availability Statement

Not applicable.

Conflicts of Interest

The authors declare no conflict of interest.

References

  1. Meng, C.; Du, X.; Ren, Y.; Shen, L.; Cheng, G.; Wang, J. Sustainable urban development: An examination of literature evolution on urban carrying capacity in the Chinese context. J. Clean. Prod. 2020, 277, 122802. [Google Scholar] [CrossRef]
  2. Wei, Y.; Huang, C.; Lam, P.T.I.; Yuan, Z. Sustainable urban development: A review on urban carrying capacity assessment. Habitat Int. 2015, 46, 64–71. [Google Scholar] [CrossRef]
  3. Park, R.E.; Burgess, E.W. Introduction to the Science of Sociology; University of Chicago Press: Chicago, IL, USA, 1921. [Google Scholar]
  4. Zhao, D.S.; Guo, C.Y.; Zheng, D.; Liu, L.; Wu, S.H. Review of ecological carrying capacity. Acta Ecol. Sin. 2019, 39, 399–410, (In Chinese with English Abstract). [Google Scholar]
  5. Ehrlich, P.R. The Population Bomb; Ballantine Books: New York, NY, USA, 1971. [Google Scholar]
  6. Seidl, I.; Tisdell, C.A. Carrying capacity reconsidered: From Malthus’ population theory to cultural carrying capacity. Ecol. Econ. 1999, 31, 395–408. [Google Scholar] [CrossRef] [Green Version]
  7. Clarke, A.L. Assessing the Carrying Capacity of the Florida Keys. Popul. Environ. 2002, 23, 405–418. [Google Scholar] [CrossRef]
  8. Gao, J. Study on Ecological Carrying Capacity of Regional Sustainable Development; Institute of Geographic Sciences and Natural Resources Research: Beijing, China, 1999. [Google Scholar]
  9. Schneider, D.M.; Godschalk, D.R.; Axler, N. The Carrying Capacity Concept as a Planning Tool; American Planning Association: Chicago, IL, USA, 1978. [Google Scholar]
  10. Xiang, Y.-Y.; Meng, J.-J. Research and application advances in ecological carrying capacity. Chin. J. Ecol. 2012, 31, 2958–2965, (In Chinese with English Abstract). [Google Scholar]
  11. Ye, J.; Xie, Q.; Tan, N. National land spatial pattern distribution method based on ecological carrying capacity. Trans. Chin. Soc. Agric. Eng. 2017, 33, 262–271, (In Chinese with English Abstract). [Google Scholar] [CrossRef]
  12. Liao, H.; Ji, Y.; Peng, S. Resource and Environment Carrying Capacity and Sustainable Development. Ecol. Environ. Sci. 2016, 25, 1253–1258, (In Chinese with English Abstract). [Google Scholar]
  13. Rees, W.E.; Wackernagel, M. Urban ecological footprints: Why cities cannot be sustainable—And why they are a key to sustainability. Environ. Impact Assess Rev. 1996, 16, 223–248. [Google Scholar] [CrossRef]
  14. Rees, W.E. Ecological footprints and appropriated carrying capacity: What urban economics leaves out. Environ. Urban. 1992, 4, 121–130. [Google Scholar] [CrossRef]
  15. WWF. Living Planet Report; WWF: Gland, Switzerland, 2000. [Google Scholar]
  16. WWF. Living Planet Report—2018: Aiming Higher; WWF: Gland, Switzerland, 2018. [Google Scholar]
  17. WWF. China Ecological Footprint Report; WWF: Gland, Switzerland, 2012. [Google Scholar]
  18. Wang, J.-J.; Yao, X.-H.; Li, J.-R.; Chang, H.; Wang, Y.G. Assessment for Ecological Carrying Capacity of Heihe River Basin. Res. Environ. Sci. 2000, 13, 44–48, (In Chinese with English Abstract). [Google Scholar]
  19. Jin, Y.; Lu, Z.H.; Tan, F.F.; Zhang, M.; Zhang, H. Assessment of ecological carrying capacity on the typical resources-based cities: A case study of Tangshan City. Acta Ecol. Sin. 2015, 35, 4852–4859, (In Chinese with English Abstract). [Google Scholar]
  20. Yang, Z.; Sui, X. Assessment of the ecological carrying capacity based on the ecosystem health. Acta Sci. Circumstantiae 2005, 25, 586–594, (In Chinese with English Abstract). [Google Scholar]
  21. Shen, W.S.; Zhang, H.; Zou, C.X. Study on Regional Ecological Carrying Capacity and Ecological Security; China Environmental Science Press: Beijing, China, 2010. [Google Scholar]
  22. MEA. Ecosystems and Human Well-Being Synthesis; MEA: Washington, DC, USA, 2005.
  23. Zeng, L. The Model and Its Application for Analyzing the Impacts of Regional Development on the Ecosystem; Tsinghua University: Beijing, China, 2015; (In Chinese with English Abstract). [Google Scholar]
  24. Cao, Z.; Min, Q.W.; Liu, M.-C.; Bai, Y.Y. Ecosystem-Service-based Ecological Carrying Capacity: Concept, Content, Assessment Model and Application. J. Nat. Resour. 2015, 30, 1–11, (In Chinese with English Abstract). [Google Scholar]
  25. Xu, W.; Yang, Y.; Zhang, L.; Xiao, Y.; Wang, X.K.; Ouyang, Z.Y. Evaluation methods and case study of regional ecological carrying capacity for early warning. Prog. Geogr. 2017, 36, 306–312, (In Chinese with English Abstract). [Google Scholar]
  26. Jiao, W.-J.; Min, Q.-W.; Li, W.-H. Measuring water ecological carrying capacity with the ecosystem-service-based ecological footprint (ESEF) method: Theory, models and application. Chin. J. Appl. Ecol. 2015, 26, 1041–1048, (In Chinese with English Abstract). [Google Scholar]
  27. Wang, X. Historical Data of Air Quality in Beijing. 2018. Available online: https://quotsoft.net/air/ (accessed on 9 February 2021).
  28. Niu, C.; Lou, A.; Sun, R. Foundations in Ecology; Higher Education Press: Beijing, China, 2015. [Google Scholar]
  29. Jones, L.; Norton, L.; Austin, Z.; Browne, A.L.; Donovan, D.; Emmett, B.A.; Grabowski, Z.J.; Howard, D.C.; Jones, J.P.; Kenter, J.O.; et al. Stocks and flows of natural and human-derived capital in ecosystem services. Land Use Policy 2016, 52, 151–162. [Google Scholar] [CrossRef]
  30. Schröter, M.; Barton, D.N.; Remme, R.P.; Hein, L. Accounting for capacity and flow of ecosystem services: A conceptual model and a case study for Telemark, Norway. Ecol. Indic. 2014, 36, 539–551. [Google Scholar] [CrossRef]
  31. Zhao, W.; Liu, Y.; Feng, Q. Ecosystem services for coupled human and environment systems. Prog. Geogr. 2018, 37, 139–151, (In Chinese with English Abstract). [Google Scholar]
  32. Yi, D.; Xiao, S.-C.; Han, Y.; Ming-Hao, O.U. Review on supply and demand of ecosystem service and the construction of systematic framework. Chin. J. Appl. Ecol. 2021, 32, 3942–3952, (In Chinese with English Abstract). [Google Scholar]
  33. Ma, L.; Liu, H.; Peng, J.; Wu, J. A review of ecosystem services supply and demand. Acta Geogr. Sin. 2017, 72, 1277–1289, (In Chinese with English Abstract). [Google Scholar]
  34. Ramyar, R.; Saeedi, S.; Bryant, M.; Davatgar, A.; Hedjri, G.M. Ecosystem services mapping for green infrastructure planning–The case of Tehran. Sci. Total Environ. 2020, 703, 135466. [Google Scholar] [CrossRef] [PubMed]
  35. Arowolo, A.O.; Deng, X.; Olatunji, O.A.; Obayelu, A.E. Assessing changes in the value of ecosystem services in response to land-use/land-cover dynamics in Nigeria. Sci. Total Environ. 2018, 636, 597–609. [Google Scholar] [CrossRef]
  36. Wolff, S.; Schulp, C.J.E.; Verburg, P.H. Mapping ecosystem services demand: A review of current research and future perspectives. Ecol. Indic. 2015, 55, 159–171. [Google Scholar] [CrossRef]
  37. Wang, L.; Zheng, H.; Wen, Z.; Liu, L.; Robinson, B.E.; Li, R.; Li, C.; Kong, L. Ecosystem service synergies/trade-offs informing the supply-demand match of ecosystem services: Framework and application. Ecosyst. Serv. 2019, 37, 100939. [Google Scholar] [CrossRef]
  38. Liu, Y.; Ni, Y.; Zheng, X. Supply and Demand Balance Planning of Urban Green Infrastructure Based on GI-ES Evaluation Model-Tanke the Central District of Beijing as an Example. In Proceedings of the Chinese Society of Landscape Architecture 2019 Annual Conference Proceedings, Shanghai, China, 19 October 2019; Volume 1. [Google Scholar]
  39. Yang, M.; Zhang, Y.-Q.; Wang, C.-X. Spatial-temporal Variations in the Supply-demand Balance of Key Ecosystem Services in Hubei Province. Resour. Environ. Yangtze Basin 2019, 28, 2080–2091, (In Chinese with English Abstract). [Google Scholar]
  40. Hu, S.; Cao, M.; Liu, Q.; Zhang, T.Q.; Qiu, H.J.; Liu, W.; Song, J.X. Comparative study on the soil conservation function of InVEST model under different perspectives. Geogr. Res. 2014, 33, 2393–2406, (In Chinese with English Abstract). [Google Scholar]
  41. Bi, X. Studies on the Soil Loss Equation of the Slope in the Mountainous Area of Beijing; Beijing Forestry University: Beijing, China, 2007; p. 120. [Google Scholar]
  42. MEP. Technical Guide for Delimitation of Ecological Protection Red Line; MEP: London, UK, 2015. [Google Scholar]
  43. Li, S. The Dynamics of Ecosystem Services and Their Driving Factors in the Jing-Jin-Ji Region; Beijing Forestry University: Beijing, China, 2019. [Google Scholar]
  44. Xiao, Y.; Wang, S.; Li, N.; Xie, G.D.; Lu, C.X.; Zhang, B.; Zhang, C.S. Atmospheric PM2.5 removal by green spaces in Beijing. Resour. Sci. 2015, 37, 1149–1155, (In Chinese with English Abstract). [Google Scholar]
  45. Zhang, W.; Wu, X.; Yu, Y.; Cao, J. Changes of Ecosysem Services Supply-demand and Response to Rocky Desertification in Xiaojiang Basin during 2005–2015. J Soil Water Conserv. 2019, 33, 139–150, (In Chinese with English Abstract). [Google Scholar]
  46. Running, S.; Zhao, M. MOD17A3HGF MODIS/Terra Net Primary Production Gap-Filled Yearly L4 Global 500 m SIN Grid V006. NASA EOSDIS Land Process. DAAC 2019, 16, 657–670. [Google Scholar] [CrossRef]
  47. Duan, X.-N.; Wang, X.-K.; Lu, F.; Ouyang, Z.Y. Carbon sequestration and its potential by wetland ecosystems in China. Acta Ecol. Sin. 2008, 28, 463–469, (In Chinese with English Abstract). [Google Scholar]
  48. Lai, J. Ecological assessment of carbon sink in urban green space: Case study of Beijing Yanqing County. J. Henan Inst. Sci. Technol. 2013, 41, 30–34, (In Chinese with English Abstract). [Google Scholar]
  49. MEP; CAS. Remote Sensing Survey and Evaluation of Ten-Year Changes of National Ecological Environment (2000~2010); China Science Publishing & Media Ltd.: Beijing, China, 2016.
  50. Guo, C.-Q.; Xu, X.-B.; Shu, Q. A review on the assessment methods of supply and demand of ecosystem services. Chin. J. Ecol. 2020, 39, 2086–2096, (In Chinese with English Abstract). [Google Scholar]
  51. Larondelle, N.; Lauf, S. Balancing demand and supply of multiple urban ecosystem services on different spatial scales. Ecosyst. Serv. 2016, 22, 18–31. [Google Scholar] [CrossRef]
  52. Morri, E.; Pruscini, F.; Scolozzi, R.; Santolini, R. A forest ecosystem services evaluation at the river basin scale: Supply and demand between coastal areas and upstream lands (Italy). Ecol. Indic. 2014, 37, 210–219. [Google Scholar] [CrossRef]
  53. Zhang, H.; Li, C.; Cheng, J.; Zhang, L.; Li, J. A review of urban flood risk assessment based on the framework of hazard-exposure-vulnerability. Prog. Geogr. 2019, 38, 175–190, (In Chinese with English Abstract). [Google Scholar]
  54. IPCC. Climate change: Impacts, adaptation, and vulnerability. In Part A: Global and Sectoral Aspects. Contribution of Working Group II to the Fifth Assessment Report of the Intergovernmental Panel on Climate Change; IPCC: Cambridge, UK, 2014. [Google Scholar]
  55. Tan, C. Evaluation of Urban Ecosystem Services Excess Demand from the Perspective of Green Infrastructure: A Case Study of Central Area of Wuhan; Huazhong Agricultural University: Wuhan, China, 2019; (In Chinese with English Abstract). [Google Scholar]
  56. Jiang, F.; Cao, Q. Research on Application of Information Extraction of Urban Low-lying Land Based on DEM in ArcGIS Environment Excellent paper of Zhejiang Society of Surveying. Mapp. Geogr. Inf. 2016, 221–224. (In Chinese) [Google Scholar]
  57. Liu, B.; Bi, X.; Fu, S. Beijing Soil Loss Equation; China Science Publishing & Media Ltd.: Beijing, China, 2010. [Google Scholar]
  58. Xu, Z. Accessing Place Vulnerability Based on the Framework of SES; Lanzhou University: Lanzhou, China, 2009; (In Chinese with English Abstract). [Google Scholar]
  59. Li, H.-H.; Zhang, M.-S. Framework and application of health risk assessment for heat wave in Beijing. J. Environ. Health 2020, 37, 58–65, (In Chinese with English Abstract). [Google Scholar]
  60. Ma, Z.; Xiao, H. Spatiotemporal simulation study of China’s provincial carbon emissions based on satellite night lighting data. China Popul. Resour. Environ. Dev. Econ. 2017, 27, 143–150, (In Chinese with English Abstract). [Google Scholar]
  61. Liu, L.; Liu, C.; Wang, C.; Li, P. Supply and demand matching of ecosystem services in loess hilly region: A case study of Lanzhou. Acta Geogr. Sin. 2019, 74, 1921–1937, (In Chinese with English Abstract). [Google Scholar]
  62. Chen, H.; Zhang, X.; Wu, R.; Cai, T. Revisiting the environmental Kuznets curve for city-level CO2 emissions: Based on corrected NPP-VIIRS nighttime light data in China. J. Clean. Prod. 2020, 268, 121575. [Google Scholar] [CrossRef]
  63. Ou, J.; Liu, X.; Li, X.; Li, M.; Li, W. Evaluation of NPP-VIIRS Nighttime Light Data for Mapping Global Fossil Fuel Combustion CO2 Emissions: A Comparison with DMSP-OLS Nighttime Light Data. PLoS ONE 2015, 10, e0138310. [Google Scholar] [CrossRef] [PubMed] [Green Version]
  64. Elvidge, C.D.; Baugh, K.E.; Zhizhin, M.; Hsu, F.C. Why VIIRS data are superior to DMSP for mapping nighttime lights. Asia-Pac. Adv. Netw. 2013, 35, 62. [Google Scholar] [CrossRef] [Green Version]
  65. Liu, C.-F.; Wang, W.-T.; Liu, L.-C. Supply-demand matching of county ecosystem services in Northwest China: A case study of Gulang county. J. Nat. Resour. 2020, 35, 2177–2190, (In Chinese with English Abstract). [Google Scholar] [CrossRef]
  66. Dong, X. Ecosystem Services Demand Assessment Regarding Disaster Vulnerability and Supply-Demand Spatial Matching; China University of Geosciences: Beijing, China, 2019. [Google Scholar]
  67. WorldPop and Center for International Earth Science Information Network (CIESIN). Global High Resolution Population Denominators Project; Columbia University: New York, NY, USA, 2018. [Google Scholar] [CrossRef]
  68. Didan, K. MOD13Q1 MODIS/Terra Vegetation Indices 16-Day L3 Global 250m SIN Grid V006. NASA EOSDIS Land Processes DAAC 2015, 10, 415. [Google Scholar] [CrossRef]
  69. Ross, C.W.; Prihodko, L.; Anchang, J.Y.; Kumar, S.; Ji, W.; Hanan, N.P. Global Hydrologic Soil Groups (HYSOGs250m) for Curve Number-Based Runoff Modeling. ORNL Distrib. Act. Arch. Cent. 2018, 5, 180091. [Google Scholar] [CrossRef]
  70. NRCS-USDA. National Engineering Handbook; United States Department of Agriculture: Washington, DC, USA, 2007.
  71. Food and Agriculture Organization of the United Nations (FAO). China Soil Map Based Harmonized World Soil Database (HWSD) (v1.1); National Tibetan Plateau Data Center: Lanzhou, China, 2009; Available online: https://www.ncdc.ac.cn/ (accessed on 9 February 2021).
  72. Trabucco, A.; Zomer, R. Global Aridity Index and Potential Evapotranspiration (ET0) Climate Database v2, Figshare. 2019. Available online: https://figshare.com/articles/dataset/Global_Aridity_Index_and_Potential_Evapotranspiration_ET0_Climate_Database_v2/7504448/3 (accessed on 9 February 2021).
  73. Sexton, J.O.; Song, X.-P.; Feng, M.; Noojipady, P.; Anand, A.; Huang, C.; KimGlobal, D.-H.; Collins, K.M.; Channan, S.; DiMiceli, C.; et al. Global 30-m resolution continuous fields of tree cover: Landsat-based rescaling of MODIS vegetation continuous fields with lidar-based estimates of error. Int. J. Digit. Earth 2013, 6, 427–448. [Google Scholar] [CrossRef] [Green Version]
  74. Feng, Y.; Feng, H. TM data retrieval and analysis of Beijing area surface albedo. Sci. Surv. Mapp. 2012, 37, 164–166, (In Chinese with English Abstract). [Google Scholar] [CrossRef] [Green Version]
  75. Liu, Z.; Shao, Q.; Tao, J.; Chi, W. Intra-annual variability of satellite observed surface albedo associated with typical land cover types in China. J. Geog. Sci. 2014, 25, 35–44. [Google Scholar] [CrossRef] [Green Version]
  76. Wang, H.B.; Yao, S.B.; Guo, Y.J.; Zhao, M.J. Spatial and Temperal Evolution of Ecological Carrying Capacity Based on Ecological Footprint-Service Value Approach. Resour. Environ. Yangtze Basin 2018, 27, 2316–2327, (In Chinese with English Abstract). [Google Scholar]
  77. Compilation Team of China’s Biodiversity Situation Research Report. China’s Biodiversity Situation Research Report; China Environmental Science Press: Beijing, China, 1998. [Google Scholar]
  78. Wang, W.J.; Wu, T.; Li, Y.Z.; Zheng, H.; Ouyang, Z.Y. Matching Ecosystem Services Supply and Demand through Land Use Optimization: A Study of the Guangdong-Hong Kong-Macao Megacity. Int. J. Environ. Res. Public Health 2021, 18, 2324. [Google Scholar] [CrossRef] [PubMed]
  79. Ruckelshaus, M.; McKenzie, E.; Tallis, H.; Guerry, A.; Daily, G.; Kareiva, P.; Polasky, S.; Ricketts, T.; Bhagabati, N.; Wood, S.A.; et al. Notes from the field: Lessons learned from using ecosystem service approaches to inform real-world decisions. Ecol. Econ. 2015, 115, 11–21. [Google Scholar] [CrossRef] [Green Version]
Figure 1. The technical route of this study.
Land 11 00698 g001
Figure 2. The land use map of the study area.
Land 11 00698 g002
Figure 3. Supply/demand evaluation and the matching results of supply–demand relationship.
Land 11 00698 g003
Figure 4. Pixel-scale ECC improvement priority distribution.
Land 11 00698 g004
Figure 5. Pixel-scale distribution of priority areas for category-based ECC improvement.
Land 11 00698 g005
Figure 6. The (mis)match of ES supply and demand in subdistrict scale.
Land 11 00698 g006
Figure 7. Subdistrict-scale ECC improvement priority zones (a) Level A; (b) Level B; (c) Level C.
Land 11 00698 g007
Table 1. Data sources.
ItemIndicatorDataType and ResolutionYearData Source
General dataLand use30 m2018Resource and Environment Science and data center; National Catalogue Service for Geographic Information
Green area in the city’s constructed areaVector2018Mapuni (https://www.mapuni.com/)
DEM30 m-ASTER GDEMV2 (Geospatial data cloud)
Gridded population density100 m2018WorldPop (WorldPop and Center for International Earth Science Information Network (CIESIN), 2018) [67]
Statistical data e.g., permanent population, GDP, and rural data.Statistical data2018Beijing Statistical Yearbook for Districts in 2019 (Beijing Municipal Bureau of Statistics, 2019)
NDVI250 m2018MODIS13Q1 [68]
ECCFlood mitigationStorm rainLiterature data 2018http://www.cma.gov.cn/2011xzt/kpbd/rainstorm/2018050901/201805/t20180509_468007.html
Hydrologic soil groups250 m1900–2015[69]
CN valueLiterature data-[70]
Urban roadVector2018OpenStreetMap (http://download.geofabrik.de/asia.html)
Urban housing priceVector2018CEIC database (https://www.ceicdata.com), and Anjuke website (https://www.anjuke.com)
Urban buildingsVector2018https://mp.weixin.qq.com/s/tKXmlTJPT0btrVvqP_iqcQ
Soil retentionMonthly precipitationInterpolated2018http://www.nmic.cn/
Sand, silt, clay, gravel and organic matter content of soil30″2009Harmonized World Soil Database [71]
PLiterature data-[43]
Humidity and temperature regulationPET30″1970–2000Global Aridity Index and Potential Evapotranspiration (ET0) Climate Database v2 [72]
tree-canopy30 m2015https://lcluc.umd.edu/metadata/global-30m-landsat-tree-canopy-version-4 [73]
albedoLiterature dataMultiple years[74,75]
KcLiterature data-[43]
Surface temperature70 m https://ecostress.jpl.nasa.gov
Air purificationAir pollution dataInterpolated2018[76]
Ability of vegetation to purify air pollutantsLiterature data-[44,77]
Carbon sequestrationNPPAbout 500 m2018MODIS17A3HGF006 data [46]
NEP conversion factorLiterature data-http://www.iuems.com/ [49]
VIIRS nighttime lights dataAbout 500 m2018https://eogdata.mines.edu/products/vnl/ [64]
Notes: “-” means not specifically mentioned.
Table 2. Binary code table.
From Left to RightCarbon SequestrationAir PurificationTemperature and Humidity RegulationSoil RetentionFlood Mitigation
The first priority11111
Other priorities00000
Table 3. Statistics on the overlapping of the first priority improvement area in each district.
Number of Types of ES that Are All in First Priority
District0 1 2 3 4 5
Dongcheng0.00%0.52%0.73%8.54%90.20%0.00000%
Xicheng0.00%2.09%0.55%5.84%91.51%0.00000%
Chaoyang4.70%7.46%7.56%14.93%65.34%0.00000%
Fengtai10.91%7.32%9.45%12.25%60.07%0.00000%
Shijingshan19.79%6.99%8.54%8.41%56.27%0.00000%
Haidian24.91%10.92%8.28%9.37%46.53%0.00000%
Mentougou94.09%2.75%0.90%0.95%1.31%0.00000%
Fangshan72.03%14.98%5.55%3.91%3.53%0.00027%
Tongzhou45.97%19.46%11.97%9.12%13.48%0.00000%
Shunyi61.04%17.40%9.22%4.91%7.42%0.00000%
Changping69.05%9.77%5.10%5.03%11.05%0.00000%
Daxing53.27%17.77%8.40%6.44%14.12%0.00000%
Huairou84.29%12.84%1.23%0.73%0.91%0.00000%
Pinggu68.30%24.71%2.94%1.78%2.27%0.00332%
Miyun73.21%24.07%1.32%0.55%0.85%0.00032%
Yanqing87.42%10.39%0.81%0.68%0.71%0.00005%
Beijing Total68.89%14.42%4.19%3.52%8.98%0.00027%
Table 4. Statistical table of the first priority area of each ES carrying capacity improvement in each district.
Flood MitigationSoil RetentionTemperature and Humidity RegulationAir PurificationCarbon Sequestration
DistrictArea(km2) Proportion%Area(km2) Proportion%Area(km2) Proportion%Area(km2) Proportion%Area(km2) Proportion%
Dongcheng38.1390.93%0.000.00%41.4098.74%41.4098.74%41.9399.99%
Xicheng46.3692.05%0.000.00%49.0297.35%49.0297.35%50.3599.98%
Chaoyang337.4672.54%0.000.00%392.2184.31%396.7585.29%402.9586.62%
Fengtai209.7868.56%0.080.03%235.7977.06%256.1183.70%226.1373.90%
Shijingshan48.5657.60%0.000.00%64.5576.56%62.2273.80%56.0166.43%
Haidian252.8758.95%0.000.00%255.5259.57%250.6158.43%277.7364.75%
Mentougou52.353.61%2.730.19%43.693.01%48.273.33%36.042.49%
Fangshan235.4411.78%90.444.53%177.098.86%346.9217.36%187.899.40%
Tongzhou326.4036.09%0.090.01%243.7126.95%276.3930.56%280.9631.07%
Shunyi224.8822.28%8.840.88%156.8415.54%147.0914.57%272.5027.00%
Changping272.0820.25%11.240.84%265.3219.75%241.2417.95%275.0320.47%
Daxing323.5731.29%0.100.01%223.9421.66%256.6324.82%336.9032.58%
Huairou101.814.80%193.449.12%44.902.12%34.471.63%73.463.47%
Pinggu98.1110.35%170.7718.02%55.345.84%56.235.93%46.234.88%
Miyun114.795.16%449.1920.20%50.782.28%29.781.34%62.122.79%
Yanqing120.616.04%109.355.47%41.092.06%42.692.14%23.211.16%
The total of Beijing2803.1817.09%0.000.00%2341.2014.27%2535.8315.46%2607.5315.89%
Table 5. The different characteristics and strategies for different ECC matching zones.
Level ALevel BThe Specific TypeRepresentative AreasStrategies to Improve ECC States
The first priorityQuadruple compound priority promotion zone10111All of Dongcheng, Xicheng, Fengtai District, Chaoyang District except Sunhe and Capital Airport area, the west of Tongzhou District, the north of Daxing District, the urban area of Fangshan District, the east of Shijingshan District, the southern and urban areas of Changping District, the urban area of Yanqing District, Quanhe Subdistrict, etc., in Huairou District, Gulou Subdistrict, etc., in Miyun District, Yuyang Subdistrict etc., in Pinggu District, some streets adjacent to Shijingshan District and Fengtai District in the east of Mentougou District, Houshayu, Nanfaxin, Shunyi District, etc.Flood Mitigation, temperature and humidity regulation, air purification, comprehensive improvement of carbon sequestration, need to carry out flood control and drainage projects, increase vegetation coverage, especially tall trees, reduce pollution emissions, save energy and reduce carbon emissions, etc.
Triple compound priority promotion zone10011Doudian Town in Fangshan District, Songzhuang Town in Tongzhou DistrictFlood mitigation, air purification, comprehensive improvement of carbon sequestration, need to carry out flood control and drainage projects, increase vegetation coverage, reduce pollution emissions, save energy and reduce carbon emissions, etc.
00111Dongfeng, Xiangyang in Fangshan DistrictTemperature and humidity regulation, air purification, comprehensive improvement of carbon sequestration, need to increase vegetation coverage and tall trees planting, save energy and reduce carbon emissions, etc.
10101Miaocheng area in Huairou District, Miyun Town in Miyun DistrictFlood mitigation, temperature and humidity regulation, comprehensive improvement of carbon sequestration, need to carry out flood control and drainage projects, increase vegetation coverage and tall trees planting, save energy and reduce carbon emissions, etc.
Double compound priority promotion zone00101Machikou area in Changping District, Shangzhuang Town in Haidian District, Longquan Town in Mentougou District, Wulituo Subdistrict in Shijingshan DistrictTemperature and humidity regulation, comprehensive improvement of carbon sequestration, need to increase tall trees planting, reduce carbon emissions, etc.
10001Sunhe and Capital Airport area in Chaoyang District, Yinghai area in Daxing District, Wenquan Town in Haidian District, Tanying area in Miyun District, Tianzhu area in Shunyi District, Majuqiao Town and Lucheng Town in Tongzhou DistrictFlood mitigation, comprehensive improvement of carbon sequestration, need to carry out flood control and drainage projects, increase vegetation coverage and reduce carbon emissions, etc.
00110Shilou Town in Fangshan DistrictTemperature and humidity regulation, comprehensive improvement in air purification, need to increase vegetation coverage and tall trees planting, reduce air pollutants emission, etc.
Single priority promotion zone00001Yangfang Town, Nanshao Town, Baishan Town in Changping District, Caiyu Town in Daxing District, Liangxiang area and Changyang Town in Fangshan District, Sujiatuo Town in Haidian District, Beifang Town and Yangsong Town in Huairou District, Daxingzhuang Town in Huairou District, the west and central parts of Shunyi District, Xiji Town in Tongzhou District, etc.Improvement of carbon sequestration, need to increase vegetation coverage and reduce carbon emissions, etc.
00010ChanggouTown in Fangshan DistrictImprovement of air purification, need to increase vegetation coverage, reduce air pollutants emission, etc.
01000The middle of Miyun District, the south of Pinggu DistrictIncrease in soil retention, vegetation coverage, and soil and water conservation measures
10000Mafang area in Pinggu DistrictFlood mitigation, need to increase vegetation coverage and carry out flood control and drainage projects
The second priority--The north of Changping District, most of the central western part of Yanqing District, the south of Huairou District adjacent to Changping District and parts of the north of Huairou District, Tiangezhuang Town and Xiwengzhuang Town in Miyun District, Shandongzhuang Town and Machangying Town in Pinggu District, Dalin Town, Dasungezhuang Town, etc., in Shunyi District, the south of Tongzhou District, Daxing District, Fangshan Distric, etc.To maintain a good economic and ecological coordination, develop ecological economy, improve the functions of natural ecosystems, and at the same time ensure the healthy development of the regional society and economy
The third priority--The west of Fangshan District, the north of Pinggu District, the east and west of Miyun District, the north of Yanqing District and parts of the west of Huairou DistrictTo maintain a good economic and ecological coordination, driving the high-quality development of ecosystem services and social economy in surrounding areas
The last priority--Parts of the north of Fangshan District, most of Mentougou District, the middle and parts of the north of Huairou District, the east of Yanqing DistrictDevelop ecological economy on the premise of protecting the existing high-quality ecosystem service functions appropriately attract the population of the surrounding area, and develop the population development needs of within the area
Publisher’s Note: MDPI stays neutral with regard to jurisdictional claims in published maps and institutional affiliations.

