Abstract
Background: Green spaces reduce the risk of multiple adverse health outcomes by encouraging physical activity. This study examined correlations between urban green space and residents’ health outcomes in hilly neighborhoods: if they are mediated by social cohesion, visual aesthetics, and safety. Methods: We used multiple green space indicators, including normalized difference vegetation index (NDVI) extracted from satellite imagery, green view index (GVI) obtained from street view data using deep learning methods, park availability, and perceived level of greenery. Hilly terrain was assessed by the standard deviation of the elevation to represent variations in slope. Resident health outcomes were quantified by their psychological and physiological health as well as physical activity. Communities were grouped by quartiles of slopes. Then a mediation model was applied, controlling for socio-demographic factors. Results: Residents who perceived higher quality greenery experienced stronger social cohesion, spent more time on physical activity and had better mental health outcomes. The objective greenery indicators were not always associated with physical activity and might have a negative influence with certain terrain. Conclusions: Perceived green space offers an alternative explanation of the effects on physical activity and mental health in hilly neighborhoods. In some circumstances, geographical environment features should be accounted for to determine the association of green space and resident health outcomes.
1. Introduction
There is an increasing interest in researching greenspace’s effect on health [1]. Numerous studies have well recognized the public benefits of green space [2,3,4,5]. First of all, green space as a source of health benefits has an important impact on residents’ behavior of using green space. Urban green spaces, including urban parks, greenbelts, and street trees, benefit residents in terms of recreational exercise and social integration [6]. Secondly, green space can also lower the risk of various adverse health conditions [4,7], improve self-reported overall health status [8], and increase willingness to engage in physical activity [9], all of which yield physical and mental health benefits [10]. Few studies have focused on green space in a residential environment with special geographic terrains. This study aimed to explore the effect of various types of green spaces on health outcomes under the influence of topographic slopes.
Previous findings suggest that exposure to outdoor greenery contributes to higher participation in physical activity, and better health status. However, different types of green spaces may affect the physical and mental health of citizens in different ways [11,12]. Certain reports show that no evidence of clear correlations between green spaces and physical activity has been found [12,13,14,15,16,17]. In particular, the goal of promoting physical activity in hilly communities seems to be a challenge, as sloped land might reduce the desire for walking [18]. Otherwise, areas with more undulating slopes are usually rich in green resources. Therefore, the relationship between green space and physical activity in hilly environments may be distinct from other urban contexts, which requires more exploration.
The novelty of this study was that we analyzed the health benefits of different types of green spaces in a hilly environment by grouping slopes, which contributes to the refinement of research on green space health promotion. The study explored the relationship between green space, physical activity and health outcomes, as well as social cohesion, safety, and aesthetics as mediators. The results showed that objective assessment of indicators of urban greening indicated more significant associations only after controlling for slope. Our research results demonstrated the particularity of using green resources in sloped neighborhoods, indicating more detailed strategies are essential for natural resource utilization in special geographic environments.
2. Literature Review
The relationship between green space and health outcomes varies by different spatial data types and quantification methods [1]. Typically, green space is assessed using the normalized difference vegetation index (NDVI), which quantifies vegetation canopy through analyzing remote sensing data [19]. Compared to the satellite green space measurement methods, NDVI has a moderate correlation with the total amount of green space and trees based on the street landscape [20]. The difference in correlation can be attributed to the fact that green space on the ground is significantly different from satellite-based green space: satellite data of green space cannot show the vertical dimension of green space completely [21].
Recent advancements in deep learning enabled the extraction of streetscape greenery from street view images. Green space in street view images can represent the human perception of the environment. This will help to understand the basic mechanisms that connect green space with people’s behavior and health outcomes [22]. Evidence showed eye-level street greenery could promote walking for transportation and recreational purposes—it improves the view and quality of the built environment in communities [23]. What’s more, it is correlated with physical activity [10] as well as the mental health of the residents [24]. Only at eye level, perception and experience of green space can elicit a physiological response that could help reduce stress [25]. Another common method for calculating green space is to measure the availability or accessibility of the nearest park to places of residence. Positive associations with physical activity are reported using this method of calculation [13,26].
Moreover, the subjective perception of nature was also used to assess greenness exposure [4] and might offer an alternative explanation [16]. A study found that the higher the perceived accessibility of green spaces, the more likely pedestrians are to engage in physical activity [27]. In addition to the well beings of the residents, there are also psychological benefits. Sugiyama et al. used the Neighborhood Environmental Walkability Scale and found a significant relationship between perceived green environments and mental well-being [28]. Furthermore, people who self-reported spending time in nature are often happier [29]. Subjective perceptions of green space are reported to be correlated with better self-reported general health outcomes in general, while outcomes for objective measures have been inconclusive [30]. Perceived greenery may be an even stronger predictor of social cohesion than objective environmental features [31].
However, few studies have explored the relationship between perceptual and objective attributes of public urban green space [5]. The assessments, in many cases, showed inconsistent correlation between the impersonal green index and the human perception of green [24]. For example, one study found a strong relationship between perceived greenness and NDVI values [32], while another disagreed [33]. Both subjective and objective indicators are crucial to fully capture the role of urban green space in quality of life [34].
In addition, social cohesion and social interactions are two major ways to promote a healthier lifestyle [7]. Urban green space may affect the social structure of urban areas [35]. Numerous studies have examined the role of green spaces in promoting social cohesion. The presence of vegetation encouraged greater use of outdoor space, thus increasing the possibility of social interactions [36]. Furthermore, studies have appealed for the importance of the visual aesthetic and environmental benefits of equitably incorporating vegetation into streetscapes [2], as street greenery facilitates the increase of the aesthetic appreciation of urban places [37]. Similarly, the visibility of green vegetation plays an important role in increasing perceived safety [38], which is positively corelated with physical activity [39] and mental health [40]. Few studies have been conducted using the social environment as mediators for the effects of green space on physical activity and health status [9,30,41,42,43]. Even less has been devoted to the effect of urban greenery on physical activity and health, especially in hilly neighborhoods, where steep hillsides may be a physical hindrance to walking [44] and correlated with higher exercise intensity [45].
Furthermore, the impact of slopes on pedestrian activities has not been extensively studied. Studies have shown that increased slope will reduce desire for walking [18]. Slope hinders pedestrian flow [46], because the steep area lack related pedestrian facilities, which exhausts pedestrians more when going uphill, and require extra caution when going downhill [47]. In addition, variation of terrain has also been found to influence the green space indicator—NDVI [48]. On the other hand, sloped walking surfaces have a significant impact on perception and behavior in an urban environment, because topography may block the view and limit the sense of space [49]. Therefore, the relationship between green space and physical activity in hilly environments may be distinct from other urban contexts, which requires more exploration.
Given these considerations, we carried out an empirical study in Dalian in China, a city with hilly terrain. This paper explored the relationship between green space and physical activity as well as health outcomes in hilly communities, which were grouped by the slope at different spatial scales and measured by both perceptually and objectively assessed methods. The uniqueness of this study is that it explored ways of promoting the health benefits of green spaces under the influence of slopes. It first examined the correlations among multiple greenness assessments and the geographical slope under different scales. Then, it explored if green space indicators were directly associated with health outcomes and if green space indicators were indirectly associated with physical activity and health outcomes via mediators (visual aesthetics, safety, and social cohesion), all-controlling for demographic characteristics (Figure 1). Finally, a series of mediation models was applied to test the cross-level relationships between the multiple green space measures and physical activity as well as health status.
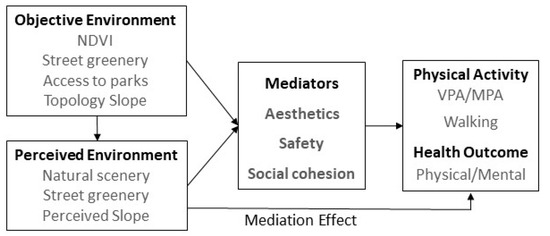
Figure 1.
Conceptual framework.
3. Materials and Methods
3.1. Study Area and Data Collection
We conducted the survey in Dalian, a secondary hilly city in the northeastern coastal region of China (Figure 2). More than half of the residential communities in the urban area are located on different types of slopes. Low hills with an inclination between 5 and 10 degrees are common in urban areas. Due to the slope and the resulted distorted road network, cycling is rarely observed in Dalian, suggesting that the correlation between the hilly environment and residents’ travel behavior may be different from other cities. The geographic scope of this study was limited to urban centers with similar economic backgrounds. The survey data were selected from a community health study conducted in Dalian from July to August 2018( for details of the questionnaire, see [50]). A total of 411 target samples were selected for this study after pre-screening by three criteria. First of all, missing values, outliers, and errors were eliminated. Secondly, those who could not endure a certain duration of physical activity and could not report a qualified dwelling address for geocoding were eliminated. Last but not least, qualified street view images at the community level were obtained for each sample. Qualified images included an eligible time when the street view images were taken, while complete images contained four dimensions. In particular, images captured when trees had few leaves (i.e. were not flourishing as they would be in the summertime) were not eligible; this was identified by the date of the image.
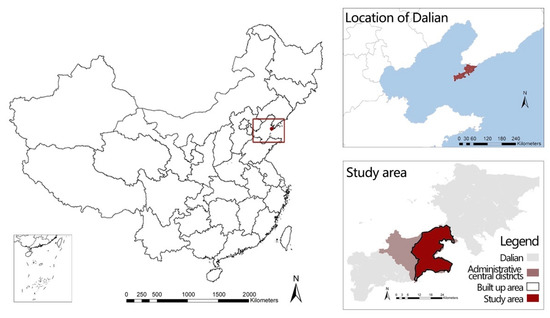
Figure 2.
The location of Dalian and the studied area.
The survey included four sections: general socio-demographic characteristics, individuals’ perception of their neighborhood, participation in physical activity, and health outcomes. The population studied was restricted to individuals aged between 22 and 64 years old and had lived in the area for at least one year. University students aged 18 to 22 years old were not eligible because they tend to live on campus [51]. Participants over 65 years were also excluded due to the lower recommended amount of physical activity [52]. The reliability and validity of the questionnaire were analyzed, including perceived green space, perceived slope, visual aesthetics, safety and social cohesion. Results showed that Cronbach’s alpha value was 0.824, and the KMO value was 0.853. Generally, Cronbach’s alpha value varies from 0 to 1. A Cronbach’s alpha of 0.70 is acceptable, 0.80 is good, and 0.90 or higher is considered very good. A KMO value over 0.5 and a significance level for Bartlett’s test below 0.05 suggest there is a substantial correlation in the data. Thus, the research data were reasonable to be analyzed.
3.2. Green Space
This study characterized green space exposure using four indicators: NDVI, availability of parks, GVI, and perceived streetscape greenery.
3.2.1. Ground-Level Greenness
NDVI was obtained from the USGS Earth Explorer (https://earthexplorer.usgs.gov/, accessed on 04 October 2018) and computed according to the reflectance observed in two bands of the electromagnetic spectrum—near-infrared (band 4) and red (band 3). The calculation of NDVI was as follows:
where, RED and NIR stand for the spectral reflectance measurements acquired in the red (visible) and near-infrared regions, respectively. The closer the index is to 1, the denser the green vegetation; conversely, negative values refer to impervious surfaces.
We generated our NDVI map through zonal statistics as a table. The images were obtained based on the start time of the survey, during which the greenery was uniformly in a summer state. We screened the images covering the survey area, and finally selected the clearest cloud-free picture, that is, the satellite image with a resolution of 30 m × 30 m taken on 16 July 2018.
In addition, this article used the number of parks within a community to represent park availability, as research found that the total number of parks is significantly associated with better mental health [26].
3.2.2. Street-Level Greenness
We assigned GVIs within the participants’ neighborhoods. The GVI in this study measured the greenery along the streets and was computed using Tencent Street View (TSV) images, which were extracted from the Tencent Online Map. We selected sampling locations at 100 m intervals along the road network to generate TSV points, including intersections. Road data were obtained from OpenStreetMap. The coordinates of the TSV-generating points were used to retrieve TSV images through an API in Python. We downloaded four TSV images with a resolution of 480 × 320 pixels at each point, each of which represents a heading (0°, 90°, 180°, and 270°). We eliminated points that did not have an image in each direction.
To extract streetscape greenery objects, we used the DeepLabv3 model [53] to segment the street view images, and the online ADE20K dataset for training purposes [54]. The streetscape greening at each sampling point was determined by the ratio of the sum of the greening pixels in the four images to the total pixels.
3.2.3. Perceived Greenery
Perceived streetscape greenery refers to the number of road verges and natural scenery. Participants’ response to the statement “There are many trees along the streets in my neighborhood” was used for the perceived presence of street trees. The statement “There are attractive natural features in my neighborhood” was used to evaluate the natural scenery on hilly terrain. The response format was a 4-point Likert scale extracted from the abbreviated version of the Neighborhood Environment Walkability Scale.
3.2.4. Spatial Dimensions
The spatial dimensions in this paper contained both neighborhood and city scales, encompassing all the spaces that urban dwellers habitually utilize in their daily routines. Four spatial scales using buffer zones around each participant’s residence were established and geocoded with ArcGIS (ESRI, US) according to the home address. The most common approach to establish scales is applying Euclidean and network buffers on the egocentric neighborhood scale [1]. Most people prefer to walk within a 5 min walking distance, that is, about 400 m [55]. Environmental characters of buffers larger than 400 m have also been linked to walking [55]. The most proper spatial scale to understand the relationship between environment and health remains unclear [56]. Therefore, we used 400 m (a 5 min walk) as the base radius and set up 400, 800, 1200, and 1600 m buffer zones. Accordingly, surrounding greenness was represented by the mean value of green space indicators in buffers, namely, NDVI, numbers of available parks, and GVI.
Additionally, many environmental factors such as topography may cause errors when vegetation indexes were used in areas of rough terrain [57]. Therefore, the topographic slope was added as a reference variable. The variations of the slope within the buffer zone were represented by standard deviation of the elevation. Furthermore, the perceived slope was obtained through a self-reported scale extracted from the Neighborhood Environment Walkability Scale. The question was “The streets in my neighborhood are hilly, making my neighborhood difficult to walk in”, and the response format was a 4-point Likert scale. The data were derived from the National Natural Resources and Geospatial Basic Information Database by the Chinese National Geospatial Information Centre (http://www.sgic.net.cn/web/geo/index.html, accessed on 9 March 2018).
3.3. Health Indicators
3.3.1. Physical Activity
The short, modified version of the International Physical Activity Questionnaire (IPAQ) was used to measure each participant’s total time of walking and physical activity during the past seven days. Participants were asked if they had engaged in at least 10 min of activity in the past seven days, including walking, moderate physical activity (MPA), and/or vigorous physical activity (VPA). Those who replied yes to any of these questions would continue with the questionnaire. Questions inquired the number of days in a week they walked or did moderate/vigorous physical activity, as well as the duration they usually spent on the activities. Response options ranged from 0 to greater than 60 min/week with 15 min intervals. Further, activity frequency values were multiplied by the midpoint of hours reported for given activities (e.g., 30–45 min = 37.5 min), to calculate the overall physical time (min/week).
3.3.2. Self-Reported Health Status
The health outcomes included in the scope of this study consisted of both physical and mental aspects. Participants were asked binary questions to report their physical and mental health status and if they had diabetes or cardiovascular and cerebrovascular diseases.
3.3.3. Mediator Indicators
In this study, social cohesion included three perspectives: social interaction, social engagement and sense of community. Social interaction and social engagement (reflected by the level of variation and participation of activities) were found to be essential for both mental and physical health [58]. Additionally, social cohesion fostered favorable relationships and a perceived sense of belonging [35]. Thus, a sense of community (SoC) was added and indicated by selecting both of the following responses: (1) My neighborhood provides me a sense of community; (2) I would be happy to work with others on improving the living environment in my neighborhood. Here, “neighborhood” was defined as areas within 10 to 15 min walking distance from the subject’s residence. Participants were asked to evaluate their neighborhood on the 4-point Likert scale by responding to statements concerning social environment attributes.
In addition, visual aesthetics and safety were extracted from the shortened Chinese version of the Neighborhood Environmental Walkability Survey (NEWS-A)/(printed in Chinese), which has been proven to be valid and reliable for evaluating Chinese populations [59].
3.3.4. Covariates
Socio-demographic covariates were age, gender, educational attainment, income-level and car ownership. All data were adjusted for demographic covariates as they may confound the associations between dependent and independent variables. According to the results of one-way ANOVA, personal socioeconomic factors also influenced environmental perception (see Appendix A).
3.4. Statistical Analyses
To standardize all data, the Z-scores of all independent variables were calculated. Further, physical activity time was log-transformed due to its skewed distribution.
Data analysis procedures consisted of three steps. First, binary logistic regression was used to examine the effects of different physical activity and health status indicators. As the second step, the correlation test was applied to differentiate the multiple green space indicators and slope among four spatial scales. Finally, a 4-step mediation regression was conducted to determine whether the mediators could partially or fully explain the effects of green space on physical activity and health outcomes.
To elaborate further on the 4-step mediation regression, we first tested the mediation effect with both the objectively-assessed and perceived green space indicators considered as the independent variable and physical activity considered as the dependent variable. The associations between the objectively-assessed and perceived environment, as well as the mediation effects by performing this process were compared and examined. Secondly, the mediation effects controlling for social-demographic variables were examined to determine if any mediation effect was identified in the previous step. In the third step, the corresponding perceived environment attributes as the mediator variable were treated. Finally, the health outcomes were treated as the dependent variable. In the event that an effect was not mediated, the moderation effect was tested. Finally, we performed bootstrap resampling (k = 5000) with 95% bias-corrected confidence intervals to examine the indirect effects
4. Results
4.1. Green Space in Dalian
The vegetation types in Dalian are mainly deciduous broad-leaved forest and coniferous forest. Ground-level greenness is in proportion to the topological elevation (Figure 3 and Figure 4). To be more specific, ground-level vegetation is plentiful in the southwest of the central district, where the human population is sparse. There are lots of apartment buildings on the southeast hillside where greenness is also relatively abundant.
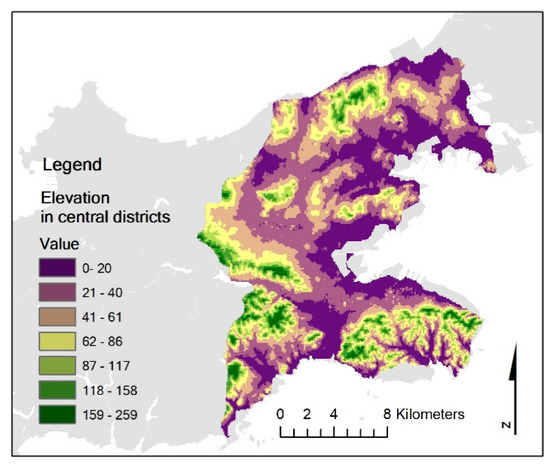
Figure 3.
The slope of terrain in central districts.
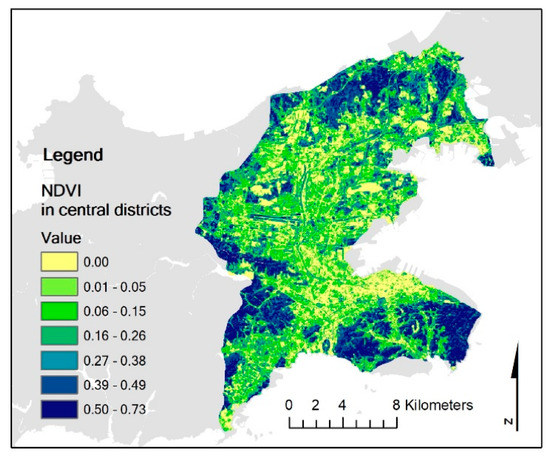
Figure 4.
The NDVI in central districts.
The street-level greenness of different types of roads were averaged (Figure 5). The average green view index of the central road network was 0.17 (SD = 0.14). From Figure 5, we notice that due to hilly terrain, there are many winding roads. Meanwhile, GVI showed no obvious pattern of variation between different types of roads. Moreover, the street greenery was found to be slightly related to the slope of the terrain or NDVI. Regions with higher NDVI also have a greener view.
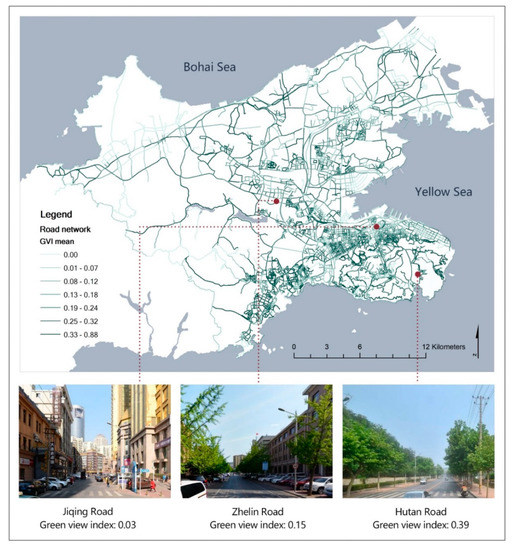
Figure 5.
Tree identification for streetscape design.
4.2. Green Space and Slope
We conducted a crossover Pearson correlation analysis on slopes and three objectively assessed green space indicators (NDVI, GVI, and Park) among different measurement scales. Figure 6 shows the Pearson correlation coefficients with data from four scales (400 m, 800 m, 1200 m, and 1600 m). Generally, slope was found positively correlated to NDVI and GVI, albeit relatively weakly, while some pairs of slope–park were inversely associated. The connections among these measurements varied across employed scales.
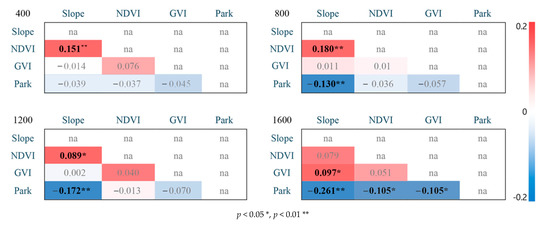
Figure 6.
Correlations of multiple greenery indicators at different scales.
Further, we compared the associations between objectively assessed green space and perceived greenery through Spearman correlation analysis. There was a weak and insignificant yet positive correlation between perceived greenery and GVI. The correlation coefficients were also positive between perceived greenery and NDVI at all scales, but this was not statistically significant.
4.3. Green Space and Health
First, a series of regression analyses were conducted to explore the relationships between indicators of green space and physical activity as well as health outcomes without considering slope (see Appendix B). The findings showed no significant association among all indicators of objectively assessed green space and the total time of physical activity or health outcomes at a 95% confidence interval. Yet, the associations between perceived greenery and dependent variables were all statistically significant. Specifically, perceived greenery (P-greenery) was positively associated with VPA (95% CI = 0.017–0.222), MPA (95% CI = 0.391–0.539) and walking (95% CI = 0.030–0.360). Especially, perceived greenery appeared to have a slightly bigger impact on MPA (adjusted R2 = 0.270) than VPA and walking.
We then grouped the samples by slope according to quartile to examine the relationship between green space and health outcomes under variation of slopes. First, the 47 cases with no slope change were grouped separately at 400 m, and the other samples were divided into four quartile groups. Secondly, on the 800 m scale, all the samples were divided into four groups (Figure 7), in which only one case with no slope change was not listed separately. Descriptive statistics of physical activity in different groups are shown in Figure 7. There was no significant difference in vigorous physical activity in residential areas with different slopes. However, slopes appear to be related to greater moderate physical activity and less walking at the 400 m scale. Changes in physical activity and walking weakened at the 800 m scale.
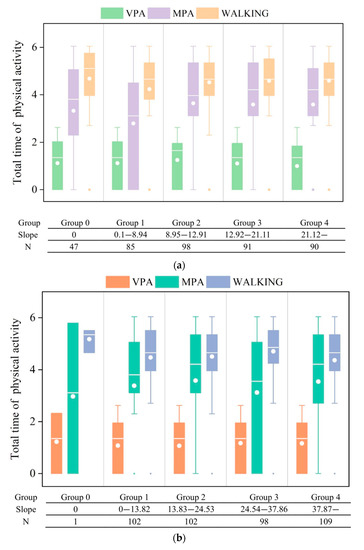
Figure 7.
(a) Descriptive statistics grouped by slope (400 m scale). (b). Descriptive statistics grouped by slope (800 m scale).
Next, we examined the association between green space indicators and physical activity at different spatial scales. In general, there was no obvious trend in correlation. To this end, we then controlled demographic variables as shown in Table 1 and found that personal socioeconomic factors had a greater impact on physical activity and health outcomes than environmental factors. The regression model of green space and physical activity was better explained in a gently sloping environment with a higher R-squared value. In particular, perceived green space had a positive effect on social cohesion under all slope conditions. Specifically, NDVI had a negative effect on VPA in steeply sloped environments at the 400 m scale, while perceived greenery was positively associated with the odds of engaging in VPA in neighborhoods without slopes. When the community range was extended to 800 m, NDVI negatively correlated to VPA on gentle slopes, while GVI promoted vigorous activities in steep slope environments. Further, perceived green space had a positive effect on walking in a variety of slope environments.

Table 1.
The association between green space indicators and physical activity.
4.4. Green Space and Mediators
4.4.1. Correlations between Greenery and Possible Mediators
Table 2 shows the results of regressing greenery on the mediators, including aesthetics, safety, and social cohesion. The most striking observation from the data comparison was that perceived streetscape greenery (combination of trees and natural scenery) was related to all mediators, among which perceived greening had the strongest correlation with visual aesthetics (adjusted R2 = 0.929). However, for objective green space, the association was counterintuitive and insignificant; therefore the correlation coefficient was not shown. Only NDVI was negatively associated with crime safety with low correlation efficiency at the 400 m scale (−0.099, p < 0.05).
Table 2.
The association between green space and mediators.
4.4.2. Correlations between Mediators, Greenery, and Health
Table 3 summarizes the direct, mediating, and total effects of the mediation analyses. It is worth noting that only the significant mediators from Table 2 were included. This study used the Sobel test to determine the mediating effect. A significance test provides statistical evidence that a given independent variable has an indirect effect (i.e., an effect moderated in whole or in part by another variable) on the dependent variable. This result exhibited that there were significant partial mediations of social cohesion on greenery and vigorous physical activity correlations as indicated by the Sobel test. Further, social cohesion mediated the associations between perceived greenery and moderate physical activity. Furthermore, the Sobel test was significant for traffic safety and crime safety on greenery and outcomes. Traffic safety directly mediated the influence of greenery on MPA and walking, while crime safety had a mediation effect only on MPA. The effects of all mediations were quite weak, albeit significant.
Table 3.
Direct, indirect, and total effects of the mediation analyses.
5. Discussion
This paper explored if green space directly or indirectly affects the correlation between greenery and health outcomes via mediators, namely perceived greenery, visual aesthetics, safety and social cohesion. This study was unique because we analyzed the health benefits of different types of green space by grouping based on slope. Results showed that the three objectively assessed indicators (NDVI, GVI, Park) of urban greenery revealed more pronounced associations only after controlling for slope. Street-level green space showed a positive relationship, while NDVI had a negative effect on physical activity. Subjective assessment of greenery was positively correlated with mental health and physical activity. It was also fully or partly mediated by social cohesion and safety.
This is the first study conducted in a high-density hilly environment to explore the relationship between various types of green space within communities and physical activity in an adult population. In agreement with some previous studies, no significant associations were observed between objectively assessed greenness indicators and physical activity without controlling for slope (see Appendix C). For example, previous studies found that the amount of green space [14], ground-level NDVI [60] and green space [15,16,61] showed no relationship with recommended physical activity. Similarly, this applied to green space accessibility [17,62], green space availability [16] and access to parks [11]. In addition, the lack of association between green space and health outcomes is consistent with recent studies [12]. The evidence for an association between green space and health is conflicting in the literature, as physical activity may not be strongly related to greenness [16].
Most importantly, significant associations were found between green space and physical activity when slopes were considered. These results were in accordance with recent studies indicating that eye-level greenery might facilitate walking [22,63,64] or physical activity [10,60]. However, streetscape greenery in this study was found to be relatively weakly correlated with physical activity, which differed from previous studies that observed greater relationships with physical activity [24,43]. The discrepancy is likely due to the disparity of street vegetation type according to clime; the average value of street greenness in the northeast region of China is only half of that of the southern cities, where positive correlations were reported [44]. Another possible explanation is that the positive association between green space and physical activity tended to take visual aesthetics of the environment into account [65], which has also been found to have positive correlations with physical activity in this paper.
However, this study was unable to demonstrate the importance of ground-level greenery on physical activity and health. NDVI showed negative effects under certain slopes, which contradicted an earlier study that found positive associations between ground-level green space and walking [66]. This phenomenon was likely due to the topological slope which contributes to the greener living environment. Nevertheless, slope hinders the density of facilities which significantly correlates with the total time of physical activity [50]. Another possible explanation is that our measurement of green space did not take into account facilities, maintenance, frequency of use, etc., which have positive effects on physical activity [15] or social cohesion [37].
In addition, this study found that people who perceived their neighborhoods as densely vegetated were more likely to have better self-reported mental health than those who gave a poor evaluation of their neighborhood greenness. The positive associations we discovered were consistent with previous studies [28]. Moreover, perceived greenery was positively associated with moderate-intensity physical activity and walking. This was in accordance with previous studies in which subjective measurement was used and perceived greenery’s relation to walking was verified [67,68]. Further, mediation results showed that the perceived streetscape greenery–physical activity correlation was partially mediated by traffic safety and crime safety, while social cohesion fully mediated such correlation. The correlation between greenery and social cohesion was especially consistent with the literature [41], and social cohesion was positively associated with physical activity and health. Otherwise, we did not find any mediation effects of social cohesion between green space and health outcomes, although previous studies demonstrated that the impact of green exercise was mediated by social cohesion rather than directly applying to health [31].
Our study’s strengths were demonstrated by its ability to examine the association between multiple green spaces and physical activity, testing for potential mediators and controlling for slope to explore the benefit of green space under different geographical conditions. Results of this study suggest the importance of perceived greenery and the health benefits of street-level greenness. At the same time, the study also revealed the negative results of NDVI due to the geographical environment. Hilly environments have great scenery that may encourage walking [69], but steep streets often lack infrastructure [47]. Special weather, such as snow and severe heat, can also affect the walking experience on slopes [18]. Thus, detailed design characteristics (street infrastructure, green spaces, sidewalks, etc.) are more reusable in hilly communities that can be optimized by focused design strategies and management. In addition, local governments need to pay special attention to green resources that have not been well used, especially the management and maintenance of NDVI at the ground level. A well-maintained environment and a wide range of outdoor facilities can provide participants with a rich experience, thereby increasing the frequency and duration of residents’ use of green space. In turn, there is great potential for enhancing population health by increasing visits and encouraging the usage of public green space in hilly neighborhoods.
However, limitations do apply to our study. First, physical activity and health outcomes are self-reported, which has the disadvantage of overestimating physical activity. Second, we assumed that residents are physically active only around their homes. The green exercise reported by the respondents did not necessarily occur in the green space near their residences. Self-selection remained an issue. Thus, we focused on central districts, where populations had better access to public social media, while errors were reduced through the sampling method and data cleaning. Third, data on park availability can be better collected by investigating distance or walking time to nearby parks. Future research should be more sophisticated in health index acquisition and green space measurement.
The main implication of our study is that unlike elsewhere, in hilly neighborhoods, participation in physical activity may not be the main mechanism behind the associations between green space and health status. While in other potential mechanisms, the direct effect of perceived greenery on physical and mental health and indirect effect mediated by social cohesion and safety appeared to be a more plausible explanation.
6. Conclusions
This study confirmed that there are positive correlations among the perception of green space, mental health, and physical activity mediated by social cohesion and safety under a unique geographical setting. However, the objectively measured green space did not promote physical activity in all environmental conditions due to the interference of slope. Different measurement methods signify different aspects of greenery, implying different operating mechanisms. Given the complexity of green space in neighborhoods with hilly terrain, we suggest that future work of this nature should aim to identify the influence of more comprehensive natural environments. In addition, the method proposed in this study is not only applicable to a special geographical environment, but also usable for multi-scenario research on green space by controlling other environmental factors. Our findings also extend support for the refinement of urban spatial strategies using green resources for health promotion.
Author Contributions
Conceptualization, P.S. and Y.S.; methodology, P.S. and Y.S.; software, validation, formal analysis, investigation, resources, data curation, P.S.; writing—original draft preparation, P.S.; writing—review and editing, Y.S.; visualization, P.S.; supervision, W.L.; project administration, W.L.; funding acquisition, P.S. All authors have read and agreed to the published version of the manuscript.
Funding
This research was funded by the Fundamental Research Funds for the Central Universities (grant number DUT20RC(3)051).
Informed Consent Statement
Informed consent was obtained from all subjects involved in the study.
Data Availability Statement
Not applicable.
Conflicts of Interest
The authors declare no conflict of interest.
Appendix A
Table A1.
Sociodemographic associations with perceived green space and social cohesion.
Table A1.
Sociodemographic associations with perceived green space and social cohesion.
| Covariates | Natural Scenery | Street Greenery | Social Cohesion | ||||
|---|---|---|---|---|---|---|---|
| Variable(N) | Mean (SD) | F/P | Mean (SD) | F/P | Mean (SD) | F/P | |
| Gender | Male (198) Female (213) | 2.79 (1.005) 2.55 (1.057) | 5.481 0.020 | 3.21 (0.808) 3.10 (0.905) | 1.496 0.222 | 2.90 (0.638) 2.80 (0.585) | 3.027 0.083 |
| Age | 22–32 (197) 33–43 (122) 44–54 (66) 55–65 (26) | 2.66 (1.030) 2.65 (1.105) 2.73 (0.985) 2.45 (0.912) | 0.626 0.680 | 3.18 (0.817) 3.07 (0.916) 3.23 (0.873) 3.14 (0.941) | 0.602 0.699 | 2.81 (0.622) 2.85 (0.623) 2.95 (0.534) 2.82 (0.641) | 1.639 0.148 |
| Income | Low (70) | 2.54 (1.086) | 3.19 (0.873) | 2.93 (0.644) | |||
| Medium-low (112) | 2.58 (1.054) | 2.98 (0.880) | 2.75 (0.595) | ||||
| Medium (86) | 2.55 (1.025) | 2.010 | 3.02 (0.881) | 3.625 | 2.76 (0.634) | 2.089 | |
| Medium-high (46) | 2.83 (0.996) | 0.092 | 3.30 (0.840) | 0.006 | 2.93 (0.580) | 0.081 | |
| High (97) | 2.88 (0.992) | 3.37 (0.786) | 2.93 (0.591) | ||||
| Education | Middle school (7) | 3.14 (1.215) | 3.29 (1.113) | 3.06 (1.124) | |||
| High school (25) | 2.48 (1.085) | 3.00 (1.000) | 3.07 (0.630) | ||||
| Junior college (39) | 2.54 (1.047) | 0.745 | 3.28 (0.759) | 0.644 | 2.88 (0.642) | 1.448 | |
| University (182) | 2.69 (1.037) | 0.562 | 3.11 (0.945) | 0.632 | 2.86 (0.634) | 0.217 | |
| Master or higher (158) | 2.67 (1.025) | 3.19 (0.741) | 2.79 (0.542) | ||||
| Car | None (164) One or more (247) | 2.55 (1.058) 2.74 (1.020) | 3.045 0.082 | 3.13 (0.862) 3.17 (0.861) | 0.135 0.741 | 2.83 (0.621) 2.86 (0.607) | 0.309 0.579 |
The value in bold type is statistically significant.
Appendix B
The association between green space indicators and physical activity at different spatial scales.
Table A2.
The association between green space and physical activity at different spatial scales.
Table A2.
The association between green space and physical activity at different spatial scales.
| Vigorous-PA Coeff. 95%CI | Moderate-PA Coeff. 95%CI | Walking Coeff. 95%CI | ||
|---|---|---|---|---|
| P-greenery | 0.082 * (0.017, 0.222) | 0.465 ** (0.391, 0.539) | 0.114 ** (0.030, 0.360) | |
| Adjusted R2 | 0.004 | 0.2703 | 0.010 | |
| scales | indicators | Coeff. 95%CI | Coeff. 95%CI | Coeff. 95%CI |
| 400 | NDVI | −0.049 (−0.003, 0.001) | 0.067 (−0.001, 0.008) | −0.076 (−0.005, 0.001) |
| GVI | −0.012 (−1.270, 1.008) | 0.027 (−1.725, 3.080) | 0.024 (−1.188, 1.975) | |
| Park | −0.001 (−0.103, 0.101) | −0.044 (−0.310, 0.118) | 0.022 (−0.109, 0.172) | |
| 800 | NDVI | −0.072 (−0.001, 0.000) | 0.034 (−0.001, 0.002) | −0.091 (−0.002, 0.000) |
| GVI | 0.015 (−1.163, 1.585) | 0.032 (−1.936, 3.836) | 0.040 (−1.112, 2.685) | |
| Park | −0.002 (−0.046, 0.044) | −0.092 (−0.185, 0.005) | −0.036 (−0.086, 0.002) | |
| 1200 | NDVI | −0.007 (0.000, 0.000) | −0.007 (−0.001, 0.001) | −0.050 (−0.001, 0.000) |
| GVI | 0.019 (−1.271, 1.898) | 0.015 (−2.813, 3.866) | 0.014 (−1.881, 2.505) | |
| Park | 0.032 (−0.017, 0.034) | −0.010 (−0.059, 0.048) | −0.036 (−0.048, 0.022) | |
| 1600 | NDVI | −0.072 (0.000, 0.000) | −0.034 (−0.001, 0.000) | −0.043 (0.000, 0.000) |
| GVI | 0.022 (−1.478, 2.337) | −0.012 (−4.514, 3.543) | 0.005 (−2.526, 2.772) | |
| Park | −0.034 (−0.004, 0.002) | −0.008 (−0.007, 0.006) | 0.004 (−0.004, 0.004) |
p < 0.05 *, p < 0.01 **. The value in bold type is statistically significant.
Appendix C
Table A3.
The comparison between this study and other studies.
Table A3.
The comparison between this study and other studies.
| Direct Effect | Mediation Effect | ||
|---|---|---|---|
| Positive Relationship | No Relationship | ||
| This study | Street view greenery and physical activity, perceived greenery, and walking when controlling for slopes | Green space and physical activity and mental health | Social cohesion and safety |
| Previous studies | Groud-level NDVI and walking [66], eye-level greenery for walking [22,63] and physical activity [10,60], green space and physical activity [70], perceived greenery for walking [28] and physical activity [67,68], park for PA [13,26] and general health [8] | The amount of green space and physical activity [14], ground-level NDVI for physical activity and mental health [60], green space land use and PA [15,16,61], green space accessibility [17,62] and availability [16] for physical activit, park access for physical activity [11] and BMI [64], longstanding greenery and health [12] | Social cohesion [9,31,43], social contact [30,41], community participation [42] |
References
- Labib, S.M.; Lindley, S.; Huck, J.J. Spatial Dimensions of the Influence of Urban Green-Blue Spaces on Human Health: A Systematic Review. Environ. Res. 2020, 180, 108869. [Google Scholar] [CrossRef] [PubMed]
- Ye, Y.; Richards, D.; Lu, Y.; Song, X.; Zhuang, Y.; Zeng, W.; Zhong, T. Measuring Daily Accessed Street Greenery: A Human-Scale Approach for Informing Better Urban Planning Practices. Landsc. Urban Plan. 2018, 191, 103434. [Google Scholar] [CrossRef]
- Ekkel, E.D.; de Vries, S. Nearby Green Space and Human Health: Evaluating Accessibility Metrics. Landsc. Urban Plan. 2017, 157, 214–220. [Google Scholar] [CrossRef]
- James, P.; Banay, R.F.; Hart, J.E.; Laden, F. A Review of the Health Benefits of Greenness. Curr. Epidemiol. Rep. 2016, 2, 131–142. [Google Scholar] [CrossRef] [PubMed] [Green Version]
- Reyes-Riveros, R.; Altamirano, A.; De La Barrera, F.; Rozas-Vásquez, D.; Vieli, L.; Meli, P. Linking Public Urban Green Spaces and Human Well-Being: A Systematic Review. Urban For. Urban Green. 2021, 61, 127105. [Google Scholar] [CrossRef]
- Wu, J.; Feng, Z.; Peng, Y.; Liu, Q.; He, Q. Neglected Green Street Landscapes: A Re-Evaluation Method of Green Justice. Urban For. Urban Green. 2019, 41, 344–353. [Google Scholar] [CrossRef]
- Hartig, T.; Mitchell, R.; De Vries, S.; Frumkin, H. Nature and Health. Annu. Rev. Public Health 2014, 35, 207–228. [Google Scholar] [CrossRef] [Green Version]
- Maas, J.; Verheij, R.A.; Groenewegen, P.P.; de Vries, S.; Spreeuwenberg, P. Green Space, Urbanity, and Health: How Strong Is the Relation? J. Epidemiol. Community Health 2006, 60, 587–592. [Google Scholar] [CrossRef] [Green Version]
- Van den Berg, M.M.; van Poppel, M.; van Kamp, I.; Ruijsbroek, A.; Triguero-Mas, M.; Gidlow, C.; Nieuwenhuijsen, M.J.; Gražulevičiene, R.; van Mechelen, W.; Kruize, H.; et al. Do Physical Activity, Social Cohesion, and Loneliness Mediate the Association Between Time Spent Visiting Green Space and Mental Health? Environ. Behav. 2019, 51, 144–166. [Google Scholar] [CrossRef]
- Lu, Y. Using Google Street View to Investigate the Association between Street Greenery and Physical Activity. Landsc. Urban Plan. 2018, 191, 103435. [Google Scholar] [CrossRef]
- Klompmaker, J.O.; Hoek, G.; Bloemsma, L.D.; Gehring, U.; Strak, M.; Wijga, A.H.; van den Brink, C.; Brunekreef, B.; Lebret, E.; Janssen, N.A.H. Green Space Definition Affects Associations of Green Space with Overweight and Physical Activity. Environ. Res. 2018, 160, 531–540. [Google Scholar] [CrossRef] [PubMed]
- Picavet, H.S.J.; Milder, I.; Kruize, H.; de Vries, S.; Hermans, T.; Wendel-Vos, W. Greener Living Environment Healthier People? Exploring Green Space, Physical Activity and Health in the Doetinchem Cohort Study. Prev. Med. 2016, 89, 7–14. [Google Scholar] [CrossRef] [PubMed]
- Coombes, E.; Jones, A.P.; Hillsdon, M. The Relationship of Physical Activity and Overweight to Objectively Measured Green Space Accessibility and Use. Soc. Sci. Med. 2010, 70, 816–822. [Google Scholar] [CrossRef] [PubMed] [Green Version]
- Maas, J.; Verheij, R.A.; Spreeuwenberg, P.; Groenewegen, P.P. Physical Activity as a Possible Mechanism behind the Relationship between Green Space and Health: A Multilevel Analysis. BMC Public Health 2008, 8, 206. [Google Scholar] [CrossRef] [Green Version]
- Schipperijn, J.; Bentsen, P.; Troelsen, J.; Toftager, M.; Stigsdotter, U.K. Associations between Physical Activity and Characteristics of Urban Green Space. Urban For. Urban Green. 2013, 12, 109–116. [Google Scholar] [CrossRef]
- Ord, K.; Mitchell, R.; Pearce, J. Is Level of Neighbourhood Green Space Associated with Physical Activity in Green Space? Int. J. Behav. Nutr. Phys. Act. 2013, 10, 127. [Google Scholar] [CrossRef] [Green Version]
- Foster, C.; Hillsdon, M.; Jones, A.; Grundy, C.; Wilkinson, P.; White, M.; Sheehan, B.; Wareham, N.; Thorogood, M. Objective Measures of the Environment and Physical Activity–Results of the Environment and Physical Activity Study in English Adults. J. Phys. Act. Health 2009, 6 (Suppl. S1), S70–S80. [Google Scholar] [CrossRef]
- Meeder, M.; Aebi, T.; Weidmann, U. The Influence of Slope on Walking Activity and the Pedestrian Modal Share. Transp. Res. Procedia 2017, 27, 141–147. [Google Scholar] [CrossRef]
- Markevych, I.; Schoierer, J.; Hartig, T.; Chudnovsky, A.; Hystad, P.; Dzhambov, A.M.; de Vries, S.; Triguero-Mas, M.; Brauer, M.; Nieuwenhuijsen, M.J.; et al. Exploring Pathways Linking Greenspace to Health: Theoretical and Methodological Guidance. Environ. Res. 2017, 158, 301–317. [Google Scholar] [CrossRef]
- Sun, Y.; Wang, X.; Zhu, J.; Chen, L.; Jia, Y.; Lawrence, J.M.; Jiang, L.; Xie, X.; Wu, J. Using Machine Learning to Examine Street Green Space Types at a High Spatial Resolution: Application in Los Angeles County on Socioeconomic Disparities in Exposure. Sci. Total Environ. 2021, 787, 147653. [Google Scholar] [CrossRef]
- Jiang, B.; Deal, B.; Pan, H.Z.; Larsen, L.; Hsieh, C.H.; Chang, C.Y.; Sullivan, W.C. Remotely-Sensed Imagery vs. Eye-Level Photography: Evaluating Associations among Measurements of Tree Cover Density. Landsc. Urban Plan. 2017, 157, 270–281. [Google Scholar] [CrossRef] [Green Version]
- Lu, Y.; Sarkar, C.; Xiao, Y. The Effect of Street-Level Greenery on Walking Behavior: Evidence from Hong Kong. Soc. Sci. Med. 2018, 208, 41–49. [Google Scholar] [CrossRef] [PubMed]
- Nagata, S.; Nakaya, T.; Hanibuchi, T.; Amagasa, S.; Kikuchi, H.; Inoue, S. Objective Scoring of Streetscape Walkability Related to Leisure Walking: Statistical Modeling Approach with Semantic Segmentation of Google Street View Images. Health Place 2020, 66, 102428. [Google Scholar] [CrossRef] [PubMed]
- Helbich, M.; Yao, Y.; Liu, Y.; Zhang, J.; Liu, P.; Wang, R. Using Deep Learning to Examine Street View Green and Blue Spaces and Their Associations with Geriatric Depression in Beijing, China. Environ. Int. 2019, 126, 107–117. [Google Scholar] [CrossRef]
- Ulrich, R.S.; Simons, R.F.; Losito, B.D.; Fiorito, E.; Miles, M.A.; Zelson, M. Stress Recovery during Exposure to Natural and Urban Environments. J. Environ. Psychol. 1991, 11, 201–230. [Google Scholar] [CrossRef]
- Wood, L.; Hooper, P.; Foster, S.; Bull, F. Public Green Spaces and Positive Mental Health—Investigating the Relationship between Access, Quantity and Types of Parks and Mental Wellbeing. Health Place 2017, 48, 63–71. [Google Scholar] [CrossRef] [PubMed]
- Zuniga-Teran, A.A.; Stoker, P.; Gimblett, R.H.; Orr, B.J.; Marsh, S.E.; Guertin, D.P.; Chalfoun, N. V Exploring the Influence of Neighborhood Walkability on the Frequency of Use of Greenspace. Landsc. Urban Plan. 2019, 190, 103609. [Google Scholar] [CrossRef]
- Sugiyama, T.; Leslie, E.; Giles-Corti, B.; Owen, N. Associations of Neighbourhood Greenness with Physical and Mental Health: Do Walking, Social Coherence and Local Social Interaction Explain the Relationships? J. Epidemiol. Community Health 2008, 62, e9. [Google Scholar] [CrossRef] [Green Version]
- White, M.P.; Pahl, S.; Wheeler, B.W.; Depledge, M.H.; Fleming, L.E. Natural Environments and Subjective Wellbeing: Different Types of Exposure Are Associated with Different Aspects of Wellbeing. Health Place 2017, 45, 77–84. [Google Scholar] [CrossRef]
- Dadvand, P.; Bartoll, X.; Basagaña, X.; Dalmau-Bueno, A.; Martinez, D.; Ambros, A.; Cirach, M.; Triguero-Mas, M.; Gascon, M.; Borrell, C.; et al. Green Spaces and General Health: Roles of Mental Health Status, Social Support, and Physical Activity. Environ. Int. 2016, 91, 161–167. [Google Scholar] [CrossRef] [Green Version]
- De Vries, S.; van Dillen, S.M.E.; Groenewegen, P.P.; Spreeuwenberg, P. Streetscape Greenery and Health: Stress, Social Cohesion and Physical Activity as Mediators. Soc. Sci. Med. 2013, 94, 26–33. [Google Scholar] [CrossRef] [PubMed] [Green Version]
- Rhew, I.C.; Vander Stoep, A.; Kearney, A.; Smith, N.L.; Dunbar, M.D. Validation of the Normalized Difference Vegetation Index as a Measure of Neighborhood Greenness. Ann. Epidemiol. 2011, 21, 946–952. [Google Scholar] [CrossRef] [PubMed] [Green Version]
- Leslie, E.; Sugiyama, T.; Ierodiaconou, D.; Kremer, P. Perceived and Objectively Measured Greenness of Neighbourhoods: Are They Measuring the Same Thing? Landsc. Urban Plan. 2010, 95, 28–33. [Google Scholar] [CrossRef]
- Kothencz, G.; Blaschke, T. Urban Parks: Visitors’ Perceptions versus Spatial Indicators. Land Use Policy 2017, 64, 233–244. [Google Scholar] [CrossRef]
- Jennings, V.; Bamkole, O. The Relationship between Social Cohesion and Urban Green Space: An Avenue for Health Promotion. Int. J. Environ. Res. Public Health 2019, 16, 452. [Google Scholar] [CrossRef] [Green Version]
- Wan, C.; Shen, G.Q.; Choi, S. Underlying Relationships between Public Urban Green Spaces and Social Cohesion: A Systematic Literature Review. City Cult. Soc. 2021, 24, 100383. [Google Scholar] [CrossRef]
- Camacho-Cervantes, M.; Schondube, J.E.; Castillo, A.; MacGregor-Fors, I. How Do People Perceive Urban Trees? Assessing Likes and Dislikes in Relation to the Trees of a City. Urban Ecosyst. 2014, 17, 761–773. [Google Scholar] [CrossRef]
- Li, X.; Zhang, C.; Li, W. Does the Visibility of Greenery Increase Perceived Safety in Urban Areas? Evidence from the Place Pulse 1.0 Dataset. Int. J. Geo-Inf. 2015, 4, 1166–1183. [Google Scholar] [CrossRef] [Green Version]
- Wang, R.; Liu, Y.; Lu, Y.; Yuan, Y.; Zhang, J.; Liu, P.; Yao, Y. The Linkage between the Perception of Neighbourhood and Physical Activity in Guangzhou, China: Using Street View Imagery with Deep Learning Techniques. Int. J. Health Geogr. 2019, 18, 18. [Google Scholar] [CrossRef]
- Wang, R.; Yuan, Y.; Liu, Y.; Zhang, J.; Liu, P.; Lu, Y.; Yao, Y. Using Street View Data and Machine Learning to Assess How Perception of Neighborhood Safety Influences Urban Residents’ Mental Health. Health Place 2019, 59, 102186. [Google Scholar] [CrossRef]
- Maas, J.; van Dillen, S.M.E.; Verheij, R.A.; Groenewegen, P.P. Social Contacts as a Possible Mechanism behind the Relation between Green Space and Health. Health Place 2009, 15, 586–595. [Google Scholar] [CrossRef] [PubMed] [Green Version]
- Liu, Y.; Wang, R.; Lu, Y.; Li, Z.; Chen, H.; Cao, M.; Zhang, Y.; Song, Y. Natural Outdoor Environment, Neighbourhood Social Cohesion and Mental Health: Using Multilevel Structural Equation Modelling, Streetscape and Remote-Sensing Metrics. Urban For. Urban Green. 2020, 48, 126576. [Google Scholar] [CrossRef]
- Wang, R.; Helbich, M.; Yao, Y.; Zhang, J.; Liu, P.; Yuan, Y.; Liu, Y. Urban Greenery and Mental Wellbeing in Adults: Cross-Sectional Mediation Analyses on Multiple Pathways across Different Greenery Measures. Environ. Res. 2019, 176, 108535. [Google Scholar] [CrossRef] [PubMed] [Green Version]
- Nguyen, D.M.T.; Lecoultre, V.; Hills, A.P.; Schutz, Y. How Does a Hilly Urban Environment Influence Daily Physical Activity in Obese Individuals? J. Phys. Act. Health 2013, 10, 617–625. [Google Scholar] [CrossRef]
- Villanueva, K.; Knuiman, M.; Koohsari, M.J.; Hickey, S.; Foster, S.; Badland, H.; Nathan, A.; Bull, F.; Giles-Corti, B. People Living in Hilly Residential Areas in Metropolitan Perth Have Less Diabetes: Spurious Association or Important Environmental Determinant? Int. J. Health Geogr. 2013, 12, 59. [Google Scholar] [CrossRef] [Green Version]
- Aghabayk, K.; Parishad, N.; Shiwakoti, N. Investigation on the Impact of Walkways Slope and Pedestrians Physical Characteristics on Pedestrians Normal Walking and Jogging Speeds. Saf. Sci. 2021, 133, 105012. [Google Scholar] [CrossRef]
- Rungta, A.; Sharma, S. Effect of Various Parameters on Pedestrians ’ Characteristics in Hilly Urban Area. J. Adv. Res. Civ. Environ. Eng. 2016, 3, 7–23. [Google Scholar]
- Zhang, H.; Li, P.; Zhou, G.; Zhou, Y. Advances in the Studijes on Topographic Effects of Vegetation Indices. Chin. J. Appl. Ecol. 2018, 29, 669–677. [Google Scholar]
- Greenberg, E.; Natapov, A.; Fisher-Gewirtzman, D. A Physical Effort-Based Model for Pedestrian Movement in Topographic Urban Environments. J. Urban Des. 2020, 25, 86–107. [Google Scholar] [CrossRef]
- Sun, P.; Lu, W.; Song, Y.; Gu, Z. Influences of Built Environment with Hilly Terrain on Physical Activity in Dalian, China: An Analysis of Mediation by Perceptions and Moderation by Social Environment. Int. J. Environ. Res. Public Health 2019, 16, 4900. [Google Scholar] [CrossRef] [Green Version]
- Su, M.; Tan, Y.; Liu, Q.; Ren, Y.; Kawachi, I.; Li, L.; Lv, J. Association between Perceived Urban Built Environment Attributes and Leisure-Time Physical Activity among Adults in Hangzhou, China. Prev. Med. 2014, 66, 60–64. [Google Scholar] [CrossRef] [PubMed] [Green Version]
- WHO. Global Recommendations on Physical Activity for Health; World Health Organization: Geneva, Switzerland, 2010. [Google Scholar]
- Chen, L.; Papandreou, G.; Schroff, F.; Adam, H. Rethinking Atrous Convolution for Semantic Image Segmentation. arXiv 2017, arXiv:1706.05587v3. [Google Scholar]
- Zhou, B.; Zhao, H.; Puig, X.; Fidler, S.; Barriuso, A.; Torralba, A. Scene Parsing through ADE20K Dataset. In Proceedings of the 2017 IEEE Conference on Computer Vision and Pattern Recognition (CVPR), Honolulu, HI, USA, 21–26 July 2017. [Google Scholar]
- Yang, Y.; Diez-Roux, A.V. Walking Distance by Trip Purpose and Population Subgroups. Am. J. Prev. Med. 2012, 43, 11–19. [Google Scholar] [CrossRef] [PubMed] [Green Version]
- James, P.; Berrigan, D.; Hart, J.E.; Hipp, J.A.; Hoehner, C.M.; Kerr, J.; Major, J.M.; Oka, M.; Laden, F. Effects of Buffer Size and Shape on Associations between the Built Environment and Energy Balance. Health Place 2014, 27, 162–170. [Google Scholar] [CrossRef] [PubMed] [Green Version]
- Matsushita, B.; Yang, W.; Chen, J.; Onda, Y.; Qiu, G. Sensitivity of the Enhanced Vegetation Index (EVI) and Normalized Difference Vegetation Index (NDVI) to Topographic Effects: A Case Study in High-Density Cypress Forest. Sensors 2007, 7, 2636–2651. [Google Scholar] [CrossRef] [PubMed] [Green Version]
- De Silva, M.J.; Mckenzie, K.; Harpham, T.; Huttly, S.R.A. Social Capital and Mental Illness: A Systematic Review. J. Epidemiol Community Health 2005, 59, 619–627. [Google Scholar] [CrossRef] [Green Version]
- Cerin, E.; Macfarlane, D.J.; Ko, H.-H.; Chan, K.-C.A. Measuring Perceived Neighbourhood Walkability in Hong Kong. Cities 2007, 24, 209–217. [Google Scholar] [CrossRef]
- Villeneuve, P.J.; Ysseldyk, R.L.; Root, A.; Ambrose, S.; Dimuzio, J.; Kumar, N.; Shehata, M.; Xi, M.; Seed, E.; Li, X.; et al. Comparing the Normalized Difference Vegetation Index with the Google Street View Measure of Vegetation to Assess Associations between Greenness, Walkability, Recreational Physical Activity, and Health in Ottawa, Canada. Int. J. Environ. Res. Public Health 2018, 15, 1719. [Google Scholar] [CrossRef] [Green Version]
- Mytton, O.T.; Townsend, N.; Rutter, H.; Foster, C. Green Space and Physical Activity: An Observational Study Using Health Survey for England Data. Health Place 2012, 18, 1034–1041. [Google Scholar] [CrossRef] [Green Version]
- Hillsdon, M.; Panter, J.; Foster, C.; Jones, A. The Relationship between Access and Quality of Urban Green Space with Population Physical Activity. Public Health 2006, 120, 1127–1132. [Google Scholar] [CrossRef]
- Shanahan, D.F.; Fuller, R.A.; Bush, R.; Lin, B.B.; Gaston, K.J. The Health Benefits of Urban Nature: How Much Do We Need? Bioscience 2015, 65, 476–485. [Google Scholar] [CrossRef] [Green Version]
- Witten, K.; Hiscock, R.; Pearce, J.; Blakely, T. Neighbourhood Access to Open Spaces and the Physical Activity of Residents: A National Study. Prev. Med. 2008, 47, 299–303. [Google Scholar] [CrossRef] [PubMed]
- Sugiyama, T.; Francis, J.; Middleton, N.J.; Owen, N.; Giles-Corti, B. Associations between Recreational Walking and Attractiveness, Size, and Proximity of Neighborhood Open Spaces. Am. J. Public Health 2010, 100, 1752–1757. [Google Scholar] [CrossRef] [PubMed]
- García de Jalón, S.; Chiabai, A.; Quiroga, S.; Suárez, C.; Ščasný, M.; Máca, V.; Zvěřinová, I.; Marques, S.; Craveiro, D.; Taylor, T. The Influence of Urban Greenspaces on People’s Physical Activity: A Population-Based Study in Spain. Landsc. Urban Plan. 2021, 215, 104229. [Google Scholar] [CrossRef]
- Tilt, J.H.; Unfried, T.M.; Roca, B. Using Objective and Subjective Measures of Neighborhood Greenness and Accessible Destinations for Understanding Walking Trips and BMI in Seattle, Washington. Am. J. Health Promot. 2007, 21, 371–379. [Google Scholar] [CrossRef]
- Sugiyama, T.; Giles-Corti, B.; Summers, J.; du Toit, L.; Leslie, E.; Owen, N. Initiating and Maintaining Recreational Walking: A Longitudinal Study on the Influence of Neighborhood Green Space. Prev. Med. 2013, 57, 178–182. [Google Scholar] [CrossRef]
- Abe, T.; Okuyama, K.; Hamano, T.; Takeda, M.; Isomura, M.; Nabika, T. Hilly Environment and Physical Activity among Community-Dwelling Older Adults in Japan: A Cross-Sectional Study. BMJ Open 2020, 10, e033338. [Google Scholar] [CrossRef] [Green Version]
- Sallis, J.F.; Cerin, E.; Conway, T.L.; Adams, M.A.; Frank, L.D.; Pratt, M.; Salvo, D.; Schipperijn, J.; Smith, G.; Cain, K.L.; et al. Physical Activity in Relation to Urban Environments in 14 Cities Worldwide: A Cross-Sectional Study. Lancet 2016, 387, 2207–2217. [Google Scholar] [CrossRef] [Green Version]
Publisher’s Note: MDPI stays neutral with regard to jurisdictional claims in published maps and institutional affiliations. |
© 2022 by the authors. Licensee MDPI, Basel, Switzerland. This article is an open access article distributed under the terms and conditions of the Creative Commons Attribution (CC BY) license (https://creativecommons.org/licenses/by/4.0/).